
Anisotropic silica coating on gold nanorods boosts their potential as SERS sensors†
Sean M.
Meyer
 and
Catherine J.
Murphy
*
and
Catherine J.
Murphy
*
Department of Chemistry, 600. S. Mathews Ave., University of Illinois at Urbana-Champaign, Urbana, Illinois 61801, USA. E-mail: murphycj@illinois.edu
First published on 22nd March 2022
Abstract
Gold nanorods are well-known surface-enhanced Raman scattering substrates. Under longitudinal plasmonic excitation, the ends of the nanorods experience larger local electric fields compared to the sides of the rods, suggesting that Raman-active molecules would be best detected if the molecules could preferentially bind to the ends of the nanorods. Coating the tips of gold nanorods with anionic mesoporous silica caps enabled surface-enhanced Raman scattering (SERS) detection of the cationic dye methylene blue at lower concentrations than observed for the corresponding silica coating of the entire rod. By analyzing the intensity ratio of two Raman active modes of methylene blue and the surface plasmon resonance peak shift of the gold nanorod composites, it can be inferred that at a low concentration of methylene blue, molecules adsorb to the tips of the tip coated silica gold nanorods. Functionalization of the anionic silica endcaps with cationic groups eliminates the SERS enhancement for the cationic methylene blue, demonstrating the electrostatic nature of the adsorption process in this case. These results show that anisotropic silica coatings can concentrate analytes at the tips of gold nanorods for improvements in chemical sensing and diagnostics.
Introduction
Gold nanorods (AuNRs) are plasmonic nanomaterials which possess intense electric fields at their surface under resonant excitation.1 The induced electric fields, in addition to the large absorption and scattering cross sections, are central to their applications in surface-enhanced Raman scattering (SERS) sensors,2 photothermal heaters,3 plasmon-assisted sensors,4–6 plasmon enhanced fluorescence of nearby molecules,7,8 and photocatalysts.9 Their unique anisotropic shape affords two distinct resonant frequencies, with one relating to the length of the rod (longitudinal plasmon) and the other to the width of the rod (transverse plasmon). For an anisotropic shape like a nanorod, the longitudinal plasmon has a significantly larger extinction cross section than the transverse plasmon and this phenomenon results in the tips of the AuNRs exhibiting considerably stronger field enhancements than the sides of the AuNRs under longitudinal excitation.10 The intrinsic hotspots that exist on AuNR tips are the source for much of their efficacy as plasmonic nanomaterials despite constituting a small percentage of their total surface area.2,11,12Because the tips produce a much stronger field enhancement, much attention has been paid to localize analyte molecules at the tips of the AuNRs to exploit the enhanced electric field at the AuNR surface, mainly for SERS and fluorescence enhancement.1,2,10–22 Various methods to direct analyte or probe molecules to the tips of AuNRs such as the utilization of the lower areal density of the surfactant layer on the tips of the AuNRs,14,15 orienting the nanorods in such a way to block the sides from accepting molecules,16,17 and binding supposed “tip” and “side” specific molecules to target the different crystal faces of the nanorod.18,19 While “tip-specific” adsorption is apparently possible, these systems suffer from drawbacks which hinder their applicability: (1) the solution-based measurements and protocols suffer from poor reproducibility because of induced aggregation which non-uniformly creates plasmonic hotspots, (2) fixing dry nanoparticles on the surface of a substrate similarly suffers from non-uniform plasmonic hot spot formation and (3) extensive surface modification could block incoming analytes and make the surface of the AuNRs inaccessible.
Porous silica shells are well-known as a coating material for AuNRs that retains colloidal stability in a biocompatible environment, but still allows for analytes to traverse the mesopores to reach the gold core.23,24 For instance, Gao et al. utilized thick uniform silica shells with 2–3 nm pores around AuNR cores to sense, via SERS, analyte molecules smaller than 2 nm in diameter while maintaining the particles’ colloidal stability.25 Sanz-Ortiz et al. determined that growing sharp golden tips through the pores of the uniform silica shell could be used to enhance adsorbed analyte signals at the tip surface.26 Interestingly, there are many reports of synthesizing anisotropic silica shells where only the tips of the Au nanostructure is coated in porous silica. The concentration of the free surfactant template in the AuNR solution, silica precursor, and other factors such as pH and cosolvent used for the silica precursor, can be exploited to form spherical porous shells isolated just at the tips of the AuNRs while keeping the particles colloidally stable.27–33 Yin et al. performed photodynamic therapy using end-coated AuNRs and utilized lower laser powers to induce high levels of cancer cell death, hypothesizing that the localization of the photoactive molecule towards the active tips of the AuNRs helped improve their efficacy.32 Surprisingly, even though extensive reports of successful anisotropic synthesis exist, to our knowledge, there are limited investigations utilizing these particles in a sensing application.33
In this work, AuNRs were coated with mesoporous silica either all over or specifically on the tips by a template directed hydrolysis-condensation reaction of tetraethyl orthosilicate (TEOS). These substrates were then utilized to monitor overall changes in SERS intensity from the adsorption of a representative molecule with high affinity to silica, methylene blue. In addition, the AuNRs were analyzed via ultraviolet-visible-near infrared extinction spectroscopy (UV-Vis-NIR) to determine the plasmonic peak shift following methylene blue adsorption. These results give a basic framework to both synthesize and utilize end-capped AuNRs for sensing applications and demonstrate their efficacy over completely coated AuNRs for applications that benefit from the enhanced local electric field on the AuNR surface.
Experimental methods
Instrumentation
Transmission electron microscopy (TEM) micrographs were taken using a JEOL LaB6 2010 operating at 200 kV. The ultraviolet-visible near-IR spectra were taken using an Agilent Cary 5000. The dynamic light scattering, and zeta potential measurements were taken using a Malvern Zetasizer. The Raman measurements were all performed with a Delta Nu 785 nm Raman system operating at 120 mW with a 50-micron spot operating with a right-angle setup and optical microscope attachment to view the sample.Chemicals and materials
All chemicals and materials were used as received. Cetyltrimethylammonium bromide (CTAB, >99%), gold chloride trihydrate (HAuCl4·3H2O, >99% trace metals basis), sodium borohydride (NaBH4, >99%), sodium hydroxide (NaOH, >98%), tetraethyl orthosilicate (TEOS, >98%), silver nitrate (AgNO3, >99%), p-hydroquinone (>99%), methylene blue trihydrate (reagent grade), 3-aminopropyltriethoxysilane (APTES, >99%), n-decane (>98%), and methanol (HPLC grade) were purchased from Millipore Sigma. Ethanol, 200-proof, was purchased from Decon Labs. All nanopure water was purified with a Barnstead Nanopure II System (18 MΩ).Synthesis of AuNRs with longitudinal plasmon band maximum at 785 nm
To make AuNRs, a seed-mediated method from Vigderman et al. was used.34 All glassware used was first cleaned with aqua regia (3![[thin space (1/6-em)]](https://www.rsc.org/images/entities/char_2009.gif) :1 concentrated HCl:concentrated HNO3) and rinsed copiously with nanopure water. All seed and rod growth were performed at room temperature of 27 °C. All stocks solutions were made fresh except the CTAB and HAuCl4·3H2O.
:1 concentrated HCl:concentrated HNO3) and rinsed copiously with nanopure water. All seed and rod growth were performed at room temperature of 27 °C. All stocks solutions were made fresh except the CTAB and HAuCl4·3H2O.
First, small CTAB coated gold seeds were synthesized. To do so, 9.5 mL of 0.1 M CTAB was added to a 20 mL scintillation vial equipped with a Teflon coated magnetic stir bar. Then, 0.5 mL of 0.01 M HAuCl4·3H2O was added and allowed to mix evenly with rapid stirring. Next, 10 mL of ice cold 0.01 M NaBH4 was prepared by adding 46 mg of NaBH4 in 0.01 M NaOH and diluting this solution ten-fold in 0.01 M NaOH. With rapid stirring to the gold solution, 0.46 mL of this 0.01 M NaBH4/0.01 M NaOH mixture was added. After 1 minute of stirring, the stir bar was removed, and the seeds were aged for 1 hour at room temperature before use in the next step. To a 500 mL flask, 285 mL of 0.1 M CTAB was combined with 15 mL of 0.01 M HAuCl4·3H2O and 0.42 mL of 0.1 M AgNO3. After gentle agitation by swirling the flask to evenly mix the contents, 15 mL of 0.1 M p-hydroquinone was added and mixed again. 30 seconds after achieving a colorless solution, 4.2 mL of seed solution was added all at once, mixed again, and the flask was covered with Teflon film and allowed to age undisturbed overnight for 16 hours. The next day, the colorful solution was divided amongst 7 × 50 mL centrifuge tubes and centrifuged at 3000 rcf for 30 minutes. The pellets were combined to a total of 35 mL in a new 50 mL centrifuge tube with nanopure water and centrifuged again at 1500 rcf for 30 minutes. After this round of centrifugation, 10 mL of 1 mM CTAB was added to the pellet and transferred to a new 15 mL centrifuge tube.
To remove spherical impurities, depletion induced purification was chosen based on a method from Park et al.35 First, 5 × 50 mL centrifuge tubes were filled with 40 mL of 0.2 M CTAB. Then, 2 mL of the rod solution was added to each tube and mixed well and allowed to sit undisturbed overnight in a 29 °C water bath. The next morning, the gray particulate at the bottom was isolated by removing the pink supernatant and adding 5 mL of nanopure water. The colorful solutions were combined and centrifuged once at 1500 rcf for 30 minutes, then dispersed for long term use in 20 mL 1 mM CTAB. Using an extinction coefficient for rods of this size in the literature at their plasmon band maximum (1.62 × 10¹⁰ M−1 cm−1 at 780–800 nm),36 the particle concentration of the 20 mL stock was found to be 3.8 nM.
Growth of silica shells (full coat) on AuNRs
To grow silica as a full shell on the AuNR's, a procedure adapted from Abadeer et al. was used.8 To start, 10 mL of 1 nM AuNRs was prepared by diluting 2.6 mL of the 3.8 nM rod stock with 1 mM CTAB in a 15 mL centrifuge tube. Then, the solution was centrifuged at 1800 rcf for 20 minutes, after which the supernatant was totally removed, leaving a small pellet in roughly 0.1 mL of solution. To this pellet, nanopure water was added to a total of 10 mL. Then, 100 μL of 0.1 M CTAB was added to the solution and the tube was agitated gently for at least 4 hours to equilibrate with the AuNRs. After this step, 45 μL of 0.1 M NaOH was added and the tube was agitated gently again for 45 minutes. Meanwhile, a solution of 20% (v/v) TEOS in methanol was prepared immediately before use by diluting 0.2 mL of neat TEOS with 0.8 mL methanol. Then, 110 μL of 20% (v/v) TEOS in methanol was added and the solution was sonicated for 30 seconds. The silica shells then grew for 16 hours overnight at room temperature with gentle agitation.To purify the silica-coated AuNRs they were centrifuged at 1600 rcf for 20 minutes and the resulting pellet was dispersed into 10 mL of methanol with sonication. This solution was sonicated for 30 seconds, then heated to 50 °C in a water bath for 10 minutes, and finally sonicated again for 30 seconds before centrifugation at 1500 rcf for 20 minutes. This heating and sonication step, followed by centrifugation, was repeated a total of 5 times, with the last 2 rounds ending with dispersion in 10 mL of ethanol instead of methanol. The particles were stored for long term use in 10 mL of ethanol at this point and are indefinitely stable at room temperature.
Growth of silica shells (end coat) on AuNRs
The growth of end-coated silica shells is based on several procedures. Extremely minute changes in TEOS concentration induces drastic changes in the resulting morphology of the silica shells, so to ensure the end capped particles are formed in high quality, 3 small variations in the TEOS were used to pinpoint the correct parameters. In 3 individual 1.5 mL Eppendorf tubes labelled A, B, and C, 1 mL solution of 1 nM AuNRs in 1 mM CTAB was prepared by diluting the AuNR stock with 1 mM CTAB. Then, these were centrifuged at 1700 rcf for 15 minutes and the supernatant was carefully removed as completely as possible. After removal of the supernatant, 1 mL of nanopure water was added to each tube followed by sonication to disperse the pellet completely. Then 8 μL of 0.1 M CTAB was added to each tube, followed by sonication and equilibration with gentle agitation for 20 hours. The next day a solution of 10% (v/v) TEOS in ethanol was prepared immediately before use by diluting 0.1 mL of neat TEOS with 0.9 mL ethanol. Using this solution 9, 12 or 15 μL was added to A, B, and C, respectively. After 1 hour of gentle agitation at room temperature following the addition of TEOS, 4 μL of 0.1 M NaOH was added to all tubes and allowed to grow overnight for 18 hours under gentle agitation.The next day, the particles were centrifuged at 1200 rcf for 20 minutes, then dispersed into 1 mL pure methanol. Then, these particles were all subjected to the same centrifugation, heating, and sonication steps as for the fully coated silica rods. To do so, the 1 mL of prepared particles were centrifuged at 1400 rcf for 20 minutes and the resulting pellet was dispersed into fresh methanol. Afterwards, they were sonicated at 50 °C for 10 minutes and then centrifuged at 1400 rcf for 20 minutes. The pellet was then dispersed into fresh methanol and the process was repeated a total of 5 times. After the 2nd round, the pellet was dispersed/heated in ethanol. In total, particles were washed 3 times in methanol and 2 times in ethanol, thus ending up dispersed into 1 mL ethanol total. After the washing steps, the particles sat overnight and the small amount of floc that crashed to the bottom of the centrifuge tube was removed by decanting the supernatant into a new tube. The floc was discarded, and the purified supernatant was used for further studies. The highest quality batch was determined via TEM and used for the later experiments.
SERS measurements
To perform the SERS measurements, first the rods were diluted in ethanol to identical optical density at 400 nm and peak extinction at an optical density of ∼1.5. As an example, for the 50 nM methylene blue sample, 200 μL aliquots of the AuNRs with silica were added to a 1.5 mL Eppendorf tube carefully at the bottom to avoid losing solution to the sides of the tube. Then, using a 1.05 μM methylene blue solution in ethanol, 10 μL was added and mixed gently with the tip of the pipette. The aliquots were then placed in the sonicator for 30 seconds then left to sit capped overnight. The synthesized rods were made in 1 mL aliquots, so to ensure enough rods are available for triplicate results, 40 μL of sample were placed in the well of a 384 well plate and then subjected to SERS analysis. Then, SERS measurements were performed by placing the plate under the Raman objective and taking one spectrum per well at 15 seconds integration time. To perform other concentrations of methylene blue, the concentration of the 10 μL aliquot added was changed to adjust for the final total concentration (0 nM, 50 nM, 200 nM, 500 nM, 1 μM, 5 μM, and 20 μM).LSPR shift measurements
The extinction spectrum for each rod type was used to determine the peak wavelength shift following methylene blue adsorption. Using the same samples as in the SERS measurements, 70 μL aliquots were removed from the SERS samples and were transferred to a micro-cuvette. This micro-cuvette was used to take the extinction spectrum from 760–820 nm with 0.1 second integration time at 0.2 nm intervals.Large-pore silica and APTES modification
Large-pore silica was synthesized from a method by Kang et al.37 which utilizes the swelling of the CTAB micellar template by dispersing a small quantity of a non-aqueous phase within the micelles. The resulting expanded micelles should lead to an increase in pore size to ∼6 nm.38 First, an aqueous solution of 1.5 mM CTAB and 1.5 mM decane was prepared. To do so, in a 100 mL volumetric flask, 36.4 mg of powder CTAB was added followed by the dropwise addition of neat decane using a 100 μL pipette to add 21.3 mg (29.2 μL) of decane to the powdered CTAB. Then, the flask was filled with nanopure water to 100 mL and put into a water bath at 50 °C then equipped with a Teflon coated stir bar to gently stir for 1 hour. After complete dissolution of the powder and decane, the solution was poured into two 50 mL centrifuge tubes and sonicated for 1 hour. The emulsion is stable above 27 °C indefinitely.To grow the large-pore silica on the surface of the AuNRs, 10 mL of 0.2 nM AuNRs was prepared in 1 mM CTAB in a 15 mL centrifuge tube. Then, the particles were centrifuged at 1600 rcf for 20 minutes and the supernatant was completely removed. Afterwards, 10 mL of the CTAB/decane solution was added, followed by 5 minutes of sonication and overnight agitation at room temperature. After equilibration, 30 μL of 0.1 M NaOH was added, followed by 10 minutes of sonication. Then, 40 μL of 20% TEOS in methanol was added, followed by 30 seconds of sonication and overnight incubation at room temperature. The particles were first centrifuged at 1300 rcf for 20 minutes, then the pellet was dispersed into pure methanol. Then, the tube was heated to 50 °C and sonicated for 5 minutes. Following this, the rods were centrifuged again, and the pellet was re-dispersed into 10 mL of methanol. This heating, sonication, and centrifugation were repeated 5 times total. After the 2nd round, the pellet was dispersed into 10 mL of ethanol for the rest of the cleaning cycles. The rods were eventually stored in 2 mL of ethanol after the last cycle of cleaning.
The large-pore silica AuNRs were functionalized with 3-APTES. First, 1 mL of rod solution was added to a 1.5 mL centrifuge tube and heated to 50 °C in a water bath. Meanwhile, 1% APTES (v/v) in ethanol was prepared by adding 10 μL of neat APTES to 1 mL of ethanol. The tube containing the particles was then immersed in a sonication bath at 50 °C and, during sonication, 20 μL of the APTES solution was added. Following 30 seconds of sonication, the tube was then put back into the 50 °C water bath to functionalize. After 30 minutes, the rods were sonicated again for 30 seconds and returned to the 50 °C bath. They were then allowed to sit at 50 °C overnight for 16 hours. The next day, they were sonicated for 30 seconds then centrifuged at 1700 rcf for 15 minutes and re-dispersed into pure ethanol. This was repeated 4×. Finally, after the fourth centrifugation cycle, the particles were concentrated into 500 μL of ethanol for later use. The particles were then characterized via TEM, UV-Vis-NIR extinction, and zeta potential.
Results and discussion
Anisotropic chemistry on anisotropic nanomaterials is a grand challenge in the field of colloid science.39,40 The ability to chemically functionalize colloidal nanomaterials at defined positions with sub-nm resolution enables improved assembly of these structures as well as improved functionality.It is well-known that upon longitudinal plasmon band excitation, the local electric field is concentrated at the tips of gold nanorods, enabling surface-enhanced Raman scattering (SERS) of molecules (Fig. 1A).41,42 In principle, if molecules could preferentially bind strictly to the ends of gold nanorods instead of uniformly coating the nanorods, the detection limit would be lowered by a factor of ∼3–4 at a minimum, consistent with the decreased surface area required for binding (Fig. 1B). Thus, in this work, gold nanorods were coating with mesoporous silica uniformly (AuNR@Full) or anisotropically on the ends (AuNR@End).
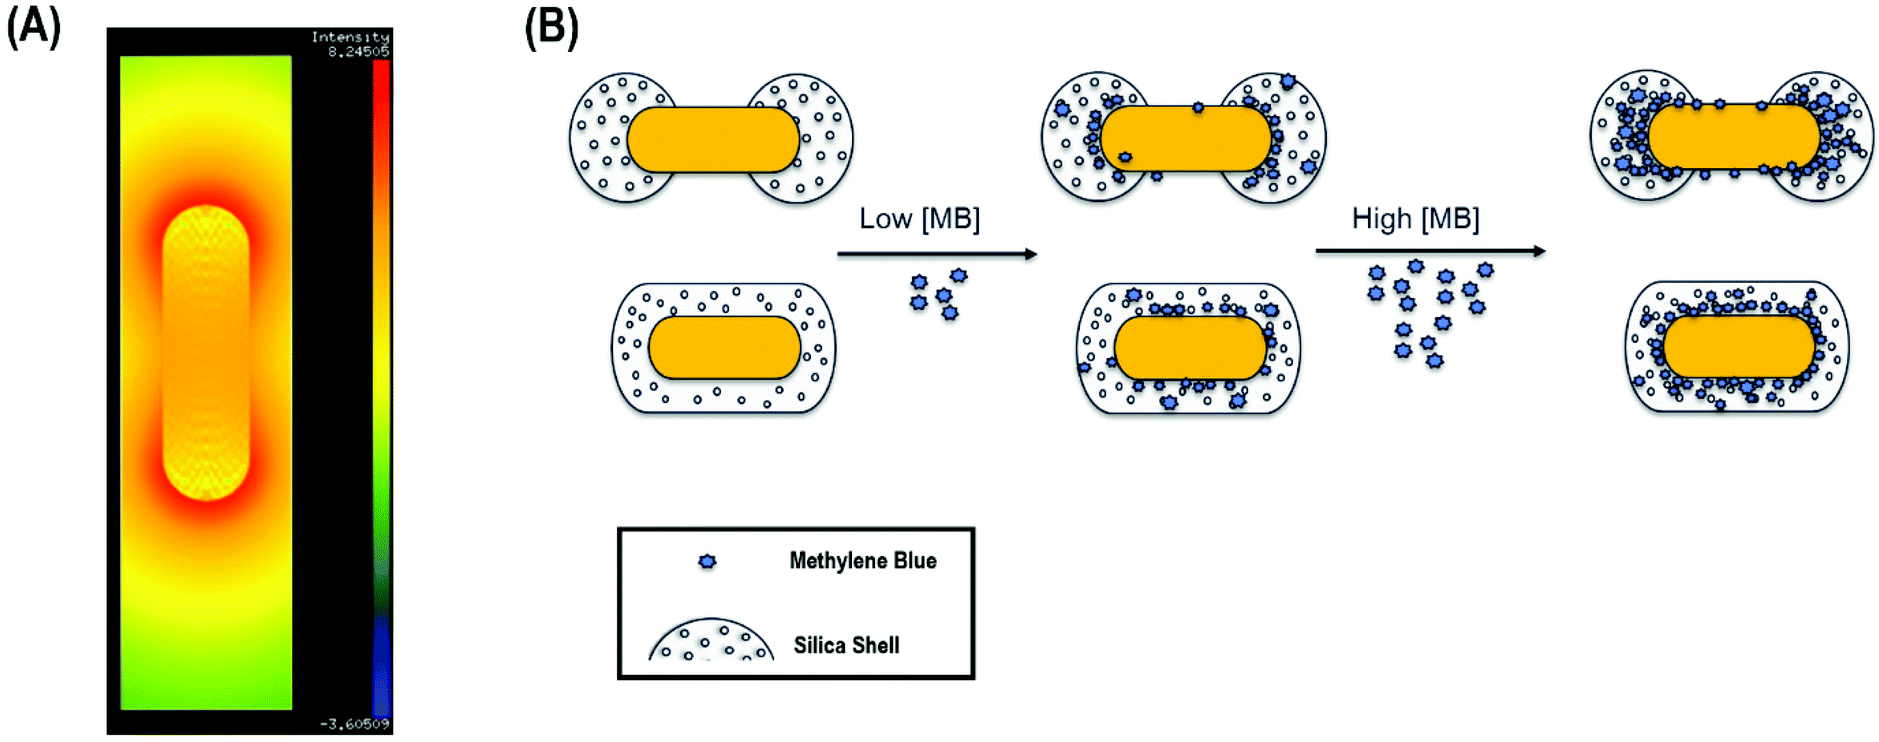 | ||
| Fig. 1 (A) Logarithmically scaled electric field intensity map for the gold nanorods under excitation at the longitudinal plasmon band maximum. The map was made using nanoDDSCAT. The intensity was calculated assuming a solvent refractive index of 1.33, and the dipole spacing was set to 1.5 dipoles per nanometer. Red corresponds to the most intense electric field, blue the least. (B) Scheme of methylene blue (MB) adsorption to silica for the end-capped silica AuNRs vs. the fully coated AuNRs. | ||
First, AuNRs exhibiting longitudinal plasmon bands at ∼785 nm, a common laser wavelength, were synthesized using a well-known technique from Zubarev and coworkers.34 The dimensions of the AuNRs were 81.4 ± 7.6 nm in length and 24.0 ± 2.3 nm in width, and they had an average aspect ratio of 3.4 ± 0.5. Their extinction spectra in water and a representative TEM micrograph of the rods are shown in Fig. 2A and B, respectively. The as-prepared rods were coated with cetyltrimethylammonium bromide (CTAB) from the synthesis and were subsequently subjected to a silica coating procedure based on several reports.8,27,33 The porous silica shell is a result of a hydrolysis and condensation reaction involving tetraethyl orthosilicate (TEOS). The CTAB acts as a soft template to direct growth on the surface of the AuNRs by attracting negatively-charged silica precursors in solution to its positively-charged trimethylammonium headgroup. This reaction occurs in basic aqueous conditions and at room temperature making them simple, yet effective means to control the silica shell growth on AuNRs. The CTAB layer has a lower density on the tips of the AuNRs43 which is a result of the increased curvature in this region, allowing careful control of the CTAB and TEOS concentrations to produce shells of porous silica that either fully encapsulate the AuNRs, or grow strictly at the tips.
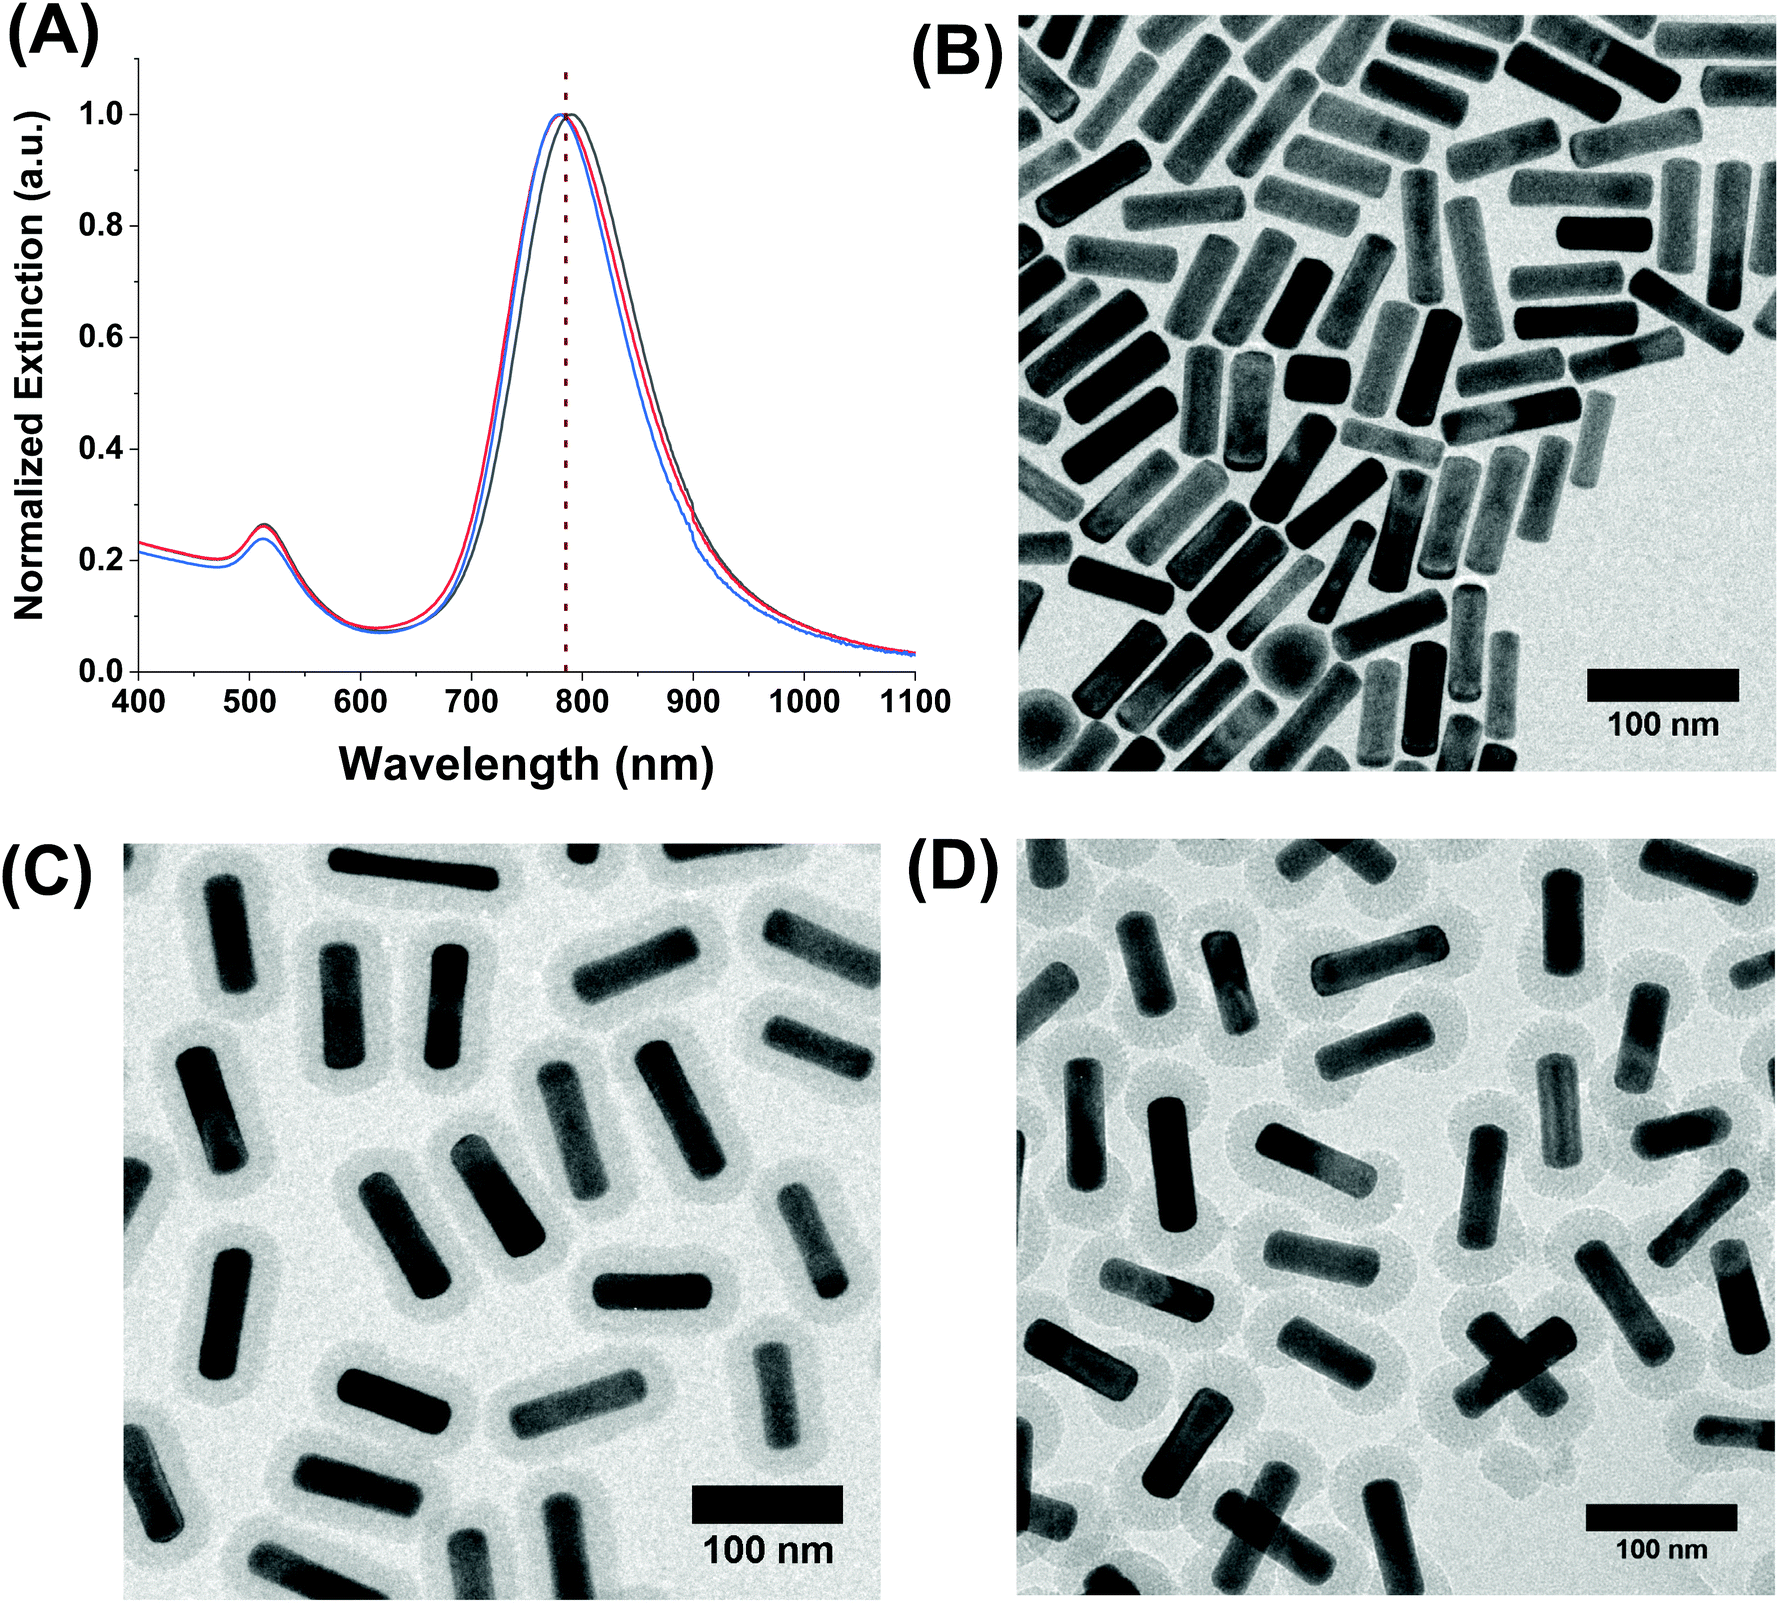 | ||
| Fig. 2 (A) UV-Vis-NIR extinction spectra of the CTAB-coated gold nanorods in water (black), full-shell silica-coated gold nanorods in ethanol (red), and end-shell silica-coated gold nanorods (blue) in ethanol. The dashed line denotes 785 nm (the laser excitation wavelength). TEM micrographs of the (B) CTAB coated, (C) AuNR@Full, and (D) AuNR@End rods, respectively. All scale bars are 100 nm. | ||
Utilizing these principles, AuNRs with both types of shells were synthesized, and characterization data are presented in Fig. 2C and D. The AuNR@Full and AuNR@End have similar average mesoporous silica shell thicknesses of 18.7 ± 1.3 nm and 21.5 ± 2.4 nm, respectively; thus, analyte molecules must traverse the porous channels to reach the core to be sensed on the tips. For the AuNR@End, 80% of the total rods counted in the TEM measurements had no silica on the sides and only on the tips. The porous shells were still filled with CTAB following the synthesis, so a sonication and heating procedure was performed to release excess CTAB from the pores.44 The LSPR maximum of the AuNR@Full and AuNR@End in ethanol were blue-shifted in comparison to the CTAB coated AuNRs in water. As shown by Rowe et al.,27 the blue shift is further indication of removal of the CTAB template from the silica pores because the presence of CTAB molecules themselves should induce a strong red shift in the plasmon band maximum. The zeta potential values of each of the AuNR composites in ethanol following purification were −18.4 ± 2.0 mV and −25.3 ± 3.0 mV for the AuNR@Full and AuNR@End, respectively. The extinction spectra of each rod show they are colloidally stable and experience a small plasmonic shift as silica is added to the AuNR from the change in refractive index. The AuNR@Full are more red-shifted than the AuNR@End because the complete shell induces refractive index changes over the entire rod as opposed to just at the tips which is expected based on previous reports.45 The pores are roughly 3 nm in diameter, and serve as a convenient way to introduce analytes to the gold surface.25,26,37 The representative analyte, methylene blue, has an optical transition at ∼650 nm which is far from the excitation wavelength of 785 nm, and is a well-known Raman scatterer. Moreover, methylene blue is a cation, and thus should be electrostatically attracted to the anionic silica surface that are terminated in surface hydroxyl and silanol groups.46–48 According to the literature, as well as plotting in Avogadro (data not shown), the methylene blue molecule is less than 1.3 nm long and ∼0.5 nm wide assuming a flat orientation, and therefore should fit easily into the silica pore channels.49,50
The SERS measurements were performed in ethanol using identical concentrations of full- and end-modified AuNRs based on matching the extinction at 400 nm. Exposing the CTAB-coated AuNRs to large quantities of methylene blue or ethanol resulted in extreme aggregation, leading to uncontrolled and irreproducible SERS spectra, so these were not used in the experiments. The intense extinction at 785 nm for both the AuNR@Full and AuNR@End means that the use of an internal standard is required to effectively compare the different concentrations. The strong absorptive properties of AuNRs suggests that Raman-scattered light can be extinguished by other AuNRs in colloidal solution. Therefore, we use a relatively low optical density AuNR solutions in ethanol for the experiments; ethanol has an intense Raman signal at ∼880 cm−1 that serves as an internal standard.51 The methylene blue was added in small increments to analyze both cases where the AuNR surface should be incompletely coated (<1 μM) and saturated (>1 μM) with methylene blue.52
The SERS spectra of methylene blue for both the AuNR@Full and AuNR@End substrates in colloidal solution are shown in Fig. 3A and B respectively. The most intense peaks in the SERS spectra for methylene blue are listed in Table 1 and are based on multiple literature reports.53–58 There is a strong peak around 500 cm−1 which arises from the same molecular mode as the strongest peak at 447 cm−1; this 500 cm−1 peak was not used in the analysis. The peaks present in the blank spectra are from the ethanol only, and the value at 883 cm−1 is used to normalize the intensity values in Fig. 4. Importantly, both rod types share their most intense peaks with one another, meaning the adsorption of the molecule is by identical means in both cases: the methylene blue molecule is likely interacting with the AuNR via the nitrogen atoms in the ring and pendant ethyl ammonium groups.53,58
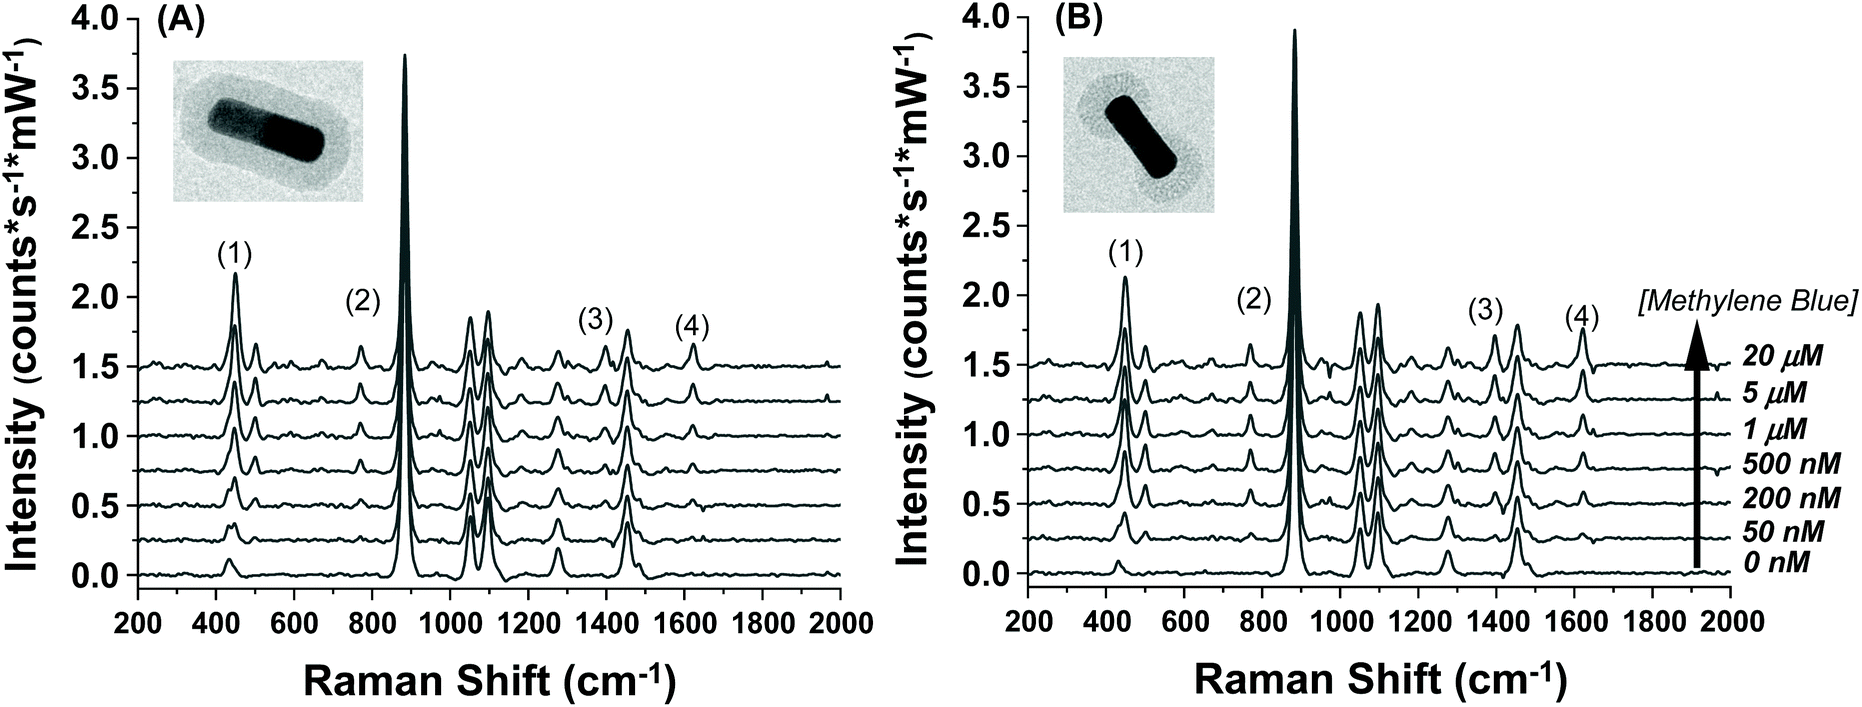 | ||
| Fig. 3 Raman spectra taken for increasing methylene blue concentrations for the (A) full silica and (B) end silica coated gold nanorods. The spectra are offset for clarity. The large peak at 883 cm−1 is the ethanol solvent peak. The methylene blue concentration range was from 0–20 μM. The numbers in the spectra correspond to the peak # in Table 1. | ||
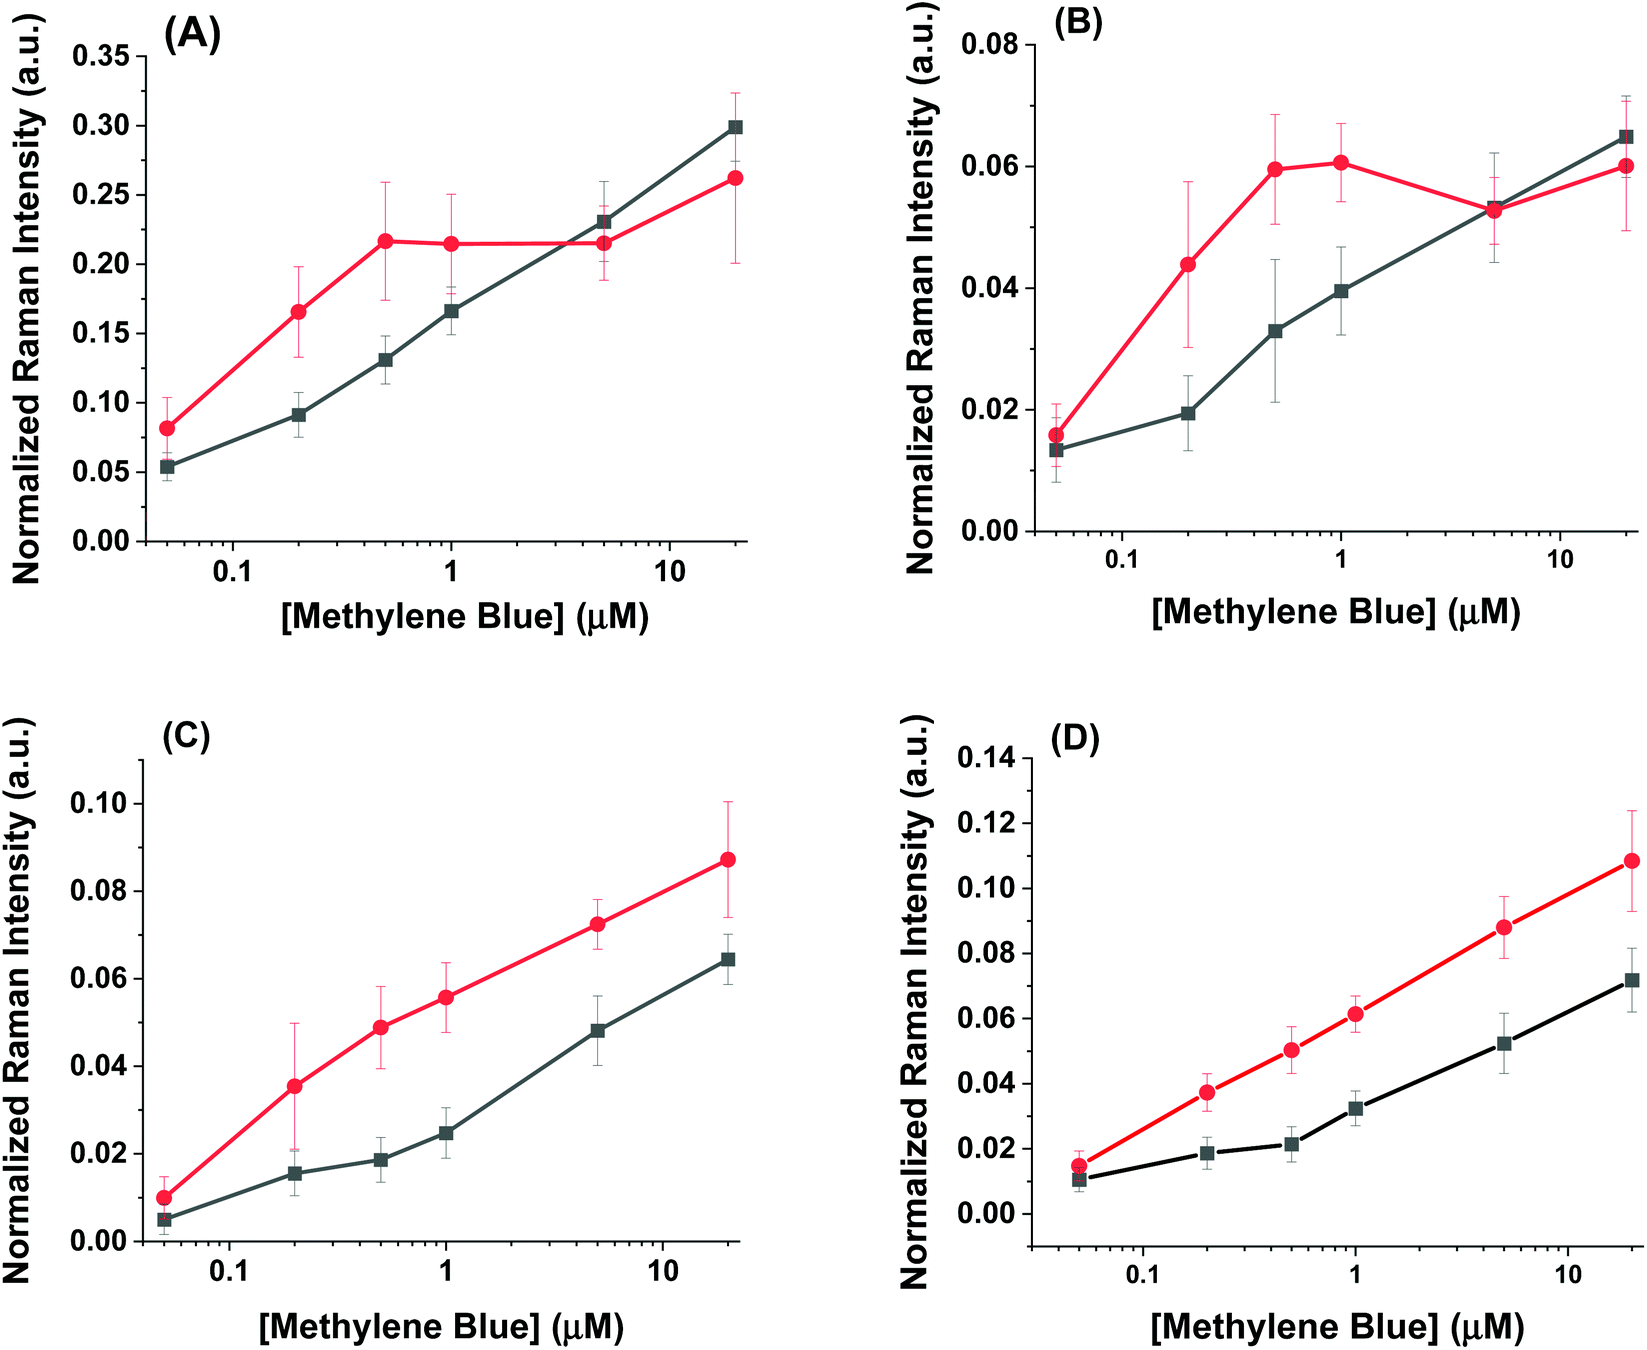 | ||
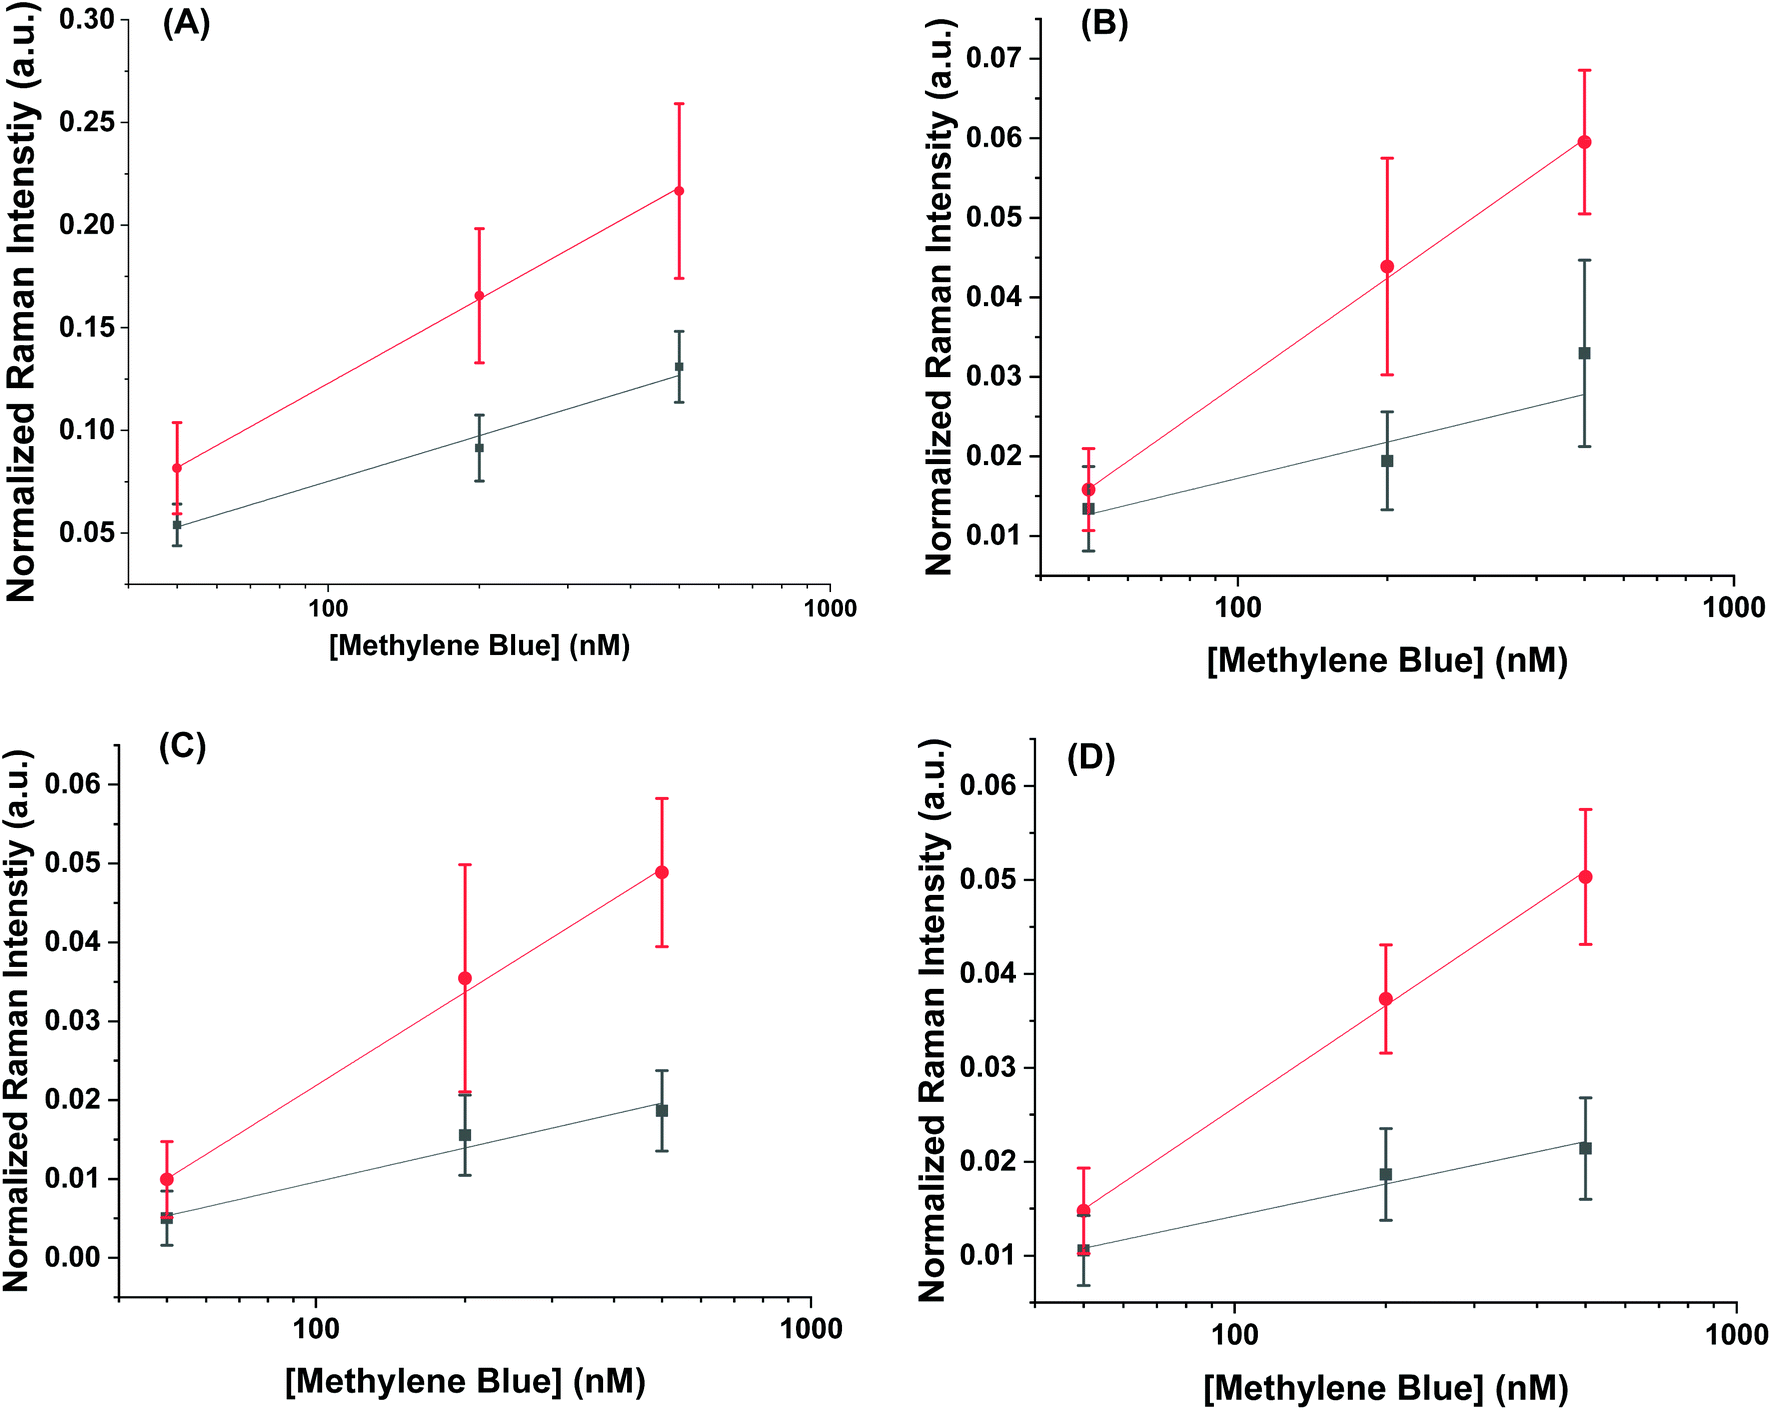
| Fig. 4 Normalized intensity of different methylene blue Raman peaks relative to internal ethanol Raman peaks for (A) 447 cm−1 (B) 770 cm−1 (C) 1390 cm−1 (D) 1620 cm−1. The AuNR@Full and the AuNR@End colloidal substrates are shown in black and red, respectively. | ||
| Peak # | Peak position (cm−1) | Peak assignment |
|---|---|---|
| 1 | 447 | C–N–C deformation |
| 2 | 770 | C–H in-plane bending |
| 3 | 1390 | C–N symmetric stretch |
| 4 | 1620 | C![[double bond, length as m-dash]](https://www.rsc.org/images/entities/char_e001.gif) C in plane stretch C in plane stretch |
The intensity profiles shown in Fig. 4A–D give a strong indication of how the methylene blue is adsorbed to the AuNR composites. At very low concentrations (between 0–1 μM), the SERS intensity of the AuNR@End particles is significantly greater than that of the AuNR@Full particles (red vs. black data). Every major peak in the case of AuNR@Ends exhibit a SERS intensity at 1 μM that the AuNR@Full particles require 10–20 μM to achieve. The strong electrostatic affinity methylene blue has towards silica is the dominant factor to concentrate analyte at the tips, and at low methylene blue concentration, before the surface coverage is 100% the SERS intensity should always be higher for the AuNR@End. Eventually, the methylene blue concentration is high enough to fully saturate the AuNR surface and the SERS intensities become comparable for both cases.
Using the concentration range between 50–500 nM, the limit of detection could be determined for the AuNR systems (Fig. 5). The limit of detection was found by fitting a logarithmic equation to the concentration points between 50–500 nM for the MB at each peak and solving for the concentration needed to induce an intensity equal to the blank value at 447 cm−1 plus three standard deviations. Table 2 shows the calculated limits of detection for each peak for the different cases. In all cases, the AuNR@End show lower limits of detection. In the case of the peak at 447 cm−1 there is a minimal difference but comparing the other peaks at 770 cm−1, 1390 cm−1, and 1620 cm−1 there is a difference of two to four-fold depending on the peak. While the limit of detection difference is not negligible, the major difference in efficacy between these particles lies in the higher concentration regimes where the intensity difference becomes much greater. This supports the hypothesis that at low concentration of analyte the analyte is concentrated at the tips in the AuNR@End which causes the methylene blue to experience a stronger electric field thus lowering the overall limit of detection.
 | ||
| Fig. 5 The signal profile from 50–500 nM for the peaks at (A) 447 cm−1 (B) 770 cm−1 (C) 1390 cm−1 and (D) 1620 cm−1 for the AuNR@Full (black) and the AuNR@Ends (red). These points are fitted to a logarithmic equation and the slope was extracted to determine which concentration causes the SERS intensity to be higher than the intensity with no methylene blue added plus 3 standard deviations. | ||
| Mode (cm−1) | LoD for AuNR@Full (nM) | LoD for AuNR@End (nM) |
|---|---|---|
| 447 | 26 | 21 |
| 770 | 240 | 58 |
| 1390 | 290 | 53 |
| 1620 | 120 | 54 |
To better understand how the molecules are oriented with respect to the AuNR surface, it is possible to use the intensity ratios between SERS peaks. An important mechanism in SERS is surface selection rules: different modes in a molecule will experience varying degrees of electromagnetic enhancement depending on if the tensor of the Raman active mode is aligned with the electric field.59,60 Therefore, the electromagnetic field resonating perpendicularly from the AuNR surface aligns more strongly with Raman modes whose tensors are perpendicular to the AuNR surface. The relative angle between the direction of the electric field from the AuNR and the direction of the Raman tensor of the molecule can affect the intensity of specific Raman modes. Despite the fact the sides of the rod have much lower field enhancement than the tips, they still have some field enhancement at the longitudinal SPR wavelength and provide more surface area for analytes. This will still give a strong SERS signal that will be convoluted with the signal from the tips and can be used to analyze this phenomenon.
The mode at 447 cm−1 which arises from the out of plane deformation of the C–N–C bond in the pendant ethyl ammonium group is strongly dependent on this angle, whereas the mode at 1620 cm−1, which belongs to the in-plane CC stretch, is not affected by changes in the relative angle to the Au surface.56,57 Changes in the ratio between these two peaks indicates whether the molecule is situated more perpendicular or parallel to the surface, and is shown in Fig. 6. A smaller ratio indicates a more parallel-like orientation, and a larger ratio would indicate a more perpendicular orientation.61Fig. 6 shows the ratio between their normalized intensity. Over the entire concentration range of methylene blue the AuNR@Full exhibits a relatively constant ratio of the intensities at 447 cm−1:1620 cm−1, suggesting that the molecules are at roughly the same angle from the AuNR surface. This should be expected for a uniformly coated AuNR surface. The AuNR@End has a downward trend, indicating that as more molecules are added, they begin exhibit more parallel-like orientations with respect to the gold surface. The lack of a mesoporous silica shell in the middle of the rod means there are fewer restrictions on how a molecule may sit with respect to the surface and allow for a variety of side-on and end-on molecular orientations. This data further backs up the notion that analytes are initially directed to the tips for the AuNR@End at low methylene blue concentrations, and as more is added they eventually will coat the entire nanorod. In the case for AuNR@Full, analytes approach the rod indiscriminately due to the affinity for the entire rod, rather than just the tips. Interestingly, the molecular mode at 1620 cm−1 associated with the parallel electric component with respect to the gold surface have higher limits of detection and are therefore enhanced less as the peak at 447 cm−1, which serves as further evidence to the adsorption scheme pointed out from Fig. 6.
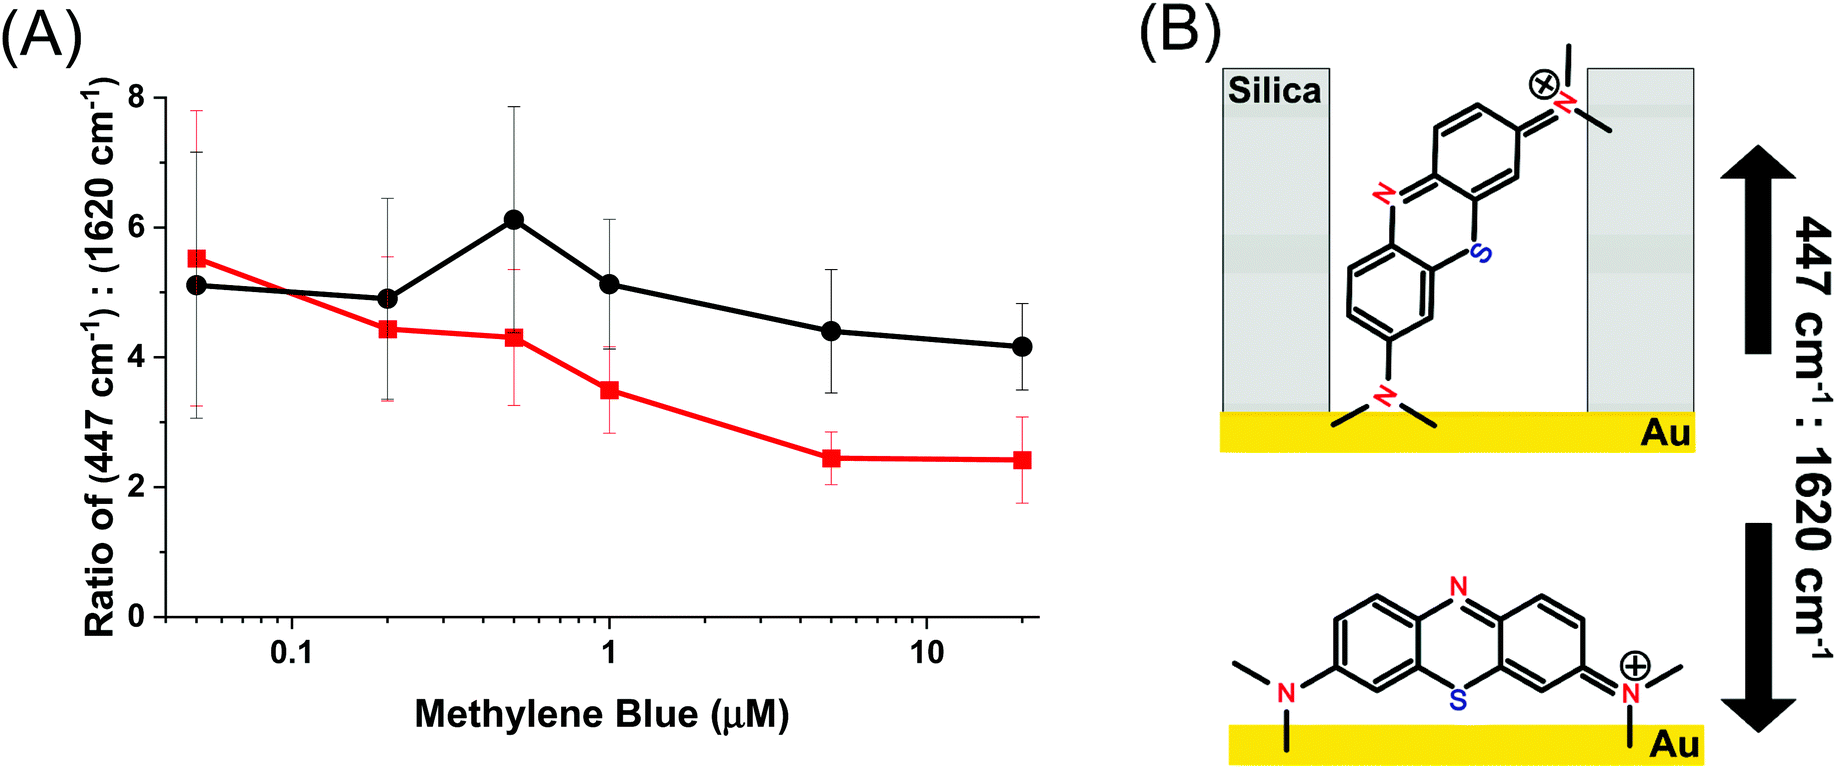 | ||
| Fig. 6 (A) The ratio of the peaks at 447 cm−1:1620 cm−1 for full silica (black) and end coated (red) AuNRs following exposure to varying amount of methylene blue. (B) A representation of the molecular orientation when the analyte is (top) in a pore and (bottom) not in a pore. The yellow represents the gold surface and the gray background represent the silica/pore channels. | ||
Another property of AuNRs is the sensitivity of their plasmon band positions to changes in the local environment.1,5,6 Changes in the refractive index around the AuNR induces plasmonic wavelength shifts directly related to several factors, as shown in eqn (1), and can be used to infer how the analytes are positioned on the AuNR surface.61
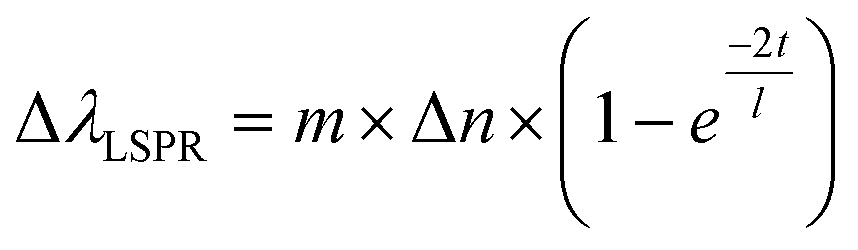 | (1) |
To compare the AuNR@Full and the AuNR@End particles with respect to LSPR shifts as a function of analyte adsorption, it is important only to examine possible differences between the value for m and Δn because the molecules will be identical, and as shown previously in Fig. 6, they apparently adopt the same orientation with respect to the gold surface in the low concentration range. The thickness of the molecular layer will be the same, and while the field decay distance is longer for the tips, the methylene blue must get very close to the gold surface which mitigates the effect of this difference. The LSPR shift results for the AuNRs are shown in Fig. 7. The AuNR@End case at low concentrations (50 nM to 1 μM) have larger LSPR peak shifts than does the AuNR@Full. The stronger electric field at the tip of the AuNR increases the value of m in eqn (1) compared to the side, therefore if analytes are direct to the tips initially a stronger peak shift should occur.6,61 At higher concentrations once the methylene blue begins to saturate the entire AuNR@End surface by coating the sides and filling the pores of the silica shell, a larger refractive index change between the bare gold and the methylene blue equates to a large jump in the peak shift. In conjunction with the SERS evidence that for the peaks at 447 cm−1 and 770 cm−1 the intensity reaches a maximum for the AuNR@Ends at ∼500 nM, beyond which adding more analytes does not change the signal. Therefore, we infer the tips produce most of the SERS signal. In support of this notion, the SERS signals acquired at 500 nM for the AuNR@End is similar to the signals for the AuNR@Full once the surface is saturated. This data reinforces the notion that methylene blue is directed to the tips of the AuNRs in the low concentration range and inevitably covers the entire particle.
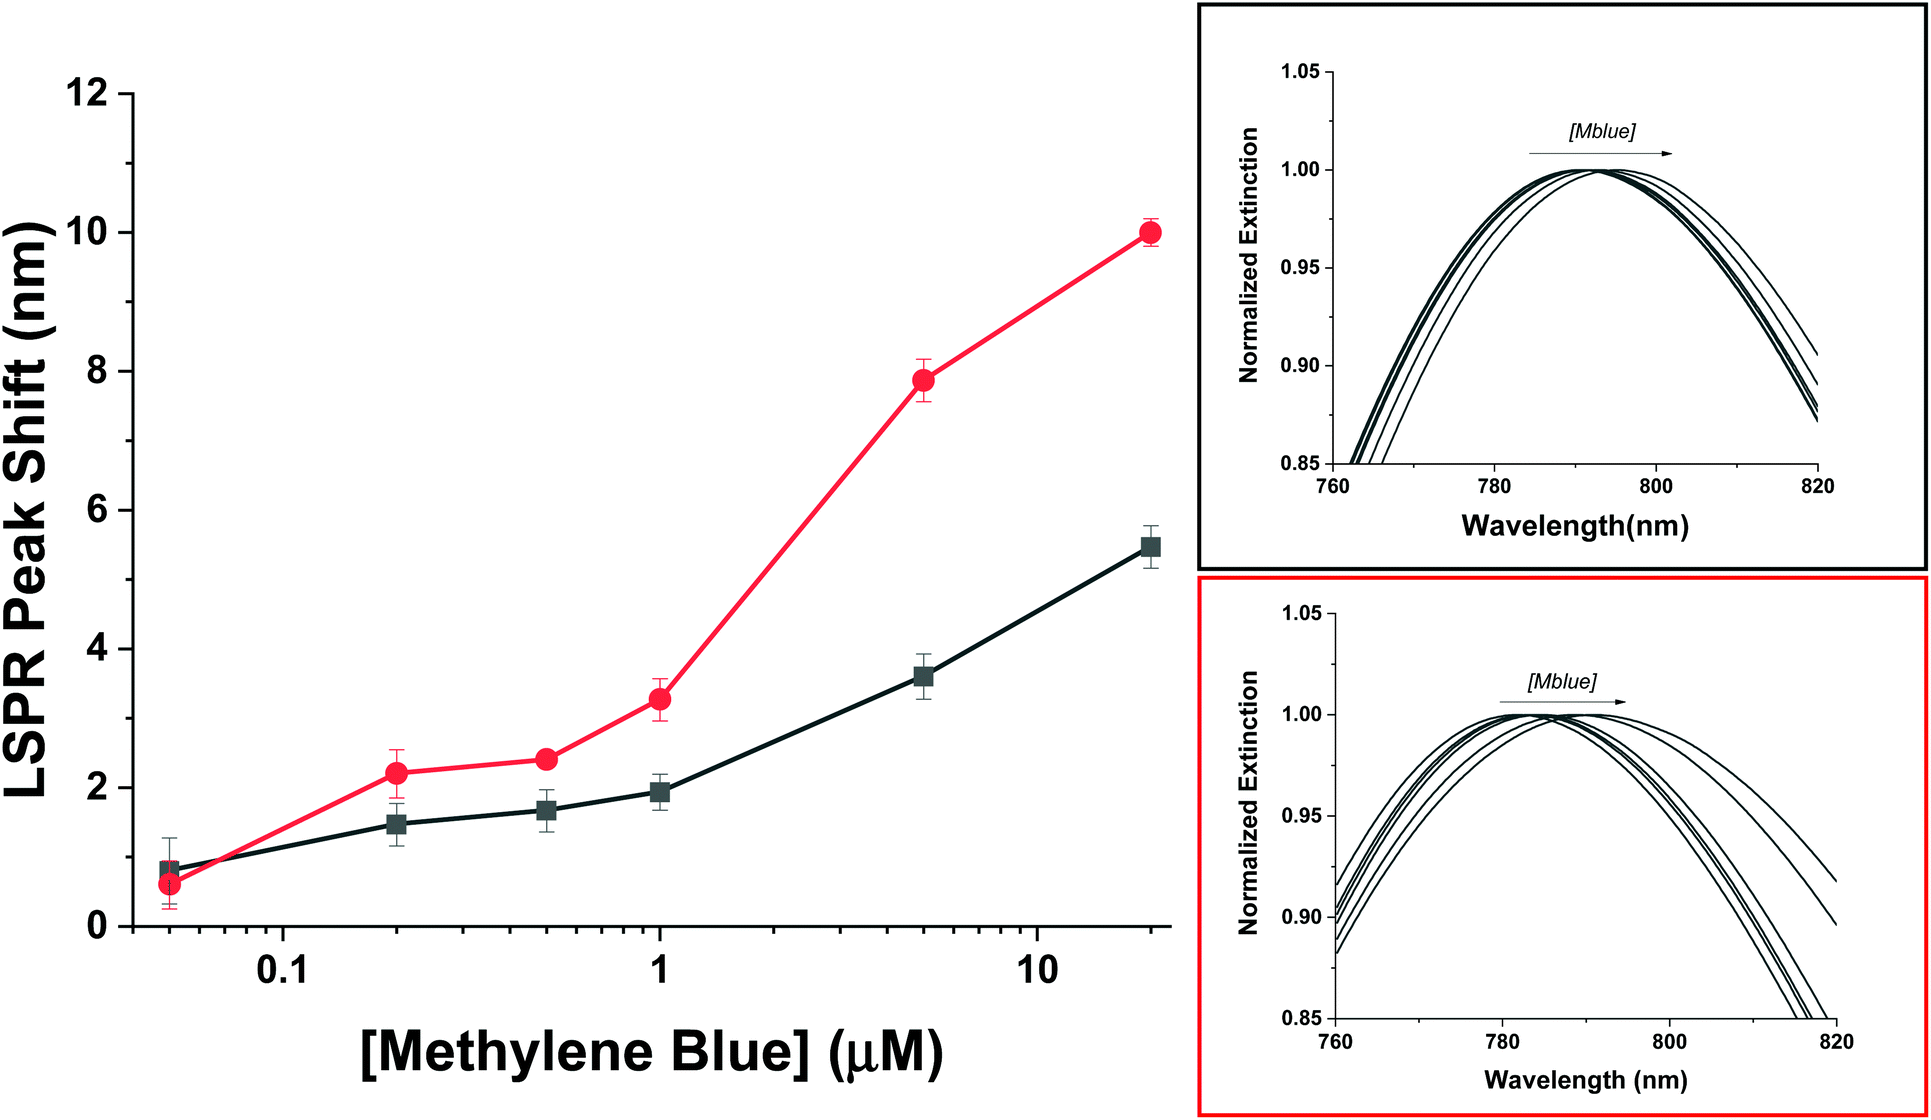 | ||
| Fig. 7 The LSPR wavelength shift of the full silica (black) and end coated (red) AuNRs following exposure to varying amount of methylene blue. | ||
Finally, to demonstrate an additional handle to control analyte adsorption, AuNR@Full were synthesized with larger pores and coated with cationic 3-aminopropyltriethoxysilane (3-APTES) and exposed to a methylene blue at varying concentration (Fig. 8A). Attempts to functionalize the AuNR@End induced strong agglomeration, making colloidal stability a problem, so the AuNR@Full were used. The hypothesis under consideration was that for cationic, filled pores, the cationic analyte would not be able to access the gold nanorod surface and therefore SERS signals would be greatly reduced. The literature method used notes a clear expansion of the pores via TEM which we observe as well (Fig. S1†),37 and Egger et al. mentions the increase in size of decane-swelled CTAB micelles should be 6–12 nm, which results in larger pores in a resulting porous silica nanoparticle.38 Additionally, this increase in pore size compensates for the volume decrease of the pore channels as a result of functionalization with 3-APTES, such that methylene blue molecules can still reach the gold core. The AuNRs used were 93.5 ± 9.3 nm by 31.6 ± 4.0 nm in length and width, respectively. 3-APTES is a positively charged silane group capable of attaching to the surface of the silica inducing a strong positive charge to the AuNR@Full, shifting their zeta-potential value to 31.1 ± 1.4 mV. If the same concentration of AuNRs is subjected to methylene blue, it required more than 5 μM to reach a signal above the limit of detection (Fig. 8B and C), or rather, a measured Raman intensity that was greater than the instrument response with no analyte added and three standard deviations added. Interestingly, the SERS signature is different as well. There is now a strong peak at ∼240 cm−1, and 655 cm−1 which correspond to Au–N or Au–S stretch and the C–S–C deformation mode, respectively.47,54 The major peaks relating to the C–N–C mode are absent as well, which indicates a different conformation is required for the methylene blue to enter the silica pore and the molecule sits with the sulfur containing group directed towards the surface. This evidence supports the notion that electrostatics govern this analyte–SERS substrate interaction, and modification of the porous membrane can be used to control which types of molecules can access the AuNR surface.
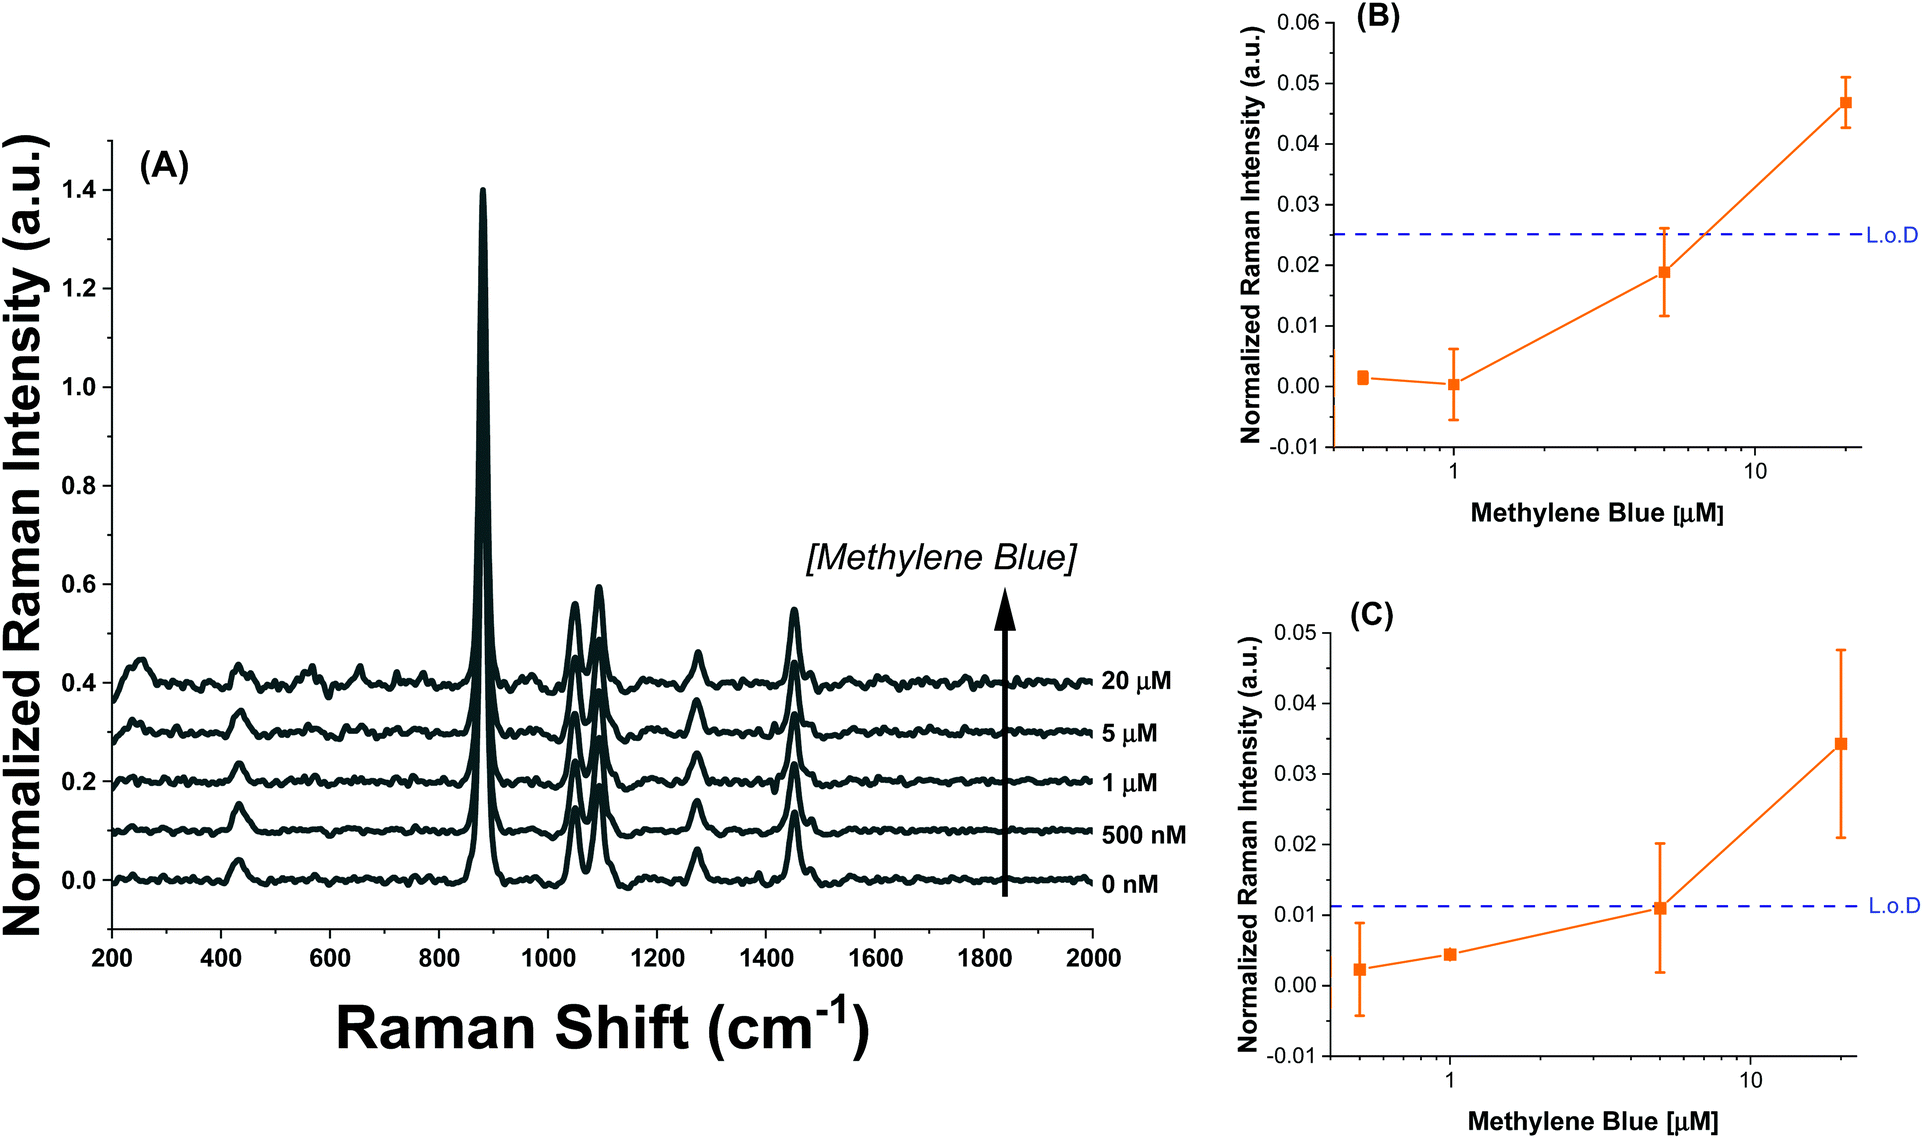 | ||
| Fig. 8 SERS Intensity profile for APTES functionalized (AuNR@Full) particles (A) for concentrations between 0–20 μM. The values were all normalized to the main ethanol Raman peak for comparison. The asterisks are above the peaks which were analyzed. (B) is the intensity profile for the peak at 240 cm−1 and (C) is the same for the peak at 655 cm−1. In (B and C), the dashed blue line represents the limit of detection based on the signal with no analyte plus three standard deviations of the average. | ||
Conclusion
Porous coatings on the ends of gold nanorods, compared to uniform coverage around the gold nanorods, allow the possibility of improved detection by SERS of appropriate analytes. The results from the SERS intensity profiles for a representative cationic dye show that the AuNR@End system has a lower limit of detection than the analogous AuNR@Full system, indicating that the dye preferentially binds at the modified tips of the AuNR and thereby having a lower limit of detection in solution. The LSPR peak shift data is consistent with this claim by revealing a more intense peak shift at identical low concentrations, implying the analyte molecules experience a more intense electric field at low analyte concentrations for the AuNR@End than the AuNR@Full substrates. Finally, functionalizing the shells with a positively charged molecule acts as a gatekeeper to dissuade methylene blue from entering, requiring much larger concentrations of this analyte to detect a SERS signal.Author contributions
Sean Meyer: conceptualization; data curation; formal analysis; investigation; methodology; writing – original draft; writing – review and editing. Catherine Murphy: conceptualization; funding acquisition; project administration; resources; supervision; visualization; writing – review and editing.Conflicts of interest
The authors declare no competing interests.Acknowledgements
This research was carried out in part in the Materials Research Laboratory Central Research Facilities, University of Illinois. The work was supported by National Science Foundation (CHE-1608743 and CHE-2107793).References
- H. Chen, L. Shao, Q. Li and J. Wang, Gold Nanorods and their Plasmonic Properties, Chem. Soc. Rev., 2013, 42, 2679–2724 RSC.
- J. Reguera, J. Langer, D. Jimenez de Abersturi and L. M. Liz-Marzàn, Anisotropic Metal Nanoparticles for Surface Enhanced Raman Scattering, Chem. Soc. Rev., 2017, 46, 3866–3885 RSC.
- N. S. Abadeer and C. J. Murphy, Recent Progress in Cancer Thermal Therapy Using Gold Nanoparticles, J. Phys. Chem. C, 2016, 120, 4691–4716 CrossRef CAS.
- Y.-S. Chen, Y. Zhao, S. J. Yoon, S. S. Gambhir and S. Emelianov, Miniature Gold Nanorods for Photoacoustic Molecular Imaging in the Second Near-Infrared Optical Window, Nat. Nanotechnol., 2019, 14, 465–472 CrossRef CAS PubMed.
- P. K. Jain, X. Huang, I. H. El-Sayed and M. A. El-Sayed, Noble Metals on the Nanoscale: Optical and Photothermal Properties and Some Applications in Imaging, Sensing, Biology, and Medicine, Acc. Chem. Res., 2008, 41, 1578–1576 CrossRef CAS PubMed.
- L. Tian, E. Chen, N. Gandra, A. Abbas and S. Singamaneni, Gold Nanorods as Plasmonic Nanotransducers: Distance-Dependent Refractive Index Sensitivity, Langmuir, 2012, 28, 17435–17442 CrossRef CAS PubMed.
- J.-F. Li, C.-Y. Li and R. F. Aroca, Plasmon-Enhanced Fluorescence Spectroscopy, Chem. Soc. Rev., 2017, 46, 3962–3979 RSC.
- N. S. Abadeer, M. R. Brennan, W. L. Wilson and C. J. Murphy, Distance and Plasmon Wavelength Dependent Fluorescence of Molecules Bound to Silica-Coated Gold Nanorods, ACS Nano, 2014, 8, 8392–8406 CrossRef CAS PubMed.
- B. Li, T. Gu, T. Ming, J. Wang, P. Wang, J. Wang and J. C. Yu, (Gold Core)@(Ceria Shell) Nanostructures for Plasmon-Enhanced Catalytic Reactions under Visible Light, ACS Nano, 2014, 8, 8152–8162 CrossRef CAS PubMed.
- K.-Q. Lin, J. Yi, S. Hu, B.-J. Liu, J.-Y. Liu, X. Wang and B. Ren, Size Effect on SERS of Gold Nanorods Demonstrated via Single Nanoparticle Spectroscopy, J. Phys. Chem. C, 2016, 120, 20806–20813 CrossRef CAS.
- J. G. Hinman, A. J. Stork, J. A. Varnell, A. A. Gewirth and C. J. Murphy, Seed Mediated Growth of Gold Nanorods: Towards Nanorod Matryoshkas, Faraday Discuss., 2016, 191, 9–33 RSC.
- J. Langer, D. Jimenez de Aberasturi, J. Aizpurua, B. A. Alvarez-Puebla, J. J. Baumber, G. C. Bazan, S. E. J. Bell, A. Boisen, A. G. Brolo and J. Choo, et al., Present and Future of Surface enhanced Raman Scattering, ACS Nano, 2020, 14, 28–117 CrossRef CAS PubMed.
- C. Hamon and L. M. Liz-Marzan, Colloidal Design of Plasmonic Sensors Based on Surface Enhanced Raman Scattering, J. Colloid Interface Sci., 2018, 512, 834–843 CrossRef CAS PubMed.
- D. Botequim, I. I. R. Silva, S. G. Serra, E. P. Melo, D. M. Prazeres, S. M. B. Costa and P. M. R. Paulo, Fluorescent Dye Nano-Assemblies by Thiol Attachment Directed to the Tips of Gold Nanorods for Effective Emission Enhancement, Nanoscale, 2020, 12, 6334–6345 RSC.
- Y. Wang, Y. Wang, W. Wang, K. Sun and L. Chen, Reporter-Embedded SERS Tags from Gold Nanorod Seeds: Selective Immobilization of Reporter Molecules at the Tip of Nanorods, ACS Appl. Mater. Interfaces, 2016, 8, 28105–28115 CrossRef CAS PubMed.
- Y. Rong, L. Song, P. Si, L. Zhang, X. Lu, J. Zhang, Z. Nie, Y. Huang and T. Chen, Macroscopic Assembly of Gold Nanorods into Superstructures with Controllable Orientations by Anisotropic Affinity Interaction, Langmuir, 2017, 33, 13867–13873 CrossRef CAS PubMed.
- N. Albarghouthi, P. MacMillan and C. L. Brosseau, Optimization of Gold Nanorod Arrays for Surface Enhanced Raman Spectroscopy (SERS) Detection of Atrazine, Analyst, 2017, 146, 2037–2047 RSC.
- T. Chen, C. Du, L. H. Tan, Z. Shen and H. Chen, Site-Selective Localization of Analytes on Gold Nanorod Surface for Investigating Field Enhancement Distribution in Surface-Enhanced Raman Scattering, Nanoscale, 2011, 3, 1575–1581 RSC.
- H. Huang, J.-H. Wang, W. Jin, P. Li, M. Chen, H.-H. Xie, X.-F. Yu, H. Wang, Z. Dai, X. Xiao and P. K. Chu, Competitive Reaction Pathway for Site-Selective Conjugation of Raman Dyes to Hotspots on Gold Nanorods for Greatly Enhanced SERS Performance, Small, 2014, 10, 4012–4019 CrossRef CAS PubMed.
- X. Yang, Y. Liu, S. H. Lam, J. Wang, S. Wen, C. Yam, L. Shao and J. Wang, Site-Selective Deposition of Metal-Organic Frameworks on Gold Nanobipyramids for Surface-Enhanced Raman Scattering, Nano Lett., 2021, 8205–8212 CrossRef CAS PubMed.
- H. Jia, A. Du, H. Zhang, J. Yang, R. Jiang, J. Wang and C.-Y. Zhang, Site-Selective Growth of Crystalline Ceria with Oxygen Vacancies on Gold Nanocrystals for Near-Infrared Nitrogen Photofixation, J. Am. Chem. Soc., 2019, 141, 5083–5086 CrossRef CAS PubMed.
- B. Wu, D. Liu, S. Mubeen, T. T. Chuong, M. Moskovits and G. D. Stucky, Anisotropic Growth of TiO2 onto Gold Nanorods for Plasmon-Enhanced Hydrogen Production from Water Reduction, J. Am. Chem. Soc., 2016, 138, 1114–1117 CrossRef CAS PubMed.
- C. Hanske, M. N. Sanz-Ortiz and L. M. Liz-Marzàn, Silica-Coated Plasmonic Metal Nanoparticles in Action, Adv. Mater., 2018, 1707003–1707031 CrossRef PubMed.
- N. D. Burrows, W. Lin, J. G. Hinman, J. M. Dennison, A. M. Vartanian, N. S. Abadeer, E. M. Grizincic, L. M. Jacob, J. Li and C. J. Murphy, Surface Chemistry of Gold Nanorods, Langmuir, 2016, 32, 9905–9921 CrossRef CAS PubMed.
- Z. Gao, N. D. Burrows, N. A. Valley, G. C. Schatz, C. J. Murphy and C. L. Haynes, In Solution SERS Sensing using Mesoporous Silica-Coated Gold Nanorods, Analyst, 2016, 141, 5088–5095 RSC.
- M. N. Sanz-Ortiz, K. Sentosun, S. Bals and L. M. Liz-Marzan, Templated Growth of Surface Enhanced Raman Scattering-Active Branched Gold Nanoparticles within Radial Mesoporous Silica Shells, ACS Nano, 2015, 9, 10489–10497 CrossRef CAS PubMed.
- L. R. Rowe, B. S. Chapman and J. B. Tracy, Understanding and Controlling the Morphology of Silica Shells on Gold Nanorods, Chem. Mater., 2018, 30, 6249–6258 CrossRef CAS.
- F. Wang, S. Cheng, Z. Bao and J. Wang, Anisotropic Overgrowth of Metal Heterostructures Induced by a Site-Selective Silica Coating, Angew. Chem., 2013, 125, 10534–10538 CrossRef.
- M. Adelt, D. A. MacLaren, D. J. S. Birch and Y. Chen, Morphological Changes of Silica Shells Deposited in Gold Nanorods: Implications for Nanoscale Photocatalysts, ACS Appl. Nano Mater., 2021, 4, 7730–7738 CrossRef CAS.
- C. Huang, M. Chung, J. S. Souris and L. Lo, Controlled epitaxial growth of mesoporous silica/gold nanorod Nanolollipops and Nanodumb-bells, APL Mater., 2014, 2, 113312–113320 CrossRef.
- C. Huang, C. Huang, I. Kuo, L. Chau and T. Yang, Synthesis of Silica-Coated Gold Nanorod as Raman Tags by Modulating Cetyltrimethylammonium Bromide Concentration, Colloids Surf., A, 2012, 409, 61–68 CrossRef CAS.
- J. Yin, H. Wu, X. Wang, L. Tian, R. Yang, L. Liu and Y. Shao, Plasmonic Nano-Dumbbells for Enhanced Photothermal and Photodynamic Synergistic Damage of Cancer Cells, Appl. Phys. Lett., 2020, 116, 163702 CrossRef CAS.
- M. Wang, A. Hoff, J. E. Doebler, S. R. Emory and Y. Bao, Dumbbell-Like Silica Coated Gold Nanorods and Their Plasmonic Properties, Langmuir, 2019, 35, 16886–16892 CrossRef CAS PubMed.
- L. Vigderman and E. R. Zubarev, High-Yield Synthesis of Gold Nanorods with Longitudinal SPR Peaks Greater than 1200 nm Using Hydroquinone as a Reducing Agent, Chem. Mater., 2013, 25, 1450–1457 CrossRef CAS.
- K. Park, H. Koerner and R. Vaia, Depletion-Induced Shape and size selection of gold nanoparticles, Nano Lett., 2010, 10, 1433–1439 CrossRef CAS PubMed.
- J. G. Hinman, J. G. Turner, D. M. Hofmann and C. J. Murphy, Layer-by-Layer Synthesis of Conformal Metal-Organic Framework Shells on Gold Nanorods, Chem. Mater., 2018, 30, 7255–7261 CrossRef CAS.
- H. Kang and C. Haynes, Interactions Between Silica-Coated Gold Nanorod Substrates and Hydrophobic Analytes in Colloidal Surface-Enhanced Raman Spectroscopy, J. Phys. Chem. C, 2019, 123, 24685–24697 CrossRef CAS.
- S. M. Egger, K. R. Hurley, A. Datt, G. Swindlehurst and C. L. Haynes, Ultraporous Mesostructured Silica Nanoparticles, Chem. Mater., 2015, 27, 3193–3196 CrossRef CAS.
- N. D. Burrows, A. M. Vartanian, N. S. Abadeer, E. M. Grzincic, L. M. Jacob, W. Lin, J. M. Dennison, J. G. Hinman and C. J. Murphy, Anisotropic Nanoparticles and Anisotropic Surface Chemistry, J. Phys. Chem. Lett., 2016, 7, 632–641 CrossRef CAS PubMed.
- J. G. Hinman, A. J. Stork, J. A. Varnell, A. A. Gewirth and C. J. Murphy, Seed Mediated Growth of Gold Nanorods: Towards Nanorod Matroyshkas, Faraday Discuss., 2016, 191, 9–33 RSC.
- P. L. Stiles, J. A. Dieringer, N. C. Shah and R. P. Van Duyne, Surface-Enhanced Raman Spectroscopy, Annu. Rev. Anal. Chem., 2008, 1, 601–626 CrossRef CAS PubMed.
- H. T. Phan and A. J. Haes, Impacts of pH and Intermolecular Interactions on Surface-Enhanced Raman Scattering Chemical Enhancements, J. Phys. Chem. C, 2018, 122, 14846–14856 CrossRef CAS.
- B. E. Janicek, J. G. Hinmna, J. J. Hinman, S. Bae, M. Wu, J. Turner, H. Chang, E. Park, R. Lawless, K. S. Suslick, C. J. Murphy and P. Y. Huang, Quantitative Imaging of Organic Ligand Density on Anisotropic Inorganic Nanocrystals, Nano Lett., 2019, 19, 6308–6314 CrossRef CAS PubMed.
- S. Jabariyan and M. A. Zanjanchi, A Simple and Fast Sonication Procedure to Remove Surfactant Templates from Mesoporous MCM-41, Ultrason. Sonochem., 2012, 5, 1087–1093 CrossRef PubMed.
- G. Lu, L. Hou, T. Zhang, W. Li, J. Liu, P. Perriat and Q. Gong, Anisotropic Plasmonic Sensing of Individual or Coupled Gold Nanorods, J. Phys. Chem. C, 2011, 115, 22877–22885 CrossRef CAS.
- H.-W. Han, A. Joe and E.-S. Jang, Reduced Cytotoxicity of CTAB-Templated Silica Layer on Gold Nanorod Using Fluorescence Dyes and its Application in Cancer Theranostics, J. Ind. Eng. Chem., 2021, 96, 202–212 CrossRef CAS.
- S. I. Raj, A. Jaiswal and I. Uddin, Tunable Porous Silica Nanoparticles as a Universal Dye Adsorbent, RSC Adv., 2019, 9, 11212–11219 RSC.
- C.-H. Huang, K.-P. Chang, H.-D. Ou, Y.-C. Chiang and C.-F. Wang, Adsorption of Cationic Dyes onto Mesoporous Silica, Microporous Mesoporous Mater., 2011, 141, 102–109 CrossRef CAS.
- L. Zhou, R. Johnson, T. Habteyes and H. Guo, Adsorption of Methylene Blue, and its N-demethylated Derivatives on the (111) Face of Coinage Metals: The Importance of Dispersion Interactions, J. Chem. Phys., 2017, 146, 164701–164706 CrossRef PubMed.
- S. T. Sivalapan, B. M. DeVetter, T. K. Yang, M. V. Schulmerich, R. Bhargava and C. J. Murphy, Surface-Enhanced Raman Spectroscopy of Polyelectrolyte Wrapped Gold Nanoparticles in Colloidal Suspension, J. Phys. Chem. C, 2013, 20, 10677–10682 CrossRef PubMed.
- S. T. Sivapalan, B. M. DeVetter, T. K. Yang, T. van Dijk, M. V. Schulmerich, P. S. C. Carney, R. Bhargava and C. J. Murphy, Off-Resonance Surface-Enhanced Raman Spectroscopy from Gold Nanorod Suspensions as a Function of Aspect Ratio: Not What We Thought, ACS Nano, 2013, 3, 2099–2105 CrossRef PubMed.
- M. C. S. Pierre, P. M. Mackie, M. Roca and A. J. Haes, Correlating Molecular Surface Coverage and Solution-Phase Nanoparticle Concentration to Surface-Enhanced Raman Scattering Intensities, J. Phys. Chem. C, 2011, 115, 18511–18517 CrossRef CAS.
- G.-N. Xiao and S.-Q. Man, Surface-Enhanced Raman Scattering of Methylene Blue Adsorbed on Cap-Shaped Silver Nanoparticles, Chem. Phys. Lett., 2007, 447, 305–309 CrossRef CAS.
- S. T. Sivalapan, B. M. DeVetter, T. K. Yang, M. V. Schulmerich, R. Bhargava and C. J. Murphy, Surface-Enhanced Raman Spectroscopy of Polyelectrolyte Wrapped Gold Nanoparticles in Colloidal Suspension, J. Phys. Chem. C, 2013, 20, 10677–10682 CrossRef PubMed.
- S.-H. Seo, B.-M. Kim, A. Joe, H.-W. Han, X. Chen, Z. Cheng and E.-S. Jang, NIR-Light-Induced Surface-Enhanced Raman Scattering for Detection and Photothermal/Photodynamic Therapy of Cancer Cells using Methylene Blue-Embedded Gold Nanorod @ SiO2 Nanocomposite, Biomaterials, 2014, 35, 3309–3318 CrossRef CAS PubMed.
- S. D. Roy, M. Ghosh and J. Chowdhury, Adsorptive Parameters, and Influence of Hot Geometries on the SER(R)S Spectra of Methylene Blue Molecules Adsorbed on Gold Nanocolloidal Particles, J. Raman Spectrosc., 2015, 46, 451–461 CrossRef.
- H.-L. Chen, Z.-H. Yang and S. Lee, Observation of Surface Coverage-Dependent Surface-Enhanced Raman Scattering and the Kinetic Behavior of Methylene Blue Adsorbed on Silver Oxide Nanocrystals, Langmuir, 2016, 32, 10184–10188 CrossRef CAS PubMed.
- C. Li, Y. Huang, K. Lai, B. A. Rasco and Y. Fan, Analysis of Trace Methylene Blue in Fish Muscles Using Ultra-Sensitive Surface-Enhanced Raman Spectroscopy, Food Contam., 2016, 65, 99–105 CrossRef CAS.
- C. Sun, T. Chen, W. Ruan, B. Zhao and Q. Cong, Controlling the Orientation of Probe Molecules on Surface-Enhanced Raman Scattering Substrates: A Novel Strategy to Improve Sensitivity, Anal. Chim. Acta, 2017, 994, 65–72 CrossRef CAS PubMed.
- M. Moskovits and J. S. Suh, Surface Selection Rules for Surface-Enhanced Raman Spectroscopy: Calculation and Application to the Surface-Enhanced Raman Spectrum of Phtalazine on Silver, J. Phys. Chem., 1984, 88, 5526–5530 CrossRef CAS.
- G. Lu, B. Shrestha and A. J. Haes, Importance of Tilt Angles of Adsorbed Aromatic Molecules on Nanoparticles Rattle SERS Substrates, J. Phys. Chem. C, 2016, 120, 20759–20767 CrossRef CAS.
- P. A. Mercadal, L. A. Perez and E. A. Coronado, Optical Properties of Silica-Coated Au Nanorods: Correlating Theory and Experiments for Determining the Shell Porosity, J. Phys. Chem. C, 2021, 125, 15516–15526 CrossRef CAS.
Footnote |
| † Electronic supplementary information (ESI) available: Fig. S1. TEM comparison of small and large pore silica coatings. See https://doi.org/10.1039/d1nr07918b |
| This journal is © The Royal Society of Chemistry 2022 |