
 Open Access Article
 This Open Access Article is licensed under a Creative Commons Attribution-Non Commercial 3.0 Unported Licence
In situ silver nanoparticle coating of virions for quantification at single virus level
Zsófia
Bognár
 ab,
Marien I.
de Jonge
c and
Róbert E.
Gyurcsányi
*abd
ab,
Marien I.
de Jonge
c and
Róbert E.
Gyurcsányi
*abd
aDepartment of Inorganic and Analytical Chemistry, Budapest University of Technology and Economics, Műegyetem rkp. 3, H-1111 Budapest, Hungary. E-mail: gyurcsanyi.robert@vbk.bme.hu
bMTA-BME Lendület Chemical Nanosensors Research Group, Műegyetem rkp. 3, H-1111 Budapest, Hungary
cSection Paediatric Infectious Diseases, Laboratory of Medical Immunology, Radboud Center for Infectious Diseases, Radboud University Medical Center, Philips van Leydenlaan 15, 6525 EX Nijmegen, The Netherlands
dMTA-BME Computation Driven Chemistry Research Group, Műegyetem rkp. 3, H-1111 Budapest, Hungary
First published on 17th January 2022
Abstract
In situ labelling and encapsulation of biological entities, such as of single viruses, may provide a versatile approach to modulate their functionality and facilitate their detection at single particle level. Here, we introduce a novel virus metallization approach based on in situ coating of viruses in solution with silver nanoparticles (AgNP) in a two-step synthetic process, i.e. surface activation with a tannic acid – Sn(II) coordination complex, which subsequently induces silver ion (I) reduction. The metalic coating on the virus surface opens the opportunity for electrochemical quantification of the AgNP-tagged viruses by nano-impact electrochemistry on a microelectrode with single particle sensitivity, i.e. enable the detection of particles oherwise undetectable. We show that the silver coating of the virus particles impacting the electrode can be oxidized to produce distinct current peaks the frequency of which show a linear correlation with the virus count. The proof of the concept was done with inactivated Influenza A (H3N2) viruses resulting in their quantitation down to the femtomolar concentrations (ca. 5 × 10⁷ particles per mL) using 50 s counting sequences.
Introduction
The use of abiotic materials to encapsulate or coat individual cells and other bioentities emerged as a versatile modality to tune and control their biological functionality and to protect them from external stress factors.1 However, beside modulating the inherent biological function abiotic materials can provide bioentities with new properties such as magnetism, electrical conductivity or fluorescence that can be further exploited in biosensing, bioelectronics, biocatalysis, facilitating also their manipulation and handling.2,3 Generally, there are three main approaches to coat cells with abiotic materials either partially or developing fully isolating shells:- (i) Direct assembly of nanoparticles on the cell surface (e.g., using organic and inorganic precursors,4 noble metal particles,5–8 quantum-dots,9 magnetic nanoparticles,10,11 nanotubes and nanorods,12–14 graphene15,16 and graphene-oxide17);
- (ii) Employing cell metabolism to attract coating building blocks (e.g., Ca2+ uptake can be applied to attract Ca2+ decorated gold nanoparticles onto the cell surface18);
- (iii) In situ induced coating of targets2 (e.g. surface induced polymerization,19–21 silicification,22–26 gold particle formation by in situ reduction27 and metal-polyphenolic networks28–31).
Scaling down these encapsulation processes from cells to much smaller size viruses with different surface functionality is expected to be challenging. Such attempts were mostly made by using the virus as a well-defined size and shape template to generate abiotic nanomaterials.32–35 However, exactly because of their small size, the metal encapsulation may represent a convenient modality to increase the detection sensitivity of viruses to single particle level while opening also the prospects for more affordable means for quantitation. Presently, solution-based state of the art detection methods with single virus sensitivity such as nanoparticle tracking analysis (NTA),36–39 resistive pulse sensing (RPS) with nanopores,40–43 and various approaches based on hydrodynamic focusing (e.g. flow cytometry,44–46 optical waveguides47,48) are either rather complex or may have insufficient sensitivity for viruses in the lower nanometer range. Therefore, here we explored the feasibility to encapsulate virions in situ in a metallic shell that is amenable to electrochemical oxidation and as such can enable their electrochemical detection at single particle level. Such nano-impact electrochemical methods requiring merely a microelectrode and a potentiostat have clear advantages in terms of cost-effectiveness and methodological simplicity. Our main hypothesis was that viruses can be encapsulated in a metallic shell and that the oxidation of this shell at a microelectrode surface will provide current pulses the frequency of which correlates with the virus count. Previous innovative attempts involved the detection of viruses in the presence of a redox mediator in the sample solution. In this case virions upon collision with the electrode surface cause current blocking events as it has been shown with murine cytomegalovirus by Dick et al.49 However, irreversible adsorption of viruses on the electrode surface may hamper the measurements, a problem that could be potentially also addressed by an abiotic encapsulation. Therefore, we investigated an abiotic metal coating where protective metallic encapsulation can be coupled with appropriate redox properties for nano-impact electrochemistry. This is supported by recent work of Compton and co-workers, showing that virus particles exposed to AgNP solution result in adsorption of AgNPs on the virus surface that could be detected and quantified by nano-impact coulometry.7 Here, in contrary to nanoparticle adsorption, which may cause an undesirably large background without separation, we focused on developing a fairly universal methodology based on an in situ surface-induced metallization chemistry. In this respect we took advantage of tannic acid (TA) a polyphenol compound that contain high levels of galloyl groups making possible the coordination of a range of metal ions. Owing to their high surface binding activity TA-metal ion films were shown to form on the surface of various substrate materials.30,50,51 This procedure was mainly attempted with Fe(III) ions to encapsulate cells, e.g. Park et al.28 used tannic acid–Fe(III) complex for cytoprotective single-cell encapsulation. The reported artificial shell could be degraded on-demand, while protecting the cell from external stresses.28 A quasi-reversible electrochemistry of the shell was also reported that involves the irreversible oxidation of the phenolic ligand, and reversible reduction of the metal ions. However, the detection of Fe(III)–TA complex-based virus shells by nano-impact electrochemistry with extremely short contacting times was not successful, and therefore we searched for a redox system with higher heterogeneous electron transfer rate constant. While nano-impact electrochemistry enabled efficient quantification of a range of abiotic nanoparticles such as platinum,52–55 iridium-oxide,56,57 silver,58–64 gold,65–67 including insulating68 and semi-conducting48 nanoparticles, the low oxidation potential of silver seemed the most appealing to pursue. Thus in this study, we demonstrate the in situ chemical coating of influenza A (H3N2) virus with Ag, coupled with nano-impact electrochemistry as a new approach to functionalize and detect virus particles.
Experimental
Chemicals and materials
Influenza A Udorn/307/72 (H3N2) virus was cultured in embryonated eggs as previously described.69 Filamented quartz capillaries with outer diameter: 1 mm and inner diameter: 0.7 mm (QF100-70-7.5) were obtained from Sutter Instrument Co. (Novato, CA). Polystyrene (PS) nanoparticles with 4 w/v% concentration and 100 nm diameter were purchased from Life Technologies Corporation (Carlsbad, CA). Tannic acid, SnCl2·2H2O, AgNO3, citric acid, NaOH, NH4OH, 3-(N-morpholino)propanesulfonic acid (MOPS) and phosphate buffered saline (PBS) + 0.05% Tween 20 (PBST) buffers were obtained from Sigma-Aldrich. All solutions were prepared with deionized (DI) water (18.2 MΩ cm resistivity, Millipore).Modification of PS nanoparticles for modelling the virus system
Five μL of the PS nanoparticles were purified with DI water (18.2 MΩ cm resistivity, Millipore) using centrifugation (30![[thin space (1/6-em)]](https://www.rsc.org/images/entities/char_2009.gif) 000 rcf, 20 min) (Centrisart G-26C, Sartorius). 5 μL of the tannic acid solution (40 mg mL−1) and 5 μL of SnCl2·2H2O (10 mg mL−1) were added sequentially to 490 μL colloidal suspension of the PS nanoparticles. Next the pH of the suspension was adjusted to 7.4 by adding 500 μL of 20 mM MOPS buffer. The resulting solution was mixed vigorously for 10 seconds, followed by incubation for 30 minutes resulting in the tannic acid and Sn2+ complex formation on the surface of the nanoparticles. The unreacted tannic acid and Sn2+ were separated in three subsequent washing steps with centrifugation (30000 rcf, 20 min) to avoid later stage silver nanoparticle synthesis in solution phase. Diamminesilver(I) solution was prepared by dissolving AgNO3 (0.2463 g) in 10 mL DI water and NH4OH (25%) was added dropwise until the precipitate dissolved and then the solution was completed to 50 mL with deionized water. The PS nanoparticles coated with TA–Sn2+ complex were resuspended under ultrasonication in 1 mL [Ag(NH3)2]+ solution to form Ag(0) by local reduction with Sn2+ on the surface of the PS nanoparticles (10 min). The reduction of the Ag+ was followed by absorbance measurement through the subsequent formation of Ag-coated nanoparticles using NanoDrop 2000c spectrophotometer (Thermo Fischer Scientific). The silver encapsulated nanoparticles were centrifuged (10000 rcf, 10 min) three times and washed with DI water to remove the unreacted [Ag(NH3)2]+ solution.
000 rcf, 20 min) (Centrisart G-26C, Sartorius). 5 μL of the tannic acid solution (40 mg mL−1) and 5 μL of SnCl2·2H2O (10 mg mL−1) were added sequentially to 490 μL colloidal suspension of the PS nanoparticles. Next the pH of the suspension was adjusted to 7.4 by adding 500 μL of 20 mM MOPS buffer. The resulting solution was mixed vigorously for 10 seconds, followed by incubation for 30 minutes resulting in the tannic acid and Sn2+ complex formation on the surface of the nanoparticles. The unreacted tannic acid and Sn2+ were separated in three subsequent washing steps with centrifugation (30000 rcf, 20 min) to avoid later stage silver nanoparticle synthesis in solution phase. Diamminesilver(I) solution was prepared by dissolving AgNO3 (0.2463 g) in 10 mL DI water and NH4OH (25%) was added dropwise until the precipitate dissolved and then the solution was completed to 50 mL with deionized water. The PS nanoparticles coated with TA–Sn2+ complex were resuspended under ultrasonication in 1 mL [Ag(NH3)2]+ solution to form Ag(0) by local reduction with Sn2+ on the surface of the PS nanoparticles (10 min). The reduction of the Ag+ was followed by absorbance measurement through the subsequent formation of Ag-coated nanoparticles using NanoDrop 2000c spectrophotometer (Thermo Fischer Scientific). The silver encapsulated nanoparticles were centrifuged (10000 rcf, 10 min) three times and washed with DI water to remove the unreacted [Ag(NH3)2]+ solution.
In situ AgNP synthesis on the surface of influenza A (H3N2) virus
The modification of the influenza A (H3N2) virus particles was performed as described for PS nanoparticles. However, the virus coated with TA–Sn2+ coordination complex was further purified using a Vivaspin 500 centrifugal concentrator (15000 rcf, 10 min) with 100000 MWCO to remove the unadsorbed coordination complex while the PES (polyethersulfone) membrane retained the modified virus particles. After resuspension of the virus in [Ag(NH3)2]+ solution the Ag ion reduction on the surface of the particles was performed, and the silver encapsulated virus particles were centrifuged three times in Vivaspin 500 (15000 rcf, 10 min) and washed with DI water.
Nanoparticle tracking analysis
NTA measurements were performed using Nanosight LM10-HS system (Malvern Instruments Ltd) equipped with a 488 nm laser light source and a sCMOS camera (Hamamatsu Photonics) triggered by the laser. Particles were diluted in DI water to a nominal concentration of 108 particles per mL and were injected with a sterile syringe in the thin layer measurement cell. All measurements were performed at room temperature and at optimized camera level (shutter and gain). Results were evaluated as an average of ten track records, each of 30 s duration. Nanosight NTA 2.3 software was used for concentration determination, normalized intensity calculation and size distribution analysis.Amperometric nano-impact measurements
Nanoparticle suspensions were diluted in 100 mM sodium-dihydrogen-citrate (pH = 3.9) solution. For nanoparticle counting experiments a HEKA EPC 10 USB patch-clamp amplifier (HEKA Elektronik) with a low/noise headstage, 4 kHz low-pass filter and 50 kHz sampling rate were used. For nano-impact electrochemistry measurements a carbon fiber microelectrode with 11 μm diameter (MF-2007, BASi®) and a Ag/AgCl quasi-reference electrode (QRE) were immersed in the deoxygenated sample solution. The potential was held at −500 mV (vs. QRE) for reducing the in situ synthetized, partly oxidized and passivated silver nanoparticles for 50 s, followed by applying +600 mV (vs. QRE) oxidizing potential for 50 s for nano-impact measurements. The resulted current spikes originated from the random collision of the AgNP-tagged viruses with the microelectrode surface. The number of impacts were correlated with the silver tagged virus concentration. Current spikes were analyzed using a peak detection algorithm using a custom-written Python-software.70 For each measurement the number of the detected peaks was determined including the time of current spike, the full width at half maximum and the current amplitude. All results were calculated from ten repetitive measurements of ca. 50 s duration.Resistive-pulse sensing measurements
Nanopipets with desired diameter around 400 nm were fabricated with a P-2000 micropipette puller (Sutter Instruments) using quartz capillaries with internal filament. A two-step pulling program was used: Cycle 1: Heat 750; Filament 4; Velocity 55; Delay 132; Pull 55 and Cycle 2: Heat 800; Filament 4; Velocity 30; Delay 129; Pull 120. The nanopipets were filled with PBST solution and were inserted into a pipet holder that included a Ag/AgCl wire and a pressure port. The latter served to draw inside the sample solution through the tip during RPS by applying a negative pressure of ca. 900 Pa. The nanopipet was immersed into a custom-made cell filled with the sample solution, diluted in PBST to a nominal concentration of 109 mL−1. For counting measurements, the previously mentioned HEKA EPC 10 USB patch-clamp amplifier was used. The diameter of the nanopipets were determined based on electrical resistance measurements, i.e., the resistance was calculated from the current change upon applying two 10 ms duration square-wave pulses with ± 10 mV amplitude. For virus counting a constant +400 mV voltage was applied using a 8.7 kHz low-pass filter and 50 kHz sampling rate. The current transients were evaluated by a custom-made Python-software as published previously.70Scanning electron microscopy (SEM) investigations
SEM images of silver-modified and unmodified particles spotted onto a gold substrate were captured using a Thermo Scientific Scios™ 2 DualBeam™ SEM system at 5 keV beam energy.Results and discussion
The overall concept to encapsulate viruses in a nanoparticulate silver shell that was expected to be amenable to electrochemical oxidation during their collision with a properly polarized microelectrode is shown in Scheme 1. The essential enabling technology in this respect is the two-step synthesis of the Ag layer on the surface of virus particles that involves first the formation of the tannic acid–Sn2+ coordination complex on the virus surface, which is inducing the reduction of Ag+ in the subsequent step. | ||
| Scheme 1 Schematic workflow of the in situ AgNP coating of virions for amperometric nano-impact measurements. The surface of the virions was first activated with tannic acid–Sn2+ complex, followed by their separation from the reagent solution. The activated virus particles were then suspended in [Ag(NH3)2]+ solution with concomitant reduction of silver on the virus surface. This silver coating enables through its amperometric oxidation the quantification of virions at single particle level. | ||
In situ silver coating of the surface of polystyrene nanoparticles
The surface induced coating of particles with silver was first tested using PS nanoparticles. The time dependence of the silver(I) reduction was examined with UV-VIS spectroscopy based on the appearance of the characteristic absorption band corresponding to the plasmonic resonance of the silver nanoparticles. The addition of the purified PS nanoparticles activated with tannic acid–Sn2+ coordination complex to the [Ag(NH3)2]+ solution generated localized silver nanoparticles on the particle surface. As it can be seen on the UV-VIS spectra (Fig. 1A) the absorbance at 425 nm increased without any significant wavelength shift that suggests the absence of aggregation. It also indicates AgNP formation instead of a fully encapsulating layer, which was confirmed by SEM measurements (Fig. 1C) that also revealed mostly distinct single AgNPs coating the surface. The absorbance reached saturation very fast, in 5 min, indicating the termination of the AgNP formation reaction (Fig. 1B). A negative control in which the PS nanoparticle surface was not modified with tannic acid–Sn2+ coordination complex confirmed no detectable silver formation in the absence of surface-activated particles. Thus the deposition occurs selectively on the surface of the activated particles.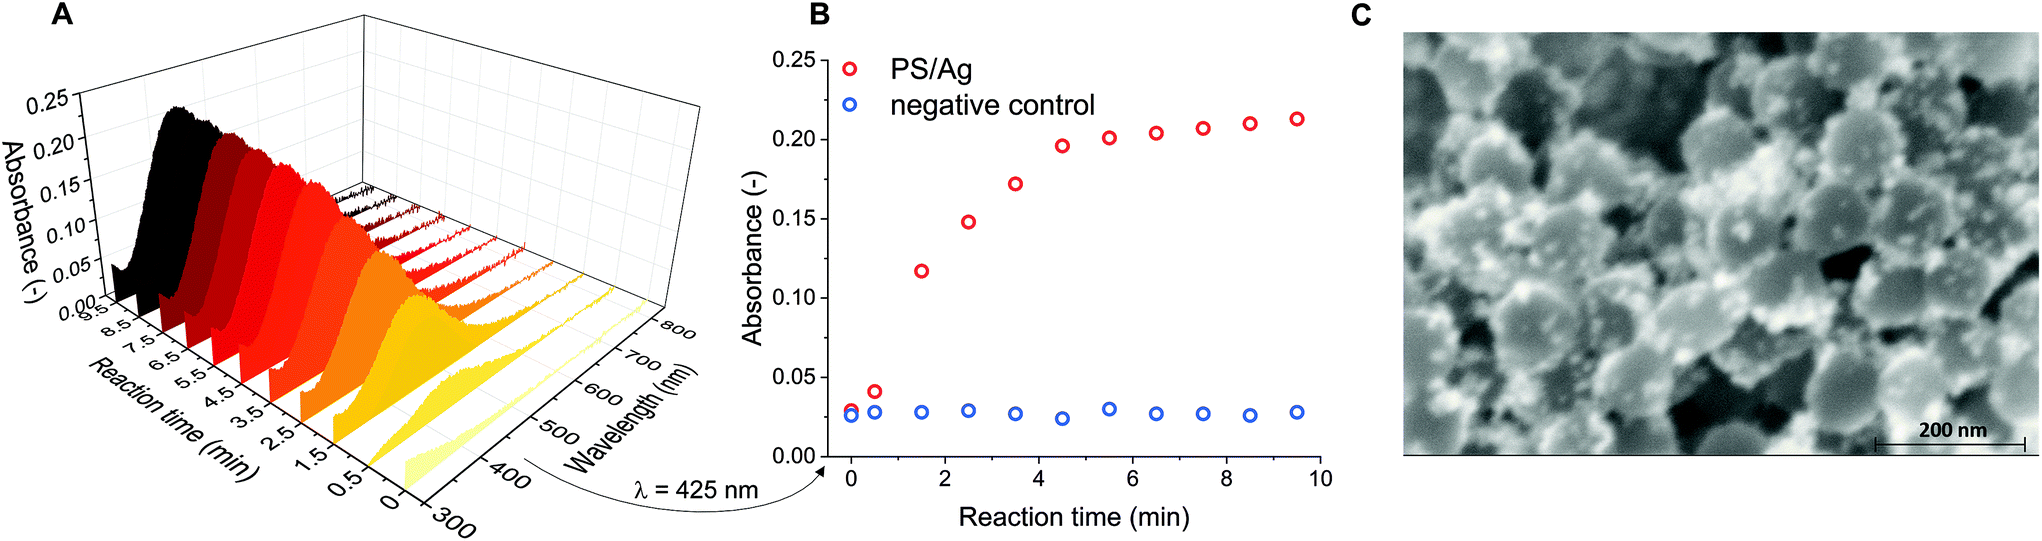 | ||
| Fig. 1 Time dependence of the absorbance spectra indicative of in situ silver nanoparticle formation on the surface of the PS nanoparticles (A) as result of tannic-acid–Sn2+ coordination complex activation, followed by Ag+ reduction. (B) The relevant absorbance values of the Ag-coated nanoparticles at 425 nm (the characteristic absorption wavelength of AgNPs). The reaction terminated in five minutes, without the aggregation of the nanoparticles. (C) SEM images of AgNP-tagged nanoparticles shown at 150000× magnification. | ||
In situ silver coating of influenza A (H3N2) virus
The method worked out for PS nanoparticles could be seamlessly adapted for Influenza A (H3N2) virus particles. As in case of PS nanoparticles the reaction resulted in a nanoparticle coating rather than a continuous silver layer. The equivalent diameter increase as result of the silver coating was confirmed using both NTA and RPS as shown in Fig. 2A and B, respectively. | ||
| Fig. 2 Size distribution of untagged (blue) and AgNP-tagged (red) H3N2 influenza virus. NTA (A) and RPS (B) measurements show a good correlation in terms of size increase as result of the silver nanoparticle formation on the virus surface. NTA was performed in ∼108 mL−1 while RPS measurements in ∼109 mL−1 virus particle solution. The RPS measurements were made, with a 469.5 ± 35.5 nm diameter pipet, at +400 mV (vs. Ag/AgCl) and 900 Pa negative pressure. | ||
The influenza A (H3N2) virus, like envelope viruses in general, is pleomorphic that explains the relatively broad size distribution. However, there is a clear shift of the equivalent diameter, ca. 88 nm, with ca. 10 nm due to the silver coating of the virus surface. Owing to the separation of the unabsorbed TA–Sn(II) complex from the surface-activated virus after the activation step, bulk phase AgNP formation was not observed. This is clearly indicated by the absence of AgNPs with diameters lower than 50 nm,71 showing that silver nanoparticle formation and growth is induced by the virus surface. We expected that the silver coating will not only change the size of native virus particles, but owing to the metallization also the refractive index. This change may be more sensitively detected than the size change through an increase in the scattered light intensity of the Ag-covered virus particles. Of note, to detect the increase in the particle size would have not been trivial with ensemble methods and needed the extraordinary resolving power of single particle detection techniques as NTA and RPS. The change in the refractive index upon silver coating could be revealed in NTA through a significant increase in the scattered light intensity of the individual virus particles as shown in Fig. 3.
 | ||
| Fig. 3 Comparative 2D plot of the scattered light intensity of AgNP-tagged and untagged virus particles at a concentration of 108 mL−1 as determined by NTA. | ||
Remarkably, the normalised light scattering intensity allows explicit discrimination of the AgNP particle tagged viruses from untagged virions in the whole size range. While this further confirms the surface induced silver deposition, it can be exploited for more sensitive NTA measurements.
Quantification of influenza A virus with nano-impact electrochemistry
First we investigated the effect of the applied potential on the oxidation of Ag-covered nanoparticles. During nano-impact electrochemistry the nanoparticles undergo stochastic collisions with the microelectrode surface leaving very short times for the oxidation of the Ag shell. Indeed, the corresponding oxidative current peaks had half widths of ca. 1 ms (Fig. 4 inset) and therefore the applied potential should maximize the efficiency of the oxidation indicated by the frequency of the current spikes. We found that as the potential was increased from 200 mV the frequency of the current spikes corresponding to individual particle-microelectrode collisions increased and finally levelled at +600 mV (vs. QRE) (Fig. 5 inset). Thereby, the applied potential in all further nano-impact electrochemistry experiments was 600 mV, which was in agreement to the oxidizing potential reported by Compton.7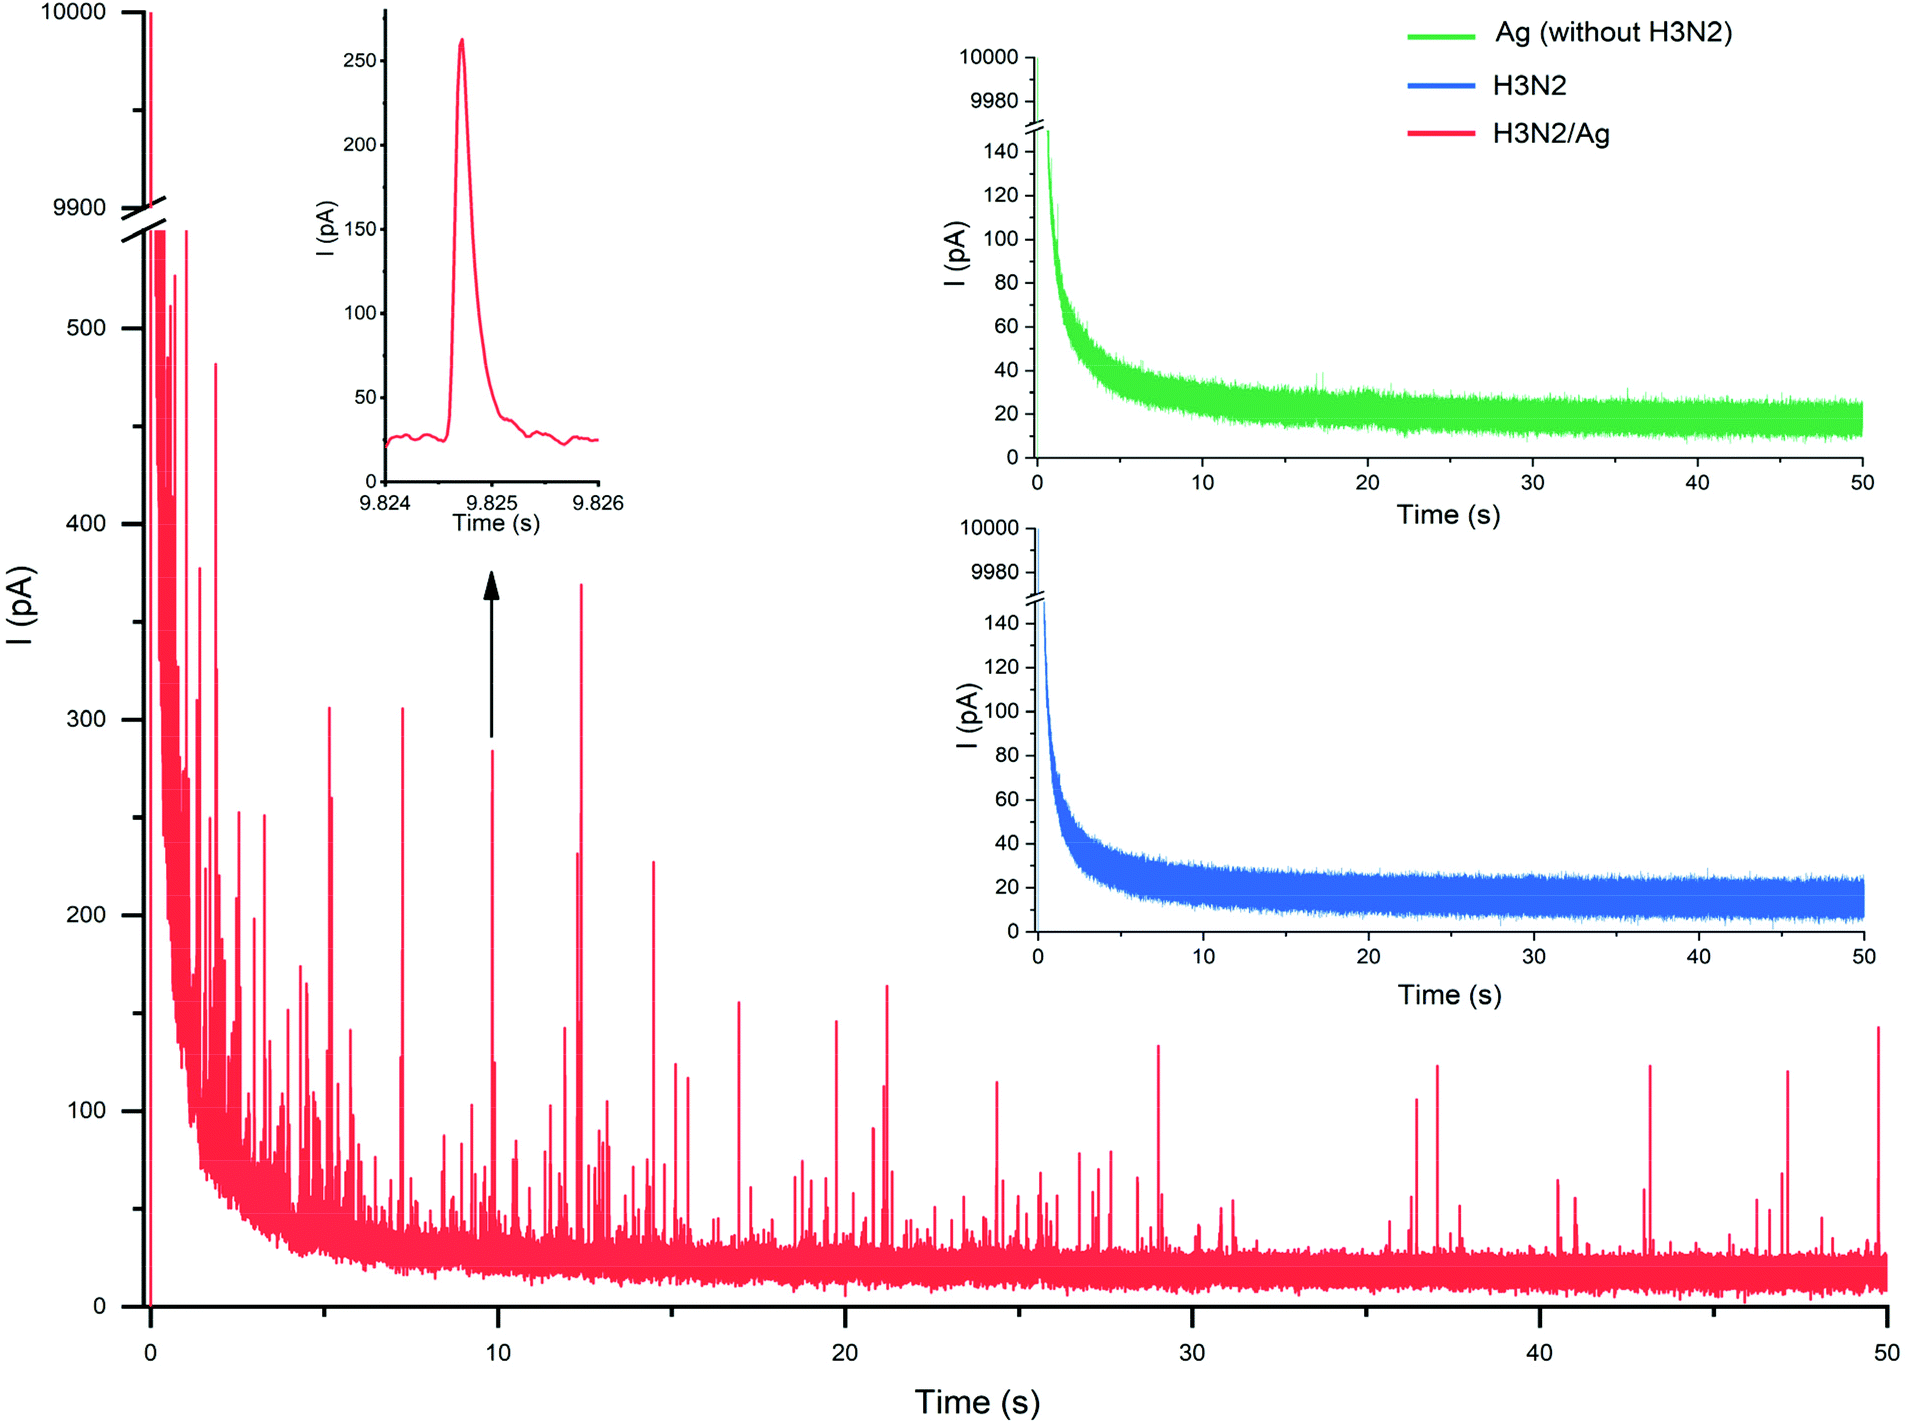 | ||
| Fig. 4 Representative current transients during nano-impact electrochemistry of individual in situ AgNP-tagged H3N2 viruses and the magnified current signal of a single current spike. The inset shows as control the same experiment performed with unmodified H3N2 influenza virus particles and AgNP synthesis in the absence of H3N2 that reveal the full lack of any current spike. | ||
 | ||
| Fig. 5 The relation between the impact count and the AgNP tagged virus particle concentration as determined by nano-impact electrochemistry at an applied voltage of +600 mV vs. Ag/AgCl. The inset shows the optimization of the applied potential, showing saturation at 600 mV. The measurements were made using a carbon fiber microelectrode (∅ 11 μm) in 100 mM sodium-dihydrogen-citrate solution (pH = 3.9). The two horizontal axis show the same virus concentrations expressed in different units. The pM concentrations were calculated as 1000 × viral particles/(mL × NA), where NA is the Avogadro number. | ||
A typical recording during a nano-impact electrochemistry experiment performed in a AgNP encapsulated influenza A virus solution (1.4 × 10⁹ particles per mL) is shown in Fig. 4.
The negative control experiments involving unmodified virus particles and samples in which the synthetic procedure was made in the absence of the influenza A (H3N2) virus did not reveal any current spikes (Fig. 4 insets). These results confirm that the detected current events in the nano-impact electrochemistry measurements are due to the oxidation of AgNP-tagged virus particles and there is no Ag particle formation in the absence of the surface-activated virus particles acting as “nucleation centers”. This contours as major benefit of in situ metallization as compared with direct modification with metal nanoparticles. We obtained a linear correlation between the number of impacts and the Ag-tagged virus concentration spanning over more than an order of magnitude as shown in Fig. 5.
The uncertainty of the measurements was much lower than previously reported for AgNP uptake-based tagging of viruses,7 which might be due to the relatively even distribution of the AgNPs on the particle surface, i.e. such in situ deposition might be less affected by local particle aggregation on the virus surface. This is supported by the relatively narrow charge distribution obtained by integration of the current spikes, 5.90 ± 1.80 × 10⁻¹⁴ C. The smallest concentration of the AgNP-tagged influenza A virus that could be detected using a 50 s time frame for the analysis was 5.2 × 10⁷ particles per mL (86.5 fM), which is competitive with other state of the art single virus detection electrochemical methods such as RPS.72,73
Conclusions
Here we have proven the feasibility of in situ AgNP coating of viruses mediated by coordination complexation to enable their detection at single particle level with nano-impact electrochemistry using as a model the influenza A (H3N2) virus. At present this method is intended as a general metallization strategy to enhance the sensitivity and foster detectability rather than a mean for selective virus detection. Even at the proof of concept level the advantages of metallization are clear for both optical (NTA) and nano-impact electrochemistry methods. In case of NTA, the metallization may be of significance for very small viruses (<30–50 nm) with hardly detectable light scattering, which can be enhanced by the metal coating. Most importantly, however, the electrochemically active coating enables the direct and simple detection of viruses with a microelectrode. In this respect, the present coating methodology, most likely because of a more even distribution of the AgNP on the virus surface seems to result in significantly improved precision with respect of the state of the art. While the present approach is largely limited to rather pure virus formulations, e.g. vaccines, the methodology may be further developed for selective deposition.Author contributions
Zsófia Bognár: investigation, methodology, data curation, formal analysis, visualization, writing – original draft. Marien I. de Jonge: methodology, writing – review & editing. Róbert E. Gyurcsányi: conceptualization, methodology, supervision, visualization, writing – original draft, writing – review & editing, funding acquisition.Conflicts of interest
There are no conflicts to declare.Acknowledgements
This research was funded by the National Research, Development, and Innovation Fund of Hungary under Grant TKP2021-EGA-02. Soma Papp is greatly acknowledged for assisting with resistive pulse sensing measurement. The authors are grateful to Dr Péter Fürjes and Levente Illés for the scanning electron microscopy measurements. We thank Marc Eleveld for the production of inactivated influenza A (H3N2) virus.References
- J. H. Park, D. Hong, J. Lee and I. S. Choi, Acc. Chem. Res., 2016, 49, 792–800 CrossRef CAS PubMed.
- B. Dai, L. Wang, Y. Wang, G. Yu and X. Huang, ChemistrySelect, 2018, 3, 7208–7221 CrossRef CAS.
- W. Geng, L. Wang, N. Jiang, J. Cao, Y. X. Xiao, H. Wei, A. K. Yetisen, X. Y. Yang and B. L. Su, Nanoscale, 2018, 10, 3112–3129 RSC.
- B. Wang, P. Liu, W. Jiang, H. Pan, X. Xu and R. Tang, Angew. Chem., Int. Ed., 2008, 47, 3560–3564 CrossRef CAS PubMed.
- S. C. Hayden, G. Zhao, K. Saha, R. L. Phillips, X. Li, O. R. Miranda, V. M. Rotello, M. A. El-Sayed, I. Schmidt-Krey and U. H. F. Bunz, J. Am. Chem. Soc., 2012, 134, 6920–6923 CrossRef CAS PubMed.
- M. Kahraman, A. I. Zamaleeva, R. F. Fakhrullin and M. Culha, Anal. Bioanal. Chem., 2009, 395, 2559–2567 CrossRef CAS PubMed.
- L. Sepunaru, B. J. Plowman, S. V. Sokolov, N. P. Young and R. G. Compton, Chem. Sci., 2016, 7, 3892–3899 RSC.
- L. Sepunaru, K. Tschulik, C. Batchelor-McAuley, R. Gavish and R. G. Compton, Biomater. Sci., 2015, 3, 816–820 RSC.
- C. Yang, H. Xie, Q. C. Li, E. J. Sun and B. L. Su, J. Colloid Interface Sci., 2015, 450, 388–395 CrossRef CAS PubMed.
- M. Martín, F. Carmona, R. Cuesta, D. Rondón, N. Gálvez and J. M. Domínguez-Vera, Adv. Funct. Mater., 2014, 24, 3489–3493 CrossRef.
- R. F. Fakhrullin, J. García-Alonso and V. N. Paunov, Soft Matter, 2010, 6, 391–397 RSC.
- X. Chen, U. C. Tam, J. L. Czlapinski, G. S. Lee, D. Rabuka, A. Zettl and C. R. Bertozzi, J. Am. Chem. Soc., 2006, 128, 6292–6293 CrossRef CAS PubMed.
- S. A. Konnova, I. R. Sharipova, T. A. Demina, Y. N. Osin, D. R. Yarullina, O. N. Ilinskaya, Y. M. Lvov and R. F. Fakhrullin, Chem. Commun., 2013, 49, 4208–4210 RSC.
- V. Berry, A. Gole, A. Kundu, C. J. Murphy and R. F. Saraf, J. Am. Chem. Soc., 2005, 127, 17600–17601 CrossRef CAS PubMed.
- R. Kempaiah, W. L. Chung and V. Maheshwari, ACS Nano, 2011, 5(7), 6025–6031 CrossRef CAS PubMed.
- R. Kempaiah, S. Salgado, W. L. Chung and V. Maheshwari, Chem. Commun., 2011, 47, 11480–11482 RSC.
- S. H. Yang, T. Lee, E. Seo, E. H. Ko, I. S. Choi and B. S. Kim, Macromol. Biosci., 2012, 12, 61–66 CrossRef CAS PubMed.
- V. Maheshwari, D. E. Fomenko, G. Singh and R. F. Saraf, Langmuir, 2009, 26, 371–377 CrossRef PubMed.
- A. S. Mao, J.-W. Shin, S. Utech, H. Wang, O. Uzun, W. Li, M. Cooper, Y. Hu, L. Zhang, D. A. Weitz and D. J. Mooney, Nat. Mater., 2016, 16, 236–243 CrossRef PubMed.
- J. Y. Kim, B. S. Lee, J. Choi, B. J. Kim, J. Y. Choi, S. M. Kang, S. H. Yang and I. S. Choi, Angew. Chem., Int. Ed., 2016, 55, 15306–15309 CrossRef CAS PubMed.
- J. Niu, D. J. Lunn, A. Pusuluri, J. I. Yoo, M. A. O'Malley, S. Mitragotri, H. T. Soh and C. J. Hawker, Nat. Chem., 2017, 9, 537–545 CrossRef CAS PubMed.
- D. Hong, H. Lee, E. H. Ko, J. Lee, H. Cho, M. Park, S. H. Yang and I. S. Choi, Chem. Sci., 2015, 6, 203–208 RSC.
- H. Lee, D. Hong, J. Y. Choi, J. Y. Kim, S. H. Lee, H. M. Kim, S. H. Yang and I. S. Choi, Chem.– Asian J., 2015, 10, 129–132 CrossRef CAS PubMed.
- J. H. Park, I. S. Choi and S. H. Yang, Chem. Commun., 2015, 51, 5523–5525 RSC.
- S. H. Yang, K. B. Lee, B. Kong, J. H. Kim, H. S. Kim and I. S. Choi, Angew. Chem., Int. Ed., 2009, 48, 9160–9163 CrossRef CAS PubMed.
- S. H. Yang, E. H. Ko, Y. H. Jung and I. S. Choi, Angew. Chem., Int. Ed., 2011, 50, 6115–6118 CrossRef CAS PubMed.
- W. S. Kuo, C. M. Wu, Z. S. Yang, S. Y. Chen, C. Y. Chen, C. C. Huang, W. M. Li, C. K. Sun and C. S. Yeh, Chem. Commun., 2008, 4430–4432, 10.1039/b808871c.
- J. H. Park, K. Kim, J. Lee, J. Y. Choi, D. Hong, S. H. Yang, F. Caruso, Y. Lee and I. S. Choi, Angew. Chem., Int. Ed., 2014, 53, 12420–12425 CAS.
- P. V. Cherepanov, M. A. Rahim, N. Bertleff-Zieschang, M. A. Sayeed, A. P. O'Mullane, S. E. Moulton and F. Caruso, ACS Appl. Mater. Interfaces, 2018, 10, 5828–5834 CrossRef CAS PubMed.
- J. Guo, Y. Ping, H. Ejima, K. Alt, M. Meissner, J. J. Richardson, Y. Yan, K. Peter, D. von Elverfeldt, C. E. Hagemeyer and F. Caruso, Angew. Chem., Int. Ed., 2014, 53, 5546–5551 CrossRef CAS PubMed.
- W. Zhu, J. Guo, S. Amini, Y. Ju, J. O. Agola, A. Zimpel, J. Shang, A. Noureddine, F. Caruso, S. Wuttke, J. G. Croissant and C. J. Brinker, Adv. Mater., 2019, 31, 1900545 CrossRef PubMed.
- K. M. Bromley, A. J. Patil, A. W. Perriman, G. Stubbs and S. Mann, J. Mater. Chem., 2008, 18, 4796–4801 RSC.
- C. E. Fowler, W. Shenton, G. Stubbs and S. Mann, Adv. Mater., 2001, 13, 1266–1269 CrossRef CAS.
- A. M. Wen and N. F. Steinmetz, Chem. Soc. Rev., 2016, 45, 4074–4126 RSC.
- W. C. Records, Y. Yoon, J. F. Ohmura, N. Chanut and A. M. Belcher, Nano Energy, 2019, 58, 167–174 CrossRef CAS.
- P. Kramberger, M. Ciringer, A. Strancar and M. Peterka, Virol. J., 2012, 9, 265 CrossRef CAS PubMed.
- Z. Szakacs, T. Meszaros, M. I. de Jonge and R. E. Gyurcsanyi, Nanoscale, 2018, 10, 13942–13948 RSC.
- M. Gast, H. Sobek and B. Mizaikoff, Hum. Gene Ther: Methods., 2019, 30, 235–244 CrossRef CAS PubMed.
- S. Chatterjee, R. Molenaar, L. Tromp, R. M. Wagterveld, H. D. W. Roesink, J. Cornelissen, M. Claessens and C. Blum, Methods Appl. Fluoresc., 2021, 9, 025001 CrossRef CAS PubMed.
- L. Yang and T. Yamamoto, Front. Microbiol., 2016, 7, 1500 Search PubMed.
- Y. Horiguchi, T. Goda, A. Matsumoto, H. Takeuchi, S. Yamaoka and Y. Miyahara, Langmuir, 2019, 35, 1798–1806 CrossRef CAS PubMed.
- F. Akpinar and J. Yin, J. Virol. Methods, 2015, 218, 71–76 CrossRef CAS PubMed.
- K. Zhou, L. Li, Z. Tan, A. Zlotnick and S. C. Jacobson, J. Am. Chem. Soc., 2011, 133, 1618–1621 CrossRef CAS PubMed.
- S. T. Lance, D. J. Sukovich, K. M. Stedman and A. R. Abate, Virol. J., 2016, 13, 201 CrossRef PubMed.
- C. P. Brussaard, Appl. Environ. Microbiol., 2004, 70, 1506–1513 CrossRef CAS PubMed.
- R. Lonsdale, M. G. Pau, M. Oerlemans, C. Ophorst, A. Vooys, M. Havenga, J. Goudsmit, F. UytdeHaag and G. Marzio, J. Virol. Methods, 2003, 110, 67–71 CrossRef CAS PubMed.
- D. Ozcelik, A. Jain, A. Stambaugh, M. A. Stott, J. W. Parks, A. Hawkins and H. Schmidt, Sci. Rep., 2017, 7, 12199 CrossRef PubMed.
- D. Ozcelik, J. W. Parks, T. A. Wall, M. A. Stott, H. Cai, J. W. Parks, A. R. Hawkins and H. Schmidt, Proc. Natl. Acad. Sci. U. S. A., 2015, 112, 12933–12937 CrossRef CAS PubMed.
- J. E. Dick, A. T. Hilterbrand, A. Boika, J. W. Upton and A. J. Bard, Proc. Natl. Acad. Sci. U. S. A., 2015, 112, 5303–5308 CrossRef CAS PubMed.
- H. Liang, B. Zhou, D. Wu, J. Li and B. Li, Adv. Colloid Interface Sci., 2019, 272, 102019 CrossRef CAS PubMed.
- H. Ejima, J. J. Richardson, K. Liang, J. P. Best, M. P. van Koeverden, G. K. Such, J. Cui and F. Caruso, Science, 2013, 341, 154–157 CrossRef CAS PubMed.
- J. H. Park, A. Boika, H. S. Park, H. C. Lee and A. J. Bard, J. Phys. Chem. C, 2013, 117, 6651–6657 CrossRef CAS.
- X. Xiao and A. J. Bard, J. Am. Chem. Soc., 2007, 129(31), 9610–9612 CrossRef CAS PubMed.
- X. Xiao, F. F. Fan, J. Zhou and A. J. Bard, J. Am. Chem. Soc., 2008, 130, 16669–16677 CrossRef CAS PubMed.
- X. Xiao, S. Pan, J. S. Jang, F. F. Fan and A. J. Bard, J. Phys. Chem. C, 2009, 113, 14978–14982 CrossRef CAS.
- S. J. Kwon and A. J. Bard, J. Am. Chem. Soc., 2012, 134, 7102–7108 CrossRef CAS PubMed.
- S. J. Kwon, F. F. Fan and A. J. Bard, J. Am. Chem. Soc., 2010, 132(38), 131265–113167 CrossRef PubMed.
- E. J. Stuart, N. V. Rees, J. T. Cullen and R. G. Compton, Nanoscale, 2013, 5, 174–177 RSC.
- E. J. Stuart, K. Tschulik, D. Omanovic, J. T. Cullen, K. Jurkschat, A. Crossley and R. G. Compton, Nanotechnology, 2013, 24, 444002 CrossRef CAS PubMed.
- E. J. E. Stuart, Y.-G. Zhou, N. V. Rees and R. G. Compton, RSC Adv., 2012, 2, 6879–6884 RSC.
- N. V. Rees, Electrochem. Commun., 2014, 43, 83–86 CrossRef CAS.
- J. C. Lees, J. Ellison, C. Batchelor-McAuley, K. Tschulik, C. Damm, D. Omanovic and R. G. Compton, ChemPhysChem, 2013, 14, 3895–3897 CrossRef CAS PubMed.
- S. V. Sokolov, S. Eloul, E. Katelhon, C. Batchelor-McAuley and R. G. Compton, Phys. Chem. Chem. Phys., 2016, 19, 28–43 RSC.
- W. Cheng and R. G. Compton, TrAC, Trends Anal. Chem., 2014, 58, 79–89 CrossRef CAS.
- D. Qiu, S. Wang, Y. Zheng and Z. Deng, Nanotechnology, 2013, 24, 505707 CrossRef PubMed.
- D. Wakerley, A. G. Guell, L. A. Hutton, T. S. Miller, A. J. Bard and J. V. Macpherson, Chem. Commun., 2013, 49, 5657–5659 RSC.
- H. Zhou, F.-R. F. Fan and A. J. Bard, J. Phys. Chem. Lett., 2010, 1, 2671–2674 CrossRef CAS.
- A. Boika, S. N. Thorgaard and A. J. Bard, J. Phys. Chem. B, 2013, 117, 4371–4380 CrossRef CAS PubMed.
- K. R. Short, D. A. Diavatopoulos, R. Thornton, J. Pedersen, R. A. Strugnell, A. K. Wise, P. C. Reading and O. L. Wijburg, J. Infect. Dis., 2011, 204, 1857–1865 CrossRef CAS PubMed.
- P. Terejanszky, I. Makra, P. Furjes and R. E. Gyurcsanyi, Anal. Chem., 2014, 86, 4688–4697 CrossRef CAS PubMed.
- T. Ahmad, J. Nanotechnol., 2014, 2014, 1–11 CrossRef.
- I. Makra and R. E. Gyurcsányi, Electrochem. Commun., 2014, 43, 55–59 CrossRef CAS.
- P. Terejánszky, I. Makra, A. Lukács and R. E. Gyurcsányi, Electroanalysis, 2015, 27, 595–601 CrossRef.
| This journal is © The Royal Society of Chemistry 2022 |