 Open Access Article
Creative Commons Attribution 3.0 Unported Licence
Structural evolution of carbon dots during low temperature pyrolysis†
Hui
Luo
 ab,
Leonardo
Lari
c,
Hyunjeong
Kim
d,
Servann
Hérou
 a,
Liviu Cristian
Tanase
e,
Vlado K.
Lazarov
c and
Maria-Magdalena
Titirici
 *a
*a
aDepartment of Chemical Engineering, Imperial College Road, Kensington, London, SW7 2AZ, UK. E-mail: m.titirici@imperial.ac.uk
bSchool of Engineering and Materials Science, Queen Mary University of London, Mile End Road, London, E1 4NS, UK
cDepartment of Physics, University of York, Heslington, York YO10 5DD, UK
dNational Institute of Advanced Industrial Science and Technology, Tsukuba-West, 16-1 Onogawa, Tsukuba, Ibaraki 305-8569, Japan
eNational Institute of Materials Physics, Atomiştilor 405A, 077125 Măgurele-Ilfov, Romania
First published on 25th December 2021
Abstract
Carbon dots (CDs) are an emerging class of photoluminescent material. Their unique optical properties arise from the discrete energy levels in their electronic states, which directly relate to their crystalline and chemical structure. It is expected that when CDs go through structural changes via chemical reduction or thermal annealing, their energy levels will be altered, inducing unique optoelectronic properties such as solid-state photoluminescence (PL). However, the detailed structural evolution and how the optoelectronic characteristics of CDs are affected remain unclear. Therefore, it is of fundamental interest to understand how the structure of CDs prepared by hydrothermal carbonisation (HTC) rearranges from a highly functionalised disordered structure into a more ordered graphitic structure. In this paper, detailed structural characterisation and in situ TEM were conducted to reveal the structural evolution of CDs during the carbonisation process, which have demonstrated a growth in aromatic domains and reduction in oxidation sites. These structural features are correlated with their near-infrared (NIR) solid-state PL properties, which may find a lot of practical applications such as temperature sensing, solid-state display lighting and anti-counterfeit security inks.
Introduction
CDs are emerging luminescent nanomaterials for energy, bio-imaging, optoelectronic and catalysis applications.1–5 In particular, CDs resemble semiconductor materials with small energy gaps, excellent luminescence properties and high carrier mobilities and concentrations, making them good candidates to replace the more traditional materials such as semiconductor quantum dots and graphene. Thermally treated CDs have recently emerged as electrode materials for various applications such as supercapacitors,6 batteries,7 electrocatalysts,8 as well as NIR emitting ink materials for security applications.9,10CDs structure contains saturated sp3 carbon atoms bound to oxygen, as well as conjugated sp2 carbon atoms forming graphene flakes. Generally speaking, these complexed structures govern the optical properties of the CDs, which may arise from the π-conjugated core, dopant containing functional groups and/or fluorescent molecules attached to the surface.11–13 While current research has primarily focused on understanding the structure of pristine CDs for direct utilisation,14 understanding their structural evolution during thermal treatment is lacking in the literature. This is important if thermally treated CDs materials are to be applied for the above-mentioned applications, as the necessary insight into the graphitisation process and in changing the oxygen functionalities may provide guidance for designing carbon materials with well-defined chemical and electronic structures. For example, the structural transition via chemical or thermal annealing leading in gradual oxygen removal can alter their electronic structure and energy gaps,11,15,16 inducing unique optoelectronic properties such as solid-state PL.
Herein, in this paper, a set of freshly hydrothermally prepared CDs from glucose at 200 °C for 12 h were further carbonised under an inert atmosphere at different temperatures to produce different degree of graphitisation and tune their oxygenated states. Structural analysis by ex situ transmission electron microscopy (TEM), X-ray diffraction (XRD) and Raman spectroscopy has revealed that all of the nanostructured CD materials exhibit local-range crystallinity but lack of long-range order (i.e. high crystallinity). While these traditional approaches are insightful, it is difficult to reveal local atomic structures.17 Thus, we have employed the atomic pair distribution function (PDF) derived from synchrotron based high-energy X-ray total scattering to probe the average nano-crystalline structure evolution process.18 This function gives a measure of the probability of finding atom pairs located by certain distance and is sensitive to local structure.19,20 Fourier-transform infrared spectroscopy (FTIR) and X-ray photon spectroscopy (XPS) were then conducted to investigate the different characteristics involving oxygen species at each annealing stage. Dynamical in situ TEM was further applied to study structural changes during carbonisation. Combining findings from multiple experimental methods and their interpretation by both ex situ and in situ methods, a “complex model”19 is then proposed to unveil the structural evolution of CDs under thermal treatment. The solid-state PL of CDs at different carbonisation stage was investigated, which may arise from the phosphorescence induced by electron transition in narrowed energy gap between excited singlet S1 and triplet T1 states, as a result of higher graphitisation degree and oxidation densities, but the correlation with structural evolution needs further investigation. The correlation between pyrolysis temperature and physico–chemical properties should guide further development of CDs applications such as forming conductive electrode materials for electrochemical applications,6 inducing distinctive optical properties for security applications, such as solid-state display lighting and security inks.9
Results and discussion
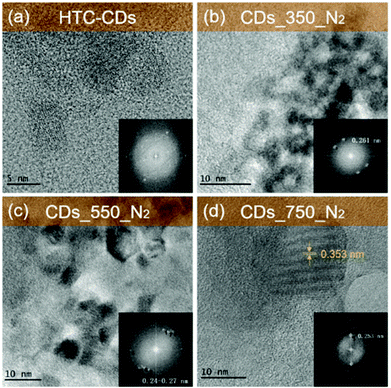
CDs were prepared via hydrothermal carbonisation of glucose in water at 200 °C for 12 hours,21 denoted as HTC-CDs. Detailed characterisation on this sample can be found in our previous published work.22 Further carbonisation under different temperatures at 350 °C, 550 °C and 750 °C in N2 atmosphere was carried out to investigate the structural evolution of the CDs. The samples presented in this work are denoted CDs_350_N2, CDs_550_N2, CDs_750_N2, respectively.The ex situ TEM images of the HTC and pyrolyzed CDs shown in Fig. 1 display the presence of crystalline regions in all samples. The spots in the diffraction patterns (insets in Fig. 1) suggest that crystallisation/graphitisation is present in all specimens. With increasing temperature, the CDs become more crystalline, especially in CDs_750_N2 sample, where highly ordered lattice fringes with d-spacing at 0.353 nm can be seen, corresponding to extended graphitic (002) crystal planes.23
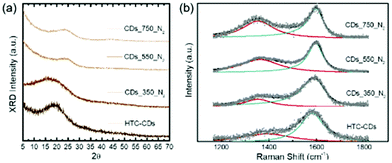
XRD and Raman spectroscopy are employed to study the crystallinity in the above-mentioned samples. The XRD pattern (Fig. 2a) of the original HTC-CDs displays a single broad peak centered around 21° indicating a low level of structural ordering in the sample. The peak corresponds to a set of sp2 carbons-graphitic carbons with stacking faults, known as turbostratic carbons.24 When the annealing temperature reaches 550 °C, the peak showed a shift towards 2θ = 25°, corresponding to (002) crystal plane of graphitic carbon, and indicates a decrease in the average interlayer spacing.25 This is probably attributed to the removal of functional groups at higher temperature which increased the molecular orientation.
The spectrum of CD_750C_N2 displays a second peak at 2θ = 43° related to two-dimensional order in graphene-like regions and therefore may be assigned to the (100) reflection of a graphene plane, suggesting a higher degree of crystallization.1 The evolution in XRD patterns with temperature reveals that annealing process makes the graphitic planes grow larger as well as more ordered, consistently with the observations from TEM images (Fig. 1). The broadness and low intensity of the (002) and (100) peaks compared to the background suggests the topological distortion still remains at a significant level. Thus, only a small fraction of carbon is located in graphene like clusters that have sufficiently high orders to contribute to an electron diffraction peak. The majority of carbon atoms is assumed to be in a more disordered, amorphous environment/state and in small, distorted aromatic clusters.26
Raman spectroscopy provides a measure of disorder in the carbon bonding network27 and is a convenient tool to study the structure of carbon materials with low long-range order. Completely graphitized carbons present two prominent spectral features: a characteristic G band originated from the stretching of sp2 carbon atoms, and a dispersive D band, which is activated by structural disorder and defects and sp3 coordination. The Raman spectra of all CD samples were fitted with a combination of Lorentzian + Breit Wigner Fano (BWF) line pair (Fig. 2b). The strength of this combination is the better fit quality, and it enables fitting spectra of different shapes with the same set of functions.26 The ID/IG ratios were calculated from peak heights28 and the results were summarised in Table 1.
| Samples | D band position (cm−1) Lorentzian/FWHM | G band position (cm−1) BWF/FWHM | I D/IG |
|---|---|---|---|
| HTC-CDs | 1357/156 | 1583/65 | 0.19 |
| CD_350_N2 | 1355/135 | 1595/58 | 0.27 |
| CD_550_N2 | 1364/200 | 1599/39 | 0.46 |
| CD_750_N2 | 1355/160 | 1604/39 | 0.61 |
Compared to the original HTC-CDs sample, annealing leads to an increase of the D peak intensity and a shift of the G peak position to higher wave numbers. This is in accordance with increasing order of the carbon phase in stage 2 of the Ferrari-Robertson model, which describes the transition between amorphous carbon and nanocrystalline graphite.28 This behaviour is a result of stronger clustering of sp2 carbon in aromatic rings (ID/IG ratio) and a shortening of the average C![[double bond, length as m-dash]](https://www.rsc.org/images/entities/char_e001.gif) C distance with higher vibration frequency (G peak shifts).26 The development of D band stems from the increased amount of six-fold aromatic rings clustering in small regions, creating distortion in the long-range order. The full width at half maximum (FWHM) of G peaks decrease with increasing order, according to the lower bonding-angle distortion.26,29
C distance with higher vibration frequency (G peak shifts).26 The development of D band stems from the increased amount of six-fold aromatic rings clustering in small regions, creating distortion in the long-range order. The full width at half maximum (FWHM) of G peaks decrease with increasing order, according to the lower bonding-angle distortion.26,29
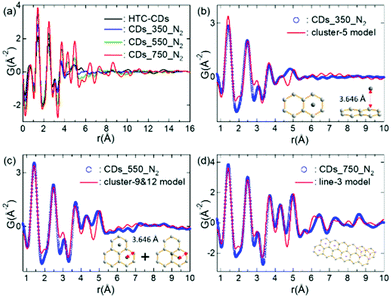
The X-ray PDFs for the CDs annealed at different temperature are derived from the Fourier transform of the background signal corrected, baseline normalised total scattering data (Fig. 3a). The spectra plotted over a wide interatomic distance range can be found in Fig. S1 (ESI†). All samples display sharp peaks at the low-r region, with only HTC-CDs showing some fluctuation above 20 Å. As these fluctuations indicate the presence of largely amorphous domains, it might correspond to some unreacted glucose residues or water molecules re-crystallized and have been removed during carbonisation process. The spectra of CDs_350_N2 and HTC-CDs are quite similar with peaks only up to 5.5 Å, indicating similar structural arrangements. The PDF peaks of CDs_550_N2 sample also appear only up to 5.5 Å, however, the peak shapes have become sharper and show higher intensity, especially at ∼4.3 Å and ∼5 Å. By further annealing to 750 °C, CDs showed intermediate ordering, with peaks up to 12 Å and even higher intensity. Variation in the peak positions and intensities of particular correlations in the PDFs reflect subtle changes in the short-and intermediate-range order of annealed CD structure. The increased peak intensity and longer range signals occurred with high temperature treatment are attributable, in part, to an ordering phenomenon involving structural rearrangement of basic structural units and the local molecular orientation occurrence.30,31 The peak positions corresponding to interatomic distances within the CDs structure are well-matched to those in graphene fragments.32 With increasing r, the PDF peaks became dampening, indicating the presence of structural disorder. In addition, the absence of peaks that corresponds to graphene-sheet interlayer distances suggests that the disorder is turbostratic, in line with the XRD results.33
The experimental PDF spectra of different CDs are simulated with cluster models. Aromatic clusters with various sizes and shapes were cut from the graphite structural model shown in Fig. S2,† and the corresponding PDFs were calculated. Fig. 3b–d show the best cluster models that reproduce the experimental PDF features.32 These results indicate that with increasing annealing temperature, the carbon backbones of HTC-CDs are mostly preserved up to 350 °C. Further annealing to 550 °C results in higher concentration of aromatic clusters, but their sizes are not expanded significantly. When temperature reaches 750 °C, a rapid growth of graphitic planes takes place, which results in an ordering of intermediate ranges. No obvious peaks beyond 12 Å give the indication of disorder within the structure, which possibly arises from a combination of sheet curvature and termination of the carbon fragments.32 These observations are in line with the TEM, XRD and Raman results. However, to thoroughly understand the experimental PDF data, further investigation to couple with materials dynamic simulation will need to be carried out.34
As functional groups are known to alter the emission mechanism of CDs,22 FTIR and XPS spectra were used to detect the presence of oxygenated sites on the surface of the CDs.
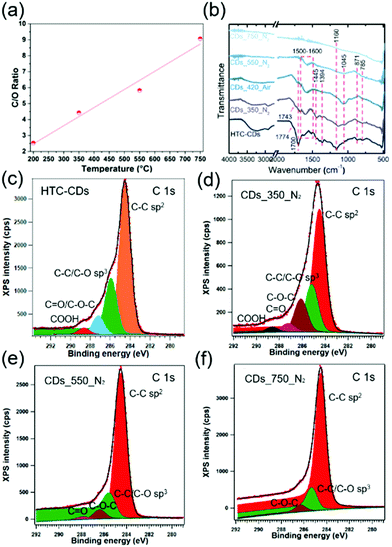
The transformation of glucose under hydrothermal conditions produces CDs with relatively high amounts (20–40 wt%) oxygen functionalities.21,35 The CDs chemical composition was calculated from the XPS results and presented in Fig. 4a. The C/O ratio in all CD samples follows a linear relation with increasing carbonisation temperature, where higher carbonisation temperature brings lower percentage of O atoms (18.0, 14.1 and 9.7 at% for CDs_350_N2, CDs_550_N2 and CDs_750_N2, respectively), confirms that increasing temperature would results in less oxidised sites. The FTIR spectra coupled with the deconvolution of XPS spectra show that HTC-CDs exhibit more chemical states (see Table 2 for the corresponding wavelength and binding energies). Because of the unreacted glucose residues conjugated at the CDs surface, as indicated from the fluctuation about 20 Å in PDF, the surface sensitive XPS showed higher contents of C–C sp2 and C–C/C–O sp3, results in a lower content of C–O–C/C![[double bond, length as m-dash]](https://www.rsc.org/images/entities/char_e001.gif) O bonds. At the low annealing temperature of 350 °C, the glucose residues are removed, yet most of these functional groups are retained in CD_350_N2 (Fig. 4b–d). However, a further increase in annealing temperature decreases the number of functionalities. Ketone (∼1750 cm−1) and carboxylic acid groups (1700 and 1394 cm−1) decompose first between 350 and 550 °C as the corresponding peaks disappear on the FTIR and XPS spectra (Fig. 4b–f). The same case happened with C–H from aliphatic bridge structure at 1445 cm−1, which disappeared at 550 °C in FTIR. Other bonds, such as the C–H alkane bonds at 871 cm−1 and 785 cm−1, and C–O/C–OH from lactone bridges at 1045 cm−1, gradually disappeared during temperature increase between 550 °C and 750 °C.36 The dramatic decrease of hydroxyl/epoxy group percentage and carbonyl/carboxyl groups drop towards 0 in XPS spectra of CDs_550_N2 sample has further confirmed it.37–39 At 750 °C, most of the functional groups have decomposed. The carbon matrix highly absorbs IR and display a nearly flat line in FTIR. Solely the more stable C–O–C bonds are retained as shown on the FTIR (1160 cm−1) and XPS spectra. The slight shift of the C–O–C bonds towards lower wavelength number on the FTIR is characteristic of the chemical environment changes with increased temperature as the carbon matrix becomes more condensed. This transformation is coupled with the more pronounced peaks at 1500–1600 cm−1 stem from C
O bonds. At the low annealing temperature of 350 °C, the glucose residues are removed, yet most of these functional groups are retained in CD_350_N2 (Fig. 4b–d). However, a further increase in annealing temperature decreases the number of functionalities. Ketone (∼1750 cm−1) and carboxylic acid groups (1700 and 1394 cm−1) decompose first between 350 and 550 °C as the corresponding peaks disappear on the FTIR and XPS spectra (Fig. 4b–f). The same case happened with C–H from aliphatic bridge structure at 1445 cm−1, which disappeared at 550 °C in FTIR. Other bonds, such as the C–H alkane bonds at 871 cm−1 and 785 cm−1, and C–O/C–OH from lactone bridges at 1045 cm−1, gradually disappeared during temperature increase between 550 °C and 750 °C.36 The dramatic decrease of hydroxyl/epoxy group percentage and carbonyl/carboxyl groups drop towards 0 in XPS spectra of CDs_550_N2 sample has further confirmed it.37–39 At 750 °C, most of the functional groups have decomposed. The carbon matrix highly absorbs IR and display a nearly flat line in FTIR. Solely the more stable C–O–C bonds are retained as shown on the FTIR (1160 cm−1) and XPS spectra. The slight shift of the C–O–C bonds towards lower wavelength number on the FTIR is characteristic of the chemical environment changes with increased temperature as the carbon matrix becomes more condensed. This transformation is coupled with the more pronounced peaks at 1500–1600 cm−1 stem from C![[double bond, length as m-dash]](https://www.rsc.org/images/entities/char_e001.gif) C groups in FTIR,40 and the sharper peaks with a broader asymmetric tail towards higher binding energy for C
C groups in FTIR,40 and the sharper peaks with a broader asymmetric tail towards higher binding energy for C![[double bond, length as m-dash]](https://www.rsc.org/images/entities/char_e001.gif) C groups in XPS, which indicate that larger sp2 carbon domains form with increasing temperature.40 These results are consistent with the PDF model of CDs_750_N2, further proves the enlargement of the graphitic fragment during annealing process. However, still more than 10% sp3 carbon atoms exist in CD_750_N2, suggesting a graphitisation process with considerable disorder in the structure, in agreement with the changes in the Raman spectra.
C groups in XPS, which indicate that larger sp2 carbon domains form with increasing temperature.40 These results are consistent with the PDF model of CDs_750_N2, further proves the enlargement of the graphitic fragment during annealing process. However, still more than 10% sp3 carbon atoms exist in CD_750_N2, suggesting a graphitisation process with considerable disorder in the structure, in agreement with the changes in the Raman spectra.
| Samples | C–C sp2 | C–C/C–O sp3 | C–O–C | C![[double bond, length as m-dash]](https://www.rsc.org/images/entities/char_e001.gif) O O |
COOH |
|---|---|---|---|---|---|
| FTIR wavelength (cm−1) | 1500–1600 | 1045 | 1160 | ∼1750 | 1700, 1394 |
| XPS binding energy (eV) | 284.6 | 285.2 | 286.1 | 287.2 | 288.6 |
| HTC-CDs | 66% | 23% | 8% | 3% | |
| CD_350_N2 | 56% | 23% | 15% | 4% | 2% |
| CD_550_N2 | 82% | 11% | 5% | 1% | 0% |
| CD_750_N2 | 83% | 13% | 4% | 0% | 0% |
Another observation is that in O 1s spectra (Fig. S3†) all the signals from carbon–oxygen bonds have shifted towards higher binding energy, as listed in Table S1.† It is considered that the respective atoms are more positively charged, which can be assigned to the changes of oxygen chemical environment in the sample. At higher temperatures, the volatilization process leads to the disappearance of some carbon atoms, mainly the ones connected with oxygen. In this case, the oxygen atoms also vanish with them, mainly from lower binding energy, while the oxygen with higher binding energy will preserve, therefore the overall average binding energy shifts towards higher values. The changes in structure and oxidation sites consequently impact the PL properties as discussed later in this paper.
The ex situ characterisations of the different CD samples presented above are indicative of the graphitization process and changes in the oxygenated functional groups induced by thermal treatment. To visualise the structural evolution during pyrolysis, the morphology and structure of CDs were investigated with dynamical high-resolution in situ TEM,41 which enables to observe continuously the carbonisation process of CDs. An overview of the structural changes of the amorphous matrix containing CDs can be seen in Fig. S4,† which demonstrates the higher crystallisation degree in CDs structure during the carbonisation process from room temperature to 750 °C. The digital diffractograms (insets in the Fig. S4†) show a very weak diffraction patterns at room temperature. Upon heating to 750 °C, the same area displays highly crystalline features, indicating the structural evolution of CDs from semi-crystalline structure within amorphous matrix towards crystalline CDs with graphitic structure, consistent with the observation from ex situ TEM and XRD results.
During the first stage, temperature was increased from room temperature to 350 °C at a ramping rate of 20 °C min−1 and held at 350 °C for several minutes. No obvious changes were observed from the area of interest (Fig. S5 and Movie S1†), suggesting that under 350 °C, the structure of CDs remains the same as the pristine HTC-CDs. This is in line with the ex situ structural analysis results, which have shown that the functional groups on the CDs are retained, as well as the degree of disorder.
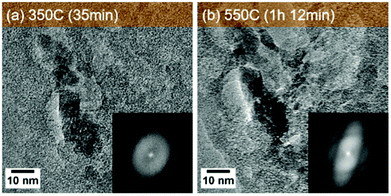
The structural changes start occurring when the temperature increased to 550 °C at the time of 1 h 12 min, where the same area starts to show crystalline diffraction patterns (Fig. 5 and Movie S2†). At this stage, according to FTIR, most of the functional groups have decomposed, leaving the C atoms to go through thermal dynamic rearrangements to form stable and ordered structures, as can be deduced from the narrowed Raman G bands in CDs_550_N2 sample and the slightly larger aromatic clusters with higher concentration derived from the X-ray PDF spectrum.
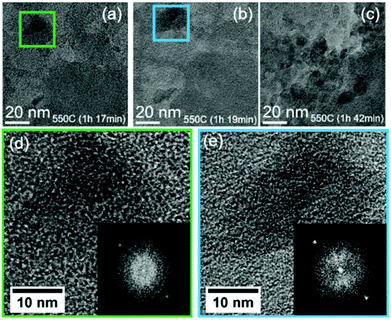
Further holding at the temperature of 550 °C leads to continued graphitisation process, as displayed in Fig. 6, from 1 h 17 min (a) to 19 min (b), some localised area started to show higher degree of graphitised structure, a phenomenon that has increased with time (Fig. 6c).
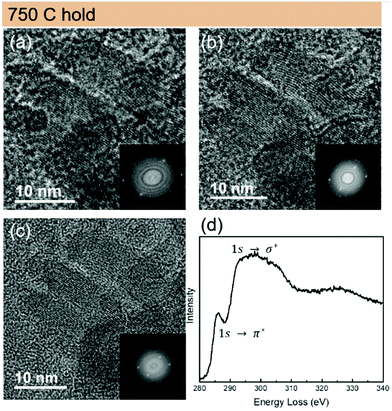
The graphitisation continues rapidly at a higher temperature (750 °C), where from Fig. 7 the pronounced crystalline structure of CDs can be observed. At this stage, nearly all the oxygen groups are gone, as demonstrated by the FTIR and XPS results. Combined with the Raman results, where CDs_750_N2 sample show similar G band as CDs_550_N2 but narrower D band, here we infer that the remaining sp2 C atoms form large graphitic domains, whereas the sp3 C atoms undergo aromatisation to form aromatic domains. The electron energy loss spectroscopy (EELS) Carbon K-edge spectrum of a large area (400 nm in diameter) in Fig. 7 shows a pre-peak at 284 eV (1s → π*) characteristic for the graphite and a broad σ* peak at 293 eV (1s → σ*). The low intensity π* and rather broad σ* peak (typically observed from amorphous carbon materials) suggest that despite of locally graphitized areas the matrix is amorphous and dominates the EELS signal. These results are consistent with the analysis from the PDF data, which indicated non-graphitized amorphous carbon matrix with embedded CDs.
Based on the above observations, we propose the structural evolution process of CDs under thermal treatment in an inert atmosphere. As illustrated in Fig. 8, the structural model at 25 °C represents the chemical structure of the HTC-CDs before any thermal treatment. After HTC process, the surface is covered with various oxygen containing functional groups, and the carboneous core is formed by conjugated sp2 carbons with turbostratic disorder, whose morphology and crystallinity remain unchanged up to 350 °C. Slight changes in the chemical structure take place due to the removal of some HTC residues (glucose and/or water molecules) and alter the functionality and elemental composition. Further increasing the carbonisation temperature to 550 °C leads to the removal of weakly bonded oxygen functional groups and to the ordering of the conjugated sp2 carbon atoms into aromatic clusters. Those clusters have limited sizes but high local molecular orientation, which means those basic structural units are mostly parallel in extended domains as lamellae.31,42 Upon heating to 750 °C, most of the oxygen groups have been removed, the remaining sp3 carbon atoms undergo aromatisation to form small aromatic clusters, resulting in a more disordered structure in the matrix, while the basic structural units continue graphitisation process to form larger graphitic structure, i.e. CDs.43 This process follows the two-stage graphitization process described by Oberlin et al., which demonstrate that the first step eliminates most noncarbon components and initiates formation of an aromatic skeleton consisting of a network of six-membered, planar rings of carbon.44 It is followed by the second step consisting mostly of polymerization and structural rearrangement of the aromatic skeleton towards the thermodynamically stable layered graphitic structure.45
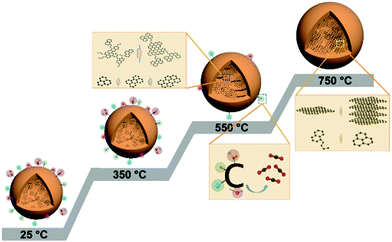 | ||
| Fig. 8 Illustration of structural evolution process of CDs under thermal treatment. The model at 25 °C represents HTC-CDs. | ||
It has been proposed that carbon materials with different band structure modulated by local control of oxidation profiles can induce solid-state PL, thus acting as a useful photonic material when incorporated in solid state devices.46 While there are many reports on solid-state PL properties from various CDs materials, PL intensity tend to gradually decrease due to the aggregation between CDs, resulting from the resonance energy transfer, π–π stacking interaction as well as surface charge.47 Furthermore, their unknown thermal stability also limits their potential applications in the solid-state devices. The current approach to overcome this issue is to incorporate CDs in other matrices such as nanoporous glass,47 Polyvinyl acetate (PVA), Poly(methyl methacrylate) (PMMA), Polyvinylpyrrolidone (PVP) polymers48,49 or microcrystal materials,50 which may need to sacrifice the optical properties of the as-prepared CDs. Therefore, if the CDs material can emit solid-state PL without aggregation quenching and preserve high thermal stability, it is possible to be quickly and massively applied for practical industrial production.
As mentioned before, CDs after carbonisation display distinctive crystalline and oxidation sites characteristics, which is directly linked to their energy gap and is predicted to results in different optical properties. To correlate the physico–chemical properties with their optical properties, we measured the solid-state PL comes from the annealed CDs intrinsically using UV (325 nm) and visible (442 nm) laser irradiation (Fig. 9). It was surprising to find that none of the samples showed fluorescence under 325 nm excitation. When switched to a 442 nm laser, while the original HTC-CDs showed no obvious emission signal, the carbonized samples showed broad peaks, starting from 650 nm (red light range) and extended to the NIR regime. Increasing the carbonization temperature results in a blue-shift of the emission peak. The NIR emission behaviour is similar with the PL property reported in solid graphene oxide (GO), where broad PL suggests a dispersion of hard gaps, which may arise from bond alternation within the GO plane giving rise to interval scattering, and the peak shifting is ascribed to the optical gap change from different oxidization density.46 In our case, we hypothesize that the growth in graphitic domains and changes in local oxidation sites induced by thermal oxygen removal modulates the discrete energy levels within the CDs structure.15 Therefore, we propose that the raise of solid-state PL is induced by phosphorescence. As shown in Fig. 9 insert, upon light excitation, the electron transitions from the ground state (S0) to the first excited singlet state (S1), then towards the triplet state (T1) through inter-system crossing. This transition is generally spin-forbidden in pristine CDs, but the structural evolution via thermal treatment closed the gap between singlet–triplet energy (less than 0.4 eV), thus making this electronic transition possible, resulting in the solid-state PL produced by phosphorescence.51 Because the energy gap between T1 and S0 is smaller than that between S1 and S0, the wavelength emitted through phosphorescence is significantly red-shifted compared to the normal fluorescent emissions (in visible light region).52 The optical properties of all CD samples in diluted solution are also investigated to gain more information about electronic energy transition. As shown in Fig. S6,† compared to the HTC-CDs, which showed clear visible region emission and UV region absorption associated to n → π* transition, the annealed CDs show no distinctive features, possibly due to the low solubility and aggregation in aqueous solution. More systematic investigations are thus needed to better understand the mechanism behind the NIR emission process.
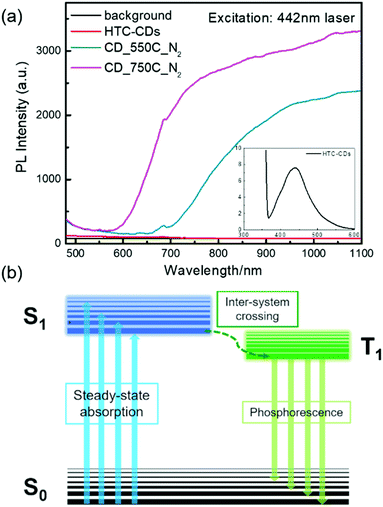 | ||
| Fig. 9 (a) Solid-state PL spectra of all CD samples with 442 nm laser excitation (insert is the visible range emission from HTC-CDs). (b) Electron transition diagram for phosphorescence. | ||
Conclusions
In conclusion, the structural evolution of hydrothermally prepared CDs under thermal treatment was monitored to understand the graphitisation process and the evolution of oxygen functionalities. Structural analysis by ex situ TEM, XRD, Raman, X-ray PDF, FTIR and XPS was conducted, as well as dynamical in situ TEM, to investigate the different characteristics at each annealing stage. The results have shown that, under N2 atmosphere, the morphology and chemical structure of HTC-CDs are stable under 350 °C, while further increasing carbonisation temperature leads to the removal of weakly bonded oxygen functional groups and ordering of the conjugated sp2 carbon atoms into graphitic planes. At 750 °C, most of the oxygen groups have been removed, the remaining sp3 carbon atoms undergo aromatisation to form small aromatic clusters, resulting in a more disordered structure in the matrix, while the graphitic flakes continue graphitisation process to form highly crystalline structure. Such information provides an opportunity to tailor the morphological properties of pyrolyzed CDs for specific technological applications. The optical property of such CDs was also studied, which showed NIR solid-state PL, resemble that of thermally reduced graphene oxide. The distinctive optical properties of annealed CDs may arise from the phosphorescence induced by electron transition in narrowed energy gap between excited singlet S1 and triplet T1 states, which is a result of higher graphitisation degree and oxidation densities, but the correlation with structural evolution needs further investigation. Since the annealed CDs with high thermal stability show optical response without incorporating in other metrices, it is possible to be quickly and massively applied for practical industrial production and find applications in optics and electronics fields.Author contributions
Conceptualization: HL, MMT; Methodology, data curation and formal analysis: LL, HK, SH, LCT; Writing – original draft: HL; Writing – review & editing: HL, VKL, MMT.Conflicts of interest
There are no conflicts to declare.Acknowledgements
H. L. thanks the Chinese government for the award of CSC scholarships, and Dr Andrei Sapelkin for the solid-state PL measurements. H. K. gratefully acknowledges K. Sakaki and A. Machida for help with collecting total scattering data. The synchrotron X-ray experiment was performed using QST experimental station at the JAEA beamlines of BL22XU (Proposal No. 2019B3783) at SPring-8 under the Shared Use Program of JAEA and QST Facilities (Proposal No. 2019B-H21). The use of the JAEA beamline of BL22XU is also supported by JAEA and QST Advanced Characterization Nanotechnology Platform under remit of “Nanotechnology Platform” of MEXT, Japan under Grant No. JPMXP09A19QS0041 (Proposal No. A-19-QS-0041).References
- S. N. Baker and G. A. Baker, Angew. Chem., Int. Ed., 2010, 49, 6726–6744 CrossRef CAS PubMed
.
- R. Wang, K.-Q. Lu, Z.-R. Tang and Y.-J. Xu, J. Mater. Chem. A, 2017, 5, 3717–3734 RSC
.
- G. A. M. Hutton, B. C. M. Martindale and E. Reisner, Chem. Soc. Rev., 2017, 46, 6111–6123 RSC
.
- P. G. Luo, S. Sahu, S.-T. Yang, S. K. Sonkar, J. Wang, H. Wang, G. E. LeCroy, L. Cao and Y.-P. Sun, J. Mater. Chem. B, 2013, 1, 2116–2127 RSC
.
- A. M. M. Hasan, M. A. Hasan, A. Reza, M. M. Islam and M. A. B. H. Susan, Mater. Today Commun., 2021, 29, 102732 CrossRef CAS
.
- G. Chen, S. Wu, L. Hui, Y. Zhao, J. Ye, Z. Tan, W. Zeng, Z. Tao, L. Yang and Y. Zhu, Sci. Rep., 2016, 6, 19028 CrossRef CAS PubMed
.
- F. Xie, Z. Xu, A. C. S. Jensen, F. Ding, H. Au, J. Feng, H. Luo, M. Qiao, Z. Guo, Y. Lu, A. J. Drew, Y. S. Hu and M. M. Titirici, J. Mater. Chem. A, 2019, 7, 27567–27575 RSC
.
- S. Bhattacharyya, B. Konkena, K. Jayaramulu, W. Schuhmann and T. K. Maji, J. Mater. Chem. A, 2017, 5, 13573–13580 RSC
.
- K. Jiang, Y. Wang, C. Cai and H. Lin, Adv. Mater., 2018, 30, 1800783 CrossRef PubMed
.
- Y. Wang, K. Jiang, J. Du, L. Zheng, Y. Li, Z. Li and H. Lin, Nano-Micro Lett., 2021, 13, 198 CrossRef PubMed
.
- M. Langer, M. Paloncýová, M. Medveď, M. Pykal, D. Nachtigallová, B. Shi, A. J. A. Aquino, H. Lischka and M. Otyepka, Appl. Mater. Today, 2021, 22, 100924 CrossRef
.
- J. Liu, R. Li and B. Yang, ACS Cent. Sci., 2020, 6, 2179–2195 CrossRef CAS PubMed
.
- H. Luo, Q. Guo, P. Á. Szilágyi, A. B. Jorge and M.-M. Titirici, Trends Chem., 2020, 2, 623–637 CrossRef CAS
.
- V. Strauss, H. Wang, S. Delacroix, M. Ledendecker and P. Wessig, Chem. Sci., 2020, 11, 8256–8266 RSC
.
- A. Xu, G. Wang, Y. Li, H. Dong, S. Yang, P. He and G. Ding, Small, 2020, 16, 2004621 CrossRef CAS PubMed
.
- A. C. Ferrari, Solid State Commun., 2007, 143, 47–57 CrossRef CAS
.
- C. Bommier, T. W. Surta, M. Dolgos and X. Ji, Nano Lett., 2015, 15, 5888–5892 CrossRef CAS PubMed
.
- V. Petkov, Mater. Today, 2008, 11, 28–38 CrossRef CAS
.
- S. J. L. Billinge and I. Levin, Science, 2007, 316, 561–565 CrossRef CAS PubMed
.
- T. Proffen, S. J. L. Billinge, T. Egami and D. Louca, Z. Kristallogr., 2003, 218, 132–143 CAS
.
- N. Papaioannou, A. Marinovic, N. Yoshizawa, A. E. Goode, M. Fay, A. Khlobystov, M. Titirici and A. Sapelkin, Sci. Rep., 2018, 8, 6559 CrossRef PubMed
.
- H. Luo, N. Papaioannou, E. Salvadori, M. M. Roessler, G. Ploenes, E. R. H. van Eck, L. C. Tanase, J. Feng, Y. Sun, Y. Yang, M. Danaie, A. Belen Jorge, A. Sapelkin, J. Durrant, S. D. Dimitrov and M. M. Titirici, ChemSusChem, 2019, 12, 4432–4441 CrossRef CAS PubMed
.
- Y. Dong, J. Shao, C. Chen, H. Li, R. Wang, Y. Chi, X. Lin and G. Chen, Carbon, 2012, 50, 4738–4743 CrossRef CAS
.
- Z. Q. Li, C. J. Lu, Z. P. Xia, Y. Zhou and Z. Luo, Carbon, 2007, 45, 1686–1695 CrossRef CAS
.
- I. K. Moon, J. Lee, R. S. Ruoff and H. Lee, Nat. Commun., 2010, 1, 73 CrossRef PubMed
.
- C. Adelhelm, M. Balden, M. Rinke and M. Stueber, J. Appl. Phys., 2009, 105, 003522 CrossRef
.
- A. C. Forse, C. Merlet, P. K. Allan, E. K. Humphreys, J. M. Griffin, M. Aslan, M. Zeiger, V. Presser, Y. Gogotsi and C. P. Grey, Chem. Mater., 2015, 27, 6848–6857 CrossRef CAS
.
- A. C. Ferrari and J. Robertson, Phys. Rev. B: Condens. Matter Mater. Phys., 2000, 61, 14095–14107 CrossRef CAS
.
- G. Katagiri, H. Ishida and A. Ishitani, Carbon, 1988, 26, 565–571 CrossRef CAS
.
- F. M. Michel, V. Barrón, J. Torrent, M. P. Morales, C. J. Serna, J. F. Boily, Q. Liu, A. Ambrosini, A. C. Cismasu and G. E. Brown, Proc. Natl. Acad. Sci. U. S. A., 2010, 107, 2787–2792 CrossRef CAS PubMed
.
-
S. Bonnamy and A. Oberlin, in Graphite and Precursors, Gordon and Breach Science Publishers, 2001, pp. 199–220 Search PubMed
.
- J. M. Stratford, P. K. Allan, O. Pecher, P. A. Chater and C. P. Grey, Chem. Commun., 2016, 52, 12430–12433 RSC
.
- J. M. Stratford, A. K. Kleppe, D. S. Keeble, P. A. Chater, S. S. Meysami, C. J. Wright, J. Barker, M. M. Titirici, P. K. Allan and C. P. Grey, J. Am. Chem. Soc., 2021, 143, 14274–14286 CrossRef CAS PubMed
.
- M. Paloncýová, M. Langer and M. Otyepka, J. Chem. Theory Comput., 2018, 14, 2076–2083 CrossRef PubMed
.
- C. Falco, N. Baccile and M.-M. Titirici, Green Chem., 2011, 13, 3273–3281 RSC
.
- Q. Ma, S. Dutta, K. C. W. Wu and T. Kimura, Chem. – Eur. J., 2018, 24, 6886–6904 CrossRef CAS PubMed
.
- A. Ganguly, S. Sharma, P. Papakonstantinou and J. Hamilton, J. Phys. Chem. C, 2011, 115, 17009–17019 CrossRef CAS
.
- M. Wu, Q. Feng, X. Sun, H. Wang, G. Gielen and W. Wu, Sci. Rep., 2015, 5, 10001 CrossRef CAS PubMed
.
- G. P. López, D. G. Castner and B. D. Ratner, Surf. Interface Anal., 1991, 17, 267–272 CrossRef
.
- B. Wang, L. Sun, S. Su, J. Xiang, S. Hu and H. Fei, Energy Fuels, 2012, 26, 1565–1574 CrossRef CAS
.
- J. Sehested, P. L. Hansen, S. Helveg, C. Lo, B. S. Clausen, J. R. Rostrup-nielsen and F. Abild-pedersen, Nature, 2004, 427, 426–429 CrossRef PubMed
.
- W. Ma, J. Reinspach, Y. Zhou, Y. Diao, T. McAfee, S. C. B. Mannsfeld, Z. Bao and H. Ade, Adv. Funct. Mater., 2015, 25, 3131–3137 CrossRef CAS
.
- C. N. S. Kumar, V. S. K. Chakravadhanula, A. Riaz, S. Dehm, D. Wang, X. Mu, B. Flavel, R. Krupke and C. Kübel, Nanoscale, 2017, 9, 12835–12842 RSC
.
-
A. Oberlin, High-resolution TEM studies of carbonization and graphitization, Marcel Dekker, New York, 1989, vol. 22 Search PubMed
.
- P. R. Buseck and O. Beyssac, Elements, 2014, 10, 421–426 CrossRef CAS
.
- Z. Luo, P. M. Vora, E. J. Mele, A. T. C. Johnson and J. M. Kikkawa, Appl. Phys. Lett., 2009, 94, 2007–2010 Search PubMed
.
- Y. Ma, N. Zhang and L. Yang, J. Colloid Interface Sci., 2021, 599, 686–693 CrossRef CAS PubMed
.
- H. Wang, C. Sun, X. Chen, Y. Zhang, V. L. Colvin, Q. Rice, J. Seo, S. Feng, S. Wang and W. W. Yu, Nanoscale, 2017, 9, 1909–1915 RSC
.
- Y. Liu, L. Zhou, Y. Li, R. Deng and H. Zhang, Nanoscale, 2017, 9, 491–496 RSC
.
- A. Zhou, F. Song, W. Yao, Y. Han, F. Song and W. Wu, J. Alloys Compd., 2019, 775, 457–465 CrossRef CAS
.
- W. Zhao, Z. He, J. W. Y. Lam, Q. Peng, H. Ma, Z. Shuai, G. Bai, J. Hao and B. Z. Tang, Chem, 2016, 1, 592–602 CAS
.
- S. Tao, S. Lu, Y. Geng, S. Zhu, S. A. T. Redfern, Y. Song, T. Feng, W. Xu and B. Yang, Angew. Chem., Int. Ed., 2018, 57, 2393–2398 CrossRef CAS PubMed
.
Footnote |
| † Electronic supplementary information (ESI) available. See DOI: 10.1039/d1nr07015k |
| This journal is © The Royal Society of Chemistry 2022 |

