
Fast and recoverable NO2 detection achieved by assembling ZnO on Ti3C2Tx MXene nanosheets under UV illumination at room temperature†
Chao
Fan
,
Jia
Shi
,
Yongwei
Zhang
,
Wenjing
Quan
,
Xiyu
Chen
,
Jianhua
Yang
 *,
Min
Zeng
,
Zhihua
Zhou
,
Yanjie
Su
,
Hao
Wei
and
Zhi
Yang
*
*,
Min
Zeng
,
Zhihua
Zhou
,
Yanjie
Su
,
Hao
Wei
and
Zhi
Yang
*
Key Laboratory of Thin Film and Microfabrication (Ministry of Education), Department of Micro/Nano Electronics, School of Electronic Information and Electrical Engineering, Shanghai Jiao Tong University, Shanghai 200240, P. R. China. E-mail: yangjh08@sjtu.edu.cn; zhiyang@sjtu.edu.cn
First published on 1st February 2022
Abstract
Recently, Ti3C2Tx MXenes have begun to receive attention in the field of gas sensors owing to their characteristics of high conductivity and abundant surface functional groups. However, Ti3C2Tx-based gas sensors still suffer from the drawbacks of low sensitivity and sluggish response/recovery speed towards target gases, limiting their development in further applications. In this work, Ti3C2Tx–ZnO nanosheet hybrids were fabricated through a simple sonication method. The Ti3C2Tx–ZnO nanosheet hybrids exhibited a short recovery time (10 s) under UV (ultraviolet) illumination, a short response time (22 s), a high sensitivity (367.63% to 20 ppm NO2) and selectivity. Furthermore, the Ti3C2Tx–ZnO sensor has prominent anti-humidity properties, as well as superior reproducibility in multiple tests. The abundant active sites in the Ti3C2Tx–ZnO nanosheet hybrids, including surface groups (−F, −OH, −O) of Ti3C2Tx and oxygen vacancies of ZnO, the formation of Schottky barriers between Ti3C2Tx and ZnO nanosheets and the rich photogenerated charge carriers of ZnO under UV illumination, together result in excellent gas-sensing performance. Density functional theory calculations have been further employed to explore the sensing performance of Ti3C2Tx and ZnO nanosheets, showing strong interactions existing between the NO2 and ZnO nanosheets. The main adsorption sites for NO2 were present on the ZnO nanosheets, while the Ti3C2Tx played the role of the conductive path to accelerate the transformation of charge carriers. Our work can provide an effective way for improving the gas-sensing performances of Ti3C2Tx-based gas sensors.
 Jianhua Yang | Dr Jianhua Yang is an Assistant Professor at the Department of Micro/Nano Electronics, Shanghai Jiao Tong University. His degrees are in materials science with a BSc in 2012 from Lanzhou University, an MSc in 2015 with Professor Ying Yu at Central China Normal University, and a PhD in 2018 with Professor Jianfang Wang at The Chinese University of Hong Kong (CUHK). He worked as a postdoctoral researcher at CUHK from 2018 to 2020. His research interests involve the rational design and synthesis of nanomaterials for gas sensors at room temperature, the fabrication of flexible pressure sensors, and plasmonic photocatalysis. |
Introduction
With the acceleration of industrial production and the continued increasing use of automobiles, a large quantity of toxic and harmful gases, such as NO2, SO2 and NO, etc., is discharged into the atmosphere.1,2 Among these harmful gases, NO2 is a toxic gas that mainly damages the respiratory tract of humans.3,4 When people are exposed to an environment containing NO2 gas for serval minutes, they will have symptoms of chest tightness, respiratory distress and cough.5,6 The reported upper exposure limit of NO2 gas concentration for humans is 20 ppm.7 The respiratory tract and nervous system become seriously injured following exposure to NO2 environments above this concentration over long periods of time.8 In addition, the discharge of large amounts of NO2 can lead to the phenomenon of acid rain, which pollutes soil and water environments. Therefore, fast detection of NO2 gas and timely feedback are extremely important for the health of people and of the environment.9–11In recent years, two-dimensional layered material such as graphene,12–15 transition metal dichalcogenide-based materials,16–19 black phosphorus,20–22 MXene,23,24etc., have attracted much attention owing to their great promise as gas sensors at room temperature.25–27 Among these materials, MXene has become a promising candidate for gas-sensitive material that can operate at room temperature because of its low signal-to-noise ratio, rich surface functional groups (–OH, –F, –O) and high electron conductivity.28–30 Ti3C2Tx is one of the earliest discovered MXene materials, which exhibits metallic conductivity, and it has been widely studied in recent years. However, it has remained a major challenge to improve the poor sensitivity and response/recovery speed of Ti3C2Tx MXene-based sensors.
Resistance modulation of Schottky barriers can effectively improve current transport efficiency and induce a high NO2 sensing response.31 In addition, the construction of MXene/metal oxide semiconductor composites has been considered to be an effective method to improve the NO2 sensing properties of Ti3C2Tx MXene-based gas sensors. Since the Ti3C2Tx MXene material displays a layer-like structure, metal oxide semiconductors can easily interact with Ti3C2Tx. For example, Choi et al. developed TiO2/Ti3C2 MXene materials through the in situ oxidation method and tailored the oxidation time to change the number of Schottky barriers. The TiO2/Ti3C2 sensor exhibited higher NO2 sensitivity compared with the bare Ti3C2 MXene material.32 Sun et al. reported Co3O4 nanoparticle-based polyethyleneimine-functionalized Ti3C2Tx MXene sheets, which showed a high gas response and fast response time (below 2 s) towards NO2 gas at room temperature.33 Chen et al. reported that the nanohybrid of SnS2 and MXene-derived TiO2 exhibited a large response and ultra-fast recovery towards NO2 gas.34
ZnO, a typical n-type metal–oxide–semiconductor material, with a wide bandgap of 3.37 eV, excellent chemical stability and rich oxygen vacancies has emerged as a promising gas-sensitive material.35–38 In particular, ZnO or ZnO composite materials have been widely applied as NO2 sensors at room temperature in recent years.39 This is because of the abundant defects and the feasibility of shape control of ZnO.40,41 For example, Moon et al. reported that nanohybrid materials of reduced graphene oxide and ZnO nanorods exhibited ultra-high sensitive detection to 40 ppb of NO2 and a short response/recovery time.42 Hung et al. prepared biaxial p-SnO/n-ZnO nanowire heterostructures with enhanced performance for detection of ppb-level NO2 at room temperature.43 Song et al. produced ZnO nanoflowers by a hydrothermal method, and the fabricated sensor displayed an improved NO2 sensing property (response of 128 to 1 ppm NO2) and a low detection limit (50 ppb).44 To facilitate the recovery speed of the gas sensors, UV illumination has been widely applied and recognized as an effective way to enhance the properties of the recovery characteristics of gas sensors.45,46 The main reason for this is that photogenerated barriers can clean the surface of materials, which can accelerate the desorption process.47 Zheng et al. reported that the InSe nanosheet sensor can achieve rapid and full recovery to NO2 gas within 169 s under UV illumination.48 Zhou et al. presented the Au-MoS2 gas sensor, which achieved better sensing properties, including three times the response and full recovery under illumination compared with that in the dark.49 Wu et al. found that the recovery rate of the p-type MoTe2 gas sensor to different concentrations of NO2 was significantly improved under UV illumination.50 In addition, many studies have shown that ZnO exhibits outstanding NO2 sensing performances under UV illumination because of its excellent optoelectronic properties.51–53 As a result, construction of the Ti3C2Tx–ZnO Schottky junction with the assistance of UV illumination can combine the excellent properties of these two materials, which is expected to result in further enhancement of the NO2 sensing properties.
To the best of our knowledge, most Ti3C2Tx MXene-based NO2 sensors are still unable to achieve the properties of fast response and recovery speed at the same time. Few researchers have reported Ti3C2Tx–ZnO nanosheet hybrid NO2 sensors.54,55 Herein, we propose Ti3C2Tx–ZnO nanosheet hybrids with Schottky barriers for NO2 sensing and recovery under UV illumination. The Ti3C2Tx nanosheets were synthesized using the conventional method of HF solution etching of the Al layer of Ti3AlC2 (MAX). ZnO nanosheets were prepared by hydrothermal and calcination methods, with Zn (CH3COOH)2·2H2O, urea and polyvinylpyrrolidone (PVP) as the precursors. The porous morphology for the ZnO nanosheets was successfully obtained, which is helpful for the adsorption of NO2 gas. With the assistance of UV irradiation in the recovery process, the Ti3C2Tx–ZnO nanosheet-based gas sensor exhibited better NO2 sensing properties, including high sensitivity (367.63% to 20 ppm NO2), shorter response/recovery time (22 s/10 s), excellent repeatability and superior humidity resistance properties, in comparison to pristine Ti3C2Tx and ZnO materials. Density functional theory (DFT) calculations indicated that the main adsorption sites were on the surface of the ZnO nanosheets, with Ti3C2Tx mainly playing the role of the conductive pathway, which can accelerate the transfer efficiency of carriers between Ti3C2Tx and ZnO materials.
Experimental
Synthesis of Ti3C2Tx MXene
Ti3C2Tx MXene nanosheets were fabricated using the previously reported methods.56 Typically, 0.5 g of Ti3AlC2 powder was dispersed in 20 mL HF solution and stirred for 24 h at room temperature. The solution after etching was washed with deionized (DI) water and centrifuged at 8500, 5500 and 3500 rpm, for 5 min each, until the pH of the supernatant reached 6.0. Subsequently, the obtained material was dried at 60 °C overnight in a vacuum drying oven.Synthesis of ZnO nanosheets
ZnO nanosheets were synthesized through a simple hydrothermal and calcination approach. Typically, 1.1 g of Zn (CH3COOH)2·2H2O was dissolved in 40 mL DI water by vigorous stirring for 10 min. Then, 0.6 g urea and 0.2 g PVP (Mw = 58![[thin space (1/6-em)]](https://www.rsc.org/images/entities/char_2009.gif) 000) were added into the solution with stirring for 20 min. Afterwards, the solution was transferred into a 50 mL Teflon-lined autoclave, which was then heated at 120 °C in a furnace for 6 h. Finally, the solution was washed with DI water and ethanol and centrifuged at 8000 rpm for 10 min. After drying in the vacuum furnace at 60 °C for 12 h, the collected powder was calcinated at 450 °C for 2 h with a heating rate of 5 °C min−1.
000) were added into the solution with stirring for 20 min. Afterwards, the solution was transferred into a 50 mL Teflon-lined autoclave, which was then heated at 120 °C in a furnace for 6 h. Finally, the solution was washed with DI water and ethanol and centrifuged at 8000 rpm for 10 min. After drying in the vacuum furnace at 60 °C for 12 h, the collected powder was calcinated at 450 °C for 2 h with a heating rate of 5 °C min−1.
Synthesis of Ti3C2Tx–ZnO nanosheet hybrids
The Ti3C2Tx–ZnO nanosheet hybrids were prepared via a facile sonication method. First, 25 mg of Ti3C2Tx was dispersed in 50 mL DI water and sonicated for 30 min. After that, 10 mg of ZnO nanosheets were added into the above dispersion, followed by sonication for another 30 min at a power of 100 W. Finally, the dispersion was centrifuged six times at 8500 rpm for 5 min with DI water. After drying in a vacuum furnace at 60 °C for 12 h, the Ti3C2Tx–ZnO nanosheet hybrids were collected. The samples of ZnO nanosheets and Ti3C2Tx–ZnO nanosheet hybrids were labeled as ZnO NS and Ti3C2Tx–ZnO NS, respectively.Material characterizations
The morphologies of Ti3C2Tx MXene nanosheets, ZnO NS and Ti3C2Tx–ZnO NS were observed by scanning electron microscopy (SEM, Ultra Plus, Carl Zeiss, Germany), transmission electron microscope (TEM, JEM-2100, JEOL, Japan) and scanning transmission electron microscopy (STEM, JEM-2100, JEOL, Japan). The elemental analysis of Ti3C2Tx–ZnO NS was obtained by energy-dispersive X-ray spectroscopy (EDX) attached to TEM (JEM-2100, JEOL, Japan). The X-ray diffraction (XRD) patterns of samples were analyzed by an X-ray diffractometer (Bruker, Germany) with CuKα radiation (λ = 0.154056 nm) and the 2θ range was 0° to 80° with a scan speed of 5° min−1. The element composition and internal bonding were collected by X-ray photoelectron spectroscopy (XPS, Japan Kratos Axis Ultra DLD, AlKα, 1486.6 eV). Raman spectral results were obtained using a Raman spectrometer with a 532 nm laser as the excitation source (inVia Reflex, RENISHAW, England). The specific surface areas were analyzed by the Brunauer–Emmett–Teller (BET) method based on the nitrogen adsorption–desorption isothermals at 77 K (Micromeritics ASAP 2460, USA).Gas sensor fabrication and sensing measurements
The gas sensor was composed of interdigital electrodes and a thin layer of gas-sensing material. The interdigital electrode consisted of a 180 nm Au layer and 20 nm Ti layer on the Si/SiO2 substrate, as shown in Fig. S1.† In the fabrication process of the layer of gas-sensing material, Ti3C2Tx–ZnO NS were first dispersed in DI water and sonicated for 10 min. Then, 5 μL DI water dispersion-contained materials were dropped onto the electrodes and dried at 60 °C for 2 h in the furnace. SEM images of the bare interdigital electrode and of the electrode covered with gas-sensing materials are shown in Fig. S2a and b.† For the sensing measurements, the gas sensor was put into a chamber and the gas-sensing performance was tested through the gas-sensing system. The signal was obtained using an Agilent 4156 C, which maintained a voltage of 0.5 V during the testing process. The flow rate of the gas was adjusted by the mass flow controllers (MFCs). The concentration of gas was changed using the mixer, which can mix the target gas with carrier air. For selectivity tests of the gas sensor, the standard NO2 gas cylinder was replaced by a corresponding standard gas cylinder, including CO2, H2, NH3 and hexanal. The effect of humidity on the gas sensor was tested on a simple home-made gas-line system as shown in Fig. S3† ranging from 0% to 80% relative humidity (RH). The response of the gas sensor is defined as Rs = |Rg − Ra|/Ra × 100%, where Ra is the resistance value of the gas sensor after stabilization in air and Rg is the resistance value of the gas sensor after exposure in NO2 for a time. In the experiments, the wavelength of UV light-emitting diode (LED) light adopted was 365 nm. The distance between the gas sensor and UV LED light was 4 cm and the power of the UV LED light was 0.15 W. The selected light intensity was fixed at 3 mW cm−2.DFT calculations
The interactions between electrons and ions were examined using the projector augmented wave pseudopotentials.57 The geometry relaxation, electronic calculations and the self-consistent field calculations of the Ti3C2Tx and ZnO nanosheets were completed using DFT and operated in the Vienna ab initio simulation package.58,59 The DFT-D3 correction method was considered to describe the van der Waals interactions between the gas molecules and the substrate.60 The Perdew–Burke–Ernzerhof function within the generalized gradient approximation analysis was conducted to assess the exchange–correlation function.61 A plane-wave basis set with a cut-off energy of 450 eV was used to expand the one-electron wave function.62 The periodic structure of a 3 × 3 × 1 supercell of Ti3C2Tx and ZnO with a vacuum thickness of 15 Å was used to simulate the interface of Ti3C2Tx and ZnO. A 3 × 3 × 1 k-grid mesh sampling was used for geometry optimization, which was used for calculating the electronic structure to obtain a more precise result. All the calculations were carried out until the energy and the Hellmann–Feynman force reached the convergence criteria of 10−6 and 0.01 eV Å−1, respectively. The Bader charge analysis developed by Henkelman was used to analyze the charge transfer between the gas molecule and the substrate materials.63Results and discussion
The schematic diagram displayed in Fig. 1 illustrates the etching and subsequent sonication process for preparing Ti3C2Tx–ZnO NS and the corresponding gas sensor. Briefly, the Ti3C2Tx was produced by etching the Ti3AlC2 (MAX) in a 20 mL HF solution at room temperature. Hydrothermal and calcination methods were employed to synthesize the ZnO nanosheets. Finally, the obtained Ti3C2Tx nanosheets were hybridized with ZnO NS by sonication treatment. The materials were dispersed in DI water and dropped onto the interdigital electrode to fabricate the gas sensor.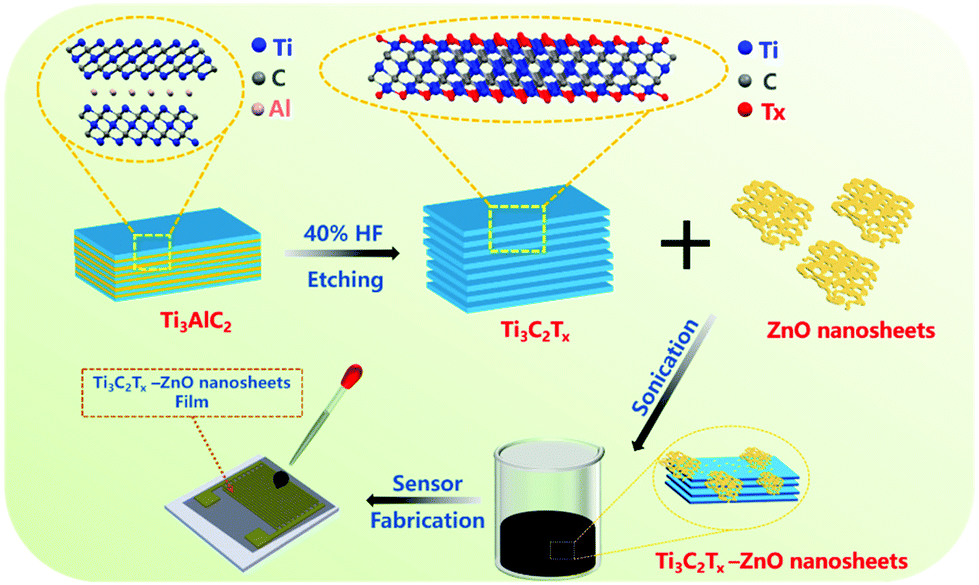 | ||
| Fig. 1 Schematic diagram of the fabrication process of Ti3C2Tx–ZnO nanosheet hybrids and the gas sensor. | ||
Fig. 2 shows the schematic diagram of the system for the sensing performance tests. The compressed air cylinder was used to provide the carrier gas, which was mixed with the target gas to produce different concentrations of target gas. The main function of the gas mixer was to deliver even levels of target gas with a certain concentration. MFCs were used to control the flow rate of compressed air and NO2 gas. Gas sensors were fixed in a microchamber and connected with the Agilent 4156 C and computer using electric wires. After gas sensor exposure to NO2 gas, UV LED light with 3 mW cm−2 light intensity was used to assist in recovery of the gas sensor to the original state. The humidity gas-sensing properties of the sensors were tested through the system shown in Fig. S3.† Compressed air passed through a flask filled with purified water to produce air with humidity, which was then passed through the chamber where the sensor was located. The humidity conditions were adjusted by changing the flow rate of compressed air via MFCs. The photoelectronic characteristics of Ti3C2Tx–ZnO nanosheet hybrids were examined by I–V curves (Fig. S4†). In the dark, the Ti3C2Tx–ZnO NS exhibited a linear curve that estimated the ohmic contact between Ti3C2Tx–ZnO NS and electrodes.32 The Ti3C2Tx–ZnO NS under UV illumination displayed a nonlinear curve, which is mainly because the production of photogenerated carriers breaks the balance of the built-in electric field at the interface of Ti3C2Tx and ZnO. The photogenerated electrons on the conduction band of ZnO will transfer to the Ti3C2Tx until formation of a new balance.46 It can be seen that after illumination with UV light, the current varies from 0.99 nA to 9.32 nA. The change in current is caused by the increase in the concentration of photogenerated electrons transferred from ZnO to the Ti3C2Tx.
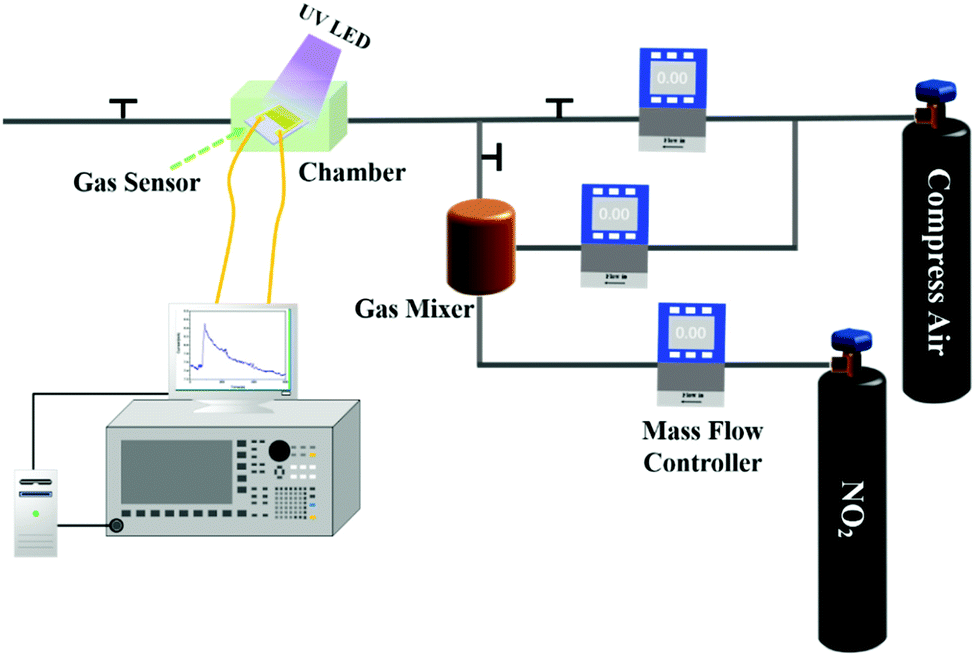 | ||
| Fig. 2 Schematic diagram of the system for gas-sensing performance tests. | ||
The XRD patterns of Ti3AlC2, Ti3C2Tx and Ti3C2Tx–ZnO NS are shown in Fig. 3. The characteristic peaks corresponding to the (002) plane shifted from 9.5° to 8.9° and the intensity of the peak has weakened at the same time. The (104) peak at 38.7° of Ti3AlC2 disappeared, indicating that the Al layer has been fully etched. Meanwhile, some new characteristic peaks appeared, such as for (004), (006) and (110), illustrating the successful fabrication of Ti3C2Tx. The XRD pattern shown in Fig. S5† reveals the high crystallinity, and no impurities exist in the ZnO NS. The peaks at 31.8°, 34.3°, 36.2°, 47.5°, 56.6° and 62.8° correspond to (100), (002), (101), (102), (110) and (103) planes, respectively. In the XRD pattern of Ti3C2Tx–ZnO NS hybrids, the characteristic peaks of the hexagonal wurtzite ZnO phase (JCPDS No. #36-1451) can be seen. Compared with the XRD results of ZnO NS, the peaks of Ti3C2Tx–ZnO NS at 31.3°, 33.9°, 35.7°, 47.2°, 56.3° and 62.6° can be indexed as the (100), (002), (101), (102), (110) and (103) planes, respectively. The 2θ of Ti3C2Tx–ZnO NS were shifted by a certain offset to a small angle, which is because of the bonding effect of Ti3C2Tx and ZnO NS.
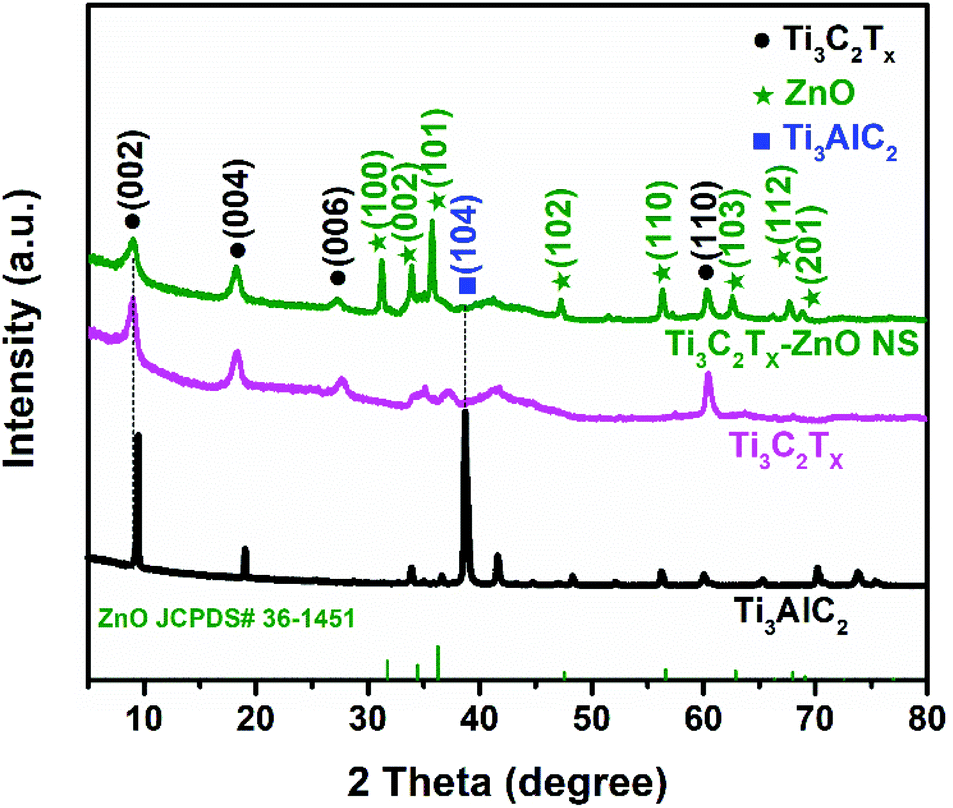 | ||
| Fig. 3 XRD patterns for Ti3AlC2, Ti3C2Tx and Ti3C2Tx–ZnO NS, respectively. | ||
Fig. 4 shows the SEM images of Ti3C2Tx–ZnO NS, and it is noticeable that the Ti3C2Tx and ZnO nanosheets were well hybridized. ZnO NS covered on the surface of the Ti3C2Tx nanosheets. Due to the ZnO NS being composed of nanoparticles, they are destroyed and decomposed into nanoparticles after violent ultrasonication. Numerous ZnO nanoparticles were distributed on the Ti3C2Tx sheet, which can provide more active sites and promote improvement in the gas-sensing performance. As shown in Fig. S6a and b,† Ti3AlC2 (MAX) displayed a layer-by-layer morphology. The Ti3C2Tx (MXene) nanosheets presented obvious accordion-like morphology after the etching treatment with HF solution, and the spacing between the layers increased significantly. The morphology of the ZnO NS is shown in Fig. S6c and d.† It is worth noting that there are many gaps between the particles of the ZnO nanosheets, which will boost the gas transmission and adsorption in the Ti3C2Tx–ZnO NS materials.
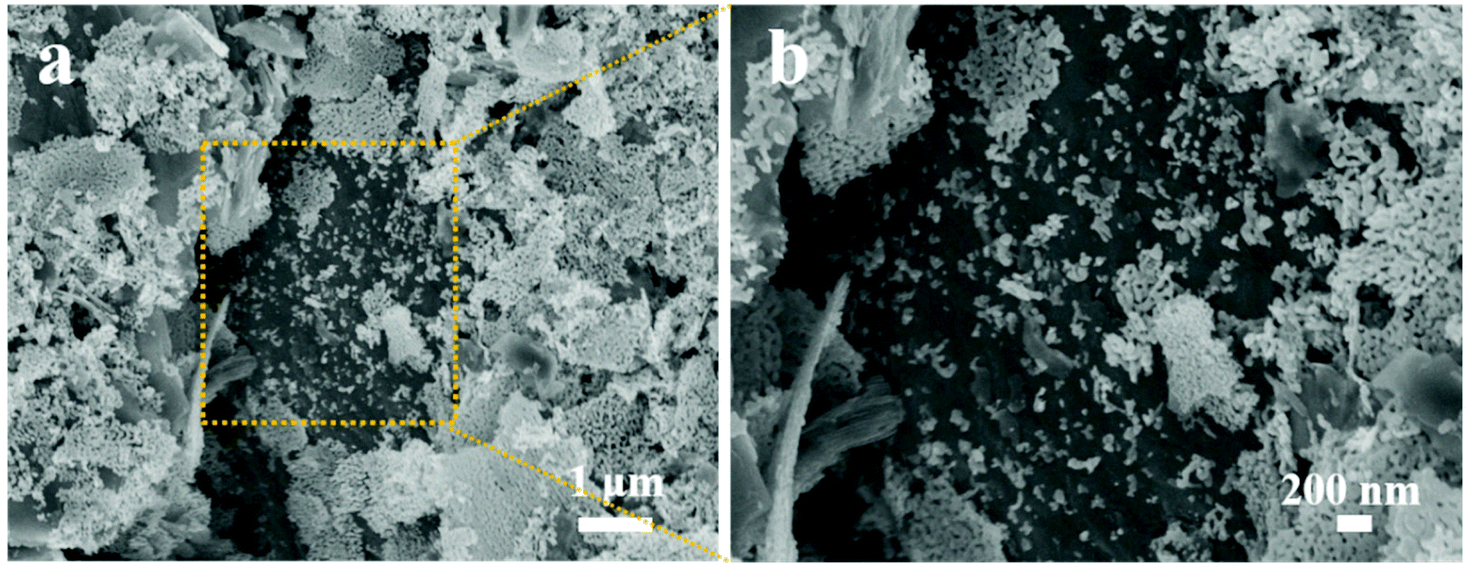 | ||
| Fig. 4 Ti3C2Tx–ZnO nanosheet hybrids. (a) SEM image of Ti3C2Tx–ZnO nanosheet hybrids, (b) enlarged area in (a). | ||
To further confirm the structure and element composition of Ti3C2Tx and Ti3C2Tx–ZnO NS, TEM and EDX mapping were carried out, as shown in Fig. 5. Fig. 5a shows the TEM image of Ti3C2Tx, which presented a clear layer structure. The high-resolution TEM (HRTEM) image of Ti3C2Tx is shown in Fig. 5b. The lattice fringes with a spacing of 0.7 nm can be indexed with (002) of Ti3C2Tx. The TEM and HRTEM images of Ti3C2Tx–ZnO NS are shown in Fig. 5c and d. The ZnO NS are distributed on the surface of the Ti3C2Tx nanosheets. Lattice fringes with different spacings of 0.25 nm and 0.248 nm correspond to (006) of Ti3C2Tx and (101) of ZnO, respectively. The STEM, EDX mapping images (Fig. 5e) and EDX analysis (Fig. S7b†) demonstrate the uniform distribution of Ti, C, Zn, O and F elements on the Ti3C2Tx–ZnO NS, which indicates the close connection between the Ti3C2Tx and ZnO NS. The selective area electron diffraction illustrated in Fig. S7a† indicates that the Ti3C2Tx–ZnO NS hybrid material is a composite phase and that these two materials have been successfully hybridized with each other.
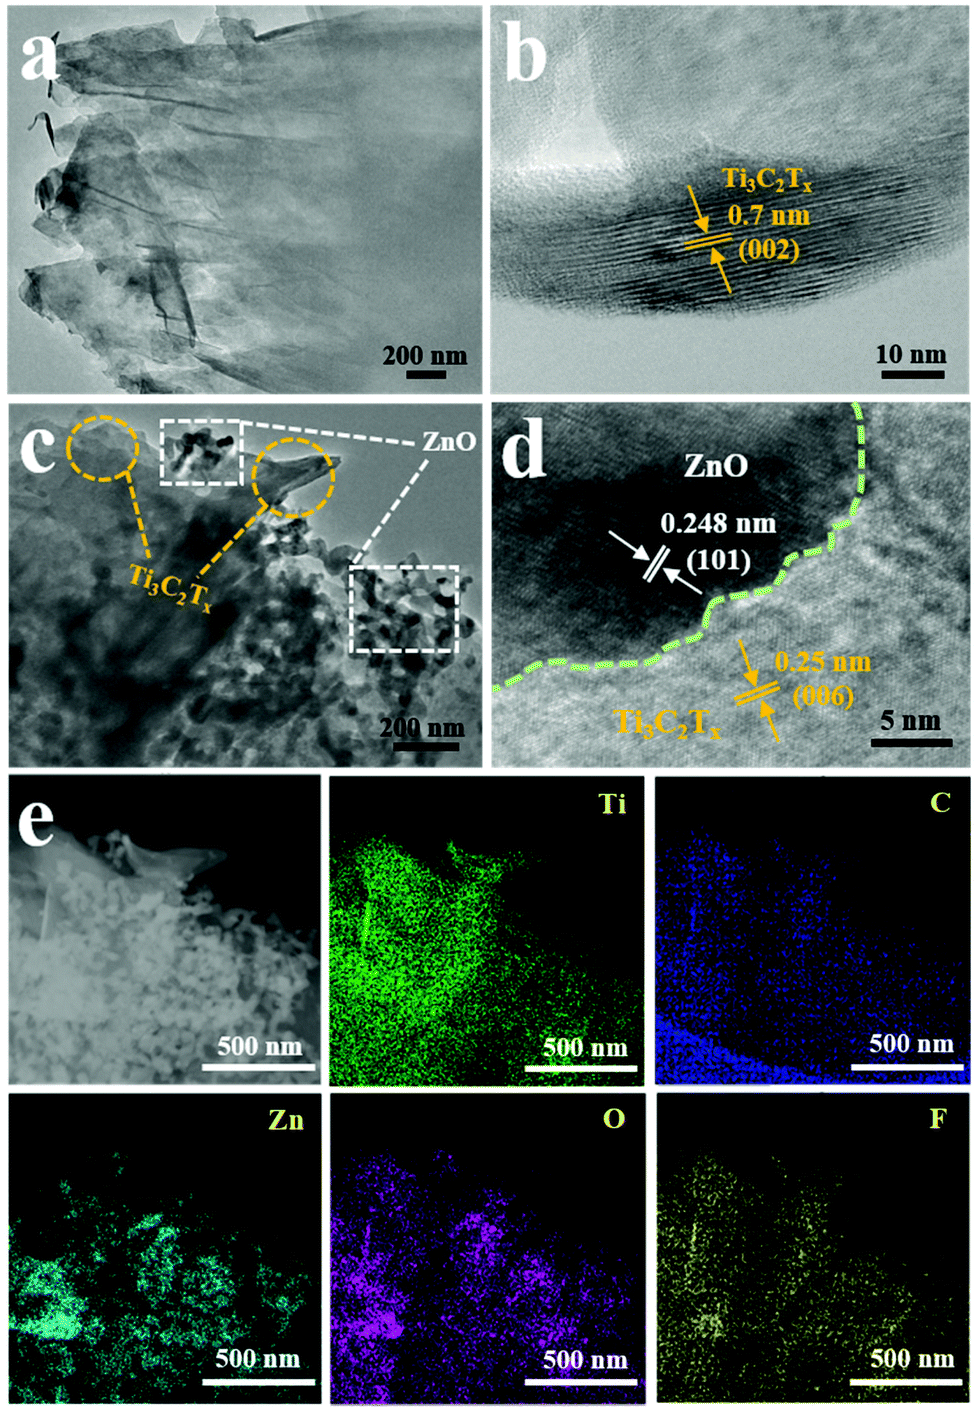 | ||
| Fig. 5 (a) TEM and (b) HRTEM images of Ti3C2Tx. (c) TEM and (d) HRTEM images of Ti3C2Tx–ZnO NS. (e) The STEM image of Ti3C2Tx–ZnO NS and EDX mapping images of Ti, C, Zn, O and F elements. | ||
The chemical bond composition and surface electronic valence of Ti3C2Tx, ZnO nanosheets and Ti3C2Tx–ZnO NS were measured by XPS analysis. The XPS full survey spectra illustrated the Ti, C, O and F elements in bare Ti3C2Tx MXene, and the Zn and O elements that existed in the ZnO NS (Fig. 6a). The elements of Ti, C, Zn, O and F were found in the Ti3C2Tx–ZnO NS, and the intensity of the peaks assigned to Ti 2p and C 1s decreased on formation of the Ti3C2Tx hybrids with ZnO NS. The Ti 2p of Ti3C2Tx showed three bonds, including Ti–C, Ti–X and TiO2.64,65 The peaks with binding energy positioned at 455.1 eV can be ascribed to Ti–C, and the peaks located at 455.9 eV and 461.3 eV can be attributed to Ti-X. Other peaks at 457.1 eV and 461.8 eV correspond to TiO2 (Ti4+) (Fig. S8a†). As shown in Fig. 6b, the Ti 2p core-level spectrum can be splinted into Ti 2p1/2 and Ti 2p3/2. The peaks at 454.1 eV and 460.2 eV correspond to the Ti–C bond and other peaks at 454.9 eV and 461.3 eV can be ascribed to the Ti–X bond. The peaks at 458.6 eV can be assigned to the Ti–O bond. Other peaks at 455.8 eV and 463.8 eV can be assigned to TixOy (Ti3+).33,66 The C 1s core level of Ti3C2Tx displayed in Fig. S8b† can be splinted into C–Ti, C–Ti–O, C–C and C–O peaks, which are located at 281.1 eV, 282.2 eV, 284.8 eV and 284.9 eV, respectively.23,67 The C 1s core level of Ti3C2Tx–ZnO NS can be deconvoluted into four chemical bonds, as illustrated in Fig. 6c. The binding energies of 281.2 eV, 282.2 eV, 284.8 eV and 284.9 eV were attributed to C–Ti, C–C, C–O and C![[double bond, length as m-dash]](https://www.rsc.org/images/entities/char_e001.gif) O, respectively.35 Meanwhile, the intensity and spacing of peaks corresponding to F 1s decreased in the Ti3C2Tx–ZnO NS compared with the pure Ti3C2Tx sheet (Fig. 6a, d and Fig. S8c†). The peaks located at 1020.3 eV and 1043.4 eV were assigned to Zn 2p3/2 and Zn 2p1/2 of pure ZnO NS, respectively. In comparison, the binding energy of the Zn 2p3/2 and Zn 2p1/2 peaks in Ti3C2Tx–ZnO NS both shifted 1 eV and were located at 1021.3 eV and 1044.4 eV, respectively (Fig. 6e).38 The O 1s core level of ZnO NS presented in Fig. S8d† can be splinted into OL (lattice oxygen), OV (vacancy oxygen) and OA (adsorbed oxygen) located at 529.8 eV, 530.9 eV and 532.9 eV, respectively.68 The vacancy oxygen occupies the majority of the O 1s, which indicates that abundant oxygen vacancies exist in the surface of ZnO. In contrast, the O 1s core level of Ti3C2Tx–ZnO NS displayed in Fig. 6f can be deconvoluted into Ti–O and Ti–O–Zn, located at 530.2 eV and 531.7 eV, respectively.69
O, respectively.35 Meanwhile, the intensity and spacing of peaks corresponding to F 1s decreased in the Ti3C2Tx–ZnO NS compared with the pure Ti3C2Tx sheet (Fig. 6a, d and Fig. S8c†). The peaks located at 1020.3 eV and 1043.4 eV were assigned to Zn 2p3/2 and Zn 2p1/2 of pure ZnO NS, respectively. In comparison, the binding energy of the Zn 2p3/2 and Zn 2p1/2 peaks in Ti3C2Tx–ZnO NS both shifted 1 eV and were located at 1021.3 eV and 1044.4 eV, respectively (Fig. 6e).38 The O 1s core level of ZnO NS presented in Fig. S8d† can be splinted into OL (lattice oxygen), OV (vacancy oxygen) and OA (adsorbed oxygen) located at 529.8 eV, 530.9 eV and 532.9 eV, respectively.68 The vacancy oxygen occupies the majority of the O 1s, which indicates that abundant oxygen vacancies exist in the surface of ZnO. In contrast, the O 1s core level of Ti3C2Tx–ZnO NS displayed in Fig. 6f can be deconvoluted into Ti–O and Ti–O–Zn, located at 530.2 eV and 531.7 eV, respectively.69
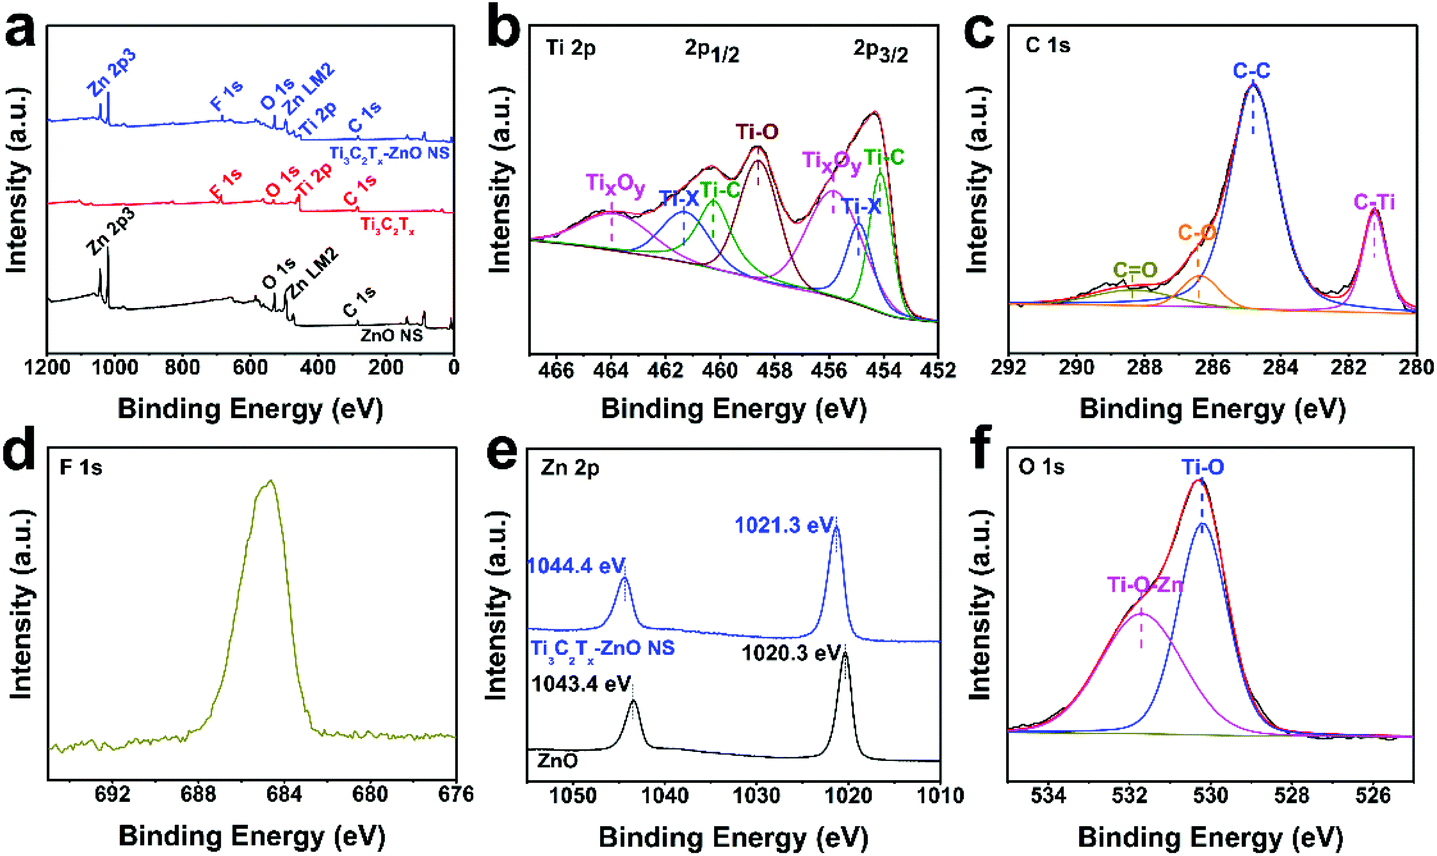 | ||
| Fig. 6 (a) Full survey XPS spectrum of Ti3C2Tx, ZnO nanosheets and Ti3C2Tx–ZnO nanosheet hybrids. High-resolution XPS spectra for (b) Ti 2p, (c) C 1s, (d) F 1s, (e) Zn 2p and (f) O 1s of Ti3C2Tx–ZnO nanosheet hybrids. | ||
Gas-sensing tests were conducted to explore the sensing performance of Ti3C2Tx, ZnO NS and Ti3C2Tx–ZnO NS gas sensors. Fig. 7a shows the dynamic response and recovery curves of pure Ti3C2Tx and Ti3C2Tx–ZnO NS sensors to 20 ppm NO2 under UV light at room temperature. The resistance of the Ti3C2Tx–ZnO NS sensor displayed a rapid increase from 511.8 MΩ to 2395.1 MΩ within a fast response speed (22 s) after exposure to NO2. Meanwhile, the Ti3C2Tx–ZnO NS sensor exhibited a higher response (367.63% to 20 ppm NO2) compared with the Ti3C2Tx sensor (10.18% to 20 ppm NO2) in a similar response time. After the resistance remains at a stable value, both gas sensors are unable to recover to the original resistance value. When 365 nm UV illumination was applied to assist the recovery process, the Ti3C2Tx–ZnO NS sensor showed an obvious change of resistance and a fast recovery speed (10 s), whereas the Ti3C2Tx sensor still had no change. The NO2 sensing performance of ZnO NS was also examined and is shown in Fig. S9.† The ZnO NS exhibited a large resistance and vibration at room temperature. In addition, the ZnO NS sensor had no significant response after contact with 20 ppm NO2 gas. Fig. 7b illustrates the five cycle tests for the Ti3C2Tx–ZnO NS sensor to 20 ppm NO2 at room temperature and recovery under UV illumination, demonstrating an excellent reproducibility without major changes.
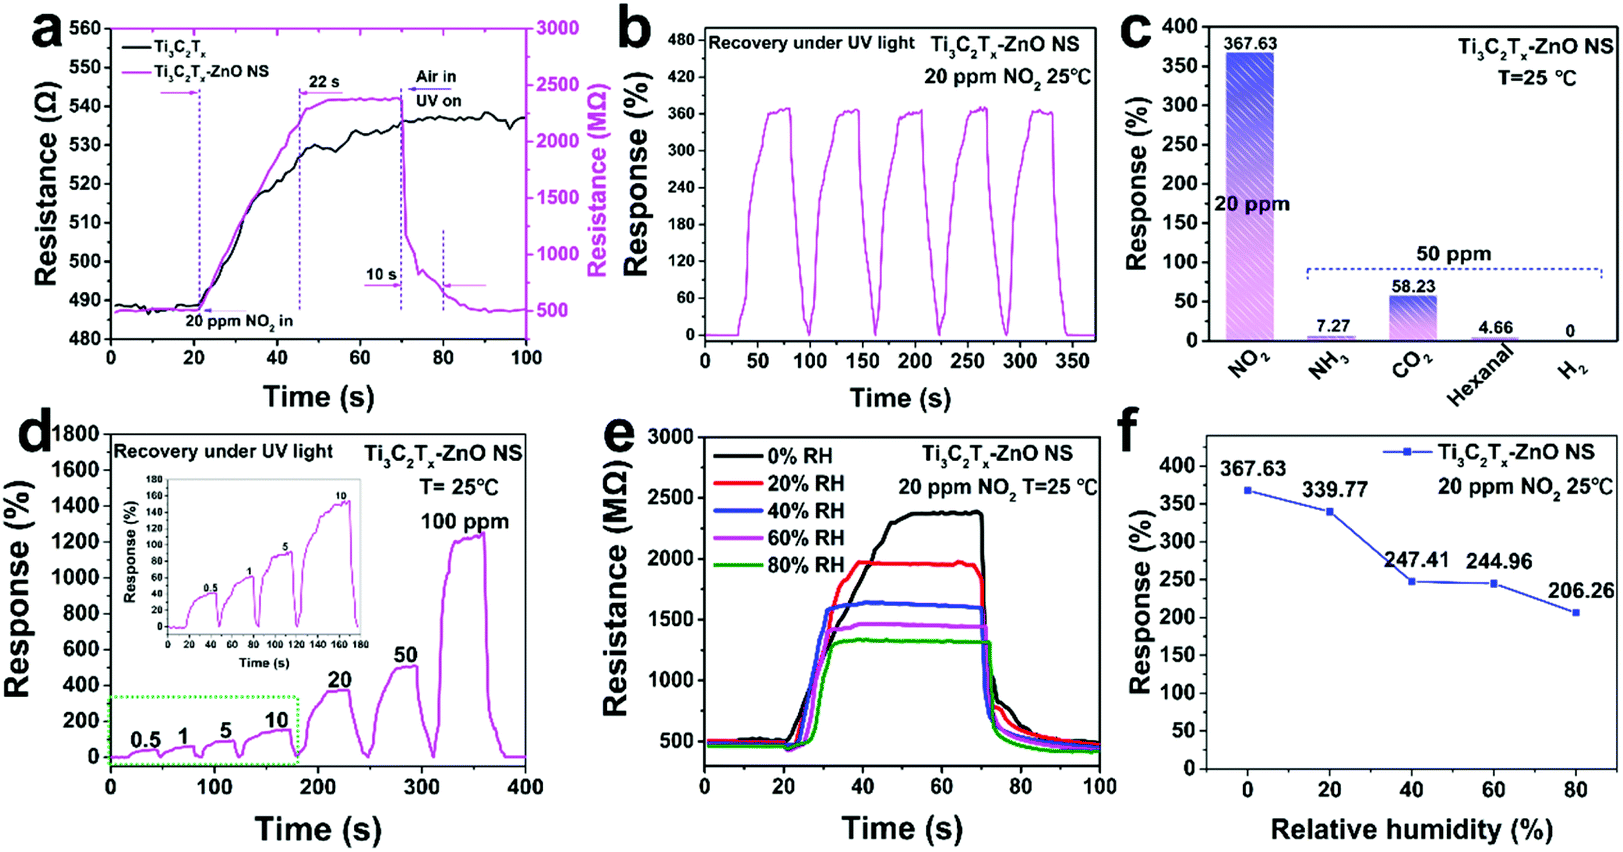 | ||
| Fig. 7 (a) Dynamic response and recovery curves under UV irradiation for Ti3C2Tx MXene and Ti3C2Tx–ZnO NS sensors to 20 ppm NO2 at room temperature. (b) Repeatability tests of Ti3C2Tx–ZnO NS sensor to 20 ppm NO2 at room temperature. (c) Selectivity of Ti3C2Tx–ZnO NS sensor to 20 ppm NO2 and various target gases with a concentration of 50 ppm at room temperature. (d) Dynamic response and recovery curves of Ti3C2Tx–ZnO NS sensor under UV illumination to 0.5–100 ppm NO2 at room temperature. (e) Dynamic response and recovery tests for the Ti3C2Tx–ZnO NS sensor in the RH ranging from 0% to 80% RH. (f) The response values of the Ti3C2Tx–ZnO NS sensor at different humidity conditions ranging from 0% to 80% RH. | ||
The selectivity of the Ti3C2Tx–ZnO NS sensor to various gases was investigated, including 20 ppm NO2 and 50 ppm of NH3, CO2, H2 and hexanal, as shown in Fig. 7c. The responses to NO2, NH3, CO2, H2 and hexanal were 367.63%, 7.27%, 58.23%, 0% and 4.66%, respectively. The sensor exhibited a high selectivity towards NO2 gas over the other gases. As shown in Fig. 7d, the Ti3C2Tx–ZnO NS sensor was exposed to different concentrations of NO2 gas at room temperature and recovery under UV illumination. The responses of the sensor were increased with the concentration of NO2 gas varying from low concentration to high concentration. Fig. 7e and f shows the responses of the Ti3C2Tx–ZnO NS sensor to 20 ppm NO2 gas at room temperature under different RH conditions. The responses of the sensor decreased with increase in RH, with the responses being 367.63% (0% RH), 339.77% (20% RH), 247.41% (40% RH), 244.96% (60% RH) and 206.26% (80% RH), separately. With RH increasing from 0% to 80%, the response of the Ti3C2Tx–ZnO NS sensor to NO2 gas exhibits a decrease, which is mainly because the water molecules covered the active sites and hindered the gas molecules adsorbed onto the surface of the material. More importantly, the sensor can remain at a relatively high response whether in a low-humidity or high-humidity environment, suggesting great potential in further applications. In addition, the long-term gas-sensing performance of the Ti3C2Tx–ZnO NS sensor was determined and is displayed in Fig. S10.† Significantly, the gas sensor exhibited a relatively high response (>275% to 20 ppm NO2) after four weeks, indicating that the gas sensor can be used for a long time. To investigate the structural stability of Ti3C2Tx–ZnO NS, Raman analysis was carried out and the spectra are displayed in Fig. S11.† Raman peaks located at 156 cm−1 and 207 cm−1 correspond to the A1g vibration modes of Ti3C2Tx.32 Meanwhile, the small Raman peaks located at 434 cm−1 correspond to the E2 (high) vibration mode of ZnO in the wurtzite structure.13 It is notable that after 30 minutes of UV illumination the corresponding Raman peaks show almost no change. The results indicate that the Ti3C2Tx–ZnO NS can retain its structure without any destruction after a long period of UV illumination (365 nm, 3 mW cm−2 ). Fig. S13† illustrates the response of Ti3C2Tx–ZnO NS towards 365 nm UV light (3 mW cm−2) without NO2 gas at room temperature. The Ti3C2Tx–ZnO NS exhibited periodic and stable resistance changes under UV light. In terms of the response process of Ti3C2Tx–ZnO NS towards NO2 gas, the resistance of Ti3C2Tx–ZnO NS was increased when exposed to NO2 gas. Therefore, the UV light illumination cannot provide enhancement to the sensor response, but only acts in the role of assisting the recovery of the sensor after the desorption of NO2 gas. The UV light-induced gas desorption could help to accelerate the recovery process of the Ti3C2Tx–ZnO NS gas sensor.70 In addition, comparison of the NO2 sensing performances of the various gas sensors under UV illumination, including response/recovery time and sensitivity, are illustrated in Table S1.† The Ti3C2Tx–ZnO NS sensor exhibited better response and recovery properties compared with other reported NO2 sensors. It is important that the Ti3C2Tx–ZnO NS sensor only needs a short period of external UV light illumination (10 s) in the recovery stage to achieve full recovery, while other reported NO2 sensors can only be fully recovered after being exposed to UV light for a long time during the entire stage.
DFT calculations were carried out to explore the sensing properties of Ti3C2Tx and ZnO to NO2 gas. The flat model was constructed by a monolayer MXene and ZnO with a supercell of size of 3 × 3 × 1. The supercell of MXene (Ti3C2Tx) and ZnO was relaxed until the energy and the Hellmann–Feynman force reached the convergence criteria of 10−6 eV and 0.01 eV Å−1. The optimized structures of NO2 absorbed on Ti3C2Tx and ZnO are illustrated in Fig. 8a and b. The adsorption energies of Ti3C2Tx and ZnO for the NO2 molecule were calculated using the following equation:
| Eads = Etotal − Egas molecule − Esubstrate | (1) |
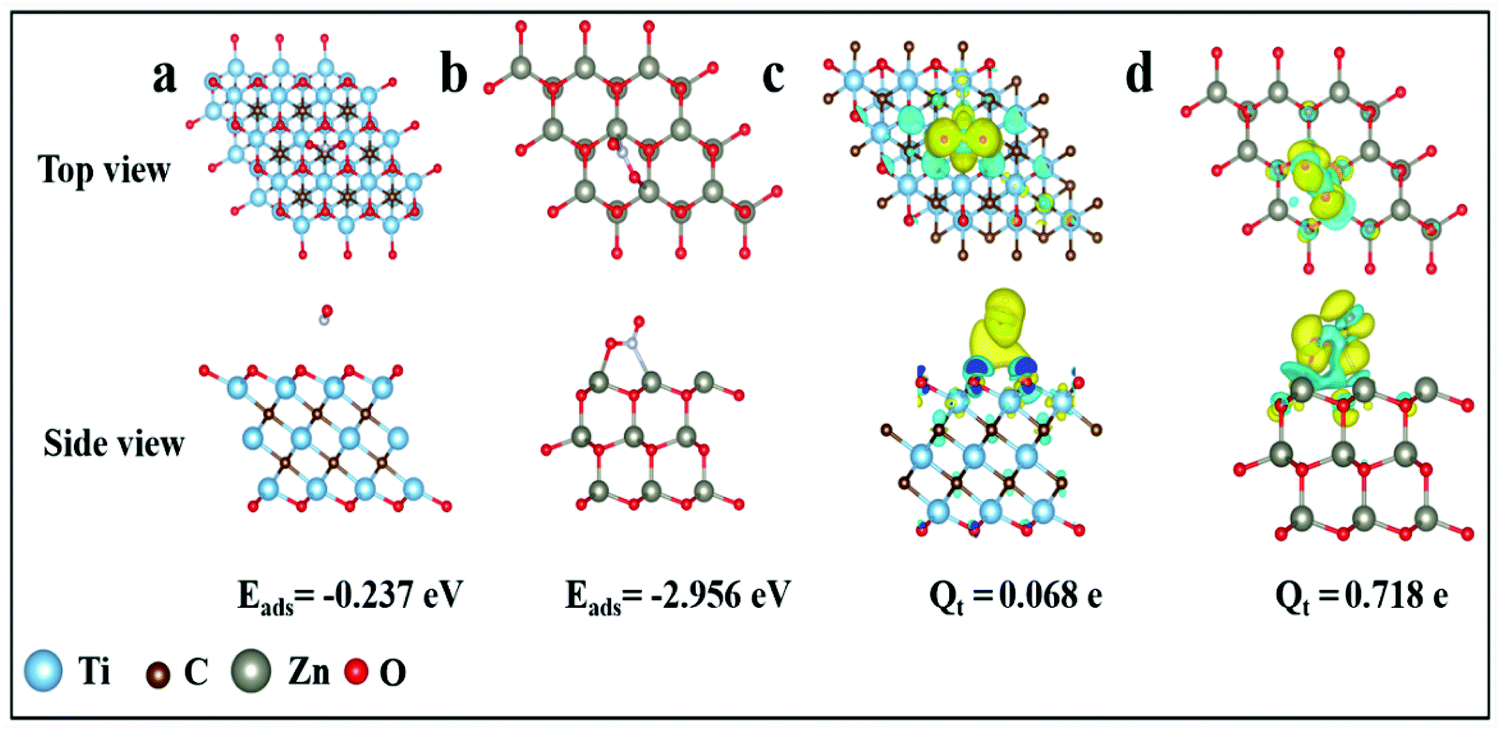 | ||
| Fig. 8 Top and side view of the most energetically favorable configuration (a) Ti3C2Tx and (b) ZnO after adsorption of NO2 and the difference charge density plots of NO2 adsorbed on the (c) Ti3C2Tx and (d) ZnO using an isovalue of 0.0001 e Å−3 and 0.002 e Å−3, respectively. Cyan: charge depletion. Yellow: charge accumulation. | ||
BET analysis was carried out to explore the specific area of samples, as displayed in Fig. S12.† Compared with pure Ti3C2Tx, the Ti3C2Tx–ZnO NS exhibits a higher BET specific surface area (9.71 m2 g−1) than Ti3C2Tx (1.47 m2 g−1). The results illustrate that more active sites exist in the Ti3C2Tx–ZnO NS, which could provide the high sensitivity of Ti3C2Tx–ZnO NS toward NO2 gas. The gas-sensing mechanism of the Ti3C2Tx–ZnO NS sensor can be explained by the charge transfer process. Fig. 9a shows the adsorption process when Ti3C2Tx–ZnO NS is exposed to air. Oxygen molecules are adsorbed onto the surface of ZnO NS and Ti3C2Tx nanosheets, capturing the electrons from the conduction band of the materials and forming the chemisorbed oxygen species (O2−).71,72 The specific reaction process is shown in the equations below:
| O2 (gas) → O2 (ads) | (2) |
| O2 (ads) + e− → O2− (ads) | (3) |
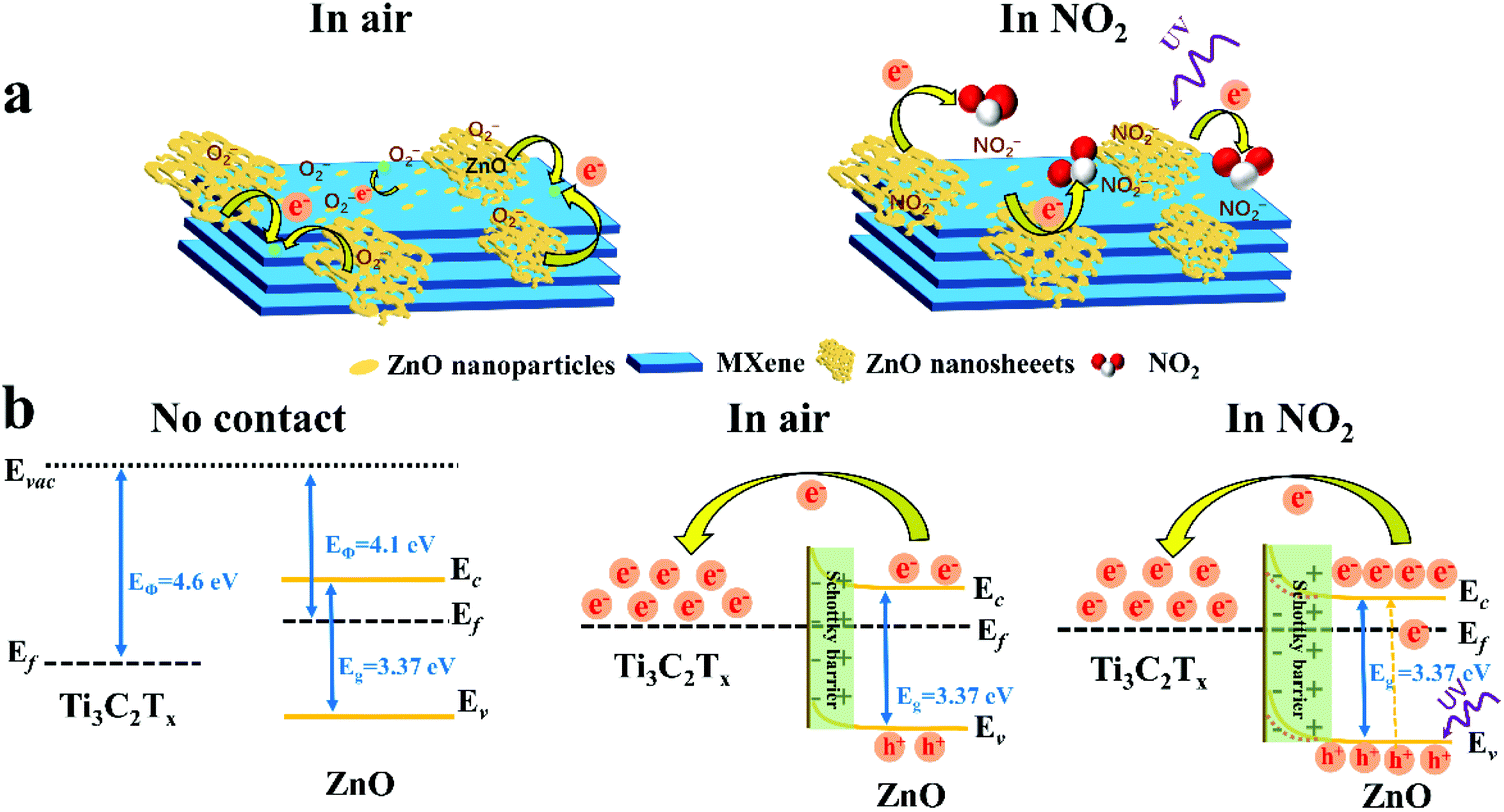 | ||
| Fig. 9 (a) Schematic diagram of the possible gas-sensing mechanism of Ti3C2Tx–ZnO NS. (b) Energy band structure diagram of Ti3C2Tx–ZnO NS Schottky barriers in air and NO2. | ||
Since the work function of Ti3C2Tx (4.60 eV)32 is higher than that of ZnO (4.1 eV),73 the electrons of ZnO flow to Ti3C2Tx until the Femi energy level reaches equilibrium. Consequently, the Schottky barrier layer is formed at the interface between Ti3C2Tx and ZnO after the electron transfer process, as shown in Fig. 9b. Because the electron affinity of NO2 (2.30 eV) is higher than O2 (0.44 eV),8 electrons will move towards NO2 and yield NO2− ions, as illustrated in eqn (4). The electrons are continuously captured from ZnO nanosheets and flow to the Ti3C2Tx, resulting in enlargement of the Schottky barrier layer at the interface between Ti3C2Tx and ZnO. Meanwhile, as a result of ZnO becoming less doped as electrons are captured by NO2, and large amounts of electron transfer from ZnO to Ti3C2Tx, the Schottky barrier widens at the same time. In addition, the XPS results in Fig. 6e and f provide some important information. In Fig. 6e, the Zn 2p peaks of Ti3C2Tx–ZnO are shifted 1 eV towards higher binding energy compared with the Zn 2p peaks of pure ZnO, which can provide an evidence of the transfer of electrons from ZnO to Ti3C2Tx. In Fig. 6f, the formation of Ti–O–Zn chemical bonds indicates the strong interaction between Ti3C2Tx and ZnO. The Ti–O–Zn chemical bonds that exist in the Ti3C2Tx–ZnO NS can effectively enhance the transfer efficiency of the barriers between these two materials.6
| NO2 (gas) + e− → NO2− (ads) | (4) |
The enhanced sensing properties can be attributed to the formation of the Schottky barrier layer and the increase in active sites on the surface of Ti3C2Tx–ZnO NS. It can be seen from Fig. 4 that large amounts of ZnO nanoparticles are uniformly distributed on the surface of the Ti3C2Tx nanosheets, which can increase the number of active sites. Apart from these, large surface groups, such as –F, –OH and –O, exist in the Ti3C2Tx nanosheets.74,75 Therefore, more gas molecules could easily adsorb onto the surface of Ti3C2Tx–ZnO NS. The above features of the Ti3C2Tx–ZnO NS all play a role in enhancing the gas-sensing performance. The short recovery time of Ti3C2Tx–ZnO NS is mainly ascribed to the increase in the concentration of photogenerated holes of ZnO when it is under UV illumination (365 nm). The reason is that NO2− could react with the photogenerated holes on the valence band of ZnO and convert into NO2 gas. The specific response and recovery process of Ti3C2Tx–ZnO NS to NO2 gas is shown in Fig. S14† and the reactions of the recovery process are illustrated in eqn (5) and (6).76,77 Therefore, the recovery time will decrease significantly. The most important thing is that the light only assists the sensor to recover quickly, rather than the entire response/recovery process, which helps to maintain the stability of the sensor. Therefore, the sensor will not be affected by long-term light illumination, which leads to performance degradation. Nevertheless, NO2 sensing properties can be enhanced through the surface groups (including –F, –O and –OH) on the Ti3C2Tx, and abundant oxygen vacancies act as active sites to adsorb large amounts of NO2 molecules.
| hv → h+ (hv) + e− (hv) | (5) |
| NO2− (ads) + h+ (hv) → NO2 (g) | (6) |
Conclusions
In summary, Ti3C2Tx–ZnO NS for NO2 detection at room temperature has been prepared by a facile sonication method. The sensor exhibited a 367.63% response, and a short response time (22 s) to 20 ppm NO2 gas at room temperature. Meanwhile, the recovery time was 10 s under 365 nm UV illumination. The sensor also displayed superior reproducibility for five cycles of response tests to 20 ppm NO2. Humidity tests demonstrated excellent anti-humidity properties when the sensor was operated under different humidity conditions. The predominant factor for the gas-sensing performance can be attributed to the abundant active sites in Ti3C2Tx–ZnO NS and the large quantity of photogenerated barriers of ZnO nanosheets under UV illumination. In addition, UV illumination excites the electrons and holes of ZnO NS, which speeds up the desorption process. The construction of Ti3C2Tx–ZnO NS Schottky junctions not only improves the sensing performance, but also solves the problems of poor sensitivity under humid conditions and easy oxidation. DFT calculations showed that the adsorption energy between NO2 molecules and ZnO was stronger than that with Ti3C2Tx. Moreover, the difference charge transfer density plot illustrated that the NO2 gas mainly extracted electrons from ZnO, indicating the high response of ZnO toward the NO2 gas. Therefore, the combination of the novel Ti3C2Tx material (high conductivity) with conventional metal oxide material (strong absorbability), as well as utilizing the photosensitivity of ZnO to generate photogenerated carriers under UV illumination, can provide new ideas for the further improvement of Ti3C2Tx-based gas sensors.Author contributions
Chao Fan: Conceptualization, methodology, investigation, formal analysis, visualization, data curation, writing original draft. Jia Shi: Formal analysis, writing-review and editing. Yongwei Zhang: Writing-review and editing. Wenjing Quan: Writing-review and editing. Xiyu Chen: Writing-review and editing. Jianhua Yang: Supervision, conceptualization, methodology, funding acquisition, writing-review and editing. Min Zeng: Resources, writing-review and editing. Zhihua Zhou: Writing-review and editing. Yanjie Su: Writing-review and editing. Hao Wei: Writing-review and editing. Zhi Yang: Resources, supervision, funding acquisition, writing-review and editing.Conflicts of interest
There are no conflicts to declare.Acknowledgements
This work was supported by the National Natural Science Foundation of China (62101329 and 61971284), Shanghai Sailing Program (21YF1421400), the Oceanic Interdisciplinary Program of Shanghai Jiao Tong University (SL2020ZD203, SL2020MS031, and SL2021MS006) and the Scientific Research Fund of Second Institute of Oceanography, Ministry of Natural Resources of P. R. China (SL2003), and Startup Fund for Youngman Research at Shanghai Jiao Tong University. We also acknowledge analysis support from the Instrumental Analysis Center of Shanghai Jiao Tong University and the Center for Advanced Electronic Materials and Devices of Shanghai Jiao Tong University.References
- Y. Kim, K. C. Kwon, S. Kang, C. Kim, T. H. Kim, S. P. Hong, S. Y. Park, J. M. Suh, M. J. Choi, S. Han and H. W. Jang, ACS Sens., 2019, 4, 2395–2402 CrossRef CAS PubMed.
- Z. Li, Y. Liu, D. Guo, J. Guo and Y. Su, Sens. Actuators, B, 2018, 271, 306–310 CrossRef CAS.
- Y. Huang, W. Jiao, Z. Chu, G. Ding, M. Yan, X. Zhong and R. Wang, J. Mater. Chem. C, 2019, 7, 8616–8625 RSC.
- M. Urso, S. G. Leonardi, G. Neri, S. Petralia, S. Conoci, F. Priolo and S. Mirabella, Sens. Actuators, B, 2020, 305, 127481 CrossRef CAS.
- H. Zhang, L. Yu, Q. Li, Y. Du and S. Ruan, Sens. Actuators, B, 2017, 241, 109–115 CrossRef CAS.
- J. Hao, D. Zhang, Q. Sun, S. Zheng, J. Sun and Y. Wang, Nanoscale, 2018, 10, 7210–7217 RSC.
- V. B. Raj, A. T. Nimal, M. Tomar, M. U. Sharma and V. Gupta, Sens. Actuators, B, 2015, 220, 154–161 CrossRef CAS.
- Z. Wang, G. Men, R. Zhang, F. Gu and D. Han, Sens. Actuators, B, 2018, 263, 218–228 CrossRef CAS.
- K. Y. Ko, J. G. Song, Y. Kim, T. Choi, S. Shin, C. W. Lee, K. Lee, J. Koo, H. Lee, J. Kim, T. Lee, J. Park and H. Kim, ACS Nano, 2016, 10, 9287–9296 CrossRef CAS PubMed.
- J. Pan, W. Liu, L. Quan, N. Han, S. Bai, R. Luo, Y. Feng, D. Li and A. Chen, Ind. Eng. Chem. Res., 2018, 57, 10086–10094 CrossRef CAS.
- R. Kumar, N. Goel and M. Kumar, ACS Sens., 2017, 2, 1744–1752 CrossRef CAS PubMed.
- A. V. Agrawal, N. Kumar and M. Kumar, Nano-Micro Lett., 2021, 13, 38 CrossRef PubMed.
- A. D. Ugale, G. G. Umarji, S. H. Jung, N. G. Deshpande, W. Lee, H. K. Cho and J. B. Yoo, Sens. Actuators, B, 2020, 308, 127690 CrossRef CAS.
- B. G. Ghule, N. M. Shinde, S. D. Raut, S. F. Shaikh, A. M. Al-Enizi, K. H. Kim and R. S. Mane, J. Colloid Interface Sci., 2021, 589, 401–410 CrossRef CAS PubMed.
- Y. H. Kim, J. S. Park, Y.-R. Choi, S. Y. Park, S. Y. Lee, W. Sohn, Y.-S. Shim, J.-H. Lee, C. R. Park, Y. S. Choi, B. H. Hong, J. H. Lee, W. H. Lee, D. Lee and H. W. Jang, J. Mater. Chem. A, 2017, 5, 19116–19125 RSC.
- Y. Han, Y. Liu, C. Su, S. Wang, H. Li, M. Zeng, N. Hu, Y. Su, Z. Zhou, H. Wei and Z. Yang, Sens. Actuators, B, 2019, 296, 126666 CrossRef CAS.
- Y. Han, Y. Ma, Y. Liu, S. Xu, X. Chen, M. Zeng, N. Hu, Y. Su, Z. Zhou and Z. Yang, Appl. Surf. Sci., 2019, 493, 613–619 CrossRef CAS.
- J. Guo, R. Wen, J. Zhai and Z. L. Wang, Sci. Bull., 2019, 64, 128–135 CrossRef CAS.
- F. Urban, F. Giubileo, A. Grillo, L. Iemmo, G. Luongo, M. Passacantando, T. Foller, L. Madauß, E. Pollmann, M. P. Geller, D. Oing, M. Schleberger and A. D. Bartolomeo, 2D Mater., 2019, 6, 045049 CrossRef CAS.
- Y. Liu, Y. Wang, M. Ikram, H. Lv, J. Chang, Z. Li, L. Ma, A. U. Rehman, G. Lu, J. Chen and K. Shi, ACS Sens., 2018, 3, 1576–1583 CrossRef CAS PubMed.
- M. Donarelli, L. Ottaviano, L. Giancaterini, G. Fioravanti, F. Perrozzi and C. Cantalini, 2D Mater., 2016, 3, 025002 CrossRef.
- Y. Wang, J. Xue, X. Zhang, J. Si, Y. Liu, L. Ma, M. Ullah, M. Ikram, L. Li and K. Shi, Mater. Sci. Semicond. Process., 2020, 110, 104961 CrossRef CAS.
- S. Liu, M. Wang, G. Liu, N. Wan, C. Ge, S. Hussain, H. Meng, M. Wang and G. Qiao, Appl. Surf. Sci., 2021, 567, 150747 CrossRef CAS.
- Z. Zhu, C. Liu, F. Jiang, J. Liu, X. Ma, P. Liu, J. Xu, L. Wang and R. Huang, J. Hazard. Mater., 2020, 399, 123054 CrossRef CAS PubMed.
- C. Tan, X. Cao, X. Wu, Q. He, J. Yang, X. Zhang, J. Chen, W. Zhao, S. Han, G. H. Nam, M. Sindoro and H. Zhang, Chem. Rev., 2017, 117, 6225–6331 CrossRef CAS PubMed.
- K. S. Novoselov, A. Mishchenko, A. Carvalho and A. H. C. Neto, Science, 2016, 353, aac9439 CrossRef CAS PubMed.
- P. K. Kannan, D. J. Late, H. Morgan and C. S. Rout, Nanoscale, 2015, 7, 13293–13312 RSC.
- F. Bu, M. M. Zagho, Y. Ibrahim, B. Ma, A. Elzatahry and D. Zhao, Nano Today, 2020, 30, 100803 CrossRef CAS.
- D. Zhao, Z. Chen, W. Yang, S. Liu, X. Zhang, Y. Yu, W. C. Cheong, L. Zheng, F. Ren, G. Ying, X. Cao, D. Wang, Q. Peng, G. Wang and C. Chen, J. Am. Chem. Soc., 2019, 141, 4086–4093 CrossRef CAS PubMed.
- C. Zhang, L. McKeon, M. P. Kremer, S. H. Park, O. Ronan, A. Seral-Ascaso, S. Barwich, C. Ó. Coileáin, N. McEvoy, H. C. Nerl, B. Anasori, J. N. Coleman, Y. Gogotsi and V. Nicolosi, Nat. Commun., 2019, 10, 1795 CrossRef PubMed.
- B. Liu, L. Chen, G. Liu, A. N. Abbas, M. Fathi and C. Zhou, ACS Nano, 2014, 8, 5304–5314 CrossRef CAS PubMed.
- J. Choi, Y. J. Kim, S. Y. Cho, K. Park, H. Kang, S. J. Kim and H.-T. Jung, Adv. Funct. Mater., 2020, 30, 2003998 CrossRef CAS.
- B. Sun, H. Lv, Z. Liu, J. Wang, X. Bai, Y. Zhang, J. Chen, K. Kan and K. Shi, J. Mater. Chem. A, 2021, 9, 6335–6344 RSC.
- T. Chen, W. Yan, Y. Wang, J. Li, H. Hu and D. Ho, J. Mater. Chem. C, 2021, 9, 7407–7416 RSC.
- C. Fan, F. Sun, X. Wang, Z. Huang, M. Keshvardoostchokami, P. Kumar and B. Liu, Nanomaterials, 2019, 9, 1277 CrossRef CAS PubMed.
- H. Wang, M. Dai, Y. Li, J. Bai, Y. Liu, Y. Li, C. Wang, F. Liu and G. Lu, Sens. Actuators, B, 2021, 329, 129145 CrossRef CAS.
- X. Yang, S. Zhang, Q. Yu, L. Zhao, P. Sun, T. Wang, F. Liu, X. Yan, Y. Gao, X. Liang, S. Zhang and G. Lu, Sens. Actuators, B, 2019, 281, 415–423 CrossRef CAS.
- S. Zhao, Y. Shen, P. Zhou, F. Hao, X. Xu, S. Gao, D. Wei, Y. Ao and Y. Shen, Sens. Actuators, B, 2020, 308, 127729 CrossRef CAS.
- L. Zhu and W. Zeng, Sens. Actuators, A, 2017, 267, 242–261 CrossRef CAS.
- M. T. Vijjapu, S. G. Surya, S. Yuvaraja, X. Zhang, H. N. Alshareef and K. N. Salama, ACS Sens., 2020, 5, 984–993 CrossRef CAS PubMed.
- J. Wang, S. Fan, Y. Xia, C. Yang and S. Komarneni, J. Hazard. Mater., 2020, 381, 120919 CrossRef CAS PubMed.
- D.-B. Moon, A. Bag, H.-B. Lee, M. Meeseepong, D.-H. Lee and N.-E. Lee, Sens. Actuators, B, 2021, 345, 130373 CrossRef CAS.
- P. T. Hung, P. D. Hoat, V. X. Hien, H. Y. Lee, S. Lee, J. H. Lee, J. J. Kim and Y. W. Heo, ACS Appl. Mater. Interfaces, 2020, 12, 34274–34282 CrossRef CAS PubMed.
- Y. Song, F. Chen, Y. Zhang, S. Zhang, F. Liu, P. Sun, X. Yan and G. Lu, Sens. Actuators, B, 2019, 287, 191–198 CrossRef CAS.
- Z. Li, S. Yan, S. Zhang, J. Wang, W. Shen, Z. Wang and Y. Q. Fu, J. Alloys Compd., 2019, 770, 721–731 CrossRef CAS.
- S. Zhang, L. Zhao, B. Huang and X. Li, Sens. Actuators, B, 2020, 319, 128264 CrossRef CAS.
- M. Wang, Y. Zhu, Q. Luo, C. Ge, G. Liu, G. Qiao and E. J. Kim, Appl. Surf. Sci., 2021, 566, 150750 CrossRef CAS.
- W. Zheng, C. Yang, Z. Li, J. Xie, C. Lou, G. Lei, X. Liu and J. Zhang, Sens. Actuators, B, 2021, 329, 129127 CrossRef CAS.
- Y. Zhou, C. Zou, X. Lin and Y. Guo, Appl. Phys. Lett., 2018, 113, 082103 CrossRef.
- E. Wu, Y. Xie, B. Yuan, H. Zhang, X. Hu, J. Liu and D. Zhang, ACS Sens., 2018, 3, 1719–1726 CrossRef CAS PubMed.
- Y. Xia, L. Zhou, J. Yang, P. Du, L. Xu and J. Wang, ACS Appl. Electron. Mater., 2020, 2, 580–589 CrossRef CAS.
- J. Wang, Y. Shen, X. Li, Y. Xia and C. Yang, Sens. Actuators, B, 2019, 298, 126858 CrossRef CAS.
- C. Feng, F. Wen, Z. Ying, L. Li, X. Zheng, P. Zheng and G. Wang, Chem. Phys. Lett., 2020, 754, 137745 CrossRef CAS.
- R. Bhardwaj and A. Hazra, J. Mater. Chem. C, 2021, 9, 15735–15754 RSC.
- K. Deshmukh, T. Kovářík and S. K. K. Pasha, Coord. Chem. Rev., 2020, 424, 213514 CrossRef CAS.
- M. Alhabeb, K. Maleski, B. Anasori, P. Lelyukh, L. Clark, S. Sin and Y. Gogotsi, Chem. Mater., 2017, 29, 7633–7644 CrossRef CAS.
- B. Hammer, L. B. Hansen and J. K. Nørskov, Phys. Rev. B: Condens. Matter Mater. Phys., 1999, 59, 7413–7421 CrossRef.
- G. Kresse and J. Furthmüller, Phys. Rev. B: Condens. Matter Mater. Phys., 1996, 54, 11169–11186 CrossRef CAS PubMed.
- R. Stadler, W. Wolf, R. Podloucky, G. Kresse, J. Furthmüller and J. Hafner, Phys. Rev. B: Condens. Matter Mater. Phys., 1996, 54, 1729–1734 CrossRef CAS PubMed.
- S. Grimme, J. Antony, S. Ehrlich and H. Krieg, J. Chem. Phys., 2010, 132, 154104 CrossRef PubMed.
- J. P. Perdew, W. Yang, K. Burke, Z. Yang, E. K. U. Gross, M. Scheffler, G. E. Scuseria, T. M. Henderson, I. Y. Zhang, A. Ruzsinszky, H. Peng, J. Sun, E. Trushin and A. Görling, Proc. Natl. Acad. Sci. U. S. A., 2017, 114, 2801–2806 CrossRef CAS PubMed.
- J. Shi, W. Quan, X. Chen, X. Chen, Y. Zhang, W. Lv, J. Yang, M. Zeng, H. Wei, N. Hu, Y. Su, Z. Zhou and Z. Yang, Phys. Chem. Chem. Phys., 2021, 23, 18359–18368 RSC.
- G. Henkelman, A. Arnaldsson and H. Jónsson, Comput. Mater. Sci., 2006, 36, 354–360 CrossRef.
- W. Yuan, K. Yang, H. Peng, F. Li and F. Yin, J. Mater. Chem. A, 2018, 6, 18116–18124 RSC.
- S. Sun, M. Wang, X. Chang, Y. Jiang, D. Zhang, D. Wang, Y. Zhang and Y. Lei, Sens. Actuators, B, 2020, 304, 127274 CrossRef CAS.
- A. Hermawan, B. Zhang, A. Taufik, Y. Asakura, T. Hasegawa, J. Zhu, P. Shi and S. Yin, ACS Appl. Nano Mater., 2020, 3, 4755–4766 CrossRef CAS.
- M. Liu, Z. Wang, P. Song, Z. Yang and Q. Wang, Ceram. Int., 2021, 47, 23028–23037 CrossRef CAS.
- Q. Li, D. Chen, J. Miao, S. Lin, Z. Yu, D. Cui, Z. Yang and X. Chen, Sens. Actuators, B, 2021, 326, 128952 CrossRef CAS.
- Y. Qian, H. Wei, J. Dong, Y. Du, X. Fang, W. Zheng, Y. Sun and Z. Jiang, Ceram. Int., 2017, 43, 10757–10762 CrossRef CAS.
- A. Grillo, E. Faella, A. Pelella, F. Giubileo, L. Ansari, F. Gity, P. K. Hurley, N. McEvoy and A. D. Bartolomeo, Adv. Funct. Mater., 2021, 31, 2105722 CrossRef CAS.
- M. Liu, Z. Wang, P. Song, Z. Yang and Q. Wang, Sens. Actuators, B, 2021, 340, 129946 CrossRef CAS.
- Z. Yang, L. Jiang, J. Wang, F. Liu, J. He, A. Liu, S. Lv, R. You, X. Yan, P. Sun, C. Wang, Y. Duan and G. Lu, Sens. Actuators, B, 2021, 326, 128828 CrossRef CAS.
- Y. Tong, T. Jiang, S. Qiu, K. Koshmak, A. Giglia, S. Kubsky, A. Bendounan, L. Chen, L. Pasquali, V. A. Esaulov and H. Hamoudi, J. Phys. Chem. C, 2018, 122, 2880–2889 CrossRef CAS.
- Y. Li, Z. Yin, G. Ji, Z. Liang, Y. Xue, Y. Guo, J. Tian, X. Wang and H. Cui, Appl. Catal., B, 2019, 246, 12–20 CrossRef CAS.
- J. Pang, R. G. Mendes, A. Bachmatiuk, L. Zhao, H. Q. Ta, T. Gemming, H. Liu, Z. Liu and M. H. Rummeli, Chem. Soc. Rev., 2019, 48, 72–133 RSC.
- C. Han, X. Li, Y. Liu, X. Li, C. Shao, J. Ri, J. Ma and Y. Liu, J. Hazard. Mater., 2021, 403, 124093 CrossRef CAS PubMed.
- X. Chen, J. Hu, P. Chen, M. Yin, F. Meng and Y. Zhang, Sens. Actuators, B, 2021, 339, 129902 CrossRef CAS.
Footnote |
| † Electronic supplementary information (ESI) available. See DOI: 10.1039/d1nr06838e |
| This journal is © The Royal Society of Chemistry 2022 |