
Green ammonia synthesis using CeO2/RuO2 nanolayers on vertical graphene catalyst via electrochemical route in alkaline electrolyte†
HyungKuk
Ju‡
*ab,
Dong Han
Seo‡
 *cd,
Sunki
Chung‡
efg,
Xin
Mao
h,
Byeong-Seon
An
i,
Mustafa
Musameh
j,
Thomas R.
Gengenbach
j,
Hokyong
Shon
c,
Aijun
Du
h,
Avi
Bendavid
k,
Kostya (Ken)
Ostrikov
h,
Hyung Chul
Yoon
l,
Jaeyoung
Lee
efg and
Sarbjit
Giddey
b
*cd,
Sunki
Chung‡
efg,
Xin
Mao
h,
Byeong-Seon
An
i,
Mustafa
Musameh
j,
Thomas R.
Gengenbach
j,
Hokyong
Shon
c,
Aijun
Du
h,
Avi
Bendavid
k,
Kostya (Ken)
Ostrikov
h,
Hyung Chul
Yoon
l,
Jaeyoung
Lee
efg and
Sarbjit
Giddey
b
aHydrogen Research Department, Korea Institute of Energy Research, 152 Gajeong-ro, Yuseong-gu, Daejeon 34129, Republic of Korea. E-mail: hyungkuk.ju@kier.re.kr
bCSIRO Energy, Private Bag 10, Clayton South, Victoria, 3169, Australia
cSchool of Civil and Environmental Engineering, University of Technology Sydney, P.O. Box 123, 15 Broadway, NSW 2007, Australia. E-mail: dhseo@kentech.ac.kr
dKorea Institute of Energy Technology (KENTECH), Naju, Republic of Korea
eSchool of Earth Sciences and Environmental Engineering, Gwangju Institute of Science and Technology (GIST), Gwangju 61005, Republic of Korea
fInternational Future Research Center of Chemical Energy Storage and Conversion Processes, GIST, Gwangju 61005, Republic of Korea
gErtl Centre for Electrochemistry and Catalysis, GIST, Gwangju 61005, Republic of Korea
hSchool of Chemistry and Physics and Centre for Materials Science, Queensland University of Technology (QUT), Brisbane, 4000, Australia
iPlatform Technology Laboratory, Korea Institute of Energy Research, 152 Gajeong-ro, Yuseong-gu, Daejeon 34129, Republic of Korea
jCSIRO Manufacturing, Private Bag 10, Clayton South, VIC 3169, Australia
kCSIRO Manufacturing, PO Box 218, Lindfield, NSW 2070, Australia
lClimate Change Research Division, Korea Institute of Energy Research, 152 Gajeong-ro, Yuseong-gu, Daejeon 34129, Republic of Korea
First published on 24th December 2021
Abstract
The electrochemical synthesis of ammonia at ambient temperature and pressure has the potential to replace the conventional process for the production of ammonia. However, the low ammonia yield and poor long-term stability of catalysts for the synthesis of ammonia hinders the application of this technology. Herein, we endeavored to tackle this challenge by synthesizing 3-D vertical graphene (VG) on Ni foam via a one-step, low-temperature plasma process, which offered high conductivity and large surface area. Subsequently, the vertical graphene on Ni foam was loaded with nanolayers of ruthenium oxide (RuO2, ∼2 nm) and cerium oxide (CeO2, <20 nm) nanoparticles via magnetron sputtering. The incorporation of nanoparticle layers (RuO2 and CeO2/RuO2) on VG significantly increased the NH3 yield in KOH electrolyte. Finally, the performance and long-term stability of this composite material were successfully demonstrated by the addition of CeO2/RuO2 nanolayers on the VG electrocatalyst. The catalyst achieved an excellent performance with a high ammonia synthesis yield of 50.56 μg mgtotal cat.−1 h−1 (1.11 × 10⁻¹⁰ mol cm−2 s−1) during the performance evaluation period of 36 h. This observation was also verified by density functional theory calculation, where CeO2 exhibited the best catalytic performance compared to RuO2 and pristine graphene.
 Dong Han Seo | Dong Han Seo is currently appointed as an Associate Professor at the Korea Institute of Energy Technology (KENTECH). He completed his PhD from University of Sydney in 2015 and was awarded an Australian Institute of Physics Best Postgraduate Award in 2014. In same year, he obtained the prestigious OCE Postdoctoral Fellowship at CSIRO. Then he was promoted to research scientist in 2017. In 2020, he won the prestigious UTS Chancellor's research fellowship. His research focus is on nanomaterial synthesis using plasma & thermal processes and applying them in energy storage devices, and membranes for water purification. |
1. Introduction
Recently, the electrochemical production of ammonia has attracted immense attention and has become an intensely researched topic due to the diverse ever-increasing range of applications of ammonia including as fertilizers and industrial chemical commodities, which is also considered a renewable energy carrier and a carbon neutral liquid fuel.1–6 Currently, ammonia is synthesized via the conventional high-pressure (<200 bar), high-temperature (400–500 °C)-driven process known as the “Haber–Bosch process”. In addition, the ammonia synthesis reaction (N2 + 3H2 = 2NH3) is an exothermic process (ΔH = −46 kJ mol−1) and thermodynamically favoured at low temperatures and high pressures. However, it is well known that the Haber–Bosch process requires unfavourable high temperature conditions due to its sluggish catalytic kinetics and even extremely high pressures to achieve the desirable synthesis of ammonia. However, the ammonia yield under these conditions is still only around 3–6% in a single pass through one catalyst bed.1,5–8 Alternatively, compared to the conventional Haber–Bosch process, ammonia synthesis via the electrochemical route can offer significant advantages including ambient conditions (<100 °C and ∼1 bar) with a relatively simple process (single reactor) and low capital cost for its production. These advantages minimize the significant costs associated with the compression of gases and high-pressure and high-temperature reactor. In particular, electrochemical ammonia synthesis based on the solid polymer membrane process can enable the use of diverse hydrogen sources (including water, seawater, and alcohols) instead of H2 sourced from fossil fuels such as natural gas, fuel oil, and coal. Currently, the majority of the ammonia is produced by sourcing hydrogen via the steam reforming of natural gas, which contributes to high CO2 emissions.9,10 Therefore, the electrochemical route has potential to be the future process for the green production of ammonia with zero CO2 emissions and for decentralized ammonia production by utilizing green electricity generated from renewable energy sources to substantially reduce the carbon footprint.However, the low yield of this green ammonia production via the electrochemical route is a significant challenge, limiting its wide use in industry. One of the key contributing factors to the low yield in the synthesis of ammonia is the low selectivity of the catalyst for the desired reaction. The electrocatalyst is used for two competing reactions, i.e., the hydrogen evolution reaction (HER) and ammonia synthesis by nitrogen fixation. The HER is favoured over the electrochemical N2 fixation reaction due to the high bond energy (941 kJ mol−1) of the stable N2 molecules (N![[triple bond, length as m-dash]](https://www.rsc.org/images/entities/char_e002.gif) N triple bond), their low polarizability, and very poor solubility of N2 in aqueous media.11 Therefore, ideal electrocatalysts should be selective for N2 fixation and hydrogenation (associative mechanism) for the N2 reduction reaction (NRR) with minimum HER activity.11–13 Moreover, the poor long-term stability of catalysts is also a significant issue. The ammonia synthesis reaction rate is often degraded over time due to the physical detachment or/and physiochemical degradation of the catalysts from the electrode interfaces or/and the catalyst interaction sites becoming inactive. Therefore, significant research effort has been globally directed towards the development of highly effective and stable catalysts for the electrochemical production of ammonia.
N triple bond), their low polarizability, and very poor solubility of N2 in aqueous media.11 Therefore, ideal electrocatalysts should be selective for N2 fixation and hydrogenation (associative mechanism) for the N2 reduction reaction (NRR) with minimum HER activity.11–13 Moreover, the poor long-term stability of catalysts is also a significant issue. The ammonia synthesis reaction rate is often degraded over time due to the physical detachment or/and physiochemical degradation of the catalysts from the electrode interfaces or/and the catalyst interaction sites becoming inactive. Therefore, significant research effort has been globally directed towards the development of highly effective and stable catalysts for the electrochemical production of ammonia.
A diverse range of metals (Au, Ru, Rh, Pd, Mo, Fe, Bi, Cu, etc.),14–23 metal oxides (NiO, MnO, Fe2O3, Cr2O3, TiO2, RuO2, etc.),24–29 non-metallic nanomaterials (B4C, zeolitic based MOF, etc.),14,30 and sulfur complexes (MoS2, FeSx, ReS, etc.)31–34 have been explored as promising catalyst candidates for the NRR in acid, neutral, and alkaline media. Among the heterogeneous catalysts, employing metal oxide-based nanoscale electrocatalysts can be an interesting strategy to suppress the intrinsic HER and enhance the catalyst selectivity for the electrochemical reduction of N2 to ammonia. Recently, Singh et al.12 theoretically proposed that a metal-thin insulator-catalyst may provide increasing NRR selectivity to ammonia by suppressing the HER by limiting the electron transfer. Skúlason's group35 used density functional theory (DFT) calculations to explore the possible activities of various rutile-structured metal oxides and some metal oxide candidates for the electrochemical NRR, which exhibited stable and high activity toward ammonia synthesis, while simultaneously reducing the dominant competing HER. In addition, this approach for suppressing the HER using metal oxide catalysts has been also suggested as a way to solve the electrochemical reduction of CO2 gas in aqueous media.36,37 Another key consideration for the NRR environment is the selection of the electrolyte medium. Again, the undesirable HER is significantly dominant in acidic media with a two orders of magnitude higher current density compared to that in alkaline media. Moreover, alkaline electrolyte offers an environment for the accurate measurement of the products via the direct formation of gaseous ammonia according to Henry's law and reducing the NOx contamination, minimizing the false positive results of ammonia synthesis yield.38 Further, non-noble metal oxides can be utilized as potentially active electrocatalysts in alkaline electrolyte (NaOH and KOH).39,40 Mukherjee et al.41 reported that the overall ammonia synthesis rates using ZIF-derived nitrogen-doped carbon catalysts can be up to one order of magnitude higher (up to 2.03 × 10⁻⁹ mol cm−2 s−1 at 60 °C) in KOH electrolyte than in NaOH electrolyte, suggesting that K+ ions act as promoters. When comparing the electrochemical performances of different catalysts for the NRR, a further complication arises when the catalyst itself contains nitrogen functional groups and dopants, which may contribute to the ammonia production, leading to the overestimation of the catalyst performances.42,43 Interestingly, the Li-mediated non-aqueous electrolyte strategy has been reported recently to improve the N2 solubility with a very high faradaic efficiency of up to about 82%.44–48 However, for the implementation of this strategy, some questions such as the Li mediator reaction mechanism and the use of high overpotentials need to be solved.
Thus, to avoid the above-mentioned complications, in this work we synthesized all our catalysts in an ultra-high vacuum environment using highly purified gas sources and target to avoid any potential contamination from the nitrogen sources affecting our results. For example, the synthesis of vertical graphene (VG) was carried out using a highly purified methane source in a well-controlled high vacuum chamber.49,50 Unlike the other widely used methods of chemical exfoliation and mechanical exfoliation of graphite for the synthesis of graphene-based materials, which are rich in oxygen and potentially nitrogen functional groups (pyridinic, pyrrolic, and graphitic N), using our plasma process, we could synthesize high-purity graphene films with high structural quality.51,52 Moreover, nanolayer depositions of CeO2 and RuO2 were carried out in an ultra-high vacuum chamber using a high purity target, which again were free from potential N contamination. Therefore, we believe that the results presented in this work are free from any overestimation arising due to the presence of any nitrogen species present in the samples. Finally, in this work, we demonstrated for the first time, novel composite nanolayers of RuO2 and CeO2 supported on a high surface area, pure carbon-based 3-D graphene structure and explored their electrocatalytic performance in the electrochemical ammonia synthesis process. We observed a negligible electrochemical catalytic reaction from 3-D VG itself, where the incorporation of a nanolayer of RuO2 increased the catalytic activity for the NRR in 0.1 M KOH electrolyte. This ammonia production performance was further enhanced by incorporation of a nanolayer of CeO2, where the CeO2/RuO2/VG composite exhibited 1.5-times higher electrocatalytic activity and selectivity for the NRR. Moreover, the CeO2/RuO2/VG composite exhibited a stable ammonia production for an evaluation period of 36 h, demonstrating its potential as a long-term stable catalyst for ammonia production, as determined by the ion-selective electrode (ISE) method and cross-checked with the indophenol blue method. We compared the 14N2 experiment with 1H nuclear magnetic resonance (NMR) spectroscopy as a final alternative confirmation analysis to further elucidate the synthesis of ammonia. Besides, our rigorous experimental observation was supported by DFT calculation, where we observed similar orders of reaction potential with the experimental results. Lastly, we demonstrated that the addition of two metal oxide layers was helpful in improving the catalytic performance for the production of ammonia, whereby the deposited nanolayers helped to suppress the H2 generation reaction, while promoting the electrochemical N2 fixation reaction and increasing the ammonia production rate. Our result will pave the way towards the development of long-term stable and highly effective catalysts for the electrochemical production of ammonia in the future.
2. Experimental
The electrochemical NRR (ammonia synthesis) measurements were carried out with a VersaSTAT 4 (Princeton Applied Research, USA) using a three-electrode configuration in an optimized glass H-type cell with a two-compartment chamber (see Fig. S1 of the ESI†). The H-type cell consisted of a working (ammonia synthesis side) and counter (water oxidation reaction side) electrode chamber, separated by a Nafion 115 membrane (typical thickness: 127 μm, DuPont™, USA). Pt gauze (1 cm × 1 cm, 100 mesh, 99.9%, Aldrich) and Ag/AgCl, 3 M KCl (Mettler Toledo, Switzerland) were employed as the counter and reference electrodes, respectively. All electrochemical results in this work were converted to the RHE reference scale via calibration using the following equation: E (vs. RHE) = E (vs. Ag/AgCl) + 0.197 V + (0.0591 × pH). To clean the polymer membrane, it was pre-treated using the typical Nafion membrane treatment method by boiling in 5 wt% H2O2 (30%, VWR international, USA) and 0.5 M H2SO4 (32%, Merck, EMSURE) at 90 °C, respectively, and then the pre-treated membrane was well rinsed with ultrapure water (18.2 MΩ cm, Simplicity® UV Water Purification System, type I, Merck) and filtered using a Millipore 0.22 μm filter, as detailed in a previous report on PEM electrolysis.53 The prepared Nafion membrane was stored in ultra-high purity Ar (>99.997%, BOC Limited) saturated 1 M KOH solution (45 wt% in H2O, Sigma Aldrich) for 1 day before use in the electrochemical experiments to minimize any contamination sources. All tests were conducted in N2-saturated 0.1 M KOH (pH = ca. 12.88) using an H-type cell and agitated with a stirring bar at a rate of ca. 300 rpm. The electrolyte at the cathode chamber was continuously purged with ultra-high purity N2 gas (99.999%, BOC Limited) for 30 min via a glass sparger before performing all experiments. All the prepared samples (CeO2/RuO2/VG, RuO2/VG, CeO2/VG and pure VG on Ni foam) were rinsed with 0.05 M H2SO4, ultrapure water and 0.1 M KOH, and then used as the working electrode with an active area of 0.785 cm2 exposed to the electrolyte. The electrochemical experiments were carried out at room temperature (20 °C) and ambient pressure. All produced gases from the cathode chamber were passed through an acid solution (0.05 M H2SO4) cold trap and the amounts of NH3 were quantitatively determined via the ion-selective electrode (ISE) method using an HQ430d meter (HACH, USA) and cross-checked using the indophenol blue method and a UV-vis spectrophotometer (Evolution 201, Thermo Scientific), as detailed in the ESI.† For the accuracy and precision result data, all determinations of NH3 or/and NH4+ were repeated more than 3 times with three-point calibration curves and the final NH3 formation rate was normalized by considering the background. In particular, we carried out well-controlled experiments to investigate the reliability of the results in terms of pre-contamination of any ammonia-related sources before the NRR test, as recommended by recent review papers.7,22 Ar and N2 were bubbled in 0.1 M KOH solution without the electrode and with the prepared electrode at open circuit voltage (OCV) for about 2 h after pre-saturation with each gas for 30 min with no current flow passing via a 0.05 M H2SO4 solution cold trap. The concentration level of any NH3-related sources was negligible in all cases, but the values were normalized as a background. The produced ammonia (NH4+ in 0.05 M H2SO4) from the cathode chamber was identified in the 14N2 experiment using 900 MHz 1H liquid-state nuclear magnetic resonance (1H NMR) spectroscopy (Bruker, Korea Basic Science Institute, Ochang, South Korea). All experiments were performed least three times to improve the accuracy and reproducibility of the results and try to follow the current recommended protocols for rigorous research. To analyse the microstructure of the CeO2/RuO2/VG electrode, transmission electron microscopy (TEM) samples were prepared using the conventional drop-casting method. The samples were investigated using an analytical TEM (JEOL, JEM-ARM200F NEOARM) at 200 kV equipped with a cold field-emission gun (CFEG) and an energy-dispersive X-ray spectrometer (EDX, Oxford). The elemental distribution in the CuO2/RuO2 film was determined via STEM-EDX.Density functional theory (DFT) within the generalized gradient approximation of the Perdew–Burke–Ernzerhof functional, as implemented in the Vienna ab initio simulation package (VASP) was performed for the cell relaxation and structure optimisation.54–56 The convergence tolerances of energy, force, and displacement for the geometry optimization were set to 10−5 eV, and 5 × 10⁻³ eV Å−1, and 5 × 10⁻³ Å, respectively. The DFT + D3 semi-empirical correction in Grimme's scheme was used to correct the dispersion interaction.57 The cut-off energy was set to be 500 eV during the calculation. To avoid the interaction between periodical images, the vacuum space was set to be more than 20 Å. 2 × 2 × 1 k-point grids were used to represent the Brillouin zone for geometric optimization. For the metal oxide surfaces, we built four metal layers and each layer contained 4 × 4 supercell, and the last two layers were set to frozen during the calculation. The overpotential was obtained using the equation 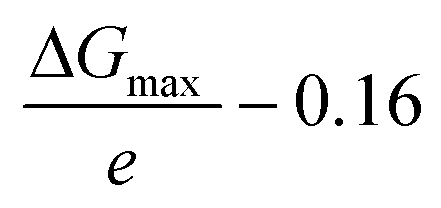 , where ΔGmax stands for the largest free energy change in the N2 reduction pathway and 0.16 V is the equilibrium potential. The Gibbs free energy changes (ΔG) for each elementary step were calculated based on the computational hydrogen electrode model proposed by Norskov's group,58–60 which can be calculated as follows:
| ΔG = ΔE + ΔZPE − TΔS + ΔGU + ΔGpH |
![[thin space (1/6-em)]](https://www.rsc.org/images/entities/char_2009.gif) ln10 × pH.
ln10 × pH.
3. Results and discussion
3.1. Synthesis and characterization of CeO2/RuO2/vertical graphene (VG) electrode
Fig. 1 describes the process for the synthesis of the CeO2/RuO2/vertical graphene (VG) electrode. Porous Ni foam was chosen as the base substrate for the deposition of VG, RuO2 and CeO2 nanoscale thin films due to its macroscopic high surface area and porosity (BET surface area of VG: ∼1500 m2 g−1 and pore volume: ∼2.80 m3 g−1), which is expected to provide a high surface area for efficient ammonia production.61 The Ni foam was loaded in an inductively coupled plasma chamber to synthesize the 3-D VG film via a single-step, low-temperature (<450 °C), rapid (∼10 min) plasma process, where microporous, vertically oriented and interconnected graphene sheets were synthesized on the Ni foam. The vertical graphene was further expected to provide additional high surface area and interaction sites for the deposition of hetero-thin films (RuO2 and CeO2) and interaction with the electrolyte for efficient ammonia production. After the synthesis of VG (0.25 mg cm−2 on Ni foam), RuO2 (70 μg cm−2) and CeO2 (37 μg cm−2) nanoscale thin films were deposited via a magnetron sputtering process to synthesize CeO2/RuO2/VG on Ni foam as NRR electrodes.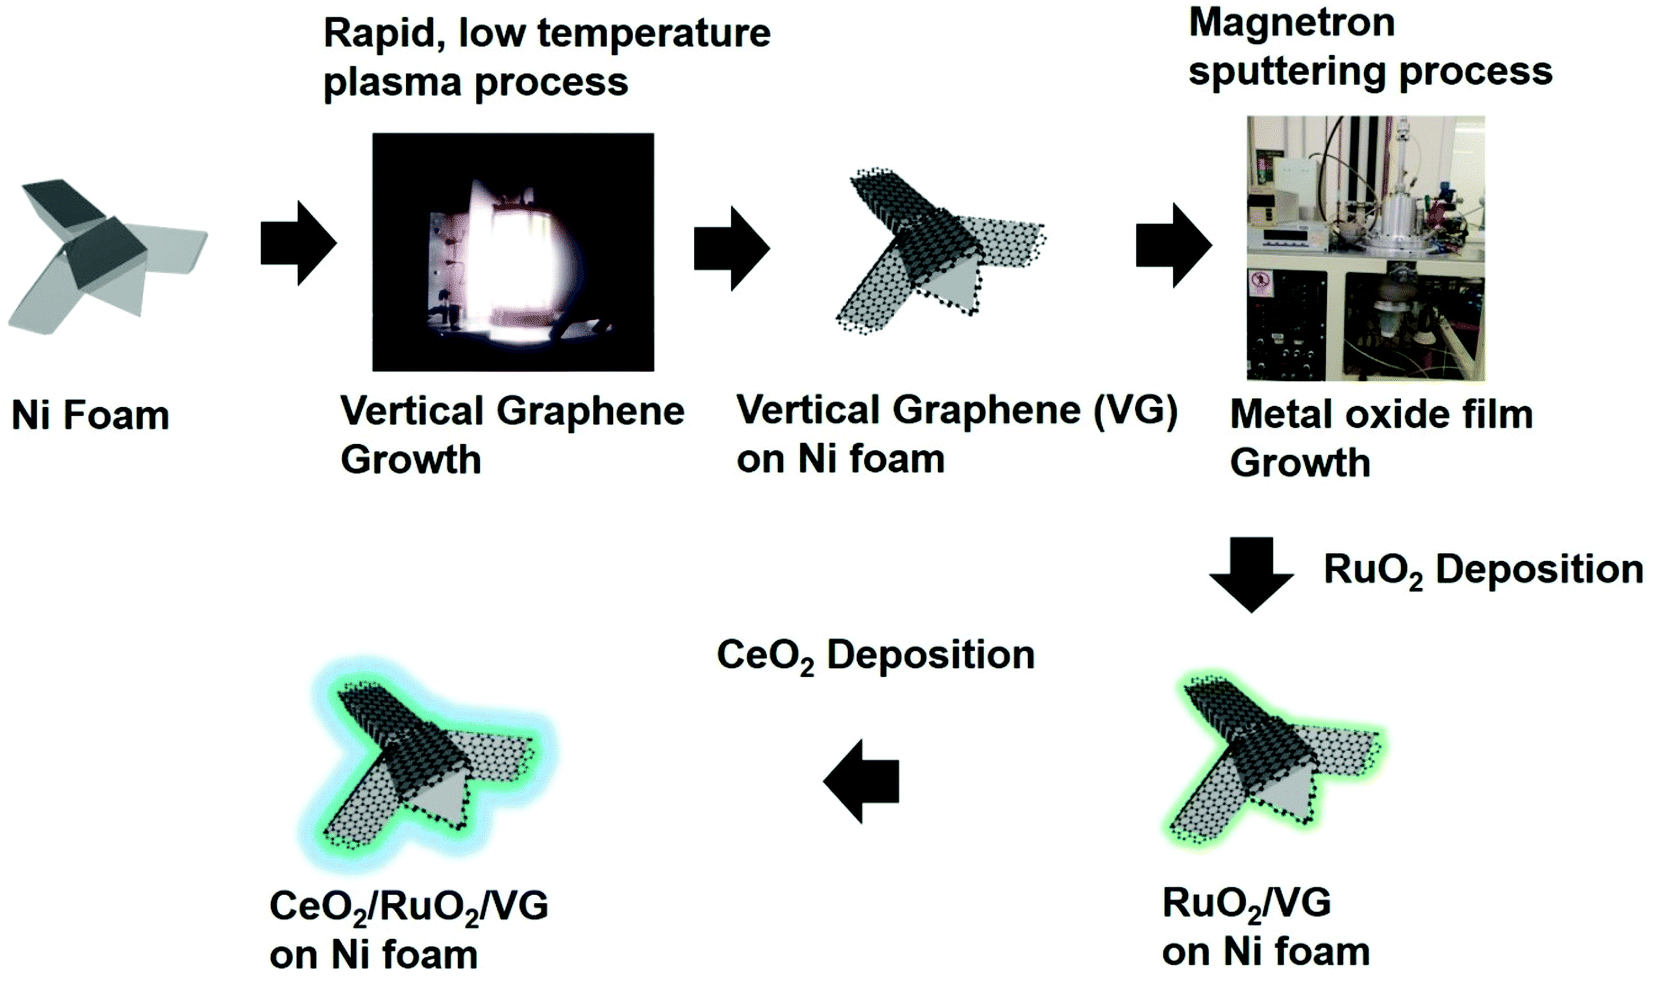 | ||
| Fig. 1 Schematic of the synthesis of vertical graphene (VG), RuO2/VG, and CeO2/RuO2/VG on Ni foam. VG was synthesized via a rapid and low-temperature plasma process on Ni foam, where the deposition of a nanolayer of RuO2 followed by a CeO2 nanolayer was carried out via magnetron sputtering. | ||
Fig. 2 shows the FE-SEM images and EDX spectra of VG, RuO2/VG and CeO2/RuO2/VG on Ni foams as NRR electrodes. Fig. 2a–c (see also Fig. S2 and S3†) represent the low- and high-magnification SEM images and the EDX spectrum of the VG electrode on Ni foam, respectively. The SEM images of VG exhibit the high porosity and open structure of the interconnected vertically aligned graphene sheets and the EDX spectrum reveals the presence of carbon and Ni with the absence of other heteroatoms. Fig. 2d–f (see also Fig. S2 and S3 in the ESI†) show the low- and high-magnification SEM images and the EDX spectrum of the RuO2/VG film on Ni foam, respectively. It can be observed that the interconnected and vertically aligned graphene sheets are decorated with a thin layer of RuO2, where transparent graphene sheets were no longer visible, while thicker decorated graphene sheets can be observed. The presence of an RuO2 layer and VG was again confirmed by the EDX spectrum, exhibiting the presence of C, Ru, and O elements, while the electrode was free of any other hetero-elemental species (e.g., N sources). Fig. 2g–i (see also Fig. S2†) show the low- and high-magnification SEM images and the EDX spectrum of CeO2/RuO2/VG on Ni foam, respectively. Similar to the case of RuO2/VG, vertically aligned thicker graphene sheets were observed, while EDX revealed the presence of C, Ru, Ce and O elements, confirming the presence of VG, RuO2 and CeO2 layers. Again, no heteroatoms such as nitrogen groups were detected in the EDX spectrum. Furthermore, EDX mapping of the CeO2/RuO2/VG electrode revealed the presence of C, Ru, Ce and O, thus reinforcing the presence of VG, RuO2 and CeO2 layers (Fig. S3†).
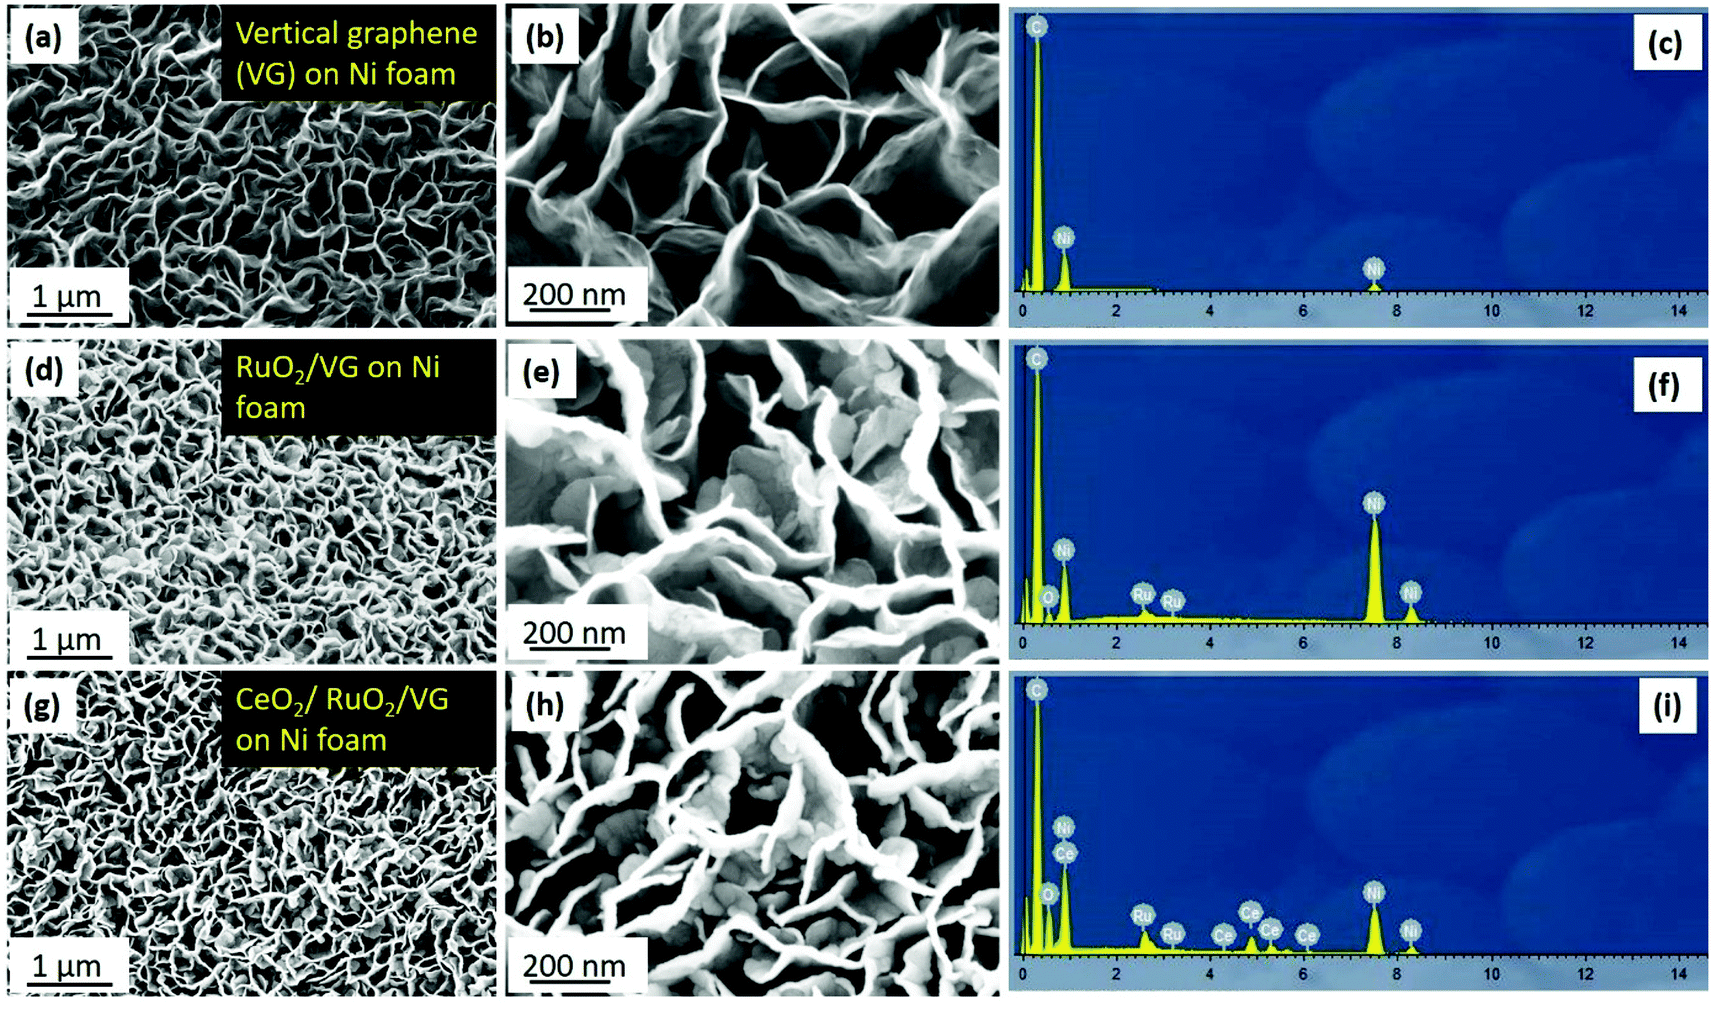 | ||
| Fig. 2 SEM images and EDX spectra of VG, RuO2/VG, and CeO2/RuO2/VG on Ni foam. SEM images of VG (a and b) reveal interconnected graphene sheets in a unique 3-D morphology, providing a high surface area for the deposition of the catalyst and interactions. Moreover, the transparent graphene sheets reveal that the individual graphene flakes are composed of few layers of graphene. (c) EDX spectrum of VG on Ni foam, where the strong carbon peak is observed without any hetero-atom contamination. The Ni peak arises due to the presence of Ni foam. (d and e) SEM images of RuO2/VG on Ni foam, where it can be observed that the transparent edges of the graphene flakes disappeared after the deposition of the RuO2 layer. (f) EDX spectrum of RuO2/VG on Ni foam, where an additional peak of Ru and O peak together with C and Ni peaks can be observed, confirming the addition of an RuO2 layer. (g and h) SEM images of CeO2/RuO2/VG on Ni foam. (i) EDX spectrum of CeO2/RuO2/VG on Ni foam, confirming the addition of RuO2 and CeO2 layers without any heteroatom contamination. | ||
Fig. 3 shows the high-resolution TEM (HR-TEM) micrographs of the synthesized CeO2/RuO2/VG. Fig. 3a and b reveal the distribution of the layers of CeO2 and RuO2 nanoparticles distributed on the edge planes of the vertical graphene sheets. According to Fig. 3a, it can be observed that the nanoparticles are concentrated on the first ca. 150 nm of the upper edge plane of the VG sheets and a slightly less concentrated nanoparticle layer was formed beyond 150 nm in thickness, arising from the 3D nature of the VG/Ni support. The subsequent higher magnification TEM images shown in Fig. 3b show the varying particle size distributions (2–20 nm) and shapes (spherical and interconnected) together with the crystalline nature of these CeO2 (<20 nm) and RuO2 (∼2 nm) nanoparticles, which can be seen from the crystalline lattice of the nanoparticles. Moreover, the graphitic lines arising from the atomic lattice of the vertical graphene sheets are also visible in the high-magnification TEM image. To identify the phases deposited on the VG sheet, the fast Fourier transforms (FFTs) were obtained, as shown in Fig. 3c and d. Based on the phase analysis using the FFTs, the phases were identified to be CeO2 and RuO2, respectively. Fig. 3e and f show the HAADF-STEM images of CeO2/RuO2/VG, which also verified the clarity of the layers of nanoparticle distribution on the VG sheets. To further confirm the chemical composition of the nanoparticles deposited on the edges, the STEM-EDX spectrum and elemental mapping were obtained. As shown in Fig. 3g, the CeO2 and RuO2 nanoparticles were confirmed to exist on the VG sheets based on the mapping of the C, O, Ru, and Ce elements. Furthermore, the elemental ratios suggest the presence of RuO2 and potentially the presence of mixed oxidation states of CeOx.
 | ||
| Fig. 3 TEM micrographs of CeO2/RuO2/VG. (a–d) HR-TEM images of layers of CeO2/RuO2 nanoparticles distributed on the vertical graphene sheets. (e and f) HAADF-STEM images of CeO2/RuO2/VG. (g) Elemental composition of CeO2 and RuO2 nanoparticles distributed on the vertical graphene sheets. | ||
Fig. 4 shows the Raman spectra of the as-prepared VG, RuO2/VG and CeO2/RuO2/VG on Ni foam. Fig. 4a presents the Raman spectrum of VG, where three distinct peaks of D, G and 2D are observed.45 The D peak is located at ∼1350 cm−1, which is due to the finite crystallite size effect and/or various defects induced in the sp2 carbon materials. The G peak is located at ∼1580 cm−1, corresponding to the in-plane vibrational E2g mode of the sp2-bonded carbon. The 2D peak located at ∼2690 cm−1 is ascribed to the second-order Raman spectral vibration from the 3D interplanar stacking of the hexagonal carbon networks.62Fig. 4b and d show the Raman spectra of the RuO2/VG electrode. All the distinct features of VG were present, while additional peaks were observed in the range of 400 cm−1 to 800 cm−1, which are due to the presence of RuO2. The peak located at ∼530 cm−1 represents the Eg vibration mode of RuO2 and the additional peak located at ∼640 cm−1 represents the A1g vibration mode of the RuO2 layer, which confirm the presence of RuO2 together with VG.63Fig. 4c and e show the Raman spectra of the CeO2/RuO2/VG electrode. In the case of the CeO2/RuO2/VG electrode, all three distinct peaks of VG were present together with the A1g vibration mode of the RuO2 layer. Moreover, a new peak located at ∼460 cm−1 appeared due to the F2g vibration mode from the CeO2 layer, confirming the presence of VG, RuO2 and CeO2 layers.64 Interestingly, the E2g vibration mode from the RuO2 layer was suppressed.
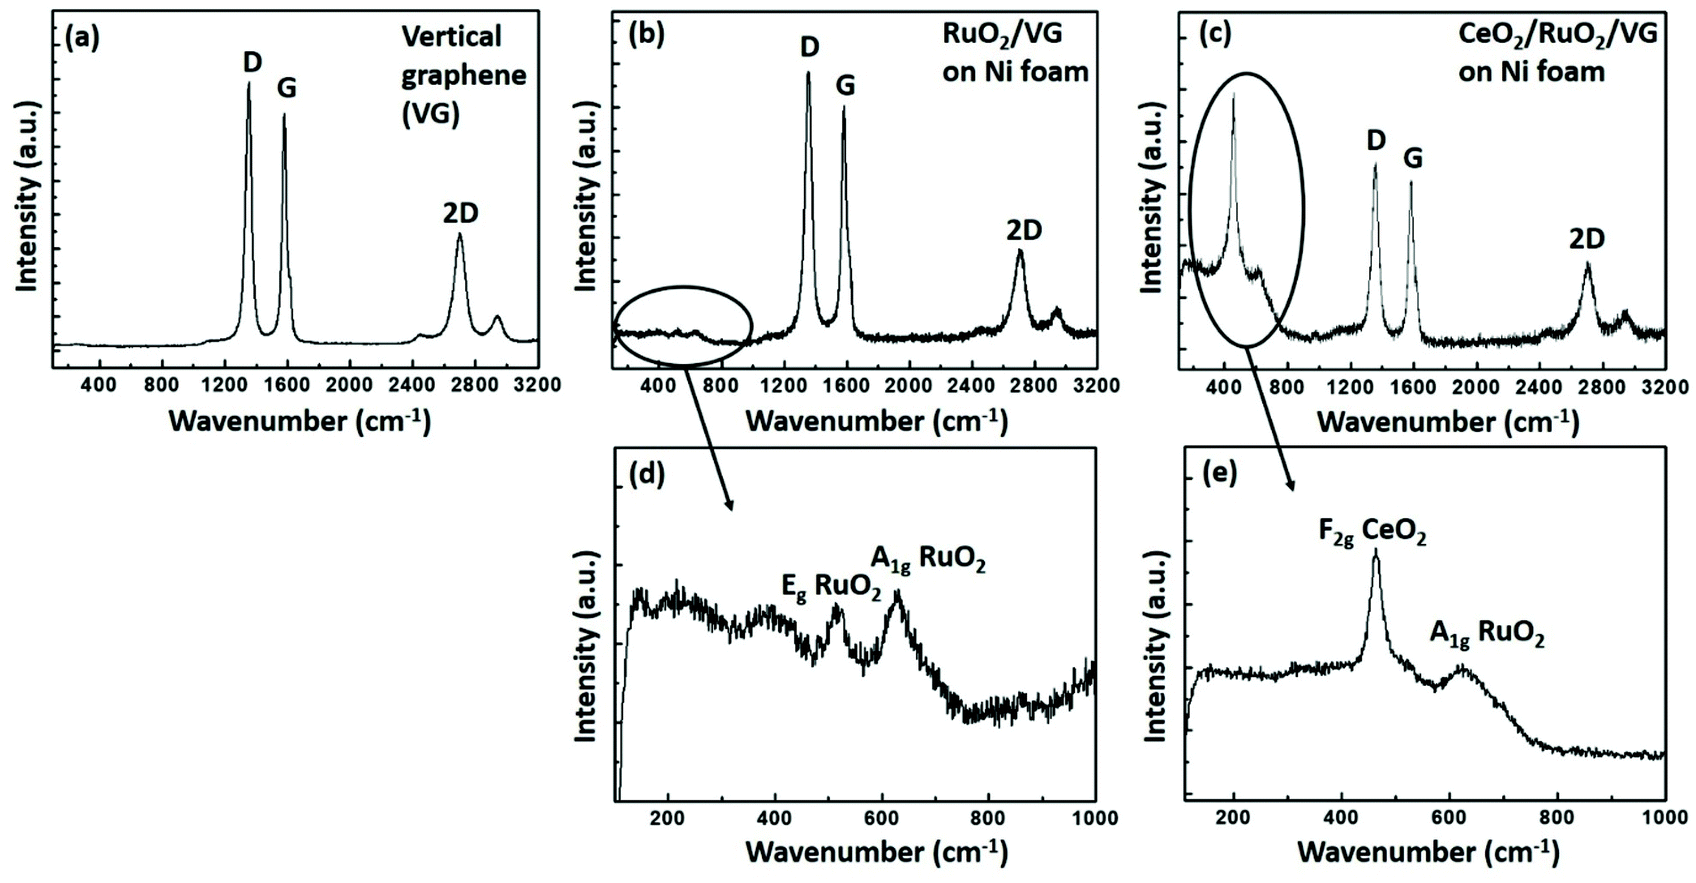 | ||
| Fig. 4 Raman spectra of (a) VG, (b) RuO2/VG, and (c) CeO2/RuO2/VG on Ni foam. (d) Raman peaks arising from the presence of RuO2 layers. (e) Spectrum confirming the presence of both CeO2 and RuO2 layers. | ||
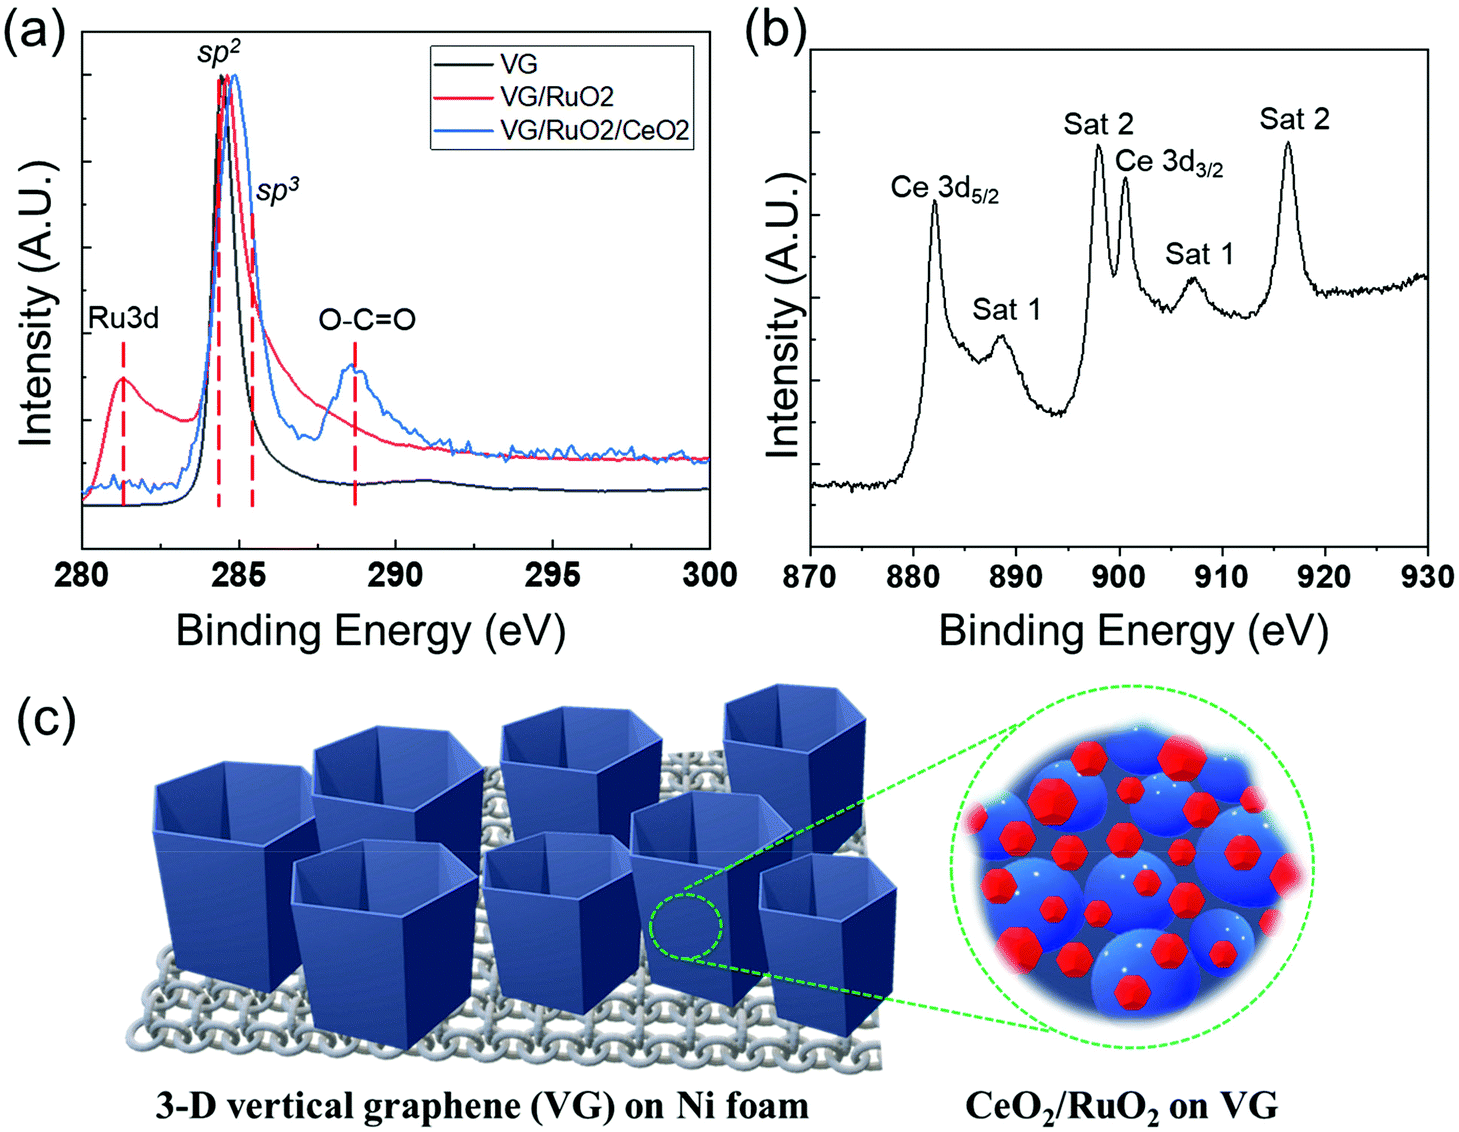
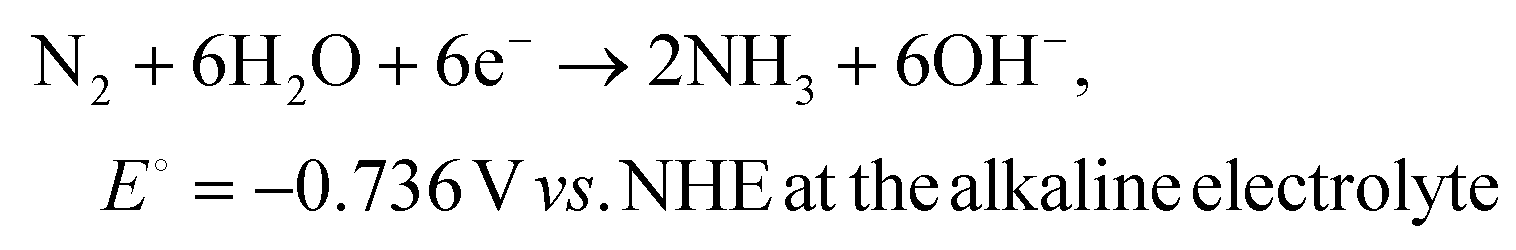
The surface composition and chemical properties of the VG film and the presence of Ru and Ce on its surface were further investigated by XPS, as shown in Fig. 5. The XPS surface compositions (see Table S1†) clearly confirmed the deposition of successive RuOx and CeOx layers on the surface of VG. As expected, the surface of the pristine Ni foam consisted of a mixture of Ni oxide and hydroxide with a significant amount of adventitious surface carbon. After the synthesis of VG on the Ni foam, XPS only detected C with a very low concentration of O, indicating the complete coverage of the Ni foam by the graphene film. The shape of the C 1s peak, a sharp and narrow, asymmetric peak with a high binding energy tail, represents the spectrum of the typical graphitic structures, and together with the low O levels confirmed the presence of almost pure graphene on the surface at the binding energy of 284.5 eV, as shown in Fig. 5a. In the case of RuO2/VG, XPS detected the presence of Ru oxide in addition to graphene. The Ru 3d doublet overlapped with the C 1s peak, which complicated the interpretation, but it is clear that the main C 1s peak retained the characteristic peak shape of graphene (Fig. 5a). The Ru 3d5/2 peak was rather broad with the peak maximum at just above 281 eV. This suggests the presence of higher oxidation states of Ru, most likely mainly Ru4+ (RuO2). For the CeO2/RuO2/VG electrode, XPS detected a very substantial concentration of CeOx on the surface, while both the C and Ru levels were significantly reduced. This observation indicates the partial coverage of the RuO2/VG surface with CeOx. The Ce 3d high-resolution spectra of the CeO2/RuO2/VG electrode are shown in Fig. 5b. The Ce 3d peak shape is characteristic of Ce4+ (CeO2) and no evidence of the presence of Ce3+ was detected.65 In addition, XPS revealed that there were negligible levels of N source on the electrode surface (Table S1 and Fig. S4†). Note that the detection limit for nitrogen under the experimental conditions employed was at least 0.2 atom%. Finally, Fig. 5c shows a schematic of how the CeO2/RuO2/VG layers were deposited on the Ni foam, where VG was synthesized on Ni foam first to provide a high surface area for the deposition of the catalytic nanolayers of RuO2, followed by the deposition of a CeO2 nanolayer. To investigate the pore structure of the different VG-based catalysts, Brunauer–Emmett–Teller (BET) measurement was performed to obtain the N2 adsorption/desorption isotherms at 77 K, as shown in Fig. S5.† Based on the particle size distribution of VG and CeO2/RuO2/VG on Ni foam, the proportion of mesopores above 10 nm decreased after the deposition of the metal oxides, revealing that the metal oxides deposited on the electrode surface affected the pore structure of the vertical graphene to some extent. However, the slight changes in the pore structure can most likely be attributed to the further deposition of metal oxides. We expected that the added nanolayer would rarely impact the electrocatalytic activity of the electrode, in good agreement with the previous report.66
 | ||
| Fig. 5 High-resolution XPS spectra of VG, RuO2/VG, and CeO2/RuO2/VG on Ni foam. (a) C 1s and Ru 3d spectra of VG, RuO2/VG and CeO2/RuO2/VG on Ni foam. (b) Ce 3d spectrum of CeO2/RuO2/VG on Ni. (c) Schematic of the composite structure of CeO2/RuO2/VG on Ni foam. | ||
All the characterization results present solid evidence for the successful synthesis of nanoscale thin film structures of VG, RuO2/VG and CeO2/RuO2/VG on Ni foam. Furthermore, we confirmed that our electrodes for the ammonia synthesis test via the RF inductively coupled plasma chemical vapor deposition (CVD) and magnetron sputtering techniques were synthesized under rigorously controlled experimental conditions to exclude ammonia and any other N group sources, which was confirmed by the above-mentioned EDX and XPS analyses.
3.2. Electrochemical ammonia synthesis
The electrochemical nitrogen reduction reaction to form ammonia involves multistep processes involving the transfer of 6 electrons and 6 protons. The half-reactions of the electrochemical NRR process with the competing HER at the cathode chamber can be depicted as follows:67–69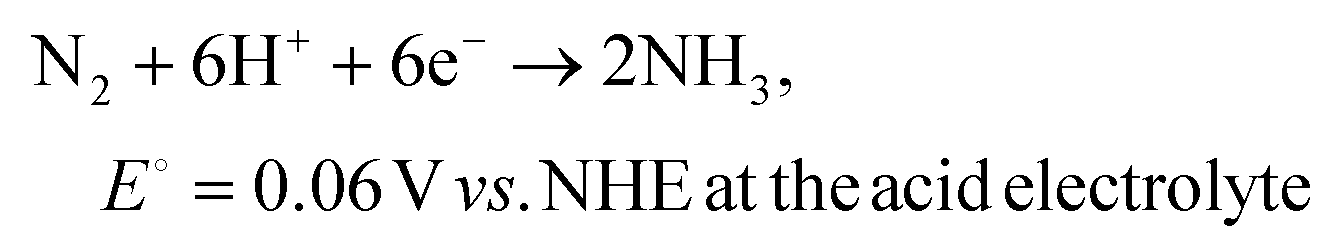 | (1) |
 | (2) |
| 2H+ + 2e− → H2, E0 = 0 V vs. NHE at the acid electrolyte | (3) |
 | (4) |
The electrochemical synthesis of ammonia can be thermodynamically spontaneous at ambient pressure and temperature below ∼175 °C, which means that the minimum required overall cell voltage at room temperature may be slightly lower (NRR for 1.17 V) compared to that for the water splitting cell (1.23 V).70 However, the HER only requires a 2-electron transfer compared with the intrinsically sluggish kinetics (6 electrons) and much more complicated multistep process of the NRR. Therefore, we expected that the NRR may need a much higher overpotential than the above-mentioned theoretical onset potential. To understand the electrochemical N2 reduction behaviour and electrocatalytic activity of the catalyst in an alkaline environment, the linear sweep voltammetry (LSV) curves were obtained for CeO2/RuO2/VG on the Ni foam electrode by scanning the voltage from 0 V to −1 V vs. RHE at a scan rate of 5 mV s−1 in Ar- and N2-satrurated 0.1 M KOH electrolyte, as shown Fig. 6a. Overall, the curves exhibit a similar shape and behaviour for both purge gases, but slightly higher current densities were produced at potentials lower than −0.4 V vs. RHE in N2-satrurated electrolyte, indicating that the electrochemical synthesis of NH3 occurred on the surface of CeO2/RuO2/VG due to the N2 reduction reaction. This trend of the LSV curve is in good agreement with the recently reported studies on the NRR in KOH,19,20,71–74 NaOH,75 Na2SO4,76 and LiCO477 electrolytes. As explained above, the onset potential of about −0.4 V vs. RHE for the N2 reduction appears to be significantly higher than that for the HER. In addition, the NRR to produce NH3 gas or/and NH4+ ions is thermodynamically favourable even under ambient conditions (at low temperature) and the electrocatalytic reaction for ammonia synthesis may be possible under moderate conditions (at all pH ranges and under the reduction potential) based on the Pourbaix diagram.78Fig. 6b shows the chronoamperometry results obtained for the CeO2/RuO2/VG on Ni foam electrodes in 0.1 M KOH solution with nitrogen purging gas. The measurements were made at different applied potentials ranging from −0.4 to −1.0 V vs. RHE for a 2 h duration using a different electrode for each chronoamperometric measurement. Although the tested electrode of CeO2/RuO2/VG on Ni foam was well-covered by nanoscale oxide layers, as confirmed by the above analyses, the corresponding current densities exhibited higher values in the range of −15 mA cm−2 at −0.4 V to −40 mA cm−2 at −1.0 V vs. RHE than the electrodes tested under a similar environment.79,80 Interestingly, irregular current oscillation behaviours were also observed in all cases during the chronoamperometry measurements. This perturbation in current oscillation increased gradually with an increase in the applied potential of the cell for the NRR test. The reason for these oscillations under a fixed applied potential is unclear, but we hypothesize that it may be associated with the competing HER vs. NRR. The dominant side-reaction of proton reduction to generate hydrogen bubbles may reduce the physiochemically active sites on the catalyst interface (cathode surface) for further reduction of N2 with an increase in overpotential. These competing HER and NRR processes result in a low ammonia synthesis yield at high reduction potentials given that most of the protons (H+)/electrons (e−) in acid solution or the reduction of water (H2O) with electrons in alkaline solution will produce hydrogen.12,18,81 The produced ammonia was measured by the ISE method (Fig. S6†) and the average NH3 formation rates were normalized to the area of the working electrode and the reaction time (see also Experimental section), as shown in Fig. 6c. The highest average NH3 formation yield rate and faradaic efficiency (FE) value by the ISE method using the CeO2/RuO2/VG on Ni foam electrode were achieved at −0.6 V vs. RHE, which were 5.69 × 10⁻¹¹ mol cm−2 s−1 and 1.39%, respectively. We believe that the achieved value of NH3 formation using a small amount of noble metal oxide catalyst is reasonably higher than that of the reported NRR catalysts under similar alkaline-based conditions by following recently recommended protocols (without using N-contaminated catalyst precursors and N-doped catalysts), as summarized in Table S2.† When the applied potential was more negative (much higher overpotential) than −0.6 V vs. RHE, both the NH3 formation rate and FE values decreased, which is most likely associated with the major competitive reaction of hydrogen production being facilitated on the catalyst surface, leading to a decrease in both NH3 formation rate and FE, as explained above.
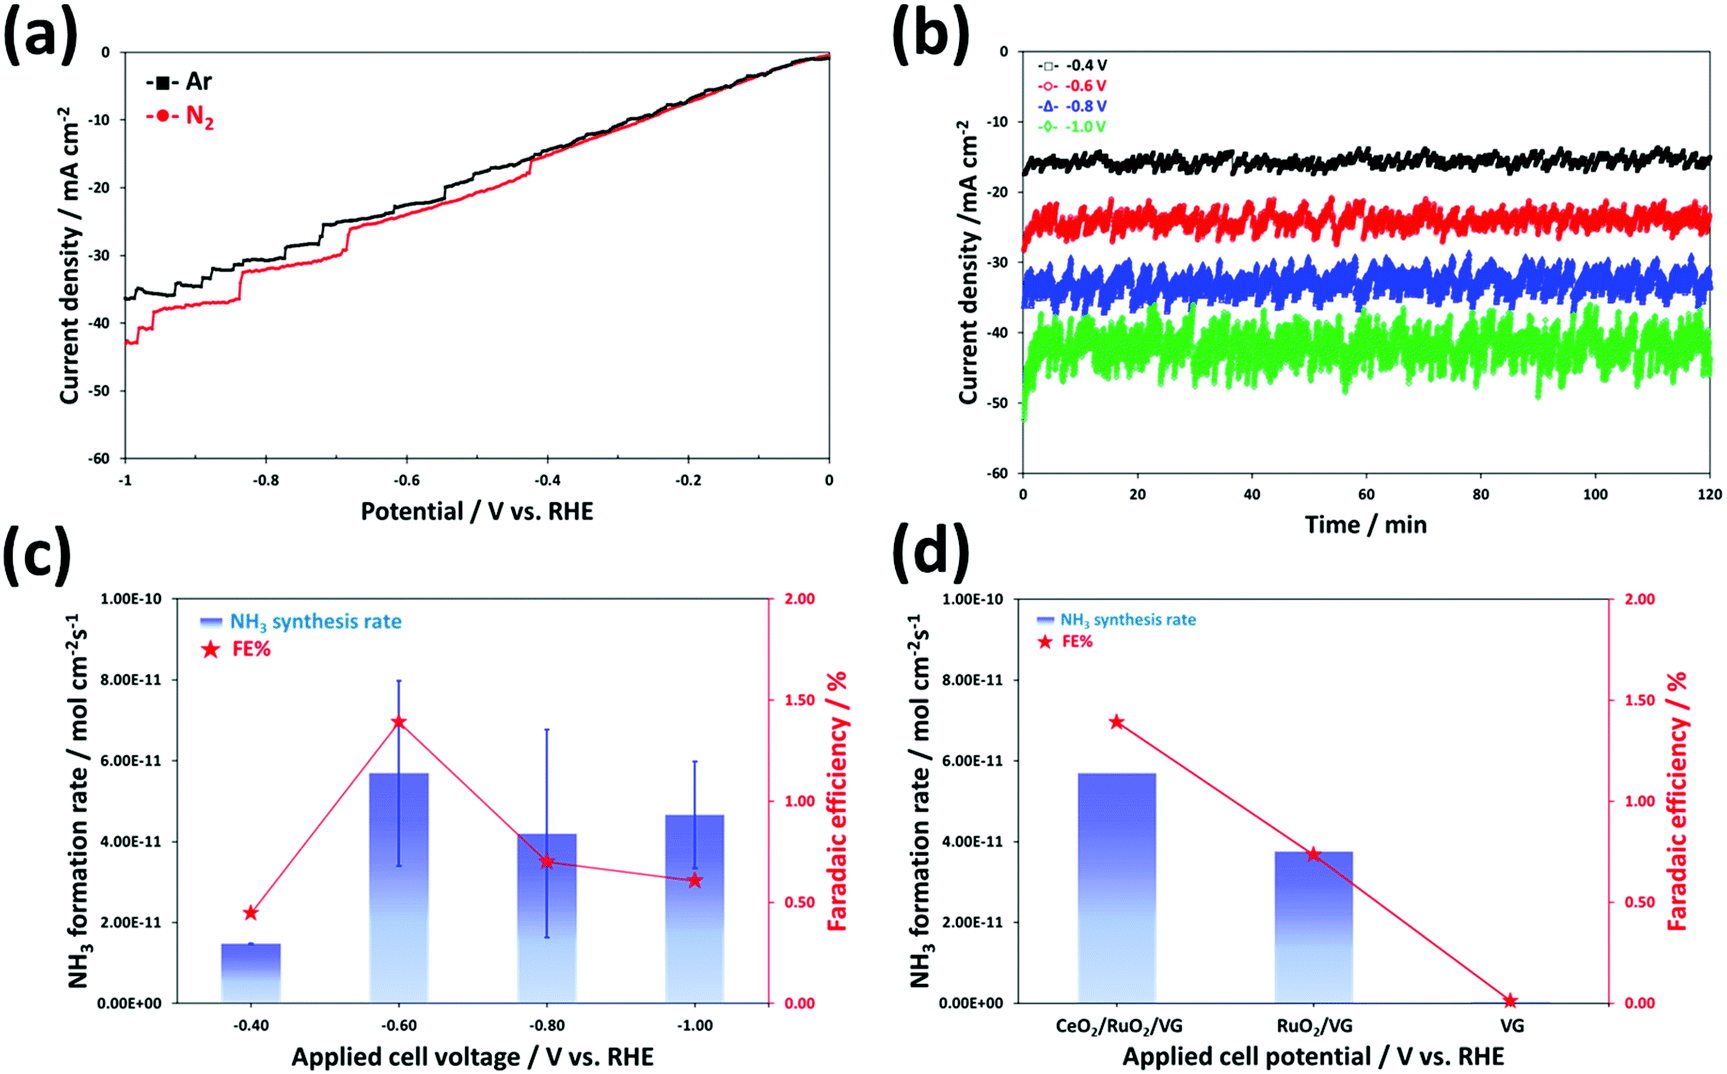 | ||
| Fig. 6 Ammonia synthesis via electrochemical N2 reduction reaction in 0.1 M KOH electrolyte under ambient conditions. (a) LSV curves of CeO2/RuO2/VG on Ni foam in Ar- and N2-saturated electrolyte at a scan rate of 5 mV s−1. (b) Chronoamperometry curves for potentiostatic measurements at the corresponding potentials using CeO2/RuO2/VG on Ni foam for 2 h and (c) corresponding normalized average NH3 formation rate and faradaic efficiency (FE%). (d) Comparison of the ammonia synthesis performances at −0.6 V vs. RHE for 2 h using different catalysts. All ammonia concentrations were analysed using the ion-selective electrode method. | ||
In our experiment, it was not obvious why a higher corresponding current in the chronoamperometry measurements was observed than that in summarized literature results (Table S2†). Although a non-noble metal oxide-based electrocatalyst was selected in this study, most of the corresponding current at applied voltages under a reduction environment could be dominantly related to the HER, leading to a comparatively low FE. The reason for the similar LSV curves, i.e., Fig. 6a, may be easily observed in many NRR studies as the combined current contribution with the HER and NRR. This means that a number of cases obtained certain low and high values of FE and current densities and the contribution from the NRR partial current density is still very low. Again, a key strategy to improve the selectivity and performance of catalysts for the NRR is to suppress the major undesirable HER.12,24,82 Thus, to gain further insight into the contribution of the deposited non-noble metal oxide catalyst layers of the VG electrode, the performance of the three different electrodes of CeO2/RuO2/VG, RuO2/VG, and VG on the Ni foams was compared at −0.6 V vs. RHE for 2 h, as shown in Fig. 6d. The electrode of VG on Ni foam exhibited hardly any NH3 synthesis after the NH3 concentration was normalized using N2 and Ar experiments in the OCV state (see also Experimental details) and no ammonia formation is most likely attributed to its HER activity. Moreover, as reported in previous studies, bare Ni foam itself exhibits negligible NRR activity.83–85 The average value of NH3 formation yield with RuO2/VG on Ni foam by the ISE method was 3.76 × 10⁻¹¹ mol cm−2 s−1 with an FE of 0.73%, which is 1.5-fold lower that of CeO2/RuO2/VG. It is noteworthy that the nanoscale metal oxide catalyst layers of CeO2/RuO2 coated on the high surface area of the VG electrode fabricated via the RF inductively coupled plasma CVD and magnetron sputtering techniques showed a reasonably good electrocatalytic performance for the NRR from N2 gas in alkaline media under ambient conditions. To determine the contribution of the Ru and Ce oxides, we further investigated the NRR performance of the CeO2/VG, RuO2/VG and CeO2/RuO2/VG electrocatalysts using the indophenol-blue method, as shown in Fig. S7a.† The NH3 yield rate on CeO2/VG and RuO2/VG was around 1.2 × 10⁻¹⁰ and 6.6 × 10⁻¹¹ mol cm−2 s−1, respectively. According to this result, it is obvious that both RuO2 and CeO2 are active species for the nitrogen reduction reaction, but CeO2 is the main active site for the selective NRR on the surface of the electrode, which was proven by the theoretical DFT calculation (section 3.3). Specifically, CeO2 shows a six-times higher faradaic efficiency for the NRR compared to RuO2. Furthermore, electrochemical impedance spectroscopy (EIS) was also conducted on the CeO2/VG, RuO2/VG and CeO2/RuO2/VG catalysts during the NRR at −0.6 V vs. RHE, as shown in Fig. S7b.† The solution resistance of all three electrocatalyst samples at high frequency was calculated to be around 38 Ω; however, the first semi-circle arc, which is related to the charge transfer resistance, was obviously different for each sample. The charge transfer resistance of RuO2/VG was the lowest, indicating favorable HER, in accordance with the reduction potential region. After the decoration of CeO2, the charge transfer resistance of CeO2/RuO2/VG increased. Thus, based on this result, we can deduce that the suppression of the HER on CeO2 could be another factor for the good NRR performance of the CeO2/RuO2/VG composite catalyst. This good selectivity result is facilitated by the effective control of the undesirable HER activity due to the modification of the high surface area VG film covered with a metal oxide (CeO2 and RuO2) nanoparticle layer structure.86,87
Fig. 7 shows the long-term performance test using the same CeO2/RuO2/VG catalyst, where a stable electrocatalytic NRR performance was demonstrated at −0.6 V vs. RHE for 36 h consecutively in 0.1 M KOH medium. The cell was operated with a fresh 0.1 M KOH electrolyte solution after every 6 h cycle operation and the electrolyte was re-purged with ultra-high purity N2 for 30 min before restarting the next cycle. Fig. S8† shows the HR-TEM analysis of the CeO2/RuO2/VG catalyst after it was employed in the long-term performance test. The results show that layer of CeO2 and RuO2 nanoparticles was again reasonably visible and remained intact on the graphene sheet surface, with some agglomeration of the particles. In Fig. 7a, the NRR stability performance reasonably showed no significant variation in the ammonia formation rate and faradaic efficiency except for cycle number 3 (period of 12–18 h), but even the highest result (8.49 × 10⁻¹¹ mol cm−2 s−1 by ISE method and 1.56 × 10⁻¹⁰ mol cm−2 s−1 by indophenol blue method) is almost within the experimental error bars, as shown in Fig. 7c. The produced NH3 on the cathode electrode can absorb/release and accumulate at the electrode and/or membrane during electrolysis.4,22 We assume that the produced NH3 during the 1st and the 2nd cycles accumulated at the Nafion membrane and/or electrode, resulting in some deviation in the ammonia formation rate during the 3rd cycle.
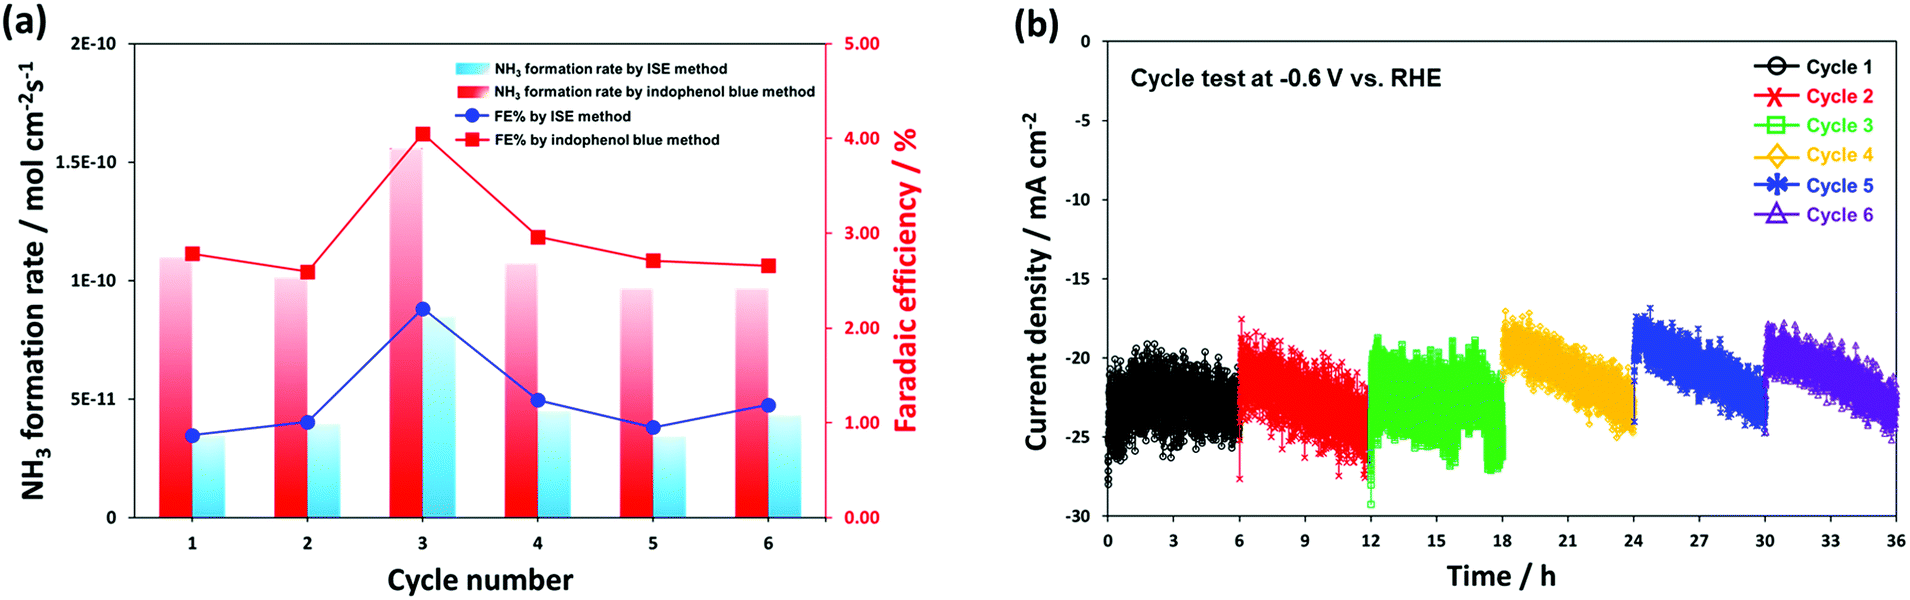 | ||
| Fig. 7 Durability test for the electrochemical ammonia synthesis reaction with CeO2/RuO2/VG on Ni foam electrocatalyst. (a) Comparison of the ammonia synthesis rates and faradaic efficiencies measured by ion-selective electrode (ISE) and indophenol blue methods. (b) Time-dependent current density curves at an applied potential of −0.6 V vs. RHE recorded during a test period of 36 h. | ||
Compared with other reported results (Table S2†), the corrected ammonia products (NH4+ ion form in 0.05 M H2SO4 solution trap) was also cross-analysed using the common indophenol blue method (see Experimental and Fig. S9†). Note that both the ISE and indophenol blue methods were carried out to more reliably determine the ammonia concentration. The ISE method detects the NH3-N striped through the electrode membrane filter into the sensing electrode and the UV-vis-based indophenol blue method analyses the ammonium ions (NH4+).7,11,80 To further elucidate the source of N2 for the synthesised ammonia, we compared the results from the 14N2 and Ar-saturated experiments using 1H NMR spectroscopy as a final alternative confirmation analysis. We could clearly confirm the formation of ammonia using 14N2 gas, whereas no triplet coupling of 14N peaks was detected in the Ar gas experiment (Fig. S10†). In addition, a very small amount of hydrazine (N2H4) was detected at the level of approximately 20 ppb during the long-term performance test using the Watt and Crisp analysis (see Fig. S11†). Remarkably, both ammonia synthesis results exhibit an approximately 2.5-fold higher value with the ammonia synthesis average yield of 1.11 × 10⁻¹⁰ mol cm−2 s−1 (50.56 μg h−1 mgtotal cat.−1) for 36 h and faradaic efficiency of 2.96% by the indophenol blue method than that using the ISE method, which gave an ammonia synthesis average yield of 4.68 × 10⁻¹¹ mol cm−2 s−1 and faradaic efficiency of 1.25%. Again, in the consecutive ammonia synthesis test at −0.6 V vs. RHE for 36 h under ambient conditions, we obtained a high value of 50.56 μg h−1 mgtotal cat.−1, which is higher than that of the previously reported alkaline-based system (Table S2†). The observed high performance is most likely attributed to the boosted ammonia synthesis selectivity and electrocatalytic activity for N2 reduction by controlling the dominant competitive reaction of hydrogen evolution by successfully fabricating the promising, stable nanolayers of CeO2/RuO2 on the high surface VG film. It is worth noting that the determination methods of low concentration ammonia solution are still one of the major points of debate. Thus, highly selective, more accurate, and good reproducible determination methods are urgently required.11,65 In Fig. 7b, the corresponding current density profiles show almost a similar trend to the chronoamperometry measurement result at −0.6 V vs. RHE, as shown in Fig. 6b; however, a gradual decrease in current was observed for every 6 h test in each cycle. During the tests, the current densities were stable for 6 consecutive cycles (total 36 h testing) in the range of −18 to −25 mA cm−2 (cathodic increase of 1.17 mA h−1) and showed similar profiles after 3 consecutive cycles, which well-matched the result of the ammonia formation rate.
3.3. DFT calculation
Fig. 8 shows the DFT calculation result for graphene, RuO2 and CeO2. To further identify the significant role of the RuO2/CeO2 (or CeO2) layer in reducing N2 to ammonia, we investigated the NRR process on a pristine graphene layer, RuO2 (110), and CeO2 (110) surface for comparison. For pure graphene, we found that the adsorption of N2 is an endothermic process, indicating its inert chemical property. Moreover, the potential-determining step (PDS) was found to be the first step, i.e. *NN + H+ + e− → *NNH, and the calculated overpotential was as high as 1.90 V, which is in accordance with our experimental results that negligible ammonia production was found on pristine graphene catalyst, as shown in Fig. 6d. However, for the RuO2 (110) and CeO2 (110) surfaces, the adsorption of an N2 molecule on the catalyst surface is an exothermic process, which demonstrates that N2 can be well captured and adsorbed on these two surfaces, particularly for CeO2 (110). In the case of the RuO2 (110) surface, the highest free energy change was also found to be the first hydrogenation step from *NN to the *NNH intermediate with an overpotential of 0.76 V. The details of the relationship between the active site of the catalyst and the activation energy of the different steps in the CeO2 and RuO2 NRR reaction path was also calculated to be the activation barrier for the step of *NN + *H → *NNH, which is 1.26 eV, and 0.86 eV, respectively. Also, for the step of *NH2 + *H → *NH3, the calculated energy barriers were 0.64 eV, and 0.45 eV, respectively, whereby these energy barriers can be easily overcome under ambient conditions. Therefore, the use of the materials designed in this work can reduce the input of external electric energy into the system for the NRR. Remarkably, the CeO2 (110) surface exhibits the lowest overpotential of only 0.35 V, which is better than that of some of the best Fe/Mo catalysts and the last hydrogenation step (*NH2 + H+ + e− → *NH3) is the PDS of the whole N2 reduction process. For an efficient NRR process to occur, suppression of the competing HER reaction is another important aspect. Therefore, we also calculated the activation energy of the HER reaction for the CeO2 and RuO2 and pure graphene surfaces (Fig. S12†). Our calculation showed that H can be bonded to the CeO2 and RuO2 active sites easily; however, significant barriers are present when trying to form H2 due to the high overpotential of about 0.55 eV for the CeO2 surface and 0.51 eV for the RuO2 surface. Thus, the high overpotential values indicate the suppression of the HER process on the surface of these two materials. For pure graphene, the calculated binding energy of *H is 1.54 eV; therefore, the HER is also unfavourable on the pure graphene surface and under the employed conditions. Thus, based on these DFT results, we can deduce that the incorporation of RuO2/CeO2 in the 3-D graphene structure can significantly enhance the NRR performance, and the excellent catalytic activity originates from the CeO2 layer.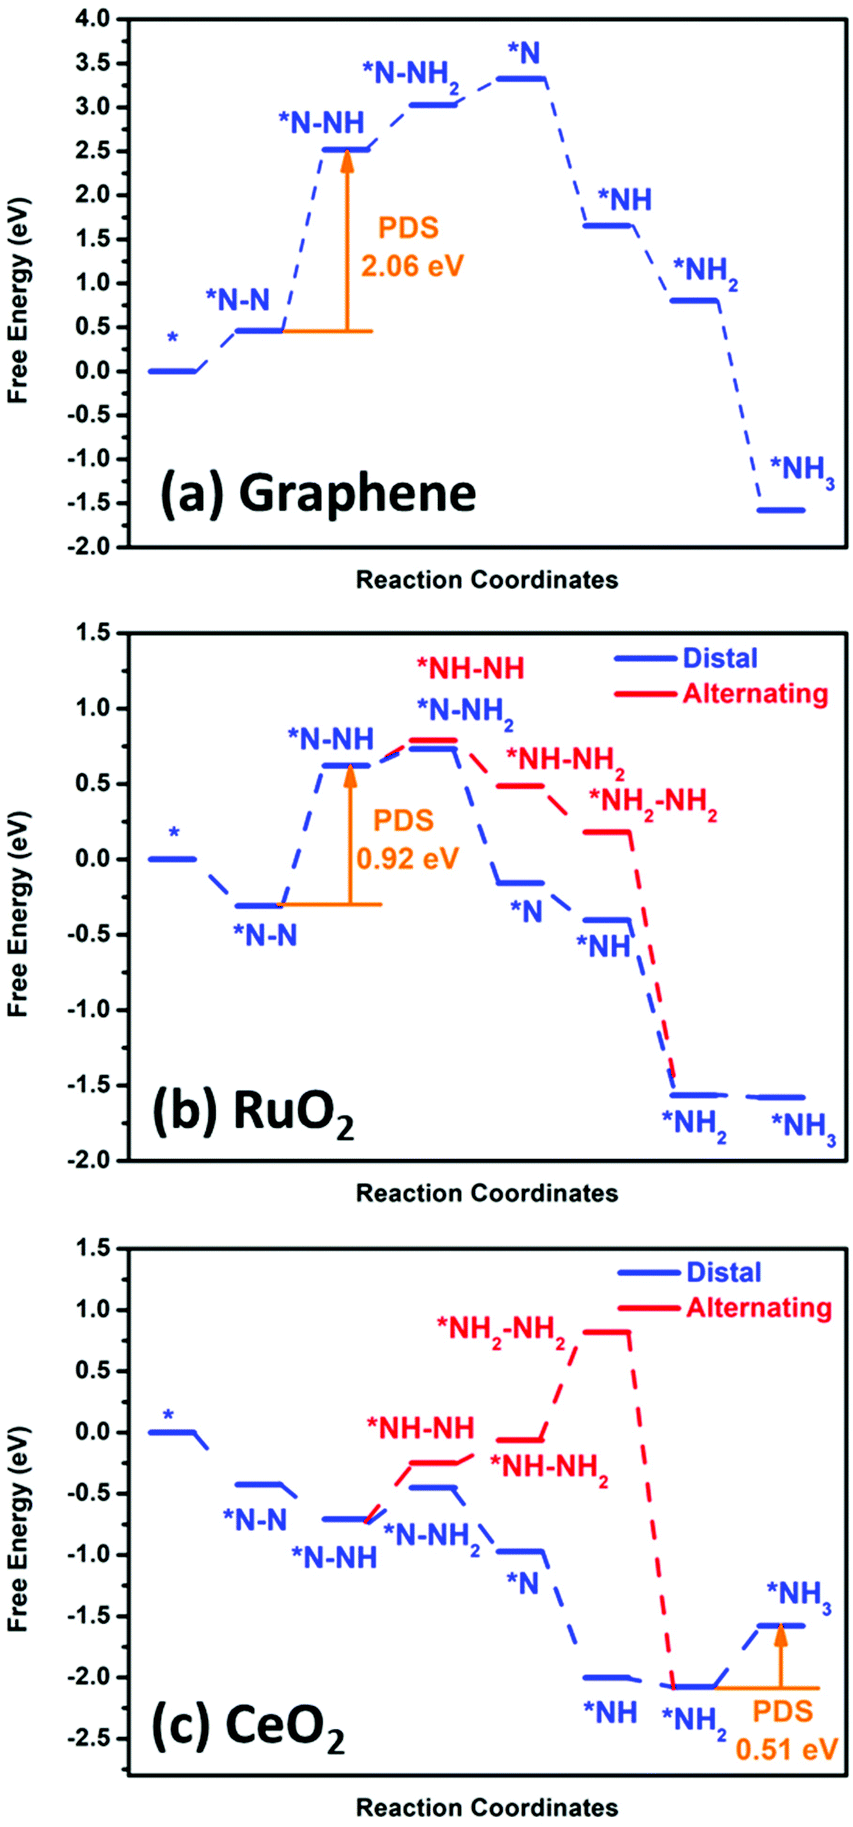 | ||
| Fig. 8 DFT calculation of the nitrogen reduction reaction potential with pristine (a) graphene, (b) RuO2 and (c) CeO2. | ||
4. Conclusion
The electrochemical synthesis of ammonia has become an intense topic for research recently. In this work, we aimed to address the low yield and low long-term stability of catalysts for the synthesis of ammonia, which is one of the key factors hindering the wide use of this promising technology. We investigated the potential to use different nanolayers of metal oxide nanoparticle films (RuO2 and CeO2) on high porous pure graphitic nanostructures such as vertical graphene film (3-D graphene) on an Ni foam substrate via a single-step, low-temperature plasma process. Our results confirmed that the pristine graphene structures without any heteroatom species yielded negligible ammonia production in 0.1 M KOH. However, when nanolayers of metal oxide films (RuO2 and CeO2) were deposited on the high porous substrate such as vertical graphene film on Ni foam, the production of ammonia significantly increased under ambient conditions. Finally, the long-term capability of this composite material was successfully demonstrated using the CeO2/RuO2 on VG electrocatalyst, where we achieved the average ammonia synthesis yield of 50.56 μg h−1 mgtotal cat.−1 (1.11 × 10⁻¹⁰ mol cm−2 s−1) with a faradaic efficiency of 2.96% for 36 h. This observation was predicted and supported by DFT calculations, where CeO2 exhibited best catalytic performance compared to RuO2 and pristine graphene. Lastly, the addition of different metal oxide films was important in suppressing the H2 evolution and increasing the NH3 synthesis reaction. Our work will pave the way to utilize and explore different types of efficient and effective metals and metal oxide-based electrocatalysts for the electrochemical N2 reduction process.Authorship contributions
H. K. J. and D. H. S. have conceived the project and planned the work. D. H. S. performed and optimized the vertical graphene synthesis on Ni foam, and conducted characterizations using SEM, EDX and Raman spectroscopy. A. B. conducted the deposition of RuO2 and CeO2 nanolayers. H. K. J. and S. K. C. performed the electrochemical experiments of ammonia production and conducted the NMR analysis section. B. S. A. contributed to the HR-TEM analysis. T. R. G. conducted XPS analysis and wrote the XPS section with H. K. J. and D. H. S. For the determination of concentrations of ammonia and hydrazine using UV-vis and ion-selective electrode method, H. K. J., S. K. C., and M. M. performed. X. M. and A. D. conducted the DFT calculations and wrote the corresponding section. H. K. J., D.H. S., H. C. Y., J. L. and S. G. drafted the manuscript and all authors contributed to the discussion and editing of the manuscript.Conflicts of interest
The authors declare that they have no known competing financial interests or personal relationships that could have appeared to influence the work reported in this paper.Acknowledgements
This work was funded by the CSIRO's Hydrogen Energy Systems Future Science Platform (H2ES FSP) and supported by Australian Research Council (ARC). This work was conducted under the framework of the Research and Development Program of the Korea Institute of Energy Research (KIER) (C1-2413). Dr Dong Han Seo acknowledges the UTS Chancellor fellowship program from the University of Technology Sydney (UTS) and the research support from the Korea Institute of Energy Technology (KENTECH). The authors would like to thank Dr Daniel Roberts for unstinting support for this H2ES FSP project and Mr Gary Paul for providing technical assistance. The authors would also like to acknowledge contribution from Mr Mark Greaves (SEM/EDX analysis) at CSIRO Manufacturing.References
- S. Giddey, S. P. S. Badwal, C. Munnings and M. Dolan, ACS Sustainable Chem. Eng., 2017, 5, 10231–10239 CrossRef CAS.
- S. Giddey, S. P. S. Badwal and H. Ju, in Current Trends and Future Developments on (Bio-) Membranes, ed. A. Basile, A. Cassano and A. Figoli, Elsevier, 2019, pp. 235–259 Search PubMed.
- D. R. MacFarlane, J. Choi, B. H. R. Suryanto, R. Jalili, M. Chatti, L. M. Azofra and A. N. Simonov, Adv. Mater., 2020, 32, 1904804 CrossRef CAS PubMed.
- S. Giddey, S. P. S. Badwal and A. Kulkarni, Int. J. Hydrogen Energy, 2013, 38, 14576–14594 CrossRef CAS.
- L. Wang, M. Xia, H. Wang, K. Huang, C. Qian, C. T. Maravelias and G. A. Ozin, Joule, 2018, 2, 1055–1074 CrossRef CAS.
- T. D. Rapson, C. M. Gregg, R. S. Allen, H. Ju, C. M. Doherty, X. Mulet, S. Giddey and C. C. Wood, ChemSusChem, 2020, 13, 4856–4865 CrossRef CAS PubMed.
- C. Tang and S.-Z. Qiao, Chem. Soc. Rev., 2019, 48, 3166–3180 RSC.
- M. Kitano, Y. Inoue, M. Sasase, K. Kishida, Y. Kobayashi, K. Nishiyama, T. Tada, S. Kawamura, T. Yokoyama, M. Hara and H. Hosono, Angew. Chem., Int. Ed., 2018, 57, 2648–2652 CrossRef CAS PubMed.
- S. Chen, S. Perathoner, C. Ampelli and G. Centi, in Studies in Surface Science and Catalysis, ed. S. Albonetti, S. Perathoner and E. A. Quadrelli, Elsevier, 2019, pp. 31–46 Search PubMed.
- H. Ju, S. Badwal and S. Giddey, Appl. Energy, 2018, 231, 502–533 CrossRef CAS.
- X. Cui, C. Tang and Q. Zhang, Adv. Energy Mater., 2018, 8, 1800369 CrossRef.
- A. R. Singh, B. A. Rohr, J. A. Schwalbe, M. Cargnello, K. Chan, T. F. Jaramillo, I. Chorkendorff and J. K. Nørskov, ACS Catal., 2017, 7, 706–709 CrossRef CAS.
- J. H. Montoya, C. Tsai, A. Vojvodic and J. K. Nørskov, ChemSusChem, 2015, 8, 2180–2186 CrossRef CAS PubMed.
- S. Chen, H. Jang, J. Wang, Q. Qin, X. Liu and J. Cho, J. Mater. Chem. A, 2020, 8, 2099–2104 RSC.
- X. Zhao, C. Yao, H. Chen, Y. Fu, C. Xiang, S. He, X. Zhou and H. Zhang, J. Mater. Chem. A, 2019, 7, 20945–20951 RSC.
- Y.-C. Hao, Y. Guo, L.-W. Chen, M. Shu, X.-Y. Wang, T.-A. Bu, W.-Y. Gao, N. Zhang, X. Su, X. Feng, J.-W. Zhou, B. Wang, C.-W. Hu, A.-X. Yin, R. Si, Y.-W. Zhang and C.-H. Yan, Nat. Catal., 2019, 2, 448–456 CrossRef CAS.
- S.-J. Li, D. Bao, M.-M. Shi, B.-R. Wulan, J.-M. Yan and Q. Jiang, Adv. Mater., 2017, 29, 1700001 CrossRef PubMed.
- D. Bao, Q. Zhang, F.-L. Meng, H.-X. Zhong, M.-M. Shi, Y. Zhang, J.-M. Yan, Q. Jiang and X.-B. Zhang, Adv. Mater., 2017, 29, 1604799 CrossRef PubMed.
- W. Zang, T. Yang, H. Zou, S. Xi, H. Zhang, X. Liu, Z. Kou, Y. Du, Y. P. Feng, L. Shen, L. Duan, J. Wang and S. J. Pennycook, ACS Catal., 2019, 9, 10166–10173 CrossRef CAS.
- H. Wang, Y. Li, C. Li, K. Deng, Z. Wang, Y. Xu, X. Li, H. Xue and L. Wang, J. Mater. Chem. A, 2019, 7, 801–805 RSC.
- L. Han, X. Liu, J. Chen, R. Lin, H. Liu, F. Lü, S. Bak, Z. Liang, S. Zhao, E. Stavitski, J. Luo, R. R. Adzic and H. L. Xin, Angew. Chem., Int. Ed., 2019, 58, 2321–2325 CrossRef CAS PubMed.
- S. Z. Andersen, V. Čolić, S. Yang, J. A. Schwalbe, A. C. Nielander, J. M. McEnaney, K. Enemark-Rasmussen, J. G. Baker, A. R. Singh, B. A. Rohr, M. J. Statt, S. J. Blair, S. Mezzavilla, J. Kibsgaard, P. C. K. Vesborg, M. Cargnello, S. F. Bent, T. F. Jaramillo, I. E. L. Stephens, J. K. Nørskov and I. Chorkendorff, Nature, 2019, 570, 504–508 CrossRef CAS PubMed.
- S. Chung, D. H. Seo, M. Choi, X. Mao, A. Du, K. Ham, S. Giddey, J. Lee and H. Ju, J. Electroanal. Chem., 2021, 896, 115157 CrossRef CAS.
- C. Li, Y. Fu, Z. Wu, J. Xia and X. Wang, Nanoscale, 2019, 11, 12997–13006 RSC.
- Y. Zhang, W. Qiu, Y. Ma, Y. Luo, Z. Tian, G. Cui, F. Xie, L. Chen, T. Li and X. Sun, ACS Catal., 2018, 8, 8540–8544 CrossRef CAS.
- X. Zhang, Q. Liu, X. Shi, A. M. Asiri, Y. Luo, X. Sun and T. Li, J. Mater. Chem. A, 2018, 6, 17303–17306 RSC.
- S. Luo, X. Li, W. Gao, H. Zhang and M. Luo, Sustainable Energy Fuels, 2020, 4, 164–170 RSC.
- Z. Wang, F. Gong, L. Zhang, R. Wang, L. Ji, Q. Liu, Y. Luo, H. Guo, Y. Li, P. Gao, X. Shi, B. Li, B. Tang and X. Sun, Adv. Sci., 2019, 6, 1801182 CrossRef PubMed.
- K. Ham, M. Salman, S. Chung, M. Choi, H. Ju, H. J. Lee and J. Lee, J. Energy Chem., 2022, 67, 474–482 CrossRef.
- W. Qiu, X.-Y. Xie, J. Qiu, W.-H. Fang, R. Liang, X. Ren, X. Ji, G. Cui, A. M. Asiri, G. Cui, B. Tang and X. Sun, Nat. Commun., 2018, 9, 3485 CrossRef PubMed.
- B. H. R. Suryanto, D. Wang, L. M. Azofra, M. Harb, L. Cavallo, R. Jalili, D. R. G. Mitchell, M. Chatti and D. R. MacFarlane, ACS Energy Lett., 2019, 4, 430–435 CrossRef CAS.
- W. Xiong, Z. Guo, S. Zhao, Q. Wang, Q. Xu and X. Wang, J. Mater. Chem. A, 2019, 7, 19977–19983 RSC.
- F. Lai, N. Chen, X. Ye, G. He, W. Zong, K. B. Holt, B. Pan, I. P. Parkin, T. Liu and R. Chen, Adv. Funct. Mater., 2020, 30, 1907376 CrossRef CAS.
- G. Xu, H. Li, A. S. R. Bati, M. Bat-Erdene, M. J. Nine, D. Losic, Y. Chen, J. G. Shapter, M. Batmunkh and T. Ma, J. Mater. Chem. A, 2020, 8, 15875–15883 RSC.
- Á. B Höskuldsson, Y. Abghoui, A. B. Gunnarsdóttir and E. Skúlason, ACS Sustainable Chem. Eng., 2017, 5, 10327–10333 CrossRef.
- H. Ju, G. Kaur, A. P. Kulkarni and S. Giddey, J. CO2 Util., 2019, 32, 178–186 CrossRef CAS.
- S. Lee and J. Lee, ChemSusChem, 2016, 9, 333–344 CrossRef CAS PubMed.
- J. Choi, B. H. R. Suryanto, D. Wang, H.-L. Du, R. Y. Hodgetts, F. M. F. Vallana, D. R. MacFarlane and A. N. Simonov, Nat. Commun., 2020, 11, 5546 CrossRef CAS PubMed.
- K. Zeng and D. Zhang, Prog. Energy Combust. Sci., 2010, 36, 307–326 CrossRef CAS.
- W. Sheng, Z. Zhuang, M. Gao, J. Zheng, J. G. Chen and Y. Yan, Nat. Commun., 2015, 6, 5848 CrossRef CAS PubMed.
- S. Mukherjee, D. A. Cullen, S. Karakalos, K. Liu, H. Zhang, S. Zhao, H. Xu, K. L. More, G. Wang and G. Wu, Nano Energy, 2018, 48, 217–226 CrossRef CAS.
- I. J. McPherson, T. Sudmeier, J. Fellowes and S. C. E. Tsang, Dalton Trans., 2019, 48, 1562–1568 RSC.
- B. H. R. Suryanto, H.-L. Du, D. Wang, J. Chen, A. N. Simonov and D. R. MacFarlane, Nat. Catal., 2019, 2, 290–296 CrossRef CAS.
- S. Z. Andersen, M. J. Statt, V. J. Bukas, S. G. Shapel, J. B. Pedersen, K. Krempl, M. Saccoccio, D. Chakraborty, J. Kibsgaard, P. C. K. Vesborg, J. Nørskov and I. Chorkendorff, Energy Environ. Sci., 2020, 13, 4291–4300 RSC.
- N. Lazouski, M. Chung, K. Williams, M. L. Gala and K. Manthiram, Nat. Catal., 2020, 3, 463–469 CrossRef CAS.
- K. Kim, Y. Chen, J.-I. Han, H. C. Yoon and W. Li, Green Chem., 2019, 21, 3839–3845 RSC.
- E.-Y. Jeong, C.-Y. Yoo, C. H. Jung, J. H. Park, Y. C. Park, J.-N. Kim, S.-G. Oh, Y. Woo and H. C. Yoon, ACS Sustainable Chem. Eng., 2017, 5, 9662–9666 CrossRef CAS.
- K. Kim, H. Cho, S. H. Jeon, S. J. Lee, C.-Y. Yoo, J.-N. Kim, J. W. Choi, H. C. Yoon and J.-I. Han, J. Electrochem. Soc., 2018, 165, F1027–F1031 CrossRef CAS.
- D. H. Seo, S. Kumar and K. Ostrikov, Carbon, 2011, 49, 4331–4339 CrossRef CAS.
- D. H. Seo, A. E. Rider, Z. J. Han, S. Kumar and K. (. Ostrikov, Adv. Mater., 2013, 25, 5638–5642 CrossRef CAS PubMed.
- M. Cai, D. Thorpe, D. H. Adamson and H. C. Schniepp, J. Mater. Chem., 2012, 22, 24992–25002 RSC.
- K. Ham, D. Shin and J. Lee, ChemSusChem, 2020, 13, 1751–1758 CrossRef CAS PubMed.
- H. Ju, S. Giddey, S. P. S. Badwal and R. J. Mulder, Electrochim. Acta, 2016, 212, 744–757 CrossRef CAS.
- J. P. Perdew, M. Ernzerhof and K. Burke, J. Chem. Phys., 1996, 105, 9982–9985 CrossRef CAS.
- G. Kresse and J. Furthmüller, Phys. Rev. B: Condens. Matter Mater. Phys., 1996, 54, 11169–11186 CrossRef CAS PubMed.
- G. Kresse and J. Furthmüller, Comput. Mater. Sci., 1996, 6, 15–50 CrossRef CAS.
- S. Grimme, J. Comput. Chem., 2006, 27, 1787–1799 CrossRef CAS PubMed.
- J. H. Montoya, C. Tsai, A. Vojvodic and J. K. Nørskov, ChemSusChem, 2015, 8, 2180–2186 CrossRef CAS PubMed.
- A. J. Medford, J. Wellendorff, A. Vojvodic, F. Studt, F. Abild-Pedersen, K. W. Jacobsen, T. Bligaard and J. K. Nørskov, Science, 2014, 345, 197–200 CrossRef CAS PubMed.
- A. R. Singh, B. A. Rohr, M. J. Statt, J. A. Schwalbe, M. Cargnello and J. K. Nørskov, ACS Catal., 2019, 9, 8316–8324 CrossRef CAS.
- Z. Zheng, X. Zhang, F. Pei, Y. Dai, X. Fang, T. Wang and N. Zheng, J. Mater. Chem. A, 2015, 3, 19800 RSC.
- A. C. Ferrari, J. C. Meyer, V. Scardaci, C. Casiraghi, M. Lazzeri, F. Mauri, S. Piscanec, D. Jiang, K. S. Novoselov, S. Roth and A. K. Geim, Phys. Rev. Lett., 2006, 97, 187401 CrossRef CAS PubMed.
- S. Y. Mar, C. S. Chen, Y. S. Huang and K. K. Tiong, Appl. Surf. Sci., 1995, 90, 497–504 CrossRef CAS.
- J. Cui and G. A. Hope, J. Spectrosc., 2015, 2015, 940172 Search PubMed.
- J. P. Holgado, R. Alvarez and G. Munuera, Appl. Surf. Sci., 2000, 161, 301–315 CrossRef CAS.
- D. H. Seo, Z. J. Han, S. Kumar and K. Ostrikov, Adv. Energy Mater., 2013, 3, 1316–1323 CrossRef CAS.
- X. Zhao, G. Hu, G.-F. Chen, H. Zhang, S. Zhang and H. Wang, Adv. Mater., 2021, 33, 2007650 CrossRef CAS PubMed.
- G. Qing, R. Ghazfar, S. T. Jackowski, F. Habibzadeh, M. M. Ashtiani, C.-P. Chen, M. R. Smith III and T. W. Hamann, Chem. Rev., 2020, 120, 5437–5516 CrossRef CAS PubMed.
- H. Shen, C. Choi, J. Masa, X. Li, J. Qiu, Y. Jung and Z. Sun, Chem, 2021, 7, 1708–1754 CAS.
- R. Lan, J. T. S. Irvine and S. Tao, Sci. Rep., 2013, 3, 1145 CrossRef PubMed.
- H. Cheng, P. Cui, F. Wang, L.-X. Ding and H. Wang, Angew. Chem., Int. Ed., 2019, 58, 15541–15547 CrossRef CAS PubMed.
- X. Cui, C. Tang, X.-M. Liu, C. Wang, W. Ma and Q. Zhang, Chem. – Eur. J., 2018, 24, 18494–18501 CrossRef CAS PubMed.
- H.-M. Liu, S.-H. Han, Y. Zhao, Y.-Y. Zhu, X.-L. Tian, J.-H. Zeng, J.-X. Jiang, B. Y. Xia and Y. Chen, J. Mater. Chem. A, 2018, 6, 3211–3217 RSC.
- G. Xu, H. Li, A. S. R. Bati, M. Bat-Erdene, M. J. Nine, D. Losic, Y. Chen, J. G. Shapter, M. Batmunkh and T. Ma, J. Mater. Chem. A, 2020, 8, 15875–15883 RSC.
- J. Wang, L. Yu, L. Hu, G. Chen, H. Xin and X. Feng, Nat. Commun., 2018, 9, 1795 CrossRef PubMed.
- Y. Wang, M. Shi, D. Bao, F. Meng, Q. Zhang, Y. Zhou, K. Liu, Y. Zhang, J. Wang, Z. Chen, D. Liu, Z. Jiang, M. Luo, L. Gu, Q. Zhang, X. Cao, Y. Yao, M. Shao, Y. Zhang, X.-B. Zhang, J. G. Chen, J. Yan and Q. Jiang, Angew. Chem., Int. Ed., 2019, 58, 9464–9469 CrossRef CAS PubMed.
- X. Wang, J. Wang, Y. Li and K. Chu, ChemCatChem, 2019, 11, 4529–4536 CrossRef CAS.
- J. G. Chen, R. M. Crooks, L. C. Seefeldt, K. L. Bren, R. M. Bullock, M. Y. Darensbourg, P. L. Holland, B. Hoffman, M. J. Janik, A. K. Jones, M. G. Kanatzidis, P. King, K. M. Lancaster, S. V. Lymar, P. Pfromm, W. F. Schneider and R. R. Schrock, Science, 2018, 360, eaar6611 CrossRef PubMed.
- X. Chen, Y.-T. Liu, C. Ma, J. Yu and B. Ding, J. Mater. Chem. A, 2019, 7, 22235–22241 RSC.
- J. Guo, H. Wang, F. Xue, D. Yu, L. Zhang, S. Jiao, Y. Liu, Y. Lu, M. Liu, S. Ruan, Y.-J. Zeng, C. Ma and H. Huang, J. Mater. Chem. A, 2019, 7, 20247–20253 RSC.
- G.-F. Chen, S. Ren, L. Zhang, H. Cheng, Y. Luo, K. Zhu, L.-X. Ding and H. Wang, Small Methods, 2019, 3, 1800337 CrossRef.
- Y. Qiu, X. Peng, F. Lü, Y. Mi, L. Zhuo, J. Ren, X. Liu and J. Luo, Chem. – Asian J., 2019, 14, 2770–2779 CrossRef CAS.
- H. Yu, Z. Wang, S. Yin, C. Li, Y. Xu, X. Li, L. Wang and H. Wang, ACS Appl. Mater. Interfaces, 2020, 12, 436–442 CrossRef CAS PubMed.
- Z. Wang, W. Tian, H. Yu, T. Zhou, P. Wang, Y. Xu, X. Li, L. Wang and H. Wang, Nanoscale, 2021, 13, 13809 RSC.
- X. Chen, Y.-T. Liu, C. Ma, J. Yu and B. Ding, J. Mater. Chem. A, 2019, 7, 22235 RSC.
- A. Hasani, M. A. Teklagne, H. H. Do, S. H. Hong, Q. V. Le, S. H. Ahn and S. Y. Kim, Carbon Energy, 2020, 2, 158–175 CrossRef CAS.
- J. Zeng, C. Xu, T. Gao, X. Jiang and X.-B. Wang, Carbon Energy, 2021, 3, 193–224 CrossRef CAS.
Footnotes |
| † Electronic supplementary information (ESI) available. See DOI: 10.1039/d1nr06411h |
| ‡ These authors contributed equally to this work. |
| This journal is © The Royal Society of Chemistry 2022 |