
 Open Access Article
 This Open Access Article is licensed under a Creative Commons Attribution-Non Commercial 3.0 Unported Licence
Image to insight: exploring natural products through mass spectrometry imaging
Yonghui
Dong
and
Asaph
Aharoni
 *
*
Department of Plant Sciences, Weizmann Institute of Science, Rehovot 76100, Israel. E-mail: asaph.aharoni@weizmann.ac.il
First published on 23rd June 2022
Abstract
Covering: 2017 to 2022
Mass spectrometry imaging (MSI) has become a mature molecular imaging technique that is well-matched for natural product (NP) discovery. Here we present a brief overview of MSI, followed by a thorough discussion of different MSI applications in NP research. This review will mainly focus on the recent progress of MSI in plants and microorganisms as they are the main producers of NPs. Specifically, the opportunity and potential of combining MSI with other imaging modalities and stable isotope labeling are discussed. Throughout, we focus on both the strengths and weaknesses of MSI, with an eye on future improvements that are necessary for the progression of MSI toward routine NP studies. Finally, we discuss new areas of research, future perspectives, and the overall direction that the field may take in the years to come.
1 Introduction
Natural products (NPs) represent a remarkably diverse group of metabolites with relatively simple to highly complex structures. Most of them are classified as secondary (or specialized) metabolites that are derived from primary metabolites (e.g. amino acids and carbohydrates), through modifications, such as methylation, hydroxylation, and glycosylation. Understanding their metabolism, function, and applications is the core focus of NP research. To date, NP analysis is performed with extracts following sample homogenization typically using liquid chromatography-mass spectrometry (LCMS), gas chromatography-mass spectrometry (GCMS), and/or nuclear magnetic resonance (NMR).1,2 While these approaches have been proven to be of immense value, information regarding the spatial context of NPs in a heterogeneous tissue or a cell is lost. Furthermore, a highly localized NP may be diluted beyond the limit of detection in the extract.3Mass spectrometry imaging (MSI) is a well-established analytical tool that allows direct mapping of a wide variety of chemical classes from different biological samples, providing information concerning analyte identity, relative abundance, and spatial distribution. MSI has enjoyed a surge in popularity in the last decade due to its non-targeted and label-free nature. Analytes of interest do not have to be pre-selected or even known prior to MSI analysis, and they can in most cases be detected without any chemical modification or labelling. This is in stark contrast to most histochemical staining techniques, which require the availability of a suitable antibody.4 It is worth noting that multiplexed ion beam imaging (MIBI) is an exception that requires antibodies tagged with monoisotopic metal reporters to image targeted proteins using secondary ion mass spectrometry.5 Most importantly, MSI provides spatio-chemical information which is much more specific as compared to different kinds of microscopic imaging techniques, and much more intuitive similar to colorimetric imaging. These characteristics have made MSI particularly suited for exploratory analysis.
Several key topics such as MSI ionization technologies, sample preparation, and data analysis have been extensively reviewed elsewhere.6–10 This review particularly intends to highlight the emerging applications, overall trends, and recent innovations that expand the scope of MSI in NP studies. In addition, strategies, and opportunities for integrating MSI with other imaging modalities and stable isotope labelling are discussed. Finally, remaining challenges and future promises are presented.
2 Principle and key considerations of mass spectrometry imaging
MSI entails many different types of platforms, among which matrix-assisted laser desorption/ionization (MALDI), desorption electrospray ionization (DESI), and secondary ion mass spectrometry (SIMS) are most popular. Overview of specific MSI technology has been provided elsewhere.8,11,12 Despite differences in spatial resolution, chemical scope, and speed, all MSI-based approaches rely on discrete (e.g. MALDI) or continuous (e.g. DESI) movement of a probing beam across a sample surface for spatial analysis (Fig. 1A). Molecules present at each measurement coordinate are desorbed and ionized, and a mass spectrum is thus recorded along with its current location13 (Fig. 1A). Several thousand mass spectra are typically acquired in this manner. After measurement, an MS image can be generated by extracting the intensity values of a selected m/z peak from each acquired spectrum. The extracted intensities are then plotted as colour scale values (pseudo-colour) for each pixel in a grid representing the original locations on the sample (Fig. 1A). The resulting MS image represents the spatial intensity distribution of an m/z peak, which can be tentatively assigned to a certain compound. It is important to note that separate MS images can be produced for each m/z peak in a single MSI experiment. Therefore, MSI is an untargeted and multiplexed technique. The number of MS images generated in theory equals the number of distinct m/z peaks detected and resolved in the spectra, which can range from tens to thousands.14 Optionally, an optical image of the very same sample can be co-reregistered with an MS image for detailed inspection of the spatial organization of an analyte of interest. Several different MS images can be also overlaid to compare their distributions on the sample (Fig. 1A).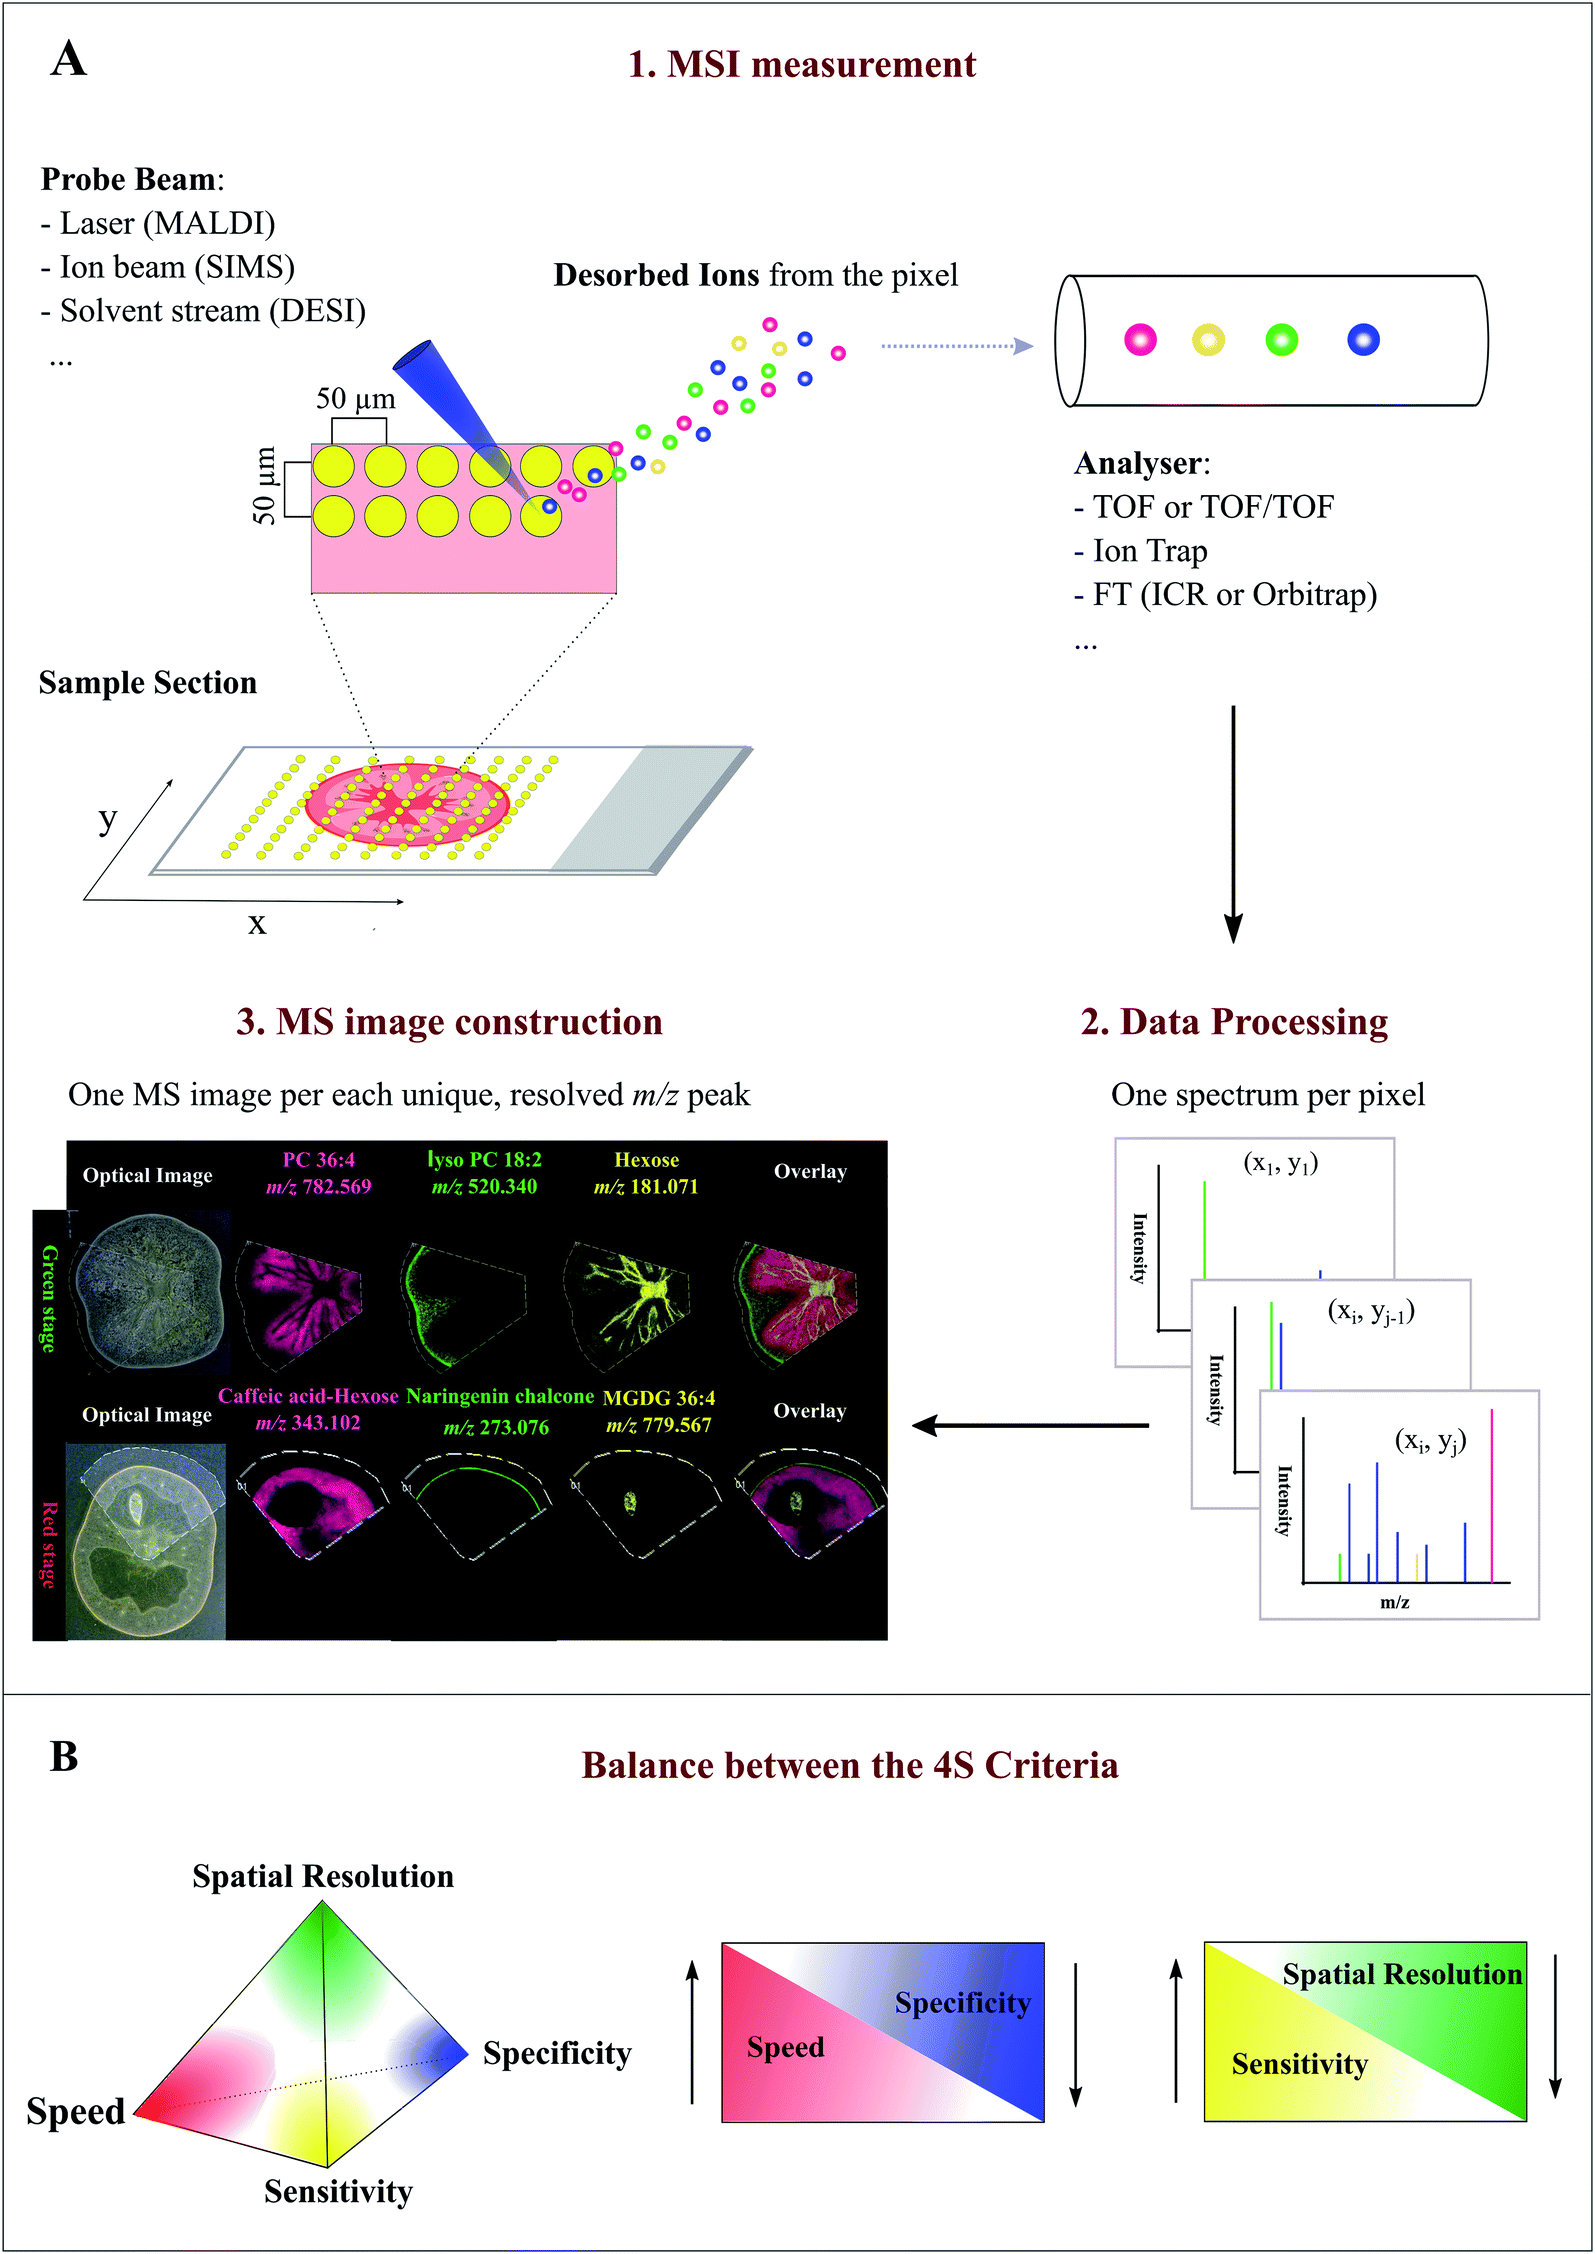 | ||
| Fig. 1 Overview of the Mass Spectrometry Imaging (MSI) technique. (A) General workflow of a typical MSI procedure. (1) A thin-section sample is mounted onto a glass slide, coated with or without matrix. By using a laser (MALDI), ion beam (SIMS), or charged solvent stream (DESI), ions are generated at each spot (pixel) which are then detected by a mass spectrometer. (2) Mass spectrum is produced from each spot (pixel). (3) After acquisition, ion intensity of each unique, resolved m/z peak can be extracted from each spot and plotted as a scaled false color heat map-like image, termed MS image or ion image. As exemplified here, single MS images for several different metabolites, such as phosphatidylcholine (PC) 36:4 and naringenin chalcone, are generated to represent their spatial intensity distributions in two different tomato fruit sections. In addition, MS images can be overlaid to compare their distributions. (B) Currently, MSI techniques need to compromise between the “4S-criteria” (i.e. speed, specificity, spatial resolution, and sensitivity) for performance. Priority should be given to each different criteria depending on the analytes of interest, sample tissue size, time constraints, and objective of the study. Panel B was reprinted (adapted) from Schulz et al. (2019)15 with permission. | ||
Spatial resolution, sensitivity, speed, and specificity are four important aspects (termed 4S-criteria) that must be rigorously considered before conducting an MSI experiment (Fig. 1B). Unfortunately, current MSI approaches need to compromise the 4S-criteria.15 As such, priority should be given to each different criteria depending on the compounds of interest, sample tissue size, time constraints, and objectives of the study. High spatial resolution MSI (e.g. <10 μm) is essential for studies designed to investigate biological differences at cellular level. While improving the spatial resolution (e.g. by the acquisition of smaller pixels) inevitably leads to a significant decrease in throughput and sensitivity as the result of the increased number of pixels and reduced sampling volume (or availability of ions) for each pixel (Fig. 1B). Conversely, low spatial resolution MSI can be acquired in a relatively short time scale and with high sensitivity, but it does not offer fine localization information.16 The development of ultra-high-speed MSI instrumentation, e.g. implementation of a high-repetition-rate laser in MALDI imaging, has allowed to compensate the elevated acquisition time of high resolution MSI. With the continuous improvement in scan speed, acquisition time and throughput will not become a significant issue for high resolution MSI in the future.17,18 High resolving power, accurate mass (e.g. <5 ppm) MSI is vital for specific MS image generation and reliable metabolite identification since it can distinguish targeted metabolites from isobaric ions and complex background noises. Although high resolving power is advantageous, it generally requires long spectrum acquisition time, thus leading to reduced measurement speed (Fig. 1B). High-speed MS imaging is typically used for phenotyping and screening purposes aiming at the analysis of a large number of samples. Therefore, spatial resolution and mass resolution are often sacrificed in favour of throughput. As noted above, designing an ideal MSI experiment is typically application-specific; the balance between the 4S-criteria for a particular experiment is very much dependent on the required outcomes, sample types, and the availability of the MSI instrument. Unlike many novices may think, high spatial resolution MSI is not always necessary to ensure a successful MSI experiment.
3 Mass spectrometry imaging in natural products: current research, applications, and emerging trends
MSI has found a diversity of applications ranging from mapping the spatial distribution of NPs in tissues and cells to investigating organism–environment interactions. This section aims at highlighting the emerging applications and recent innovations that expand the scope of MSI in the NP field. In addition, we present several research directions which we anticipate could be tackled using MSI technology.3.1 Biosynthetic genes discovery
With genome sequencing becoming more affordable and accessible, gene functional annotation remains one of the grand challenges in the genomic era. Despite the power in automation and throughput of homology search-based approaches, such techniques often fail to identify the functions of novel genes that have little or no homology with pre-existing database entries, or may lead to the mis-annotation of gene products that share very high homology but catalyse fundamentally different reactions.19 Metabolites are the end products of gene expression and directly reflect the gene function, therefore through gene-metabolite correlation, one can often get good hints of the gene function. In fact, this is a powerful approach to identify novel genes committed in a specific biosynthetic pathway.20,21Reverse genetics strategies, employed to obtain a phenotype (e.g. changes in metabolite level) by disrupting or modifying a specific gene, are often used to study in vivo gene function. Although changes in metabolites can be quantified by assaying homogenized tissue using LCMS or GCMS, such methods are vulnerable to “bulk dilution effects” which may obscure the gene–metabolite relationship. As MSI enables measuring the spatial dependence of metabolic changes upon gene expression or silencing, it could provide more accurate tissue-specific, gene-to-metabolite correlation, from which significant clues regarding gene function involved in the biosynthesis of related metabolites may be obtained. Dong and co-authors demonstrated that coupling MALDI imaging and various reverse genetics approaches, such as RNA interference (RNAi), virus-induced gene silencing (VIGS), and agroinfiltration, provides a great opportunity in the gene function elucidation.22,23 In one example, they silenced the 2-oxoglutarate dependent dioxygenase GLYCOALKALOID METABOLISM31(GAME31) gene using anthocyanin-guided VIGS (Fig. 2A). The anthocyanin serves as a visual reporter that allowed them to confirm the silencing of the target gene and distinguish between silenced (anthocyanin-free) from non-silenced (anthocyanin-rich) tissue regions (Fig. 2B). Three anthocyanidins, i.e. delphinidin, petunidin, and malvidin, were detected by MALDI imaging, and their distributions were well correlated with the localization of the purple color in both control and GAME31-VIGS tomato fruit (Fig. 2C and D). In control fruit, esculeoside A was found homogeneously localized between silenced and non-silenced sectors, and only trace amounts of α-tomatine were detected (Fig. 2C). In contrast, a significant amount of α-tomatine was detected in GAME31-VIGS tomato fruit and it positively spatially co-occurred with the silenced sector. The distribution of esculeoside A was negatively co-occurred with the silenced sector in the GAME31-VIGS tomato fruit (Fig. 2D), confirming the role of GAME31 in converting α-tomatine to downstream esculeoside A during tomato fruit maturation.24,25 A similar experiment has been reported in studying the PHYTOENE DESATURASE (PDS) gene in maize by coupling MALDI imaging and Raman imaging with VIGS assays.26 Another noteworthy example involves the characterization of two homologous maize genes, GLOSSY2 (Gl2) and Gl2-like, whose specific biochemical functions remain elusive, but both genes are known to affect the accumulation of cuticular lipids.27 In this study, the authors measured and visualized the spatial and temporal patterns of cuticular lipid accumulation on the surface of developing Arabidopsis floral tissues expressing the two genes. MALDI images show that the expression of the maize Gl2 and Gl2-like in the Arabidopsis eceriferum2 (cer2) mutant background could restore the cuticular lipid accumulation on developing flowers surface, suggesting that maize Gl2 and Gl2-like are functional homologs of the Arabidopsis CER2 gene.27
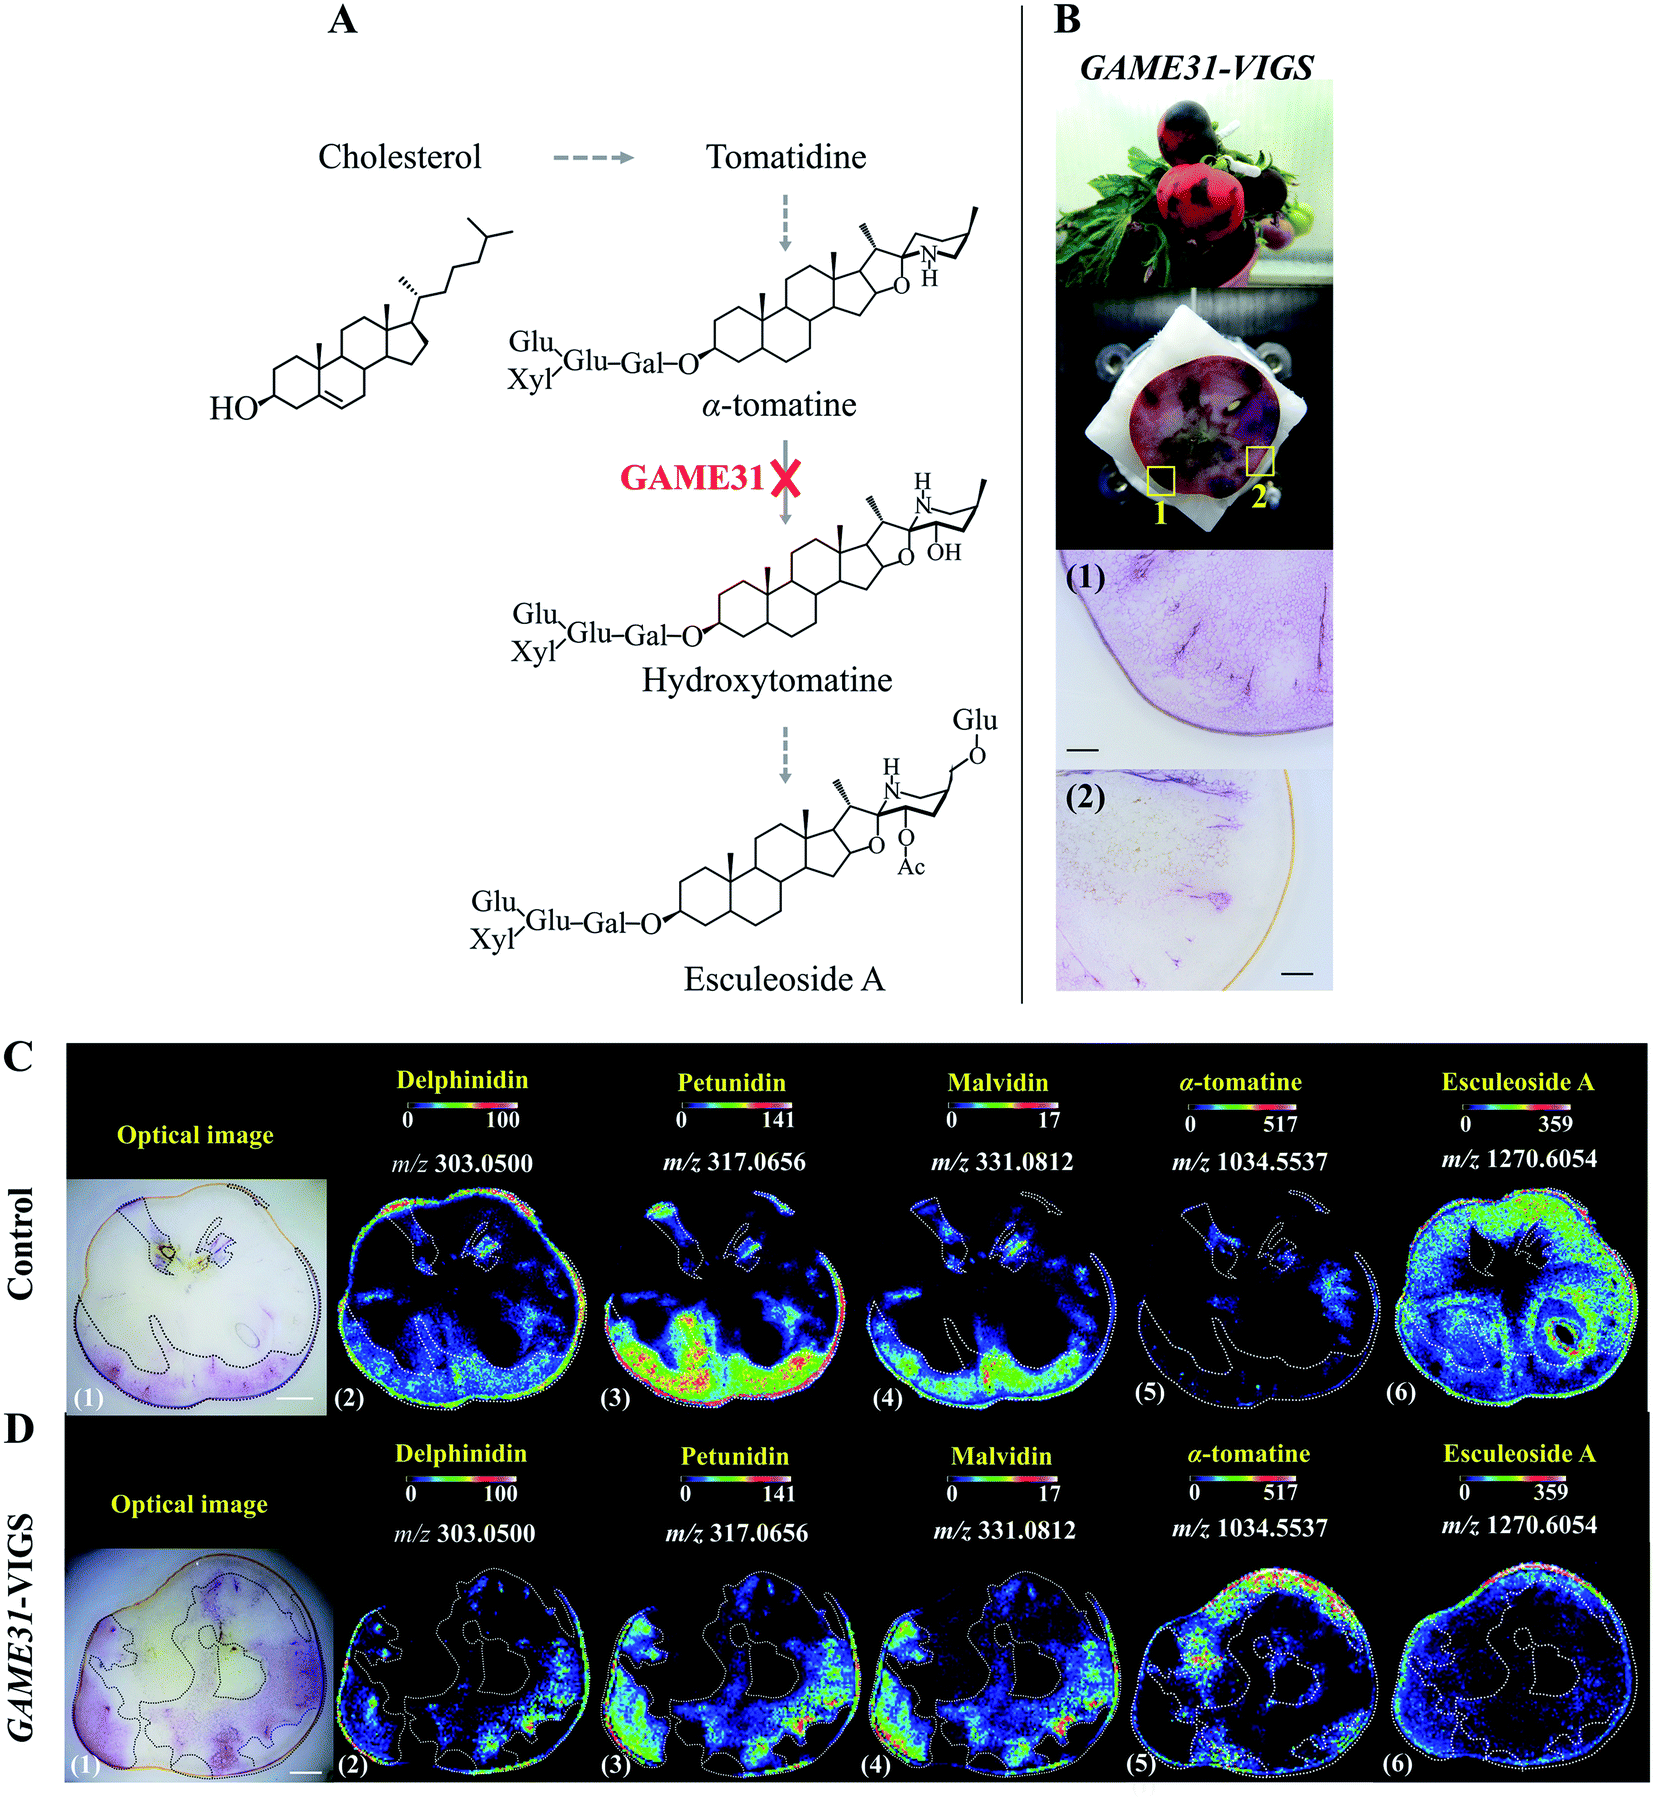 | ||
| Fig. 2 Localization of anthocyanins and major steroidal glycoalkaloids (SGAs) in GAME31 Virus-Induced Gene Silencing (VIGS)-silenced ripe tomato fruit using MALDI imaging. (A) Tomato fruits expressing DELILA (Del) and ROSEA1 (Ros1) transcription factors under fruit-specific promoter E8 (E8:Del/Ros1 MT) were subject to VIGS assay using a Tobacco Rattle Virus (TRV) vector carrying fragments of the Del and Ros1 anthocyanin inducer genes and a GAME31 gene fragment. Consequently, the conversion of α-tomatine to its downstream hydroxy- and acetoxy-derivatives was blocked. (B) The non-uniform or patchy accumulation of anthocyanin red pigments distinguishes the non-silenced (marked 1: anthocyanin-rich) and silenced (marked 2: anthocyanin-free) sectors in the same tomato fruit. Scale bar, 100 μm. (C and D) MALDI images of delphinidin (2), petunidin (3), malvidin (4), α-tomatine (5), and esculeoside A (6) in control and GAME31-VIGS tomato fruit, respectively. Control fruit is the E8:Del/Ros tomato fruit infected with the TRV plasmid harbouring merely the Del/Ros1 sequence (without the GAME31 gene). It was used to assess if VIGS by itself could influence SGAs metabolism. As shown in C (5)-(6), the spatial accumulations of α-tomatine and esculeoside A were not correlated with the distribution of anthocyanins, demonstrating that VIGS does not disturb SGAs metabolism. Scale bar, 5 mm. Ac, acetoxy; Glu, glucose; Gal, galactose; Xyl, xylose. Sample sections were coated with 2,5-dihydroxybenzoic acid (DHB) and measured with MALDI imaging in positive ion mode (100 μm raster size). Reprinted (adapted) from Dong et al. (2020)22 with permission. | ||
Some metabolites accumulate in tissues and cells at or in the vicinity of their sites of biosynthesis. This active-site-directed approach can be used to identify the most representative tissue enriched with targeted metabolites; this tissue is then prioritized to search for the relevant genes. For instance, using MALDI imaging, Heskes et al. found that diterpenoids were exclusively localized to glandular trichomes on the surface of fruit and leaves of Vitex agnus-castus (Lamiaceae). Through analysis of the leaf trichome-specific transcriptome, the authors identified seven candidate genes involved in the diterpenoid biosynthesis.28 In another example, the spatial distribution of different lipid species in jojoba (Simmondsia chinensis) seeds was mapped using MALDI imaging.29 The images revealed heterogeneous distributions of different lipids in the seed tissue (Fig. 3A). For example, wax ester (WE) 42:2 was found enriched in the cotyledon (Fig. 3B) and triacylglycerol (TAG) 62:3 was highly concentrated in the embryonic axis of the seed (Fig. 3C). The overlaid MALDI images of the two lipids clearly demonstrated the differential enrichment of WEs and TAGs in jojoba seeds (Fig. 3D). Transcriptome analysis of the two distinct tissues showed that genes involved in WE synthesis, such as the jojoba fatty acyl-CoA elongase 1 (ScFAE1), fatty acyl-CoA reductase (ScFAR), and wax synthase (ScWS), were all highly expressed and predominant towards the cotyledon; while acyl-CoA: diacylglycerol O-acyltransferase 1 (ScDGAT1), a terminal enzyme in TAG synthesis, was found significantly expressed and biased toward the embryonic axis tissues (Fig. 3E).29
 | ||
| Fig. 3 Heterogeneous metabolite distributions and gene expression in jojoba seeds. (A) Optical image of a longitude jojoba seed section. Scale bar, 1 mm. (B and C) MALDI images of wax ester (WE) 42:2 and triacylglycerol (TAG) 62:3. (D) Overlaid MALDI images of WE 42:2 (red) and TAG 62:3 (green), demonstrating the differential enrichment of WEs and TAGs in jojoba seeds. (E) Metabolic pathways and corresponding genes involved in WE and TAG biosynthesis in jojoba. The heatmap (blue to magenta color scale) next to each gene name was used to indicate gene expression bias toward embryonic axis tissues (blue) or cotyledon tissues (magenta). Acyl-CoA, acyl coenzyme A; GPAT, glycerol-3-phosphate acyltransferase; PAP, phosphatidic acid phosphatase. Sample sections were coated with 2,5-dihydroxybenzoic acid (DHB) and measured with MALDI imaging in positive ion mode (40 μm raster size). Reprinted (adapted) from Sturtevant et al. (2020)29 with permission. | ||
Plants and mushrooms are constantly exposed to various biotic and abiotic stresses that result in wounding. Wounding usually induces the expression of specific gene sets to acquire wound (site)-specific metabolites to properly respond to the injury and prevent infection. One prominent example of analyzing wound sites led to the identification of a POLYENE PIGMENT SYNTHASE 1 (PPS1), a previously uncharacterized type of polyketide synthases in the BY1 stereaceous mushroom.30 Upon mechanical wounding of the mushroom mycelium, two antilarval polyenes 18-methyl-19-oxoicosaoctaenoic acid and 20-methyl-21-oxodocosanonaenoic acid were found exclusively synthesized in the wound site, resulting in a yellow coloration of the injured area (Fig. 4A and B). The presence of double bonds and a methyl branch in the two polyenes suggested the existence of a highly reducing polyketide synthase. Homology searches in the BY1 mushroom genome eventually led to the identification of PPS1, and expression analysis showed that PPS1 transcript was massively upregulated following mycelial damage, confirming the role of PPS1 in the polyene biosynthesis.30
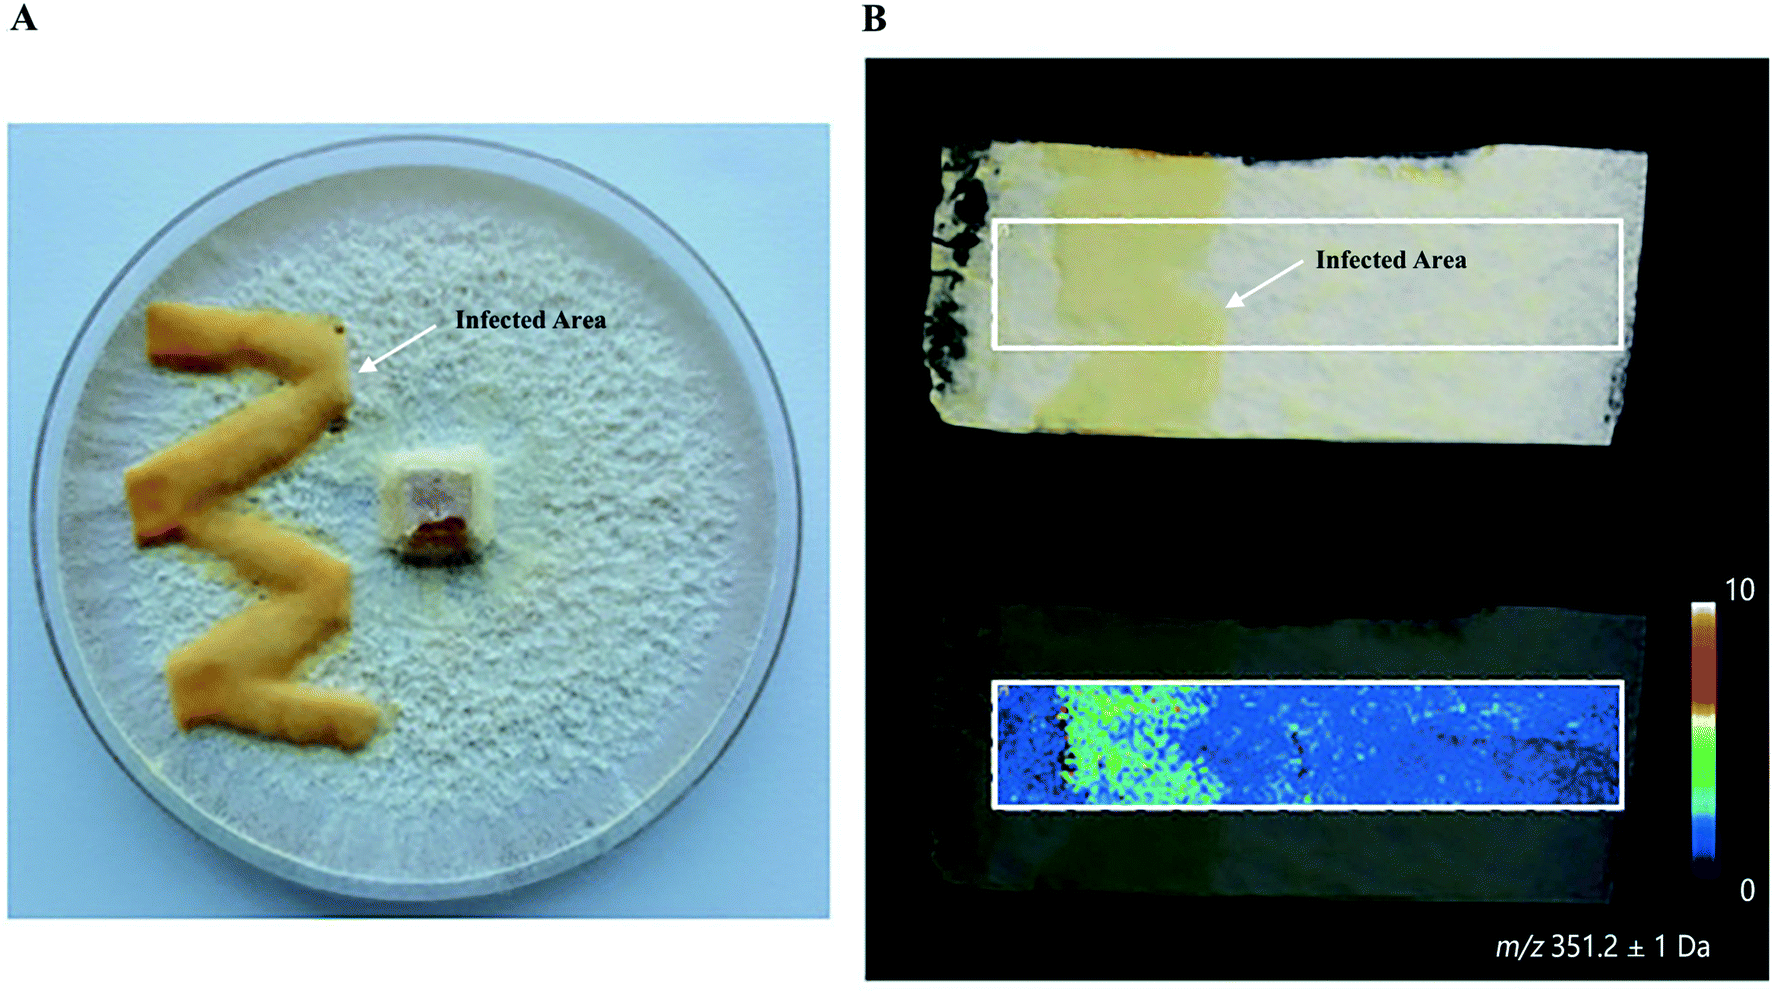 | ||
Fig. 4 Identification of polyketide synthase (PPS1) in the damaged mycelium of the BY1 fungus. (A) Optical image of the mycelium of the BY1 fungus 72 h after injury, where polyenes 18-methyl-19-oxoicosaoctaenoic acid and 20-methyl-21-oxodocosanonaenoic acid result in yellow coloration of the injured area. (B) MALDI image of 20-methyl-21-oxodocosanonaenoic acid showing that it was mainly detected in the injured area. Samples were coated with a universal MALDI matrix (1![[thin space (1/6-em)]](https://www.rsc.org/images/entities/char_2009.gif) :1 mixture of 2,5-dihydroxybenzoic acid and α-cyano-4-hydroxycinnamic acid) and measured with MALDI imaging in positive ion mode (200 μm raster size). Reprinted (adapted) from Brandt et al. (2017)30 with permission. :1 mixture of 2,5-dihydroxybenzoic acid and α-cyano-4-hydroxycinnamic acid) and measured with MALDI imaging in positive ion mode (200 μm raster size). Reprinted (adapted) from Brandt et al. (2017)30 with permission. | ||
3.2 Enzyme activity determination
By utilizing metabolic engineering strategies, it is now possible to synthesize various classes of value-added NPs and their derivatives. Understanding enzymatic catalysis is essential for improving existing enzymes through the protein engineering.31 The ability to measure enzyme activities ex vivo or in vivo or, more specifically, to spatially map enzyme activity in tissue sections is therefore of the highest interest in current NP studies.MSI, as a surface analytical technique, is particularly well-positioned for ex vivo enzyme activity characterization. The most promising way for high throughput analysis is through the covalent or non-covalent immobilization of the substrates onto an MS-compatible surface, followed by MSI analysis of the enzymatic reaction. Two variants of this approach are often used. One is to pre-immobilize the enzyme substrate on the surface and then monitor the enzyme activity; the other is to selectively capture the enzyme substrate or product onto the surface after in-solution enzymatic reaction.32,33 An important consideration of this approach is that the surface immobilization should be tolerant to aqueous washing, meanwhile, the products can be readily desorbed from the surface upon MSI analysis to produce adequate signals.32 The Mrksich group proposed a method named imaging self-assembled monolayers (SAM) for MALDI MS (known as iSAMDI-MS) to obtain quantitative, high-throughput maps of reaction progress.34 The SAM are formed on a gold surface through an Au–S bond, which is strong enough to permit repeated aqueous washing, yet weak enough to be desorbed by MALDI laser irradiation. To demonstrate the capability of this approach towards calculating the Michaelis constant (Km) of an enzyme–substrate reaction, the authors used iSAMDI to quantitate 2592 unique experiments performed inflow, where the products were captured onto a SAM that could then be imaged.34 In another study, a MALDI peptide array was fabricated to screen thrombin inhibitors by incorporation of bioactive peptides onto a modified surface of indium tin oxide (ITO) glass slide. The synthesized peptide substrates containing the thrombin cleavage site were tagged with dioctadecanoyl chains through the Diels–Alder reaction to amplify the MALDI signals and meanwhile to avoid the interference caused by MALDI matrix.33 The thrombin inhibitory activities and half-maximal inhibitory concentration (IC50) of proanthocyanidins with different degrees of polymerization (DP) were successfully determined with the fabricated peptide array coupled with MALDI imaging.33
MSI also allows assessing the spatial distribution of enzymatic activity directly from tissue sections. Enzyme histochemistry with MSI, namely “functional mass spectrometry imaging” (fMSI), is a novel field and is expected to resolve the current limitations of enzyme histochemistry. In one pioneering study, Hamilton et al. used fMSI to study the spatial distribution of venom activity across the snake venom gland.35 The venom gland of the brown forest cobra (Naja subfulva) is rich in enzymatically active phospholipases A2 (PLA2) and, by imaging the venom gland sections exposed to two different lipid substrates, the authors were able to map the spatial activity of PLA2 by visualizing both the substrates and the PLA2 products (Fig. 5). So far, fMSI has been mostly performed to investigate high molecular weight (MW) substrates such as peptides and lipids.36,37 While low-MS enzymatic transformation is also amenable to fMSI as demonstrated by Takeo et al. where the endogenous cholinesterase (ChE) activity was accurately determined in Mus musculus and Drosophila melanogaster by using deuterium-labelled acetylcholine and choline as substrates to distinguish from their endogenous metabolites.38 fMSI also has great potential to map multiple enzyme activities in tissue thanks to its untargeted nature.39
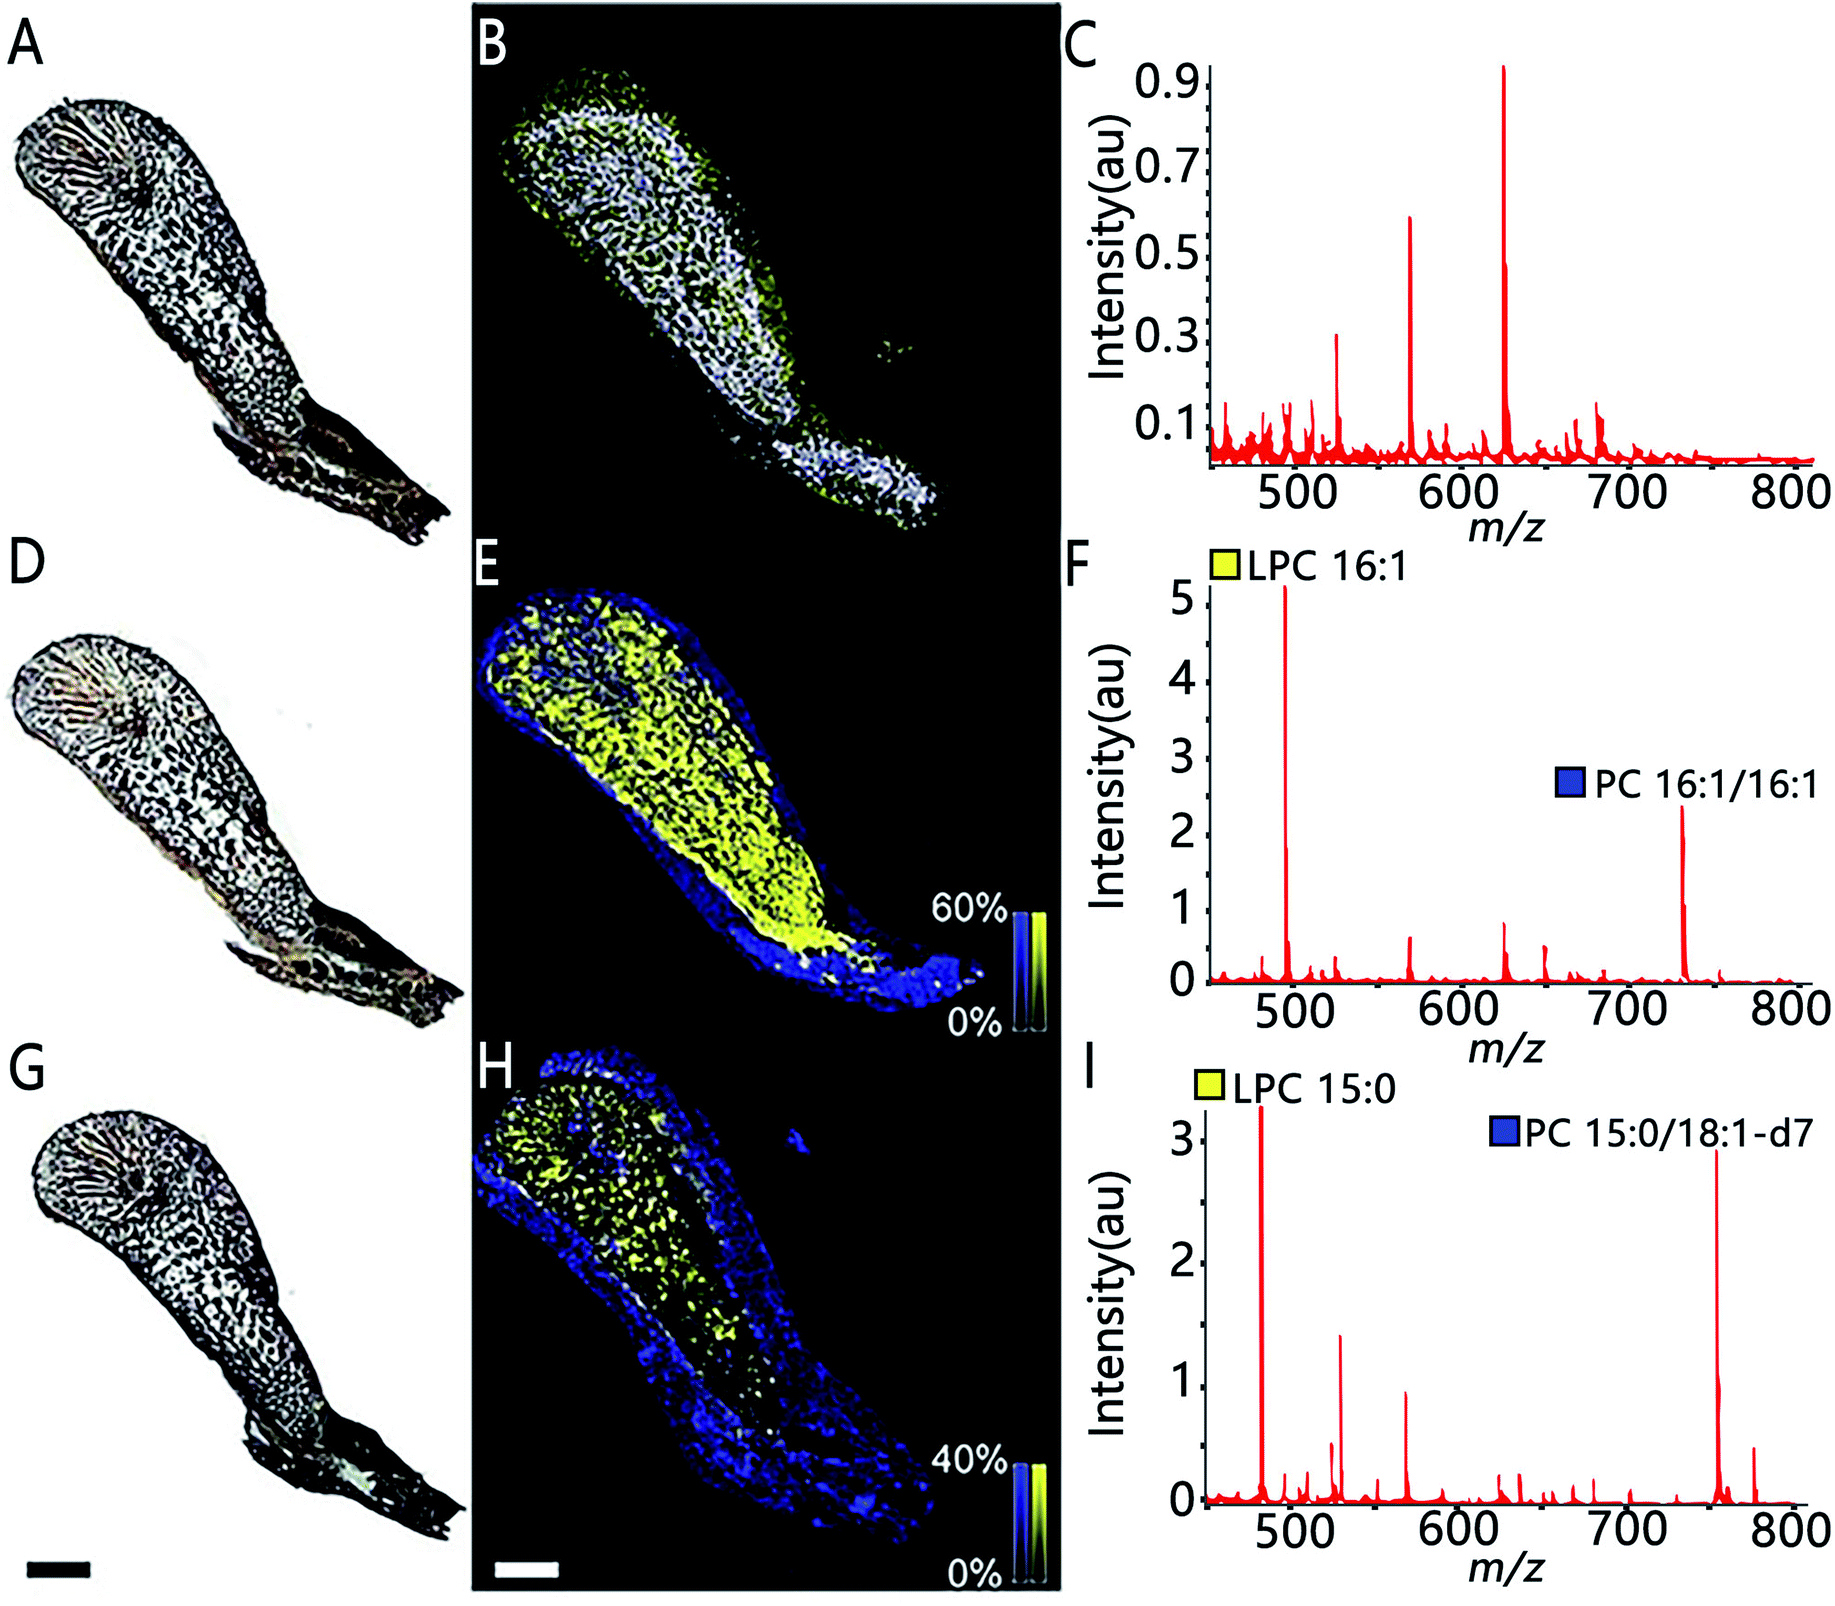 | ||
| Fig. 5 The use of functional MSI to study phospholipases A2 activity against two different lipid substrates, PC 16:1/16:1 and PC 15:0/18:1-d7, from N.subfulva venom gland. Optical images of venom gland tissue sections in the absence of lipid substrate (A), the addition of the substrate phosphatidylcholine (PC) 16:1/16:1 (D) and a deuterium-labeled substrate PC 15:0/18:1-d7 (G). (B, E and H) MALDI images of the substrate (blue) and their corresponding PLA2 product (yellow) for each section. (C, F and I) Averaged MALDI mass spectra in the absence of lipid substrate and addition of the two substrates. Scale bar, 2 mm. Sample sections were coated with α-cyano-4-hydroxycinnamic acid (CHCA) and measured with MALDI imaging in positive ion mode (80 μm raster size). Reprinted (adapted) from Hamilton et al. (2020)35 with permission. | ||
3.3 Novel natural product isolation and identification
The classical approach in NP discovery often relies on screening crude extracts for specific bioactivity followed by fractionation and structural elucidation of the active compounds. Although successful, the high rediscovery rate associated with this approach increasingly disturbs current NP screening endeavors.40 MSI offers several unique advantages which may complement current NP approaches: (i) it can detect highly localized NPs with tiny yield and/or no UV-absorbance which may not necessarily be detected by LCMS or GCMS; (ii) it is able to characterize a NP before the pure compound is obtained and bioactivity verified; (iii) the spatial distribution information obtained by MSI can be used to guide the isolation, purification, and identification of NPs of interest; and (vi) MSI frequently allows for predicting the bioactivity of NP according to their spatial distribution. All these features have made MSI a promising tool for NP discovery.Highly localized metabolites with tiny yield may escape the detection from a standard LCMS or GCMS analysis workflow due to the “bulk dilution effect”. This phenomenon has been capitalized in a recent study concerning the identification of virulence factors causing mushroom soft rot disease.41 With the assistance of MALDI imaging, the authors were able to detect a toxin, namely Toxoflavin, which was produced by a bacterial mushroom pathogen Burkholderia gladioli primarily at the infected area of the mushroom (Fig. 6A and B). However, toxoflavin was not detected by LCMS analysis of the entire mushroom extract likely because its final concentration was below the limit of detection following global biomass extraction. By analyzing a ten-fold higher concentrated infected mushroom extract using LCMS the authors detected toxoflavin and confirmed the above assumption. In the same study, a trace amount of the antifungal agent caryoynencin was also detected by LCMS. However, its role in defense against mushroom soft rot disease could not be fully validated with either LCMS or MALDI imaging since caryoynencin is prone to degradation during sample preparation. The presence of highly polarizable units such as four conjugated C–C triple bonds in caryoynencin makes it ideally suitable for detection by Raman spectroscopy. As such, Raman imaging was used to monitor and compare the production of caryoynencin between healthy and infected mushroom areas (Fig. 6C). The result finally confirmed that caryoynencin was synthesized in infected tissues for defense against soft rot disease (Fig. 6D). This excellent example highlights the merits of combining additional orthogonal, chemically, or structurally informative imaging techniques with MSI to obtain more comprehensive evidence on metabolite structure and function. Multimodal imaging is further discussed in Section 4.1.
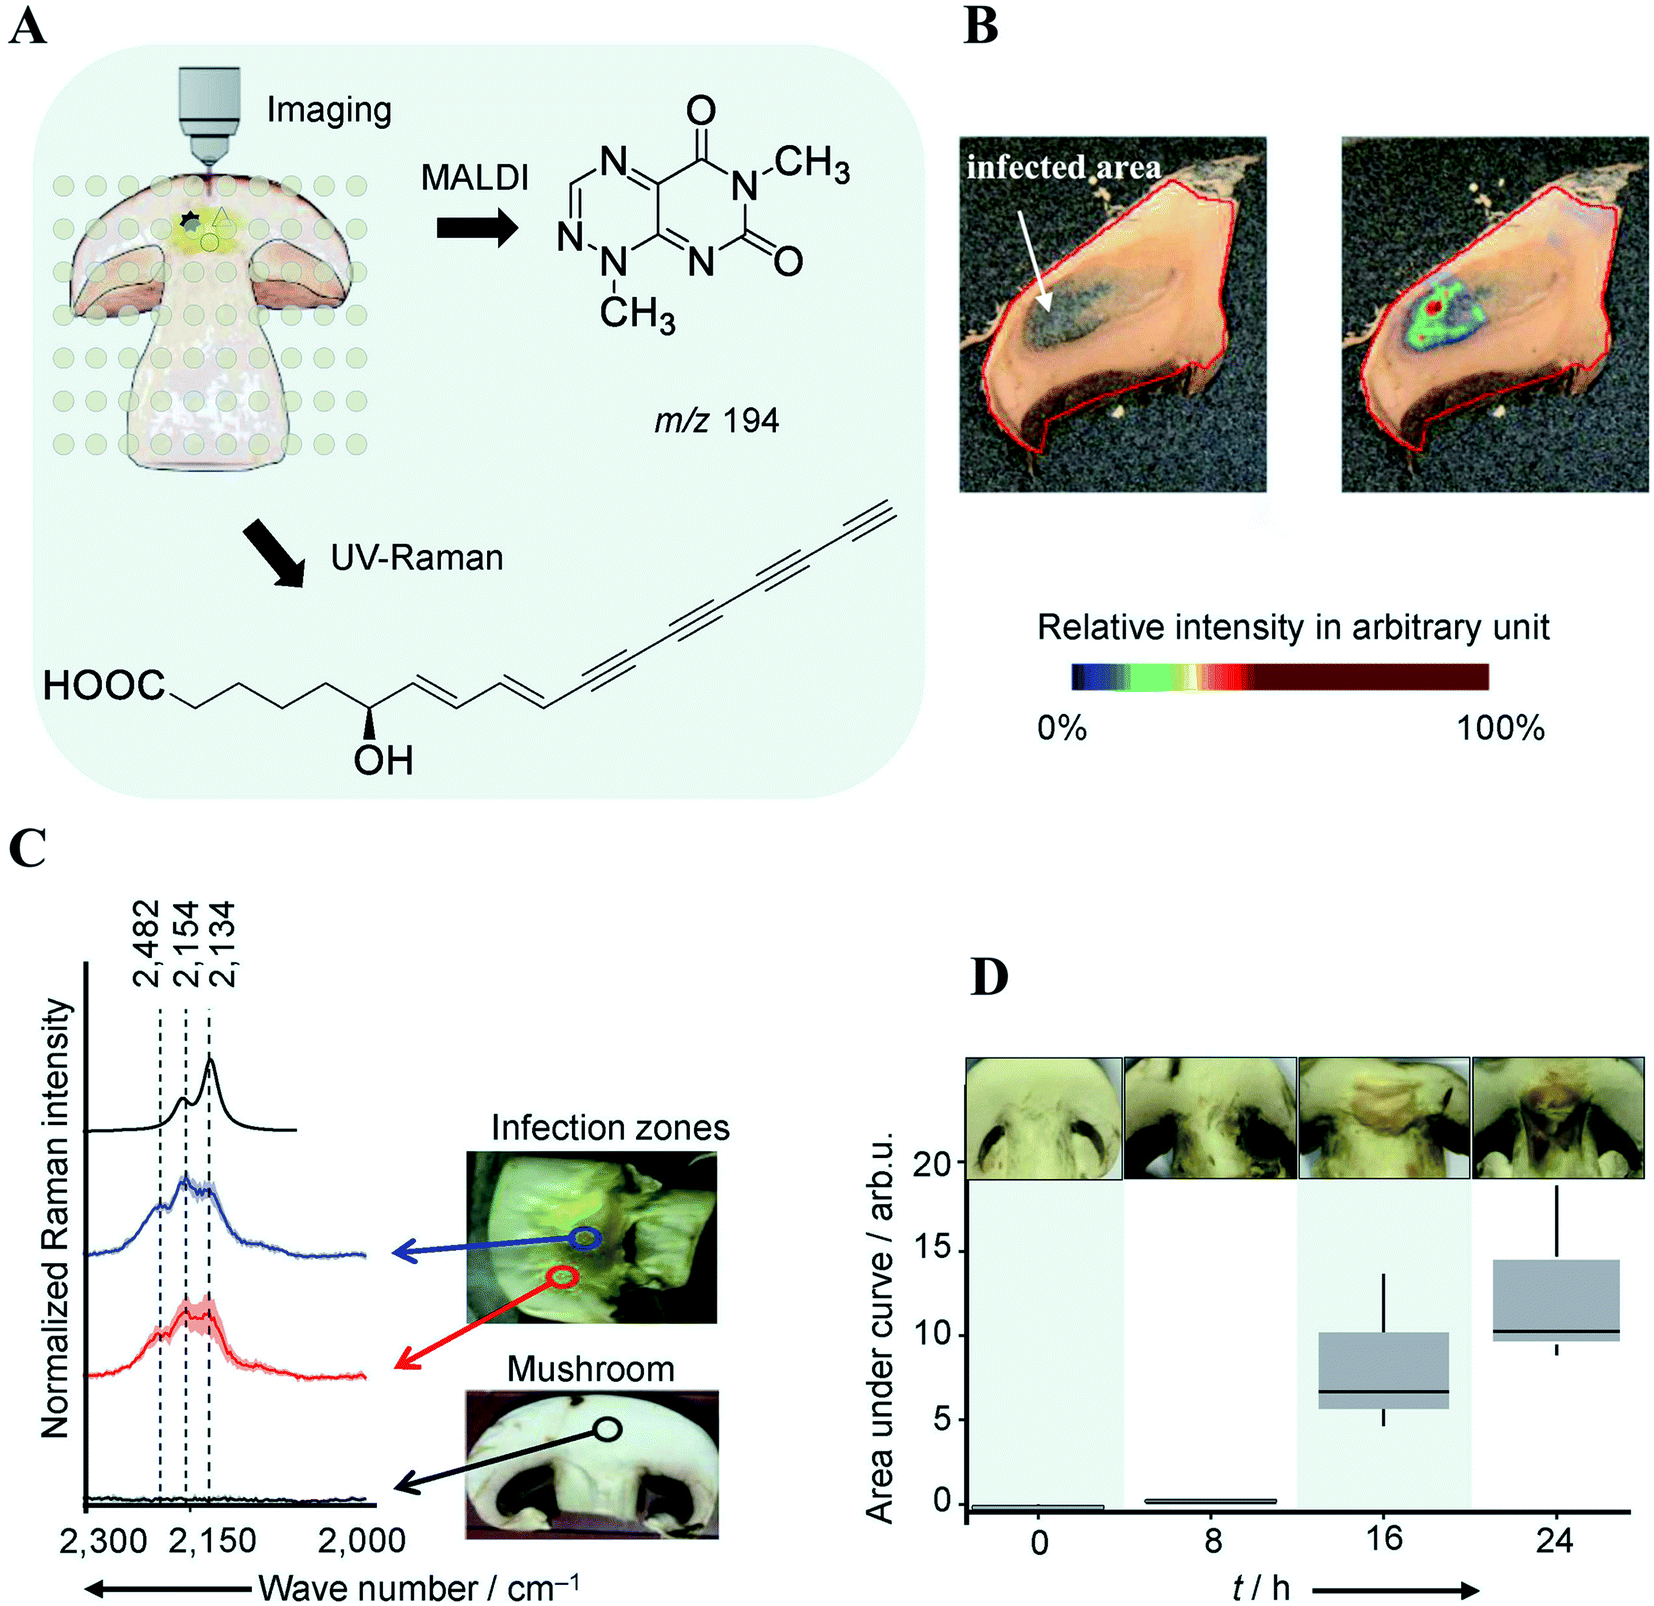 | ||
| Fig. 6 Multimodal identification of virulence factors involved in soft rot disease. (A) Workflow of multimodal imaging of infected mushroom slices. (B) MALDI image of toxoflavin showing that it primarily accumulates in infected mushroom tissue. (C) Density functional theory (DFT) calculated and measured UV Raman spectra of caryoynencin. Measurements were carried out on mushrooms slice: non-infected (black), infected (blue/red). (D) Box plots of the area under the curve of the Raman spectral band region associated with caryoynencin (2120–2220 cm−1) of infected mushroom tissue at 0, 8, 16, 24 h after infection. Sample sections were coated with a universal MALDI matrix (1:1 mixture of 2,5-dihydroxybenzoic acid and α-cyano-4-hydroxycinnamic acid) and measured with MALDI imaging in positive ion mode (raster size: not reported). Reprinted (adapted) from Does et al. (2021)41 with permission. | ||
MSI can be used to investigate the metabolic secretome of various microbial species. It allowed discovering numerous secreted and colony-associated metabolites that are produced by microbes/plants to interact with or respond to neighbouring organisms and environmental stresses.42 For instance, acylsugars are specialized metabolites that are best known to be synthesized in the secretory glandular trichomes of the plant family Solanaceae (e.g. tomato), and evidence suggests that they play important roles in plant chemical defenses against insects and other herbivores.43 Korenblum et al. found that tomato root could also exudate acylsugars when colonized by Bacillus subtilis. MALDI images showed that different acylsugars appeared to accumulate in distinctive and highly localized root domains. For example, acylsucrose S1:5 was localized to the lateral root tips, while acylsucrose S4:19 was mainly distributed along the hairs of the main root.44 Additionally, MSI frequently allows predicting the bioactivity of metabolites based on their dynamic changes in spatial distribution; therefore it can be also used to filter the number of candidates needed to be purified for further characterization. For instance, Bai and co-authors found that the colony shape of a wilt-inducing fungus strain F. oxysporum f. sp. lycopersici 4287 (Fo4287) significantly changed when it was confronted with the strain P.polonicum ACCC31573 (Ppo1); while its colony morphology remained unaffected by the presence of the strain P. polonicum Hy4 (Ppo2) (Fig. 7A).45 Such observation suggested that Ppo1 could release certain metabolites to inhibit the growth of Fo4287. By direct analysing the microbial colony and the surrounding media using MALDI imaging, the authors detected 37 mass features in the negative ion mode. Three of them were predicted to possess antifungal activity based on their spatial distribution patterns using 3 criteria: (1) the candidate is secreted by Ppo1, (2) it could reach the edge of Fo4287 colony, and (3) it is not produced by Ppo2 (Fig. 7B). Subsequent LCMS, NMR, and anti-fungal activity assays of the 3 targeted candidates led to the identification of the novel fructigenine A and B anti-fungal compounds.45 In this example, instead of isolating each compound and testing its bioactivity, MALDI imaging was first applied to select the most promising antifungal candidates by their spatial distribution, therefore largely accelerating the antibiotic identification process.
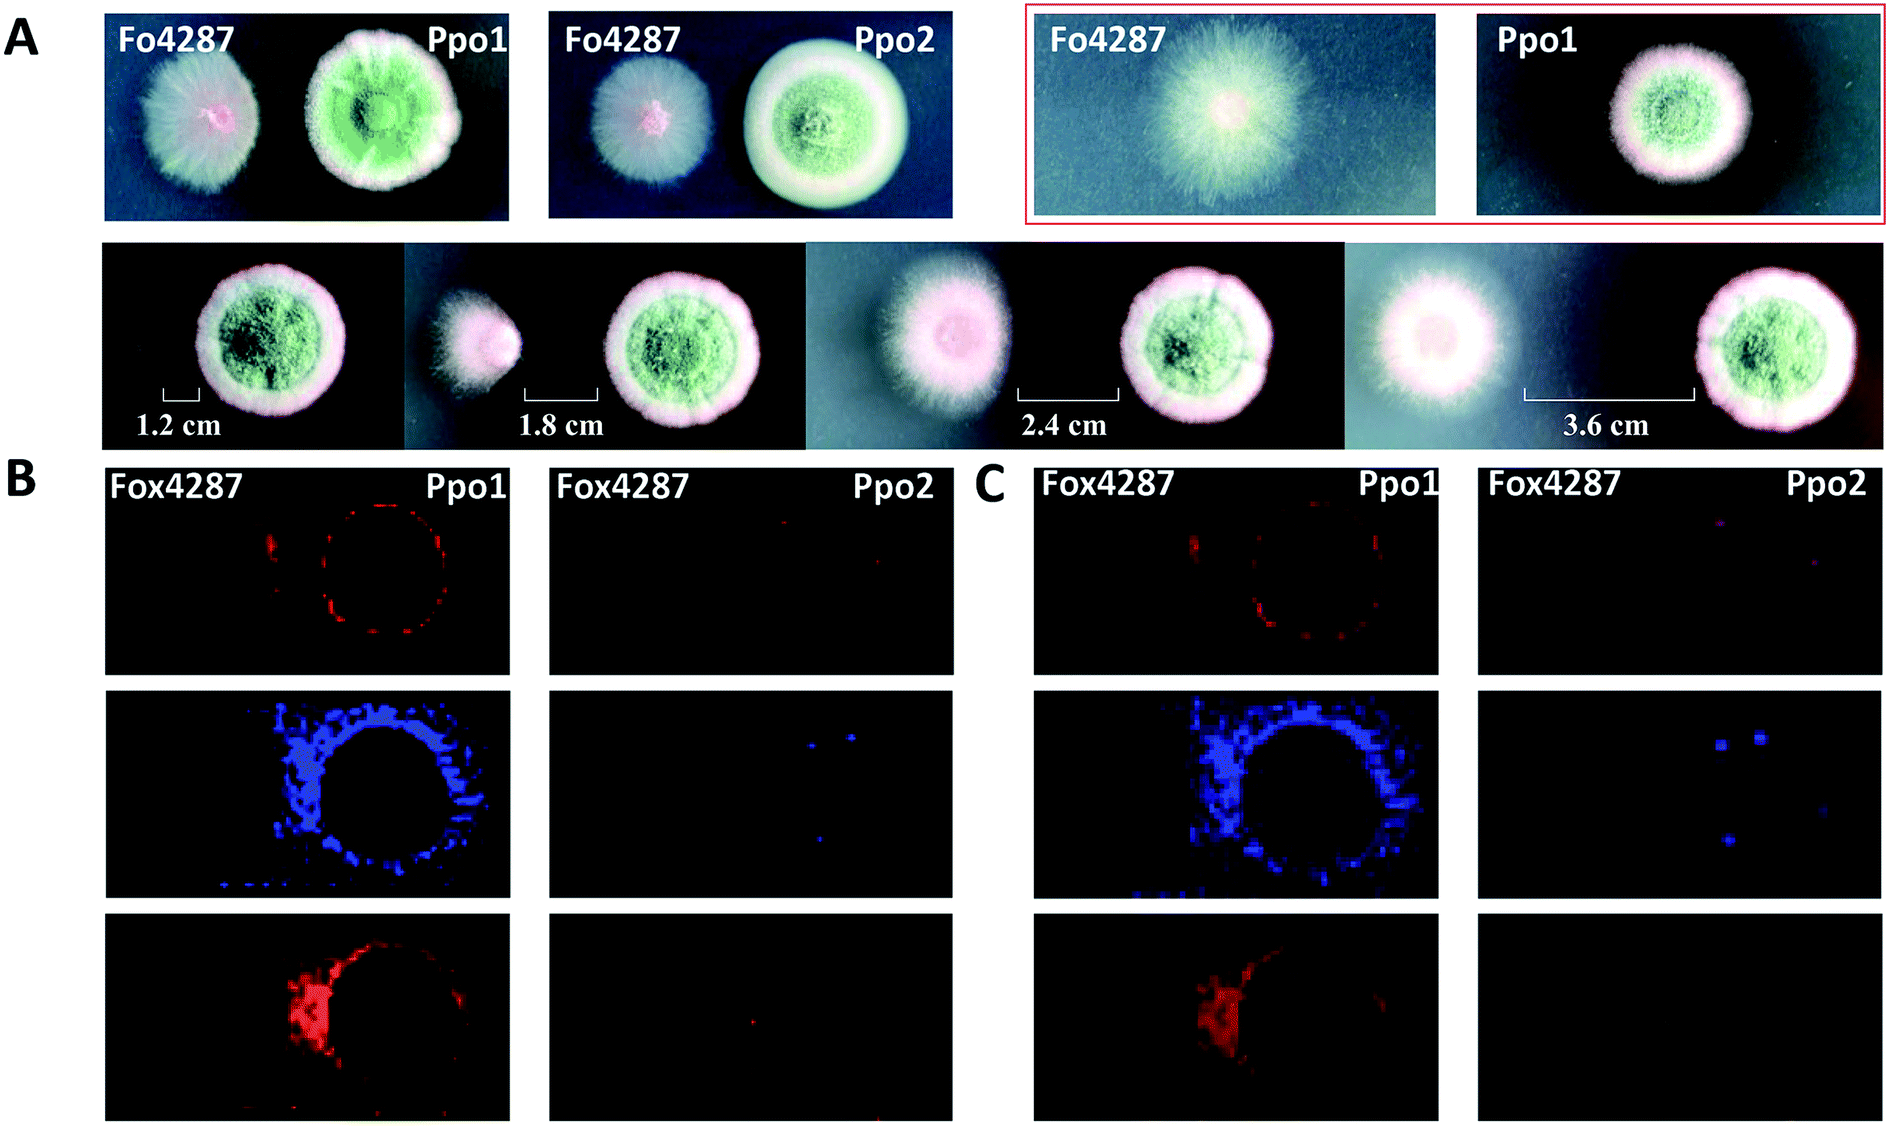 | ||
| Fig. 7 Mapping the localization of candidate antifungal metabolites from Penicillium polonicum. (A) Optical images of the fungi strains grown on potato dextrose agar (PDA) plate. The first lane: a single colony of a wilt-inducing fungus strain F. oxysporum f. sp. lycopersici 4287 (Fo4287) and P. polonicum ACCC31573 (Ppo1), co-culture of Fo4287 and Ppo1 or P. polonicum Hy4 (Ppo2); the second lane: co-culture of Fo4287 and Ppo2 with different distances marked in the images. (B) MALDI images of three candidate m/z signals, i.e. m/z 281.25, m/z 410.25, and m/z 444.04, respectively. (C) Overlaid MALDI images and optical images of the colony shown in red rectangle in (A). Samples were coated with a universal MALDI matrix (1:1 mixture of 2,5-dihydroxybenzoic acid and α-cyano-4-hydroxycinnamic acid) and measured with MALDI imaging in positive ion mode (600 μm raster size). Reprinted (adapted) from Bai et al. (2018)45 with permission. | ||
Genome mining, the process of in silico identification of specific functional genes or biosynthetic gene clusters (BGCs) from genome sequence using modern bioinformatics tools, has revealed that many bacteria, fungi, and even higher organisms have far greater potential to produce NPs than what is estimated from classic bioactivity screening.46 This underestimation is partially due to the reason that many BGCs are silent or weakly expressed under standard laboratory conditions, resulting in low production yield which may prevent the detection of NPs by many analytical approaches.45 As such, there is a growing demand for novel genome mining methods and strategies to access these untapped NPs.47 Recently several approaches have been developed for activating silent BGCs, among which high-throughput elicitor screening (HiTES) is an attractive method for efficient detection of elicitors. In this approach, a reporter gene is inserted into a BGC of interest, and small molecule libraries are then screened against the reporter strain to look for suitable transcriptional elicitors. Once a hit is identified via phenotypic changes or assays, the small molecule product is further characterized along with the regulation of the silent BGC. Major drawbacks of this approach include: (i) the BGC must be targeted specifically using genetic information, which limits the throughput of NP discovery, especially for genetically intractable organisms; (ii) it does not provide a direct link of bioactivity to a given cryptic metabolite.48,49 To overcome these shortcomings, Xu et al. have adapted HiTES by replacing genetic reporter assays with MSI as a read-out for NPs production.50 This workflow consists of subjecting the wild-type microorganism to elicitor screening followed by imaging the resulting 500–1000 metabolomes, as a function of each molecule in the library, using LAESI imaging. With this approach, they discovered nine new metabolites in two different bacteria strains. This approach does not require challenging genetic, cloning, or culturing procedures, it can be thus used for both sequenced and un-sequenced bacteria.50 As MSI allows direct readout of the chemical output and metabolic exchange between organism and their environment, it holds great promise in speeding up NPs discovery rate and linking NPs to their biosynthetic gene clusters. This is especially true for organisms that are not genetically accessible.51 For instance, Helfrich and co-authors have isolated over 200 phyllosphere bacteria from Arabidopsis.52 The genomic analysis combined with thousands of binary interaction screens led to the identification of more than 1000 BGCs, with a majority lacking similarity with characterized BGCs. For bacteria harbouring a large number of BGCs and showing a wide inhibition spectrum, MALDI imaging was used to map the spatial distribution of ion peaks around colonies grown on different sensitive indicator strains. As discussed previously that MSI often allows predicting compounds with an antibiotic activity by correlating the shape of the inhibition zone around the colony with its spatial distribution. Metabolites of interest can be thus selected and purified guided by their distribution patterns. This strategy has led to the identification of two novel antibiotics, lysolipid phosphobrevin, and the trans-AT PKS-derived macrobrevin, from one selected strain Brevibacillus sp. Leaf182.52,53
3.4 High-throughput phenotyping and screening
The development of powerful analytical techniques for high throughput phenotyping and large-scale metabolite analysis is in great need in current NP studies. For instance, altering and editing DNA sequences in microbial engineering is no longer the limiting step in selecting engineered strains for enhanced NP production, rather it is the lack of high-throughput tools for characterizing the engineered strains. Indeed, comprehensive chemical characterization of the metabolic phenotypes resulted from specific gene editing events is one of the grand challenges in synthetic biology. Thus, increasing the throughput and molecular coverage of analytical readouts offers great opportunities to accelerate the metabolic engineering.54 MSI is particularly suited for such studies because it provides high throughput and untargeted metabolite analysis capabilities without the requirement of laborious sample preparations and time-consuming separation. To demonstrate, Ellis et al. developed a DESI imaging-based screening assay to phenotype four E. coli strains that were genetically engineered to overproduce free fatty acids (FFA) with defined chain-lengths by expressing different thioesterase enzymes.55 When using a 50 × 250 μm raster rate, the authors were able to complete sampling of 42 colonies in 356 minutes. Apart from the time needed for transferring samples onto the DESI slide (∼10 min), the sample throughput was ca. 8 min per microbial colony from solid-phase growth to acquired data. By applying unsupervised segmentation (namely, spatial shrunken centroids analysis56,57) on the acquired DESI imaging data obtained from a mixed culture comprised of the control strain TY06 and FFA-overproducing strains TY05, NHL17, and WT-TesA, the authors successfully assigned the 4 strains based on their metabolic profiles (Fig. 8). All the strain assignments were validated using a PCR assay, demonstrating the analytical specificity and accuracy of DESI imaging as a fast-sampling method. The segmentation results revealed unique phenotypes of the four strains analysed in this experiment. For instance, the dark blue segment represents the dodecanoic acid producing TY05 strain and red corresponds to NHL17 engineered for octanoic acid production (Fig. 8). This remarkable example demonstrates the potential of MSI in accelerating strain engineering by providing rapid, untargeted, and multiplexed analyses of microbial metabolic phenotypes. The recently developed ambient ionization approach such as laser-ablation electrospray ionization (LAESI) is also capable of direct analysis of biological samples in a matrix-free, native atmospheric condition with minimal to no sample preparation, in a significantly shorter analysis time.58 LAESI is therefore another important MSI technique for high throughput phenotyping. As discussed above, Xu et al. coupled HiTES with LAESI imaging to discover new NPs. Rather than monitoring one silent BGC at a time, HiTES-LAESI imaging allows interrogating the global secondary metabolome of any cultivable bacterium in response to 500–1000 conditions,50 which opens an opportunity for high throughput NP discovery. In a similar study, Yoshimura et al. applied LAESI imaging for rapid screening of 960 B. gladioli transposon mutants cultured in 96-well plates to identify metabolites of interest and selected the best overproducers.59 MALDI imaging is capable of very fast acquisition on the orders of seconds, therefore it can be also applied for rapid phenotyping as demonstrated by Li et al., in which MALDI imaging was used for systematic characterization of two Paeonia species, Paeonia suffruticosa, and Paeonia lactiflora.60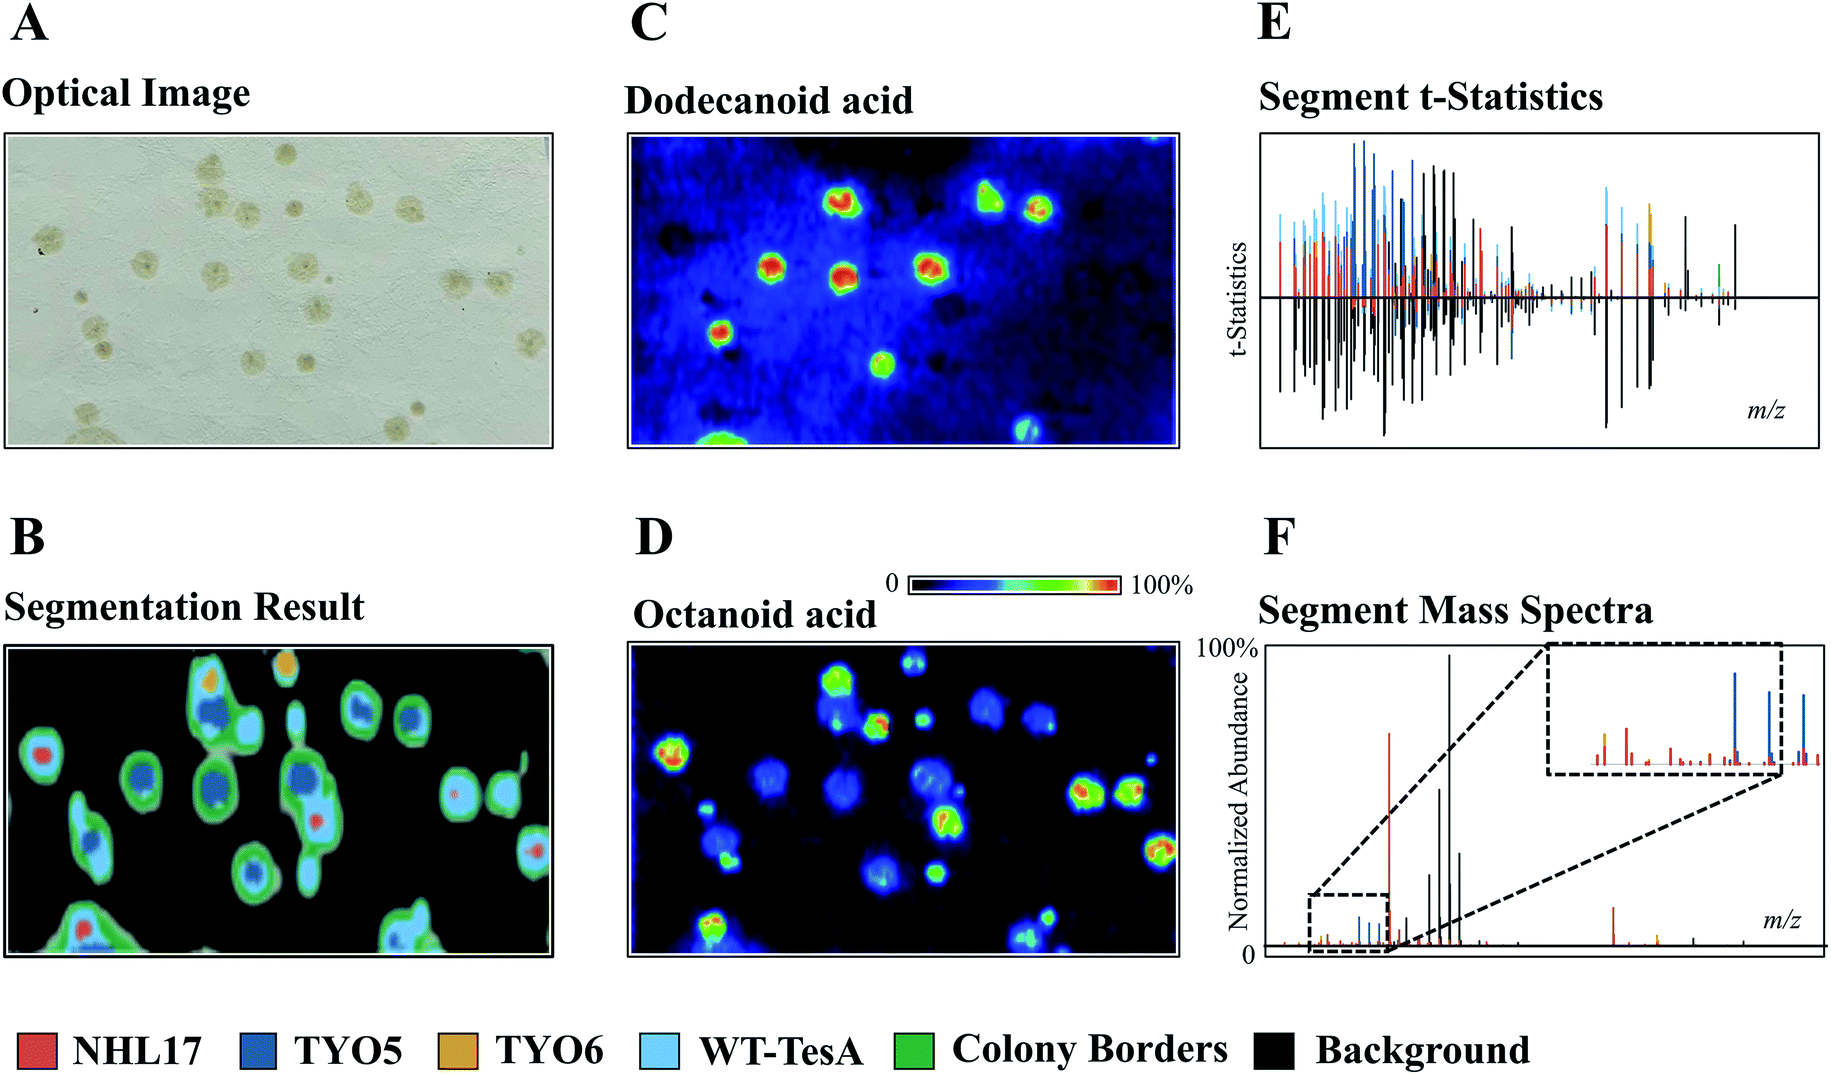 | ||
| Fig. 8 The use of unsupervised segmentation to determine molecular phenotypes of four different E. coli colonies based on measured metabolomes. (A) Optical image of TY05, TY06, NHL17, and WT-TesA E. coli colonies. (B, E and F) Segment statistics and mass spectra highlight the primary features contributing to each strain segment. The segmentation results reveal the unique phenotypes of the four strains. The dark blue segment represents the dodecanoic acid producing TY05 strain and red corresponds to NHL17 engineered for octanoic acid production. The yellow and light blue segments denote the control TY06 strain and the broad free fatty acids producing WT-TesA strain. The inset in (F) is scale expanded segment mass spectra. (C and D) MALDI images of dodecanoic acid and octanoic acid, respectively. Samples measured by DESI imaging in positive ion mode with acetonitrile/water (90/10, with 0.5% NH4OH) being spray solvent (50 × 250 μm pixel size). Reprinted (adapted) from Ellis et al. (2021)55 with permission. | ||
4 Integration of mass spectrometry imaging with other techniques
While powerful by itself, MSI can be also coupled with other analytical techniques to obtain more comprehensive and/or complementary information with respect to sample tissue structure, molecular coverage, throughput, analyte identification, quantification, and distribution. For instance, MSI has been routinely coupled with LCMS, GCMS, or NMR for metabolite identification. As shown in the above examples, MSI was combined with various genetics approaches to study genes function and their products,22,23,59 and with HiTES for the rapid identification of cryptic NPs.50 This section will highlight the possibilities and accrued advantages by adding other techniques to maximize the information gained from the analysed samples. Multimodal imaging and the use of stable isotope labelling in MSI are mostly discussed here. It is important to note that researchers should not feel restricted in using MSI and complementing it with other techniques to gain a deeper understanding of their research questions.4.1 Multimodal imaging
Multimodal imaging, as its name implies, is an integrated approach for acquiring images by combining chemical and structural information from two or more imaging modalities.61,62 Multimodal imaging combines the advantages of each modality, specificity, sensitivity, and spatial resolution, thus allowing a more detailed and comprehensive investigation of the biological system.Coupling MSI with different imaging modalities starts with optical microscopy techniques such as classical histology, fluorescence imaging, and immunohistochemistry. Optical microscopy is often performed on the same, or adjacent tissue section to acquire high-resolution images with detailed morphological and structural information. The acquired optical images can be used to determine the region of interest (ROI) for MSI analysis and interpret the MSI data by overlaying MS images with the optical image. The combination of these approaches could lead to the discovery of valuable biochemical information. For instance, Geier et al. have combined fluorescence in situ hybridization (FISH) microscopy and high-resolution atmospheric-pressure MALDI imaging (namely MetaFISH) to study the interactions between a deep-sea mussel and its intracellular symbiotic bacteria. This approach enables direct discovery of specialized metabolites located at the host–symbiont interface.63 Such method holds great promise for studying small scale interactions between the microbiome and the host. When identifying bioactive compounds associated with host–virus interactions (between the alga Emiliania huxleyi and its specific virus), Schleyer et al. found it difficult to accurately pinpoint a viral plaque (area without host cells, lysed by the virus) with naked eyes during the early viral infection.64 As chlorophyll degradation is known to be associated with viral infections, the authors used chlorophyll autofluorescence to identify such plaques. The centre of the plaque which mainly consists of lysed cells can be easily spotted by a significantly reduced chlorophyll signal (Fig. 9). The identified plaques were then subjected to MSI analysis, and a list of known lipid biomarkers involved in viral infection was detected (Fig. 9).64 Wisman et al. constructed a β-glucuronidase (GUS)-expressing strain of Aspergillus oryzae and used it to produce rice koji (a solid culture of Aspergillus oryzae on steamed rice grains). The image of the GUS reporter gene allowed them to clearly observe the fungal growth during koji making. The same grain was subjected to MSI analysis to visualize glucose distribution and correlate it with the degree of mycelial penetration.65
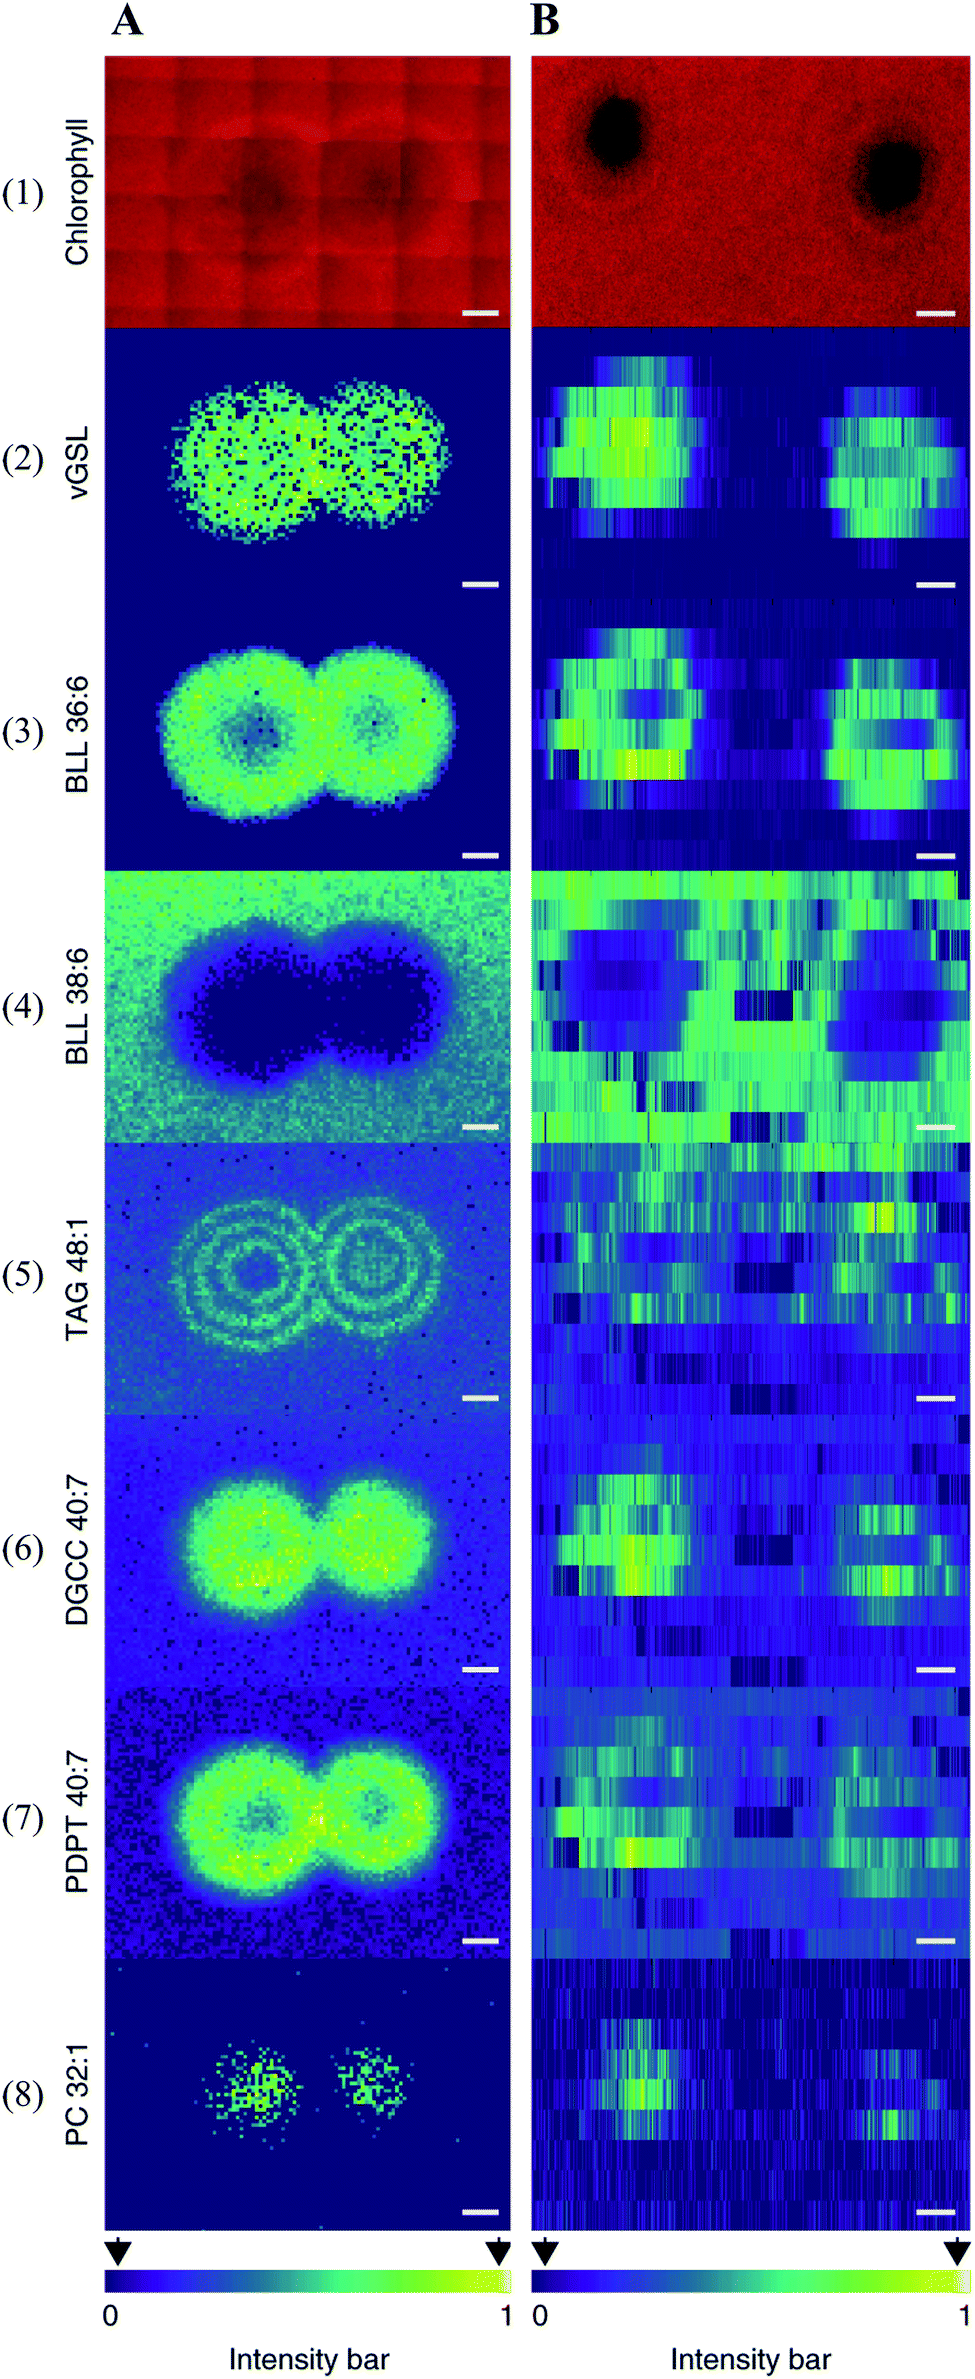 | ||
| Fig. 9 Multimodal imaging of known lipid biomarkers associated with host–viral interactions between the alga Emiliania huxleyi and the lytic E. huxleyi virus EhV20153. (A1 and B1) Chlorophyll autofluorescence of the sample (red pseudo-colour) accurately locates the centre of the viral plaque. (A2-8) MALDI images of virus-derived glycosphingolipids (vGSLs) t17:0/h22:0, betaine-like lipid (BLL) 36:6, BLL 38:6, triacylglycerol (TAG) 48:1, diacylglyceryl carboxyhydroxymethylcholine (DGCC) 40:7, glycerophospholipids, such as phosphatidyl-S,S-dimethylpropanethiol (PDPT) 40:7 and phosphatidylcholine (PC) 32:1. Scale bars, 1 mm. (C2-8) Flow-probe-MS imaging of the seven lipid biomarkers. Scale bars: 2 mm. Samples were imaged using both MALDI imaging and Flow-probe-MS imaging. For MALDI imaging, samples were coated with 2,5-dihydroxybenzoic acid (DHB) and measured in positive ion mode (100 μm raster size); for flow-probe-MS imaging, samples were measured in positive ion mode (25 × 500 μm pixel size). Reprinted (adapted) from Schleyer et al. (2019)64 with permission. | ||
Each MSI technique has its own merits and constraints. For instance, SIMS affords chemical imaging with micrometre to nanometre scale spatial resolution, which is the highest lateral resolution reported of any MSI methods. But it often leads to significant fragmentation of large molecules, which makes metabolite identification challenging. MALDI, by contrast, allows direct detection of intact molecules but the spatial resolution is limited. The spatial resolution for a given MALDI imaging experiment is mostly defined by the laser spot size. Current commercial MALDI imaging systems can now achieve spatial resolutions at 5–20 μm. The development of specialized optical setups, e.g. a transmission geometry optical configuration, has reduced the laser beam to less than 1 μm.66,67 However, other factors also affect the ultimate spatial resolution of a MALDI measurement, such as delocalization during sample preparation, the type of matrix used, the matrix application method and sensitivity of the instrument. As such, typical MALDI experiments are performed at pixel sizes of ∼30–100 μm.16,68,69 By coupling different MSI techniques, one can push the limits on the current “4S-criteria” constraint. For instance, Lanni et al. used a MALDI-guided SIMS imaging approach to study the compositional differences between the biofilms of WT and quorum sensing (QS) mutant Pseudomonas aeruginosa.70 The biofilms were first imaged by low-resolution MALDI imaging. The resulting MALDI images were then used to guide subsequent SIMS imaging at high resolution to examine the selected ROI.70 Multimodal MS imaging is also applied to boost molecular coverage. In a more recent study, Flint et al. used DESI imaging, imaging mass cytometry and laser ablation inductively coupled plasma (LA-ICP) imaging to characterize a 3D cell culture model of an epithelial HCC827 lung adenocarcinoma cell line.71 Combination of the three imaging techniques in this study enables the identification and mapping of the spatial distribution of metabolites, proteins, and elements, thus providing a more comprehensive understanding of the biological processes within the model.
MSI has also been frequently combined with other non-MS-based chemical imaging techniques for additional structural, morphological, biological, and chemical information. For instance, the capability to detect highly diverse molecules benefits from the use of different types of imaging modes, where one modality can detect molecules undetectable by another, as demonstrated in Fig. 6. Coupling MSI with vibrational spectroscopy imaging (VSI) techniques, such as Raman spectroscopy and Fourier Transform Infrared spectroscopy (FT-IR), provide perfect complementary toolsets to study complex biological samples. MSI offers specific molecular information while VSI adds information about the abundance and specificity of the chemical families (e.g. types of chemical bonds and heavy atoms).72 In particular, due to the non-destructive and label-free nature of VSI, the two approaches can be applied to the same sample. Susniak et al. combined MALDI imaging, FT-IR, and Raman spectroscopy to assess the effectiveness of biofertilizers by monitoring spatial changes of and relative abundance of several selected metabolites involved in nitrogen fixation in the pea root nodules.73 Magnetic resonance imaging (MRI) has also been used to complement MSI with detailed structural information. In one example, MRI and DESI imaging were used to study distributions of alkaloids in two structurally distinct regions of maturing areca nuts (i.e. seeds of Areca catechu). MRI images showed that during maturation, the liquid content started solidifying from the peripheral regions of the nut and during the solidification process, brown and white regions started forming. DESI images revealed that arecoline, arecaidine, and guvacoline alkaloids were segregated in the brown region while guvacine was localized in the white region.74 X-ray-based tomography, like micro-computed tomography (micro-CT) and phase-contrast synchrotron radiation based micro-computed tomography (PC-SRμCT), is a non-invasive imaging technique that is able to capture 3D structural information at micrometre-scale resolution. By integrating MALDI imaging with either PC-SRμCT75 or micro-CT,76 Geier et al. have developed a correlative imaging workflow to study the 3D microanatomy, cellular and chemical organization of host-microbe systems.
Significant challenges in terms of imaging data analysis are still pervasive. Most current multimodal workflows collect, process, and visualize the datasets separately. Developing a straightforward approach to integrating all datasets (such as image registration and data fusion) will enable deeper data mining. This is particularly difficult within an imaging regime because the various imaging modalities can have dramatically different spatial resolutions, data structures, and chemical information.61 Having a single hybrid instrument that combines multiple imaging methods would considerably simplify the experimental workflow and reduce the complexity associated with intermediary data processing and visualization steps.77 Zemaitis et al. coupled a 3D printed DESI ion source onto a commercial MALDI MS instrument.78 This approach allows the generation of multiple modes of MS images without the need to exchange ion sources and application of additional external software. In fact, an MS instrument equipped with multimodal MALDI and DESI imaging is already on the market, which delivers multi-layered, information-rich data from a single sample (e.g., Waters™). For multimodal data processing, universal imaging file formats and standard data processing and analysis workflows are in great demand. A unified data format, common to all spectral imaging techniques, would benefit and promote the development of multimodal imaging applications. Iakab et al. developed a software tool to convert Raman datasets to imzML format (the standard format for MSI files), thus allowing analysing Raman images using the same open-source software designed for MSI.79 Nevertheless, multimodal imaging will become more and more common in the future and provide unprecedented insights into NP studies.
4.2 The use of stable isotope labelling in MSI
Stable isotopes share the same physicochemical properties, but they differ in masses due to the difference in the number of neutrons. Therefore, isotopologues (i.e. metabolites containing stable isotopes) and their unlabelled counterparts generally behave identically in MS but can be distinguished by their m/z values. Stable isotope-labelled internal standards (IS) have been widely used in quantitative MSI (qMSI) for signal normalization and absolute quantitation. The most common and simple way is to homogeneously apply the stable isotope-labelled analyte of interest underneath or over the tissue section. Ion intensity of the targeted analyte is then normalized to the intensity of the labelled IS at each pixel.15 The principle of using stable isotope labelling (SIL) in qMSI is similar to those in other MS-based quantification studies (e.g. LCMS); thus the use of SIL as a normalization strategy is not further elaborated here. Interested readers are kindly referred to other reports.80,81 Depending on the labelling regime, organisms can be labelled uniformly or non-uniformly with different degrees of enrichment. In “global SIL” approaches, stable isotopes are introduced into biological systems via main nutrient sources in order to completely label all endogenously produced metabolites;82 while in “tracer-based SIL”, a labelled compound (namely tracer) is administrated to the organism as a metabolic substrate. Uptake and incorporation of the tracer allow following the metabolic fate of the tracer and its flux through specific pathways.83,84One of the most common applications of global SIL in MSI is to determine the elemental composition (EC). The number of labelled atoms can be accurately inferred by calculating the mass difference between labelled and unlabelled peaks, thus effectively reducing the number of candidate ECs calculated by measured m/z value of the unlabelled peak within an accepted mass accuracy window. The use of multi-isotopes in global SIL, such as combining 13C and 15N labelling, can further narrow down the number of possible ECs since the number of both C and N atoms contained in the formula is accurately calculated. In addition, by feeding a specific stable isotope, it is possible to fish out all metabolites containing this element from a biological system. For instance, Kinnel et al. developed a MALDI-isotopic approach for NP discovery.85 In a proof-of-concept study, they analysed the filaments of M. producens JHB cultured with 14N- and 15N-nitrate as nitrogen sources using MALDI. By comparing the mass shift between the isotope cluster, the authors were able to identify a list of N-containing metabolites including a new metabolite cryptomaldamide.85 Due to the lack of retention time information, it is generally difficult to pair a labelled to its corresponding unlabelled peak accurately and efficiently. Consequently, MSI-based global SIL is often combined with LCMS for EC determination. For instance, Nakabayashi et al. integrated 15N labelling, LCMS, MALDI profiling, and MALDI imaging and successfully identified 65 N-containing metabolites in Catharanthus roseus.86 With the same approach, they also identified 45 N-containing monoterpene indole alkaloids in different tissues of Catharanthus roseus.87
Compared to global SIL, tracer-based SIL is more commonly used in MSI for various applications. A labelled precursor is usually administered to the organism to confirm the presence of certain precursor-derived metabolites detected by MSI according to their labelling patterns and spatial distribution.88,89 It can be also applied in an untargeted manner to potentially detect all precursor-derived metabolites. For instance, Feldberg et al. developed a novel approach that integrates in vivo dual tracer-based SIL with LCMS and MALDI imaging (termed DLEMMA-MALDI-imaging) for metabolite identification and metabolic network reconstruction.83 In the study, they used two differentially labelled tyrosine forms as feeding precursors and identified 60 tyrosine-derived metabolites in lemna (Spirodela polyrhiza) (Fig. 10A). Among them, half were detected due to the improved concentration as a result of tyrosine feeding, which highlights the advantage of tracer-based SIL for increasing molecular coverage. Structural isomers have identical m/z values, therefore most of the current MSI approaches are likely to reflect the summed distribution of multiple isomers. In DLEMMA-MALDI-imaging, instead of using the unlabelled m/z value, two labelled m/z values of the metabolites of interest were used to generate ion images, therefore minimizing the isomer interferences, and depicting the true spatial distribution of the metabolite. With this approach, the authors were able to construct a detailed tyrosine-derived metabolic network map in lemna (Fig. 10B and C). In another study, 1H NMR and a multimodal MS imaging approach (i.e., MALDI and NanoSIMS imaging) were applied collectively to examine the impact of severe drought on carbon allocation and metabolic responses within the roots of three tropical rainforest plants. The roots were labelled with position-specific (C1 or C2) 13C-pyruvate, which allows to precisely track the fate of 13C-pyruvate into downstream 13C labelled metabolites.90
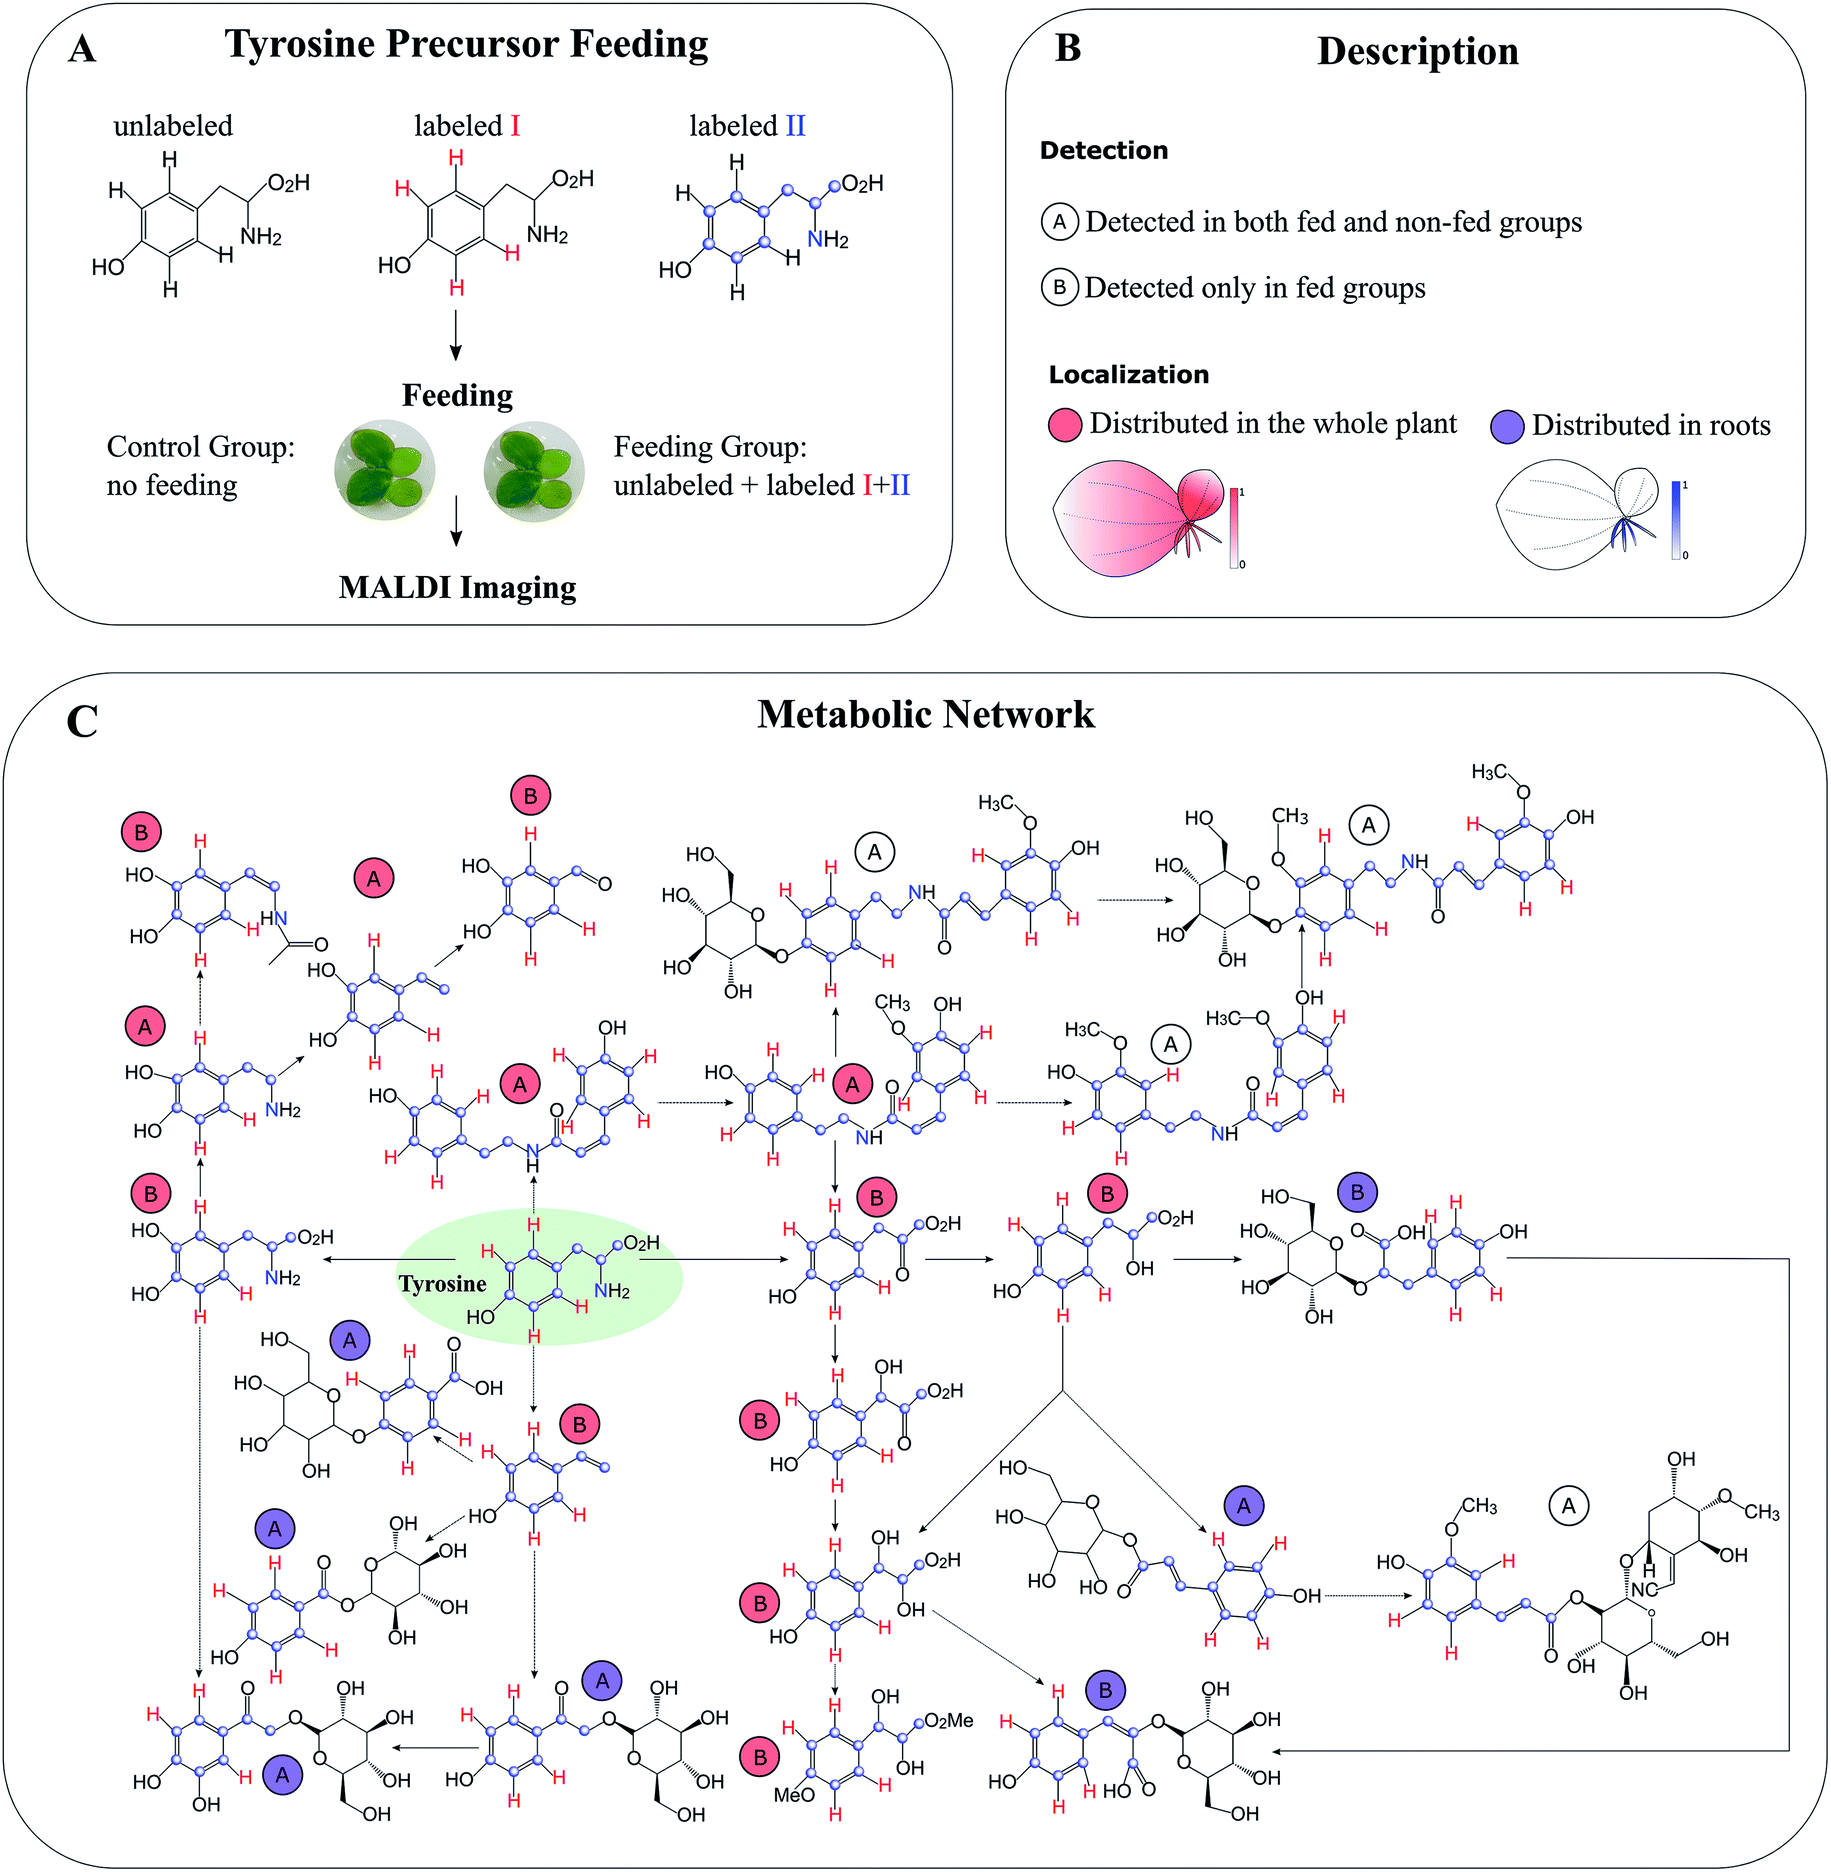 | ||
| Fig. 10 Detection of tyrosine-derived metabolites in the water-floating plant lemna by using DLEMMA-MALDI-imaging. (A) Schematic representation of the DLEMMA-MALDI-imaging procedure. Three forms of tyrosine (one unlabeled and two differently labeled, i.e., tyrosine-d4 and tyrosine-13C915N1) were used as feeding precursors. After feeding for 24 h, lemna plants were attached to glass slides, desiccated, and subjected to MALDI imaging analysis. (B) Summary of the MALDI imaging results concerning identified tyrosine-derived metabolites. Thirteen metabolites were distributed in the whole plant (circled in red), and seven were primarily localized in roots (circled in blue). The letter ‘A’ denotes that the metabolite was detected in both tyrosine-fed and non-fed sample groups, and the letter ‘B’ means that the metabolite was only detected in the tyrosine-fed sample group. (C) Reconstruction of a putative tyrosine-derived metabolic network in Lemna based on the DLEMMA-MALDI-imaging study. The pathway was constructed based on possible biochemical reactions using 24 tyrosine-derived metabolites. Samples were coated with 2,5-dihydroxybenzoic acid (DHB) and measured with MALDI imaging in positive ion mode (65 μm raster size). Reprinted (adapted) from Feldberg et al. (2018)83 with permission. | ||
Coupling MSI with SIL also provides the opportunity for spatial flux analysis and kinetics studies. MSI is limited in its ability to determine the production and turnover rates of intermediates as it only captures a snapshot of metabolism at the time of sampling. When combined with SIL, the relative amounts of labelled versus unlabelled metabolites, and the degree of labelling within metabolites, could be used to define the rate of reactions and the fluxes within a given metabolic network. For instance, Romsdahl et al. labelled camelina sativa and pennycress (Thlaspi arvense) embryos with [U-13C]-glucose for 64 h and 120 h to study the spatial differences in carbon flux through phosphatidylcholine (PC).91 MALDI images showed that 13C carbon source was preferentially incorporated into PC molecular species in cotyledons compared to the embryonic axis, which may indicate a greater flux towards the cotyledons of developing embryos. The pattern of 13C-labeling also suggested that there is a greater 13C enrichment in more saturated PC species as compared to more unsaturated PC species, implying that desaturation is a relatively slower process than the incorporation of the acyl chains.91 In another example, SIL (13C and 15N) was coupled to large geometry-SIMS imaging (LG-SIMS) and NanoSIMS imaging to image the C and N2 fixation and cellular distribution of recently fixed C and N at several time points in the filaments of the heterocyst-forming cyanobacterium Anabaena sp. strain PCC 7120.92 A similar approach has been applied by this group to study nutrient kinetics in an algal-bacterial mutualism,93 N2 and C fixation activity of single cells from different diatom-Richelia symbiotic populations.94
The combination of SIL and MSI is still in its infancy. As the sample preparation method, labelling incorporation, and data analysis begin to develop and mature, it is certain to become a rapidly growing area in the near future, providing a window into a thus far hidden dimension of biochemical information.
5 Current limitations and future directions
Despite the growing popularity of MSI, several key challenges remain to be resolved. First, metabolite identification is difficult. From a metabolomics perspective, one can regard MSI as performing an MS1-level shotgun metabolic profiling at each pixel. Thus, metabolite identification is based only on the m/z value and isotopic abundance of the observed peak. Generally, a separate workflow for either manual on-tissue MS/MS or LC-MS/MS analysis of a tissue homogenate is needed to assist metabolite identification in MSI, both of which require additional steps that will prolong the analysis time.83,95 Second, molecular coverage is typically low compared to LCMS or GCMS due to several reasons such as the lack of chromatographic separation, matrix (MALDI) or spray solvent (DESI)-dependent analyte selectivity, and the limited number of ions available in a small sampling volume.96,97 Third, absolute pixel-to-pixel quantification is challenging. A specific ion may desorb and ionize from the sample surface with different efficiency due to its local biochemical and anatomical variations.10,80 Forth, MSI is unable to discern structural isomers. The observed MS image for a single m/z value may represent a summed distribution of multiple isomeric molecules, therefore masking the true distribution of the target compound. In a more common case, very close m/z peaks (i.e. isobaric ions) are often detected as a single unresolved peak with poor mass resolution MSI instrument.83,98 Finally, MSI data analysis and sharing are challenging given the fact that a typical high-performance MSI platform generates gigabytes of complex high-dimensional data for each experiment.99The future of MSI relies on both innovation in instrumentation development and creativity in analytical methodologies. Coupling MSI with high-resolution, accurate MS, such as Fourier transform ion cyclotron resonance and Orbitrap MS, enables direct determination of EC from isotopic fine structures for small metabolites (<500 Da). The use of on-tissue tandem MS imaging (i.e. MS/MS imaging) significantly improves the confidence in metabolite identification. The development of automated, parallel MS and MS/MS imaging makes it possible to acquire hundreds of high-quality, unique MS/MS spectra without sacrificing spatial resolution and data acquisition time.95,100 As discussed earlier, the use of SIL also improves the confidence in metabolite identification. The development METASPACE (https://metaspace2020.eu/), an online annotation engine for MSI data, has largely facilitated metabolite identification. It performs MS1-based metabolite annotation by searching over ten public metabolomics/lipidomics databases such as HDMB101 and LIPID MAPS,102 and provides information regarding their molecular formulas and corresponding ion adducts, metabolite ion images, values of the metabolite-signal match (MSM) score, and an estimated false discovery rate (FDR) value for confidence-controlled metabolite annotation.103–105
Coupling MSI to more efficient desorption/ionization techniques such as laser-induced post-ionization (e.g. MALDI2) could improve the detection of poorly ionizable metabolites. MALDI2 is one of the most efficient means to enhance ion yields. With this technique, the initial MALDI-particle plume, formed in a fine vacuum environment of a few mbar of N2, is intercepted by the beam of a pulsed PI-laser which gives rise to a significant boost in ion yields for many metabolites.67,106 Chemical derivatization is another important approach to improve ionization efficiency and molecular coverage. In particular, the combination of several different complementary chemical derivatization agents allows the detection of various metabolites in an untargeted manner. To demonstrate this approach, Dueñas et al. (2019) performed on-tissue derivatization using three known chemical reactions: coniferyl aldehyde (CA) for primary amines, Girard's reagent T (GT) for carbonyl groups, and 2-picolylamine (2-PA) for carboxylic acids.96 This multiple on-tissue derivatization strategy was applied to explore the metabolite coverage in roots and leaves of two different maize genotypes (B73 and Mo17), and over six hundred new metabolite features were detected.96
As discussed earlier, MSI is unable to unambiguously resolve distinct isomers. This limitation could be addressed by coupling MSI with ion mobility spectrometry (IMS). IMS is a gas-phase separation technique that separates ions based on the form, size, and charge of the ions and has shown great potential in resolving the isobaric/isomeric metabolites.107 Tandem MS imaging is another widely used strategy to bypass isomeric interference, in which MS/MS imaging is performed to distinguish isomeric species in tissues, and the specific fragment is used to represent the spatial localization of the targeted metabolite.60,108 Multiple reaction monitoring (MRM) imaging (e.g., MRM-DESI imaging) can be regarded as a variant of tandem MS imaging, which has demonstrated improved sensitivity and specificity for the targeted metabolites.109 It is important to note that tandem MS imaging would be practicable only when the isomeric precursors generate different fragment ions. Unfortunately, some isomers are not easily discriminated by tandem mass spectrometry as a stand-alone methodology, such as glycan and lipid isomers.108 For instance, the positioning of carbon–carbon double bonds and stereospecific numbering are key factors to determine lipid functions, but when larger lipids are fragmented, this information is usually lost. Chemical derivatization of carbon–carbon double bonds has been employed to overcome this issue and facilitate specific fragmentation in MSI.110 Alternatively, MSI has been coupled with Paternò–Büchi reaction,111 epoxidation,112 ultraviolet photodissociation,113 ozone-induced dissociation,114 ion–ion reactions,115 and electron-induced dissociation116 to resolve lipid isomers.
The biosynthesis and storage of many NPs are highly compartmentalized. For instance, in plants, terpenes are produced in the disk cells and stored in the secretory cavity in glandular trichomes, with terpene precursors geranyl diphosphate and monoterpene formation occurring primarily in plastids, and farnesyl diphosphate and sesquiterpenes being synthesized predominantly in the cytosol.117 Measuring metabolic heterogeneity at the cellular or sub-cellular level thus has the potential to discover unforeseen details masked by averaging populations of cells and contribute to a deeper understanding of the metabolism and functions of NPs. For this reason, single-cell MSI is increasingly appreciated and various single-cell MSI techniques have been developed. Currently, SIMS is the predominant technique for single-cell MSI due to its sub-micron spatial resolution and surface sensitivity. MIBI, a reporter-based method using heavy metal tags coupled with SIMS, has allowed for targeted imaging analysis of proteins at the subcellular level.5,118 The development of optical fiber-based laser ablation electrospray ionization mass spectrometry (f-LAESI-MS),119–121 Nano-DESI,122 and laser ablation inductively coupled plasma mass spectrometry (LA-ICP-MS)123,124 have enabled MSI analysis of single cells under ambient conditions. Recent methodological and technological advances in MALDI imaging have improved its spatial resolution to 1–10 μm, making MALDI imaging at cellular and subcellular possible.125–127 However, sensitivity and speed are two major challenges (the 4S-criteria constraint), which need to be addressed to allow wide-scale application of single-cell MSI. Nevertheless, along with the further methodological and instrumental development, single-cell MSI holds significant promise in deepening our understanding of metabolic heterogeneity across cells.
With spatial resolution already approaching sub-micrometre levels and 3D MSI becoming more commonplace, the number of spectra acquired per experiment has increased exponentially. This data complexity gives rise to memory and computational challenges, namely “the curse of dimensionality”.128 Data analysis challenges are further exacerbated when integrating MSI with other imaging modalities. More powerful MSI-specific algorithms are in high demand for more efficient and effective data mining, visualization, image fusion, and interpretation. The reproducibility of MSI data analysis is another significant issue that needs to be addressed in the near future. The use of open-source software has done a remarkable job addressing this challenge but complete reporting of software versions and parameters is required, which is not yet routine in the current MSI studies.129 Improving sample preparation and workflows will also improve the quality and reproducibility of collected data. Data sharing is another critical aspect in MSI community because it offers opportunities for collaboration and promotes reproducibility. Previously, MSI data were archived in metabolomics and proteomics repositories, such as MetaboLights130 and PRIDE.131 The advent of OpenMSI132 and its extension BASTet133 have provided an important mean to share and reproduce MSI analyses. The construction and popularization of METASPACE has further accelerated to achieve data sharing, effective use, and verification of MSI result.104,105 It has become the largest MSI repository, which contains over 6000 MSI datasets. Users could easily share their MSI datasets and annotation result using a URL from METASPACE. The development of such tool represents an important direction towards establishing repositories for storing, sharing, and comparing MSI results.
6 Conclusions
In this review, we provided an up-to-date summary of MSI, emphasizing different applications and recent innovations in NP research. Even though there are still many challenges and limitations that need to be addressed, current and emerging MSI technologies are providing new insights into the biosynthesis, spatial localization, and biological functions of NPs. With recent advancements in both sample preparation and MSI instrumentation, we are currently able to perform MSI at metabolomics ‘scale’ (spatial metabolomics), and cellular and even subcellular level. MSI, in conjunction with other techniques, can clearly bring the art and practice of NP research to a new and more effective level. We anticipate that in the near future MSI will come to be a robust and routine chemical imaging tool for NP studies leading to significant breakthroughs in this field of research.7 Author contributions
Conceptualization: Y. D. and A. A.; writing – original draft: Y. D.; writing – reviewing and editing: A. A.8 Conflicts of interest
There are no conflicts to declare.9 Acknowledgements
A. A. is the incumbent of the Peter J. Cohn Professorial Chair. The Aharoni lab is supported by the Adelis Foundation, Leona M. and Harry B. Helmsley Charitable Trust, Jeanne and Joseph Nissim Foundation for Life Sciences, Tom and Sondra Rykoff Family Foundation Research, and the Raymond Burton Plant Genome Research Fund. The work was supported by the Israel Ministry of Science and Technology [grant number 3-14297] and the European Research Council (ERC) under the European Union's Horizon 2020 Research and Innovation Program (‘SIREM’ advanced grant agreement No. 884316).10 References
- Ł. Cieśla and R. Moaddel, Nat. Prod. Rep., 2016, 33, 1131–1145 Search PubMed.
- A. G. Atanasov, S. B. Zotchev, V. M. Dirsch and C. T. Supuran, Nat. Rev. Drug Discovery, 2021, 20, 200–216 CrossRef CAS PubMed.
- A. P. Bowman, R. M. A. Heeren and S. R. Ellis, TrAC, Trends Anal. Chem., 2019, 120, 115197 CrossRef.
- B. Spengler, Anal. Chem., 2015, 87, 64–82 CrossRef CAS PubMed.
- M. Angelo, S. C. Bendall, R. Finck, M. B. Hale, C. Hitzman, A. D. Borowsky, R. M. Levenson, J. B. Lowe, S. D. Liu, S. Zhao, Y. Natkunam and G. P. Nolan, Nat. Med., 2014, 20, 436–442 CrossRef CAS PubMed.
- Y. Dong, B. Li, S. Malitsky, I. Rogachev, A. Aharoni, F. Kaftan, A. Svatoš and P. Franceschi, Front. Plant Sci., 2016, 7, 60 Search PubMed.
- B. Li, Y. Zhang, J. Ge, K. Liu and P. Li, Anal. Bioanal. Chem., 2018, 410, 7449–7456 CrossRef CAS PubMed.
- J. E. Spraker, G. T. Luu and L. M. Sanchez, Nat. Prod. Rep., 2020, 37, 150–162 Search PubMed.
- T. Alexandrov, Annu. Rev. Biomed. Data Sci., 2020, 3, 61–87 Search PubMed.
- D. Unsihuay, D. Mesa Sanchez and J. Laskin, Annu. Rev. Phys. Chem., 2021, 72, 307–329 CrossRef CAS PubMed.
- C. J. Perez, A. K. Bagga, S. S. Prova, M. Yousefi Taemeh and D. R. Ifa, Rapid Commun. Mass Spectrom., 2019, 33, 27–53 CrossRef CAS PubMed.
- E. S. Rivera, K. V. Djambazova, E. K. Neumann, R. M. Caprioli and J. M. Spraggins, J. Mass Spectrom., 2020, e4614 CrossRef CAS PubMed.
- P.-M. Vaysse, R. M. A. Heeren, T. Porta and B. Balluff, Analyst, 2017, 142, 2690–2712 CAS.
- E. J. Lanni, S. S. Rubakhin and J. V. Sweedler, J. Proteonomics, 2012, 75, 5036–5051 CrossRef CAS PubMed.
- S. Schulz, M. Becker, M. R. Groseclose, S. Schadt and C. Hopf, Curr. Opin. Biotechnol., 2019, 55, 51–59 CrossRef CAS PubMed.
- A. D. Feenstra, M. E. Dueñas and Y. J. Lee, J. Am. Soc. Mass Spectrom., 2017, 28, 434–442 CrossRef CAS PubMed.
- J. M. Spraggins and R. M. Caprioli, J. Am. Soc. Mass Spectrom., 2011, 22, 1022–1031 CrossRef CAS PubMed.
- M. A. Müller, M. Kompauer, K. Strupat, S. Heiles and B. Spengler, J. Am. Soc. Mass Spectrom., 2021, 32, 465–472 CrossRef.
- G. A. Prosser, G. Larrouy-Maumus and L. P. S. Carvalho, EMBO Rep., 2014, 15, 657–669 CrossRef CAS PubMed.
- S. Hen-Avivi, O. Savin, R. C. Racovita, W.-S. Lee, N. M. Adamski, S. Malitsky, E. Almekias-Siegl, M. Levy, S. Vautrin, H. Bergès, G. Friedlander, E. Kartvelishvily, G. Ben-Zvi, N. Alkan, C. Uauy, K. Kanyuka, R. Jetter, A. Distelfeld and A. Aharoni, Plant Cell, 2016, 28, 1440–1460 CrossRef CAS PubMed.
- G. Polturak, N. Grossman, D. Vela-Corcia, Y. Dong, A. Nudel, M. Pliner, M. Levy, I. Rogachev and A. Aharoni, Proc. Natl. Acad. Sci. USA, 2017, 114, 9062–9067 CrossRef CAS PubMed.
- Y. Dong, P. Sonawane, H. Cohen, G. Polturak, L. Feldberg, S. H. Avivi, I. Rogachev and A. Aharoni, New Phytol., 2020, nph.16809 Search PubMed.
- Y. Kazachkova, I. Zemach, S. Panda, S. Bocobza, A. Vainer, I. Rogachev, Y. Dong, S. Ben-Dor, D. Veres, C. Kanstrup, S. K. Lambertz, C. Crocoll, Y. Hu, E. Shani, S. Michaeli, H. H. Nour-Eldin, D. Zamir and A. Aharoni, Nat. Plants, 2021, 7, 468–480 CrossRef CAS PubMed.
- P. D. Cárdenas, P. D. Sonawane, U. Heinig, A. Jozwiak, S. Panda, B. Abebie, Y. Kazachkova, M. Pliner, T. Unger, D. Wolf, I. Ofner, E. Vilaprinyo, S. Meir, O. Davydov, A. Gal-on, S. Burdman, A. Giri, D. Zamir, T. Scherf, J. Szymanski, I. Rogachev and A. Aharoni, Nat. Commun., 2019, 10, 5169 CrossRef PubMed.
- J. Szymański, S. Bocobza, S. Panda, P. Sonawane, P. D. Cárdenas, J. Lashbrooke, A. Kamble, N. Shahaf, S. Meir, A. Bovy, J. Beekwilder, Y. Tikunov, I. Romero de la Fuente, D. Zamir, I. Rogachev and A. Aharoni, Nat. Genet., 2020, 52, 1111–1121 CrossRef PubMed.
- S. J. Burkhow, N. M. Stephens, Y. Mei, M. E. Dueñas, D. J. Freppon, G. Ding, S. C. Smith, Y.-J. Lee, B. J. Nikolau, S. A. Whitham and E. A. Smith, Plant Methods, 2018, 14, 37 CrossRef PubMed.
- L. E. Alexander, J. S. Gilbertson, B. Xie, Z. Song and B. J. Nikolau, Plant Direct, 2021, 4, e00322 Search PubMed.
- A. M. Heskes, T. C. M. Sundram, B. A. Boughton, N. B. Jensen, N. L. Hansen, C. Crocoll, F. Cozzi, S. Rasmussen, B. Hamberger, B. Hamberger, D. Staerk, B. L. Møller and I. Pateraki, Plant J., 2018, 93, 943–958 CrossRef CAS PubMed.
- D. Sturtevant, S. Lu, Z.-W. Zhou, Y. Shen, S. Wang, J.-M. Song, J. Zhong, D. J. Burks, Z.-Q. Yang, Q.-Y. Yang, A. E. Cannon, C. Herrfurth, I. Feussner, L. Borisjuk, E. Munz, G. F. Verbeck, X. Wang, R. K. Azad, B. Singleton, J. M. Dyer, L.-L. Chen, K. D. Chapman and L. Guo, Sci. Adv., 2020, 6, eaay3240 CrossRef CAS PubMed.
- P. Brandt, M. García-Altares, M. Nett, C. Hertweck and D. Hoffmeister, Angew. Chem., Int. Ed., 2017, 56, 5937–5941 CrossRef CAS PubMed.
- C. Li, R. Zhang, J. Wang, L. M. Wilson and Y. Yan, Trends Biotechnol., 2020, 38, 729–744 CrossRef CAS PubMed.
- T. de Rond, M. Danielewicz and T. Northen, Curr. Opin. Biotechnol., 2015, 31, 1–9 CrossRef CAS PubMed.
- W. Tang, A. Gordon, H. Wang, P. Li, J. Chen and B. Li, Talanta, 2021, 226, 122129 CrossRef CAS PubMed.
- J. Grant, S. H. Goudarzi and M. Mrksich, Anal. Chem., 2018, 90, 13096–13103 CrossRef CAS PubMed.
- B. R. Hamilton, D. L. Marshall, N. R. Casewell, R. A. Harrison, S. J. Blanksby and E. A. B. Undheim, Angew. Chem., 2020, 132, 3883–3886 CrossRef.
- E. Bivehed, R. Strömvall, J. Bergquist, G. Bakalkin and M. Andersson, Peptides, 2017, 87, 20–27 CrossRef CAS PubMed.
- K. Erich, K. Reinle, T. Müller, B. Munteanu, D. A. Sammour, I. Hinsenkamp, T. Gutting, E. Burgermeister, P. Findeisen, M. P. Ebert, J. Krijgsveld and C. Hopf, Mol. Cell. Proteomics, 2019, 18, 151–161 CrossRef CAS PubMed.
- E. Takeo, E. Fukusaki and S. Shimma, Anal. Chem., 2020, 92, 12379–12386 CrossRef CAS PubMed.
- O. Klein, A. Haeckel, U. Reimer, G. Nebrich and E. Schellenberger, Sci. Rep., 2020, 10, 15522 CrossRef CAS PubMed.
- D. P. Demarque, R. G. Dusi, F. D. M. de Sousa, S. M. Grossi, M. R. S. Silvério, N. P. Lopes and L. S. Espindola, Sci. Rep., 2020, 10, 1051 CrossRef CAS PubMed.
- B. Dose, T. Thongkongkaew, D. Zopf, H. J. Kim, E. V. Bratovanov, M. García-Altares, K. Scherlach, J. Kumpfmüller, C. Ross, R. Hermenau, S. Niehs, A. Silge, J. Hniopek, M. Schmitt, J. Popp and C. Hertweck, ChemBioChem, 2021, 22, 2901–2907 CrossRef CAS PubMed.
- P.-Y. Chen, C.-Y. Hsieh, C.-J. Shih, Y.-J. Lin, C.-W. Tsao and Y.-L. Yang, J. Nat. Prod., 2018, 81, 1527–1533 CrossRef CAS PubMed.
- C. A. Schenck and R. L. Last, FEBS J., 2020, 287, 1359–1368 CrossRef CAS PubMed.
- E. Korenblum, Y. Dong, J. Szymanski, S. Panda, A. Jozwiak, H. Massalha, S. Meir, I. Rogachev and A. Aharoni, Proc. Natl. Acad. Sci. USA, 2020, 117, 3874–3883 CrossRef CAS PubMed.
- J. Bai, P. Zhang, G. Bao, J.-G. Gu, L. Han, L.-W. Zhang and Y. Xu, Appl. Microbiol. Biotechnol., 2018, 102, 8493–8500 CrossRef CAS PubMed.
- M. Crüsemann, Mar. Drugs, 2021, 19, 142 CrossRef PubMed.
- K. Scherlach and C. Hertweck, Nat. Commun., 2021, 12, 3864 CrossRef CAS PubMed.
- K. Moon, F. Xu, C. Zhang and M. R. Seyedsayamdost, ACS Chem. Biol., 2019, 14, 767–774 CrossRef CAS PubMed.
- H. A. Tomm, L. Ucciferri and A. C. Ross, J. Ind. Microbiol. Biotechnol., 2019, 46, 1381–1400 CrossRef CAS PubMed.
- F. Xu, Y. Wu, C. Zhang, K. M. Davis, K. Moon, L. B. Bushin and M. R. Seyedsayamdost, Nat. Chem. Biol., 2019, 15, 161–168 CrossRef CAS PubMed.
- M. Mir Mohseni, T. Höver, L. Barra, M. Kaiser, P. C. Dorrestein, J. S. Dickschat and T. F. Schäberle, Angew. Chem., Int. Ed., 2016, 55, 13611–13614 CrossRef CAS PubMed.
- E. J. N. Helfrich, C. M. Vogel, R. Ueoka, M. Schäfer, F. Ryffel, D. B. Müller, S. Probst, M. Kreuzer, J. Piel and J. A. Vorholt, Nat. Microbiol., 2018, 3, 909–919 CrossRef CAS PubMed.
- S. I. Probst, C. Vogel, J. A. Vorholt and J. Piel, Chimia, 2018, 72, 816 CrossRef CAS PubMed.
- D. Parrot, S. Papazian, D. Foil and D. Tasdemir, Planta Med., 2018, 84, 584–593 CrossRef CAS PubMed.
- B. M. Ellis, P. K. Babele, J. C. May, C. H. Johnson, B. F. Pfleger, J. D. Young and J. A. McLean, Proc. Natl. Acad. Sci., 2021, 118, e2109633118 CrossRef CAS PubMed.
- K. D. Bemis, A. Harry, L. S. Eberlin, C. Ferreira, S. M. van de Ven, P. Mallick, M. Stolowitz and O. Vitek, Bioinformatics, 2015, 31, 2418–2420 CrossRef CAS PubMed.
- K. D. Bemis, A. Harry, L. S. Eberlin, C. R. Ferreira, S. M. van de Ven, P. Mallick, M. Stolowitz and O. Vitek, Mol. Cell. Proteomics, 2016, 15, 1761–1772 CrossRef CAS PubMed.
- P. Kulkarni, R. A. Wilschut, K. J. F. Verhoeven, W. H. van der Putten and P. Garbeva, Planta, 2018, 248, 1515–1523 CrossRef CAS PubMed.
- A. Yoshimura, B. C. Covington, É. Gallant, C. Zhang, A. Li and M. R. Seyedsayamdost, ACS Chem. Biol., 2020, 15, 2766–2774 CrossRef CAS PubMed.
- B. Li, J. Ge, W. Liu, D. Hu and P. Li, New Phytol., 2021, 231, 892–902 CrossRef CAS PubMed.
- E. K. Neumann, K. V. Djambazova, R. M. Caprioli and J. M. Spraggins, J. Am. Soc. Mass Spectrom., 2020, 31, 2401–2415 CrossRef CAS PubMed.
- M. Tuck, L. Blanc, R. Touti, N. H. Patterson, S. Van Nuffel, S. Villette, J.-C. Taveau, A. Römpp, A. Brunelle, S. Lecomte and N. Desbenoit, Anal. Chem., 2021, 93, 445–477 CrossRef CAS PubMed.
- B. Geier, E. M. Sogin, D. Michellod, M. Janda, M. Kompauer, B. Spengler, N. Dubilier and M. Liebeke, Nat. Microbiol., 2020, 5, 498–510 CrossRef CAS PubMed.
- G. Schleyer, N. Shahaf, C. Ziv, Y. Dong, R. A. Meoded, E. J. N. Helfrich, D. Schatz, S. Rosenwasser, I. Rogachev, A. Aharoni, J. Piel and A. Vardi, Nat. Microbiol., 2019, 4, 527–538 CrossRef CAS PubMed.
- A. P. Wisman, Y. Tamada, S. Hirohata, K. Gomi, E. Fukusaki and S. Shimma, J. Biosci. Bioeng., 2020, 129, 296–301 CrossRef CAS PubMed.
- A. Zavalin, E. M. Todd, P. D. Rawhouser, J. Yang, J. L. Norris and R. M. Caprioli, J. Mass Spectrom., 2012, 47, 1473–1481 CrossRef PubMed.
- M. Niehaus, J. Soltwisch, M. E. Belov and K. Dreisewerd, Nat. Methods, 2019, 16, 925–931 CrossRef CAS PubMed.
- M. E. Dueñas, L. Carlucci and Y. J. Lee, J. Am. Soc. Mass Spectrom., 2016, 27, 1575–1578 CrossRef PubMed.
- E. C. Spivey, J. C. McMillen, D. J. Ryan, J. M. Spraggins and R. M. Caprioli, J. Mass Spectrom., 2019, 54, 366–370 CrossRef CAS PubMed.
- E. J. Lanni, R. N. Masyuko, C. M. Driscoll, J. T. Aerts, J. D. Shrout, P. W. Bohn and J. V. Sweedler, Anal. Chem., 2014, 86, 9139–9145 CrossRef CAS PubMed.
- L. E. Flint, G. Hamm, J. D. Ready, S. Ling, C. J. Duckett, N. A. Cross, L. M. Cole, D. P. Smith, R. J. A. Goodwin and M. R. Clench, Anal. Chem., 2020, 92, 12538–12547 CrossRef CAS PubMed.
- S. A. Iakab, P. Ràfols, X. Correig-Blanchar and M. García-Altares, Anal. Chem., 2021, 93, 6301–6310 CrossRef CAS PubMed.
- K. Susniak, M. Krysa, D. Kidaj, M. Szymanska-Chargot, I. Komaniecka, K. Zamlynska, A. Choma, J. Wielbo, L. L. Ilag and A. Sroka-Bartnicka, Int. J. Mol. Sci., 2021, 22, 12991 CrossRef CAS PubMed.
- A. Srimany, C. George, H. R. Naik, D. G. Pinto, N. Chandrakumar and T. Pradeep, Phytochemistry, 2016, 125, 35–42 CAS.
- B. Geier, M. Franke, B. Ruthensteiner, M. Á. González Porras, A. Gruhl, L. Wörmer, J. Moosmann, J. U. Hammel, N. Dubilier, N. Leisch and M. Liebeke, in Developments in X-Ray Tomography XII, ed. B. Müller and G. Wang, SPIE, San Diego, United States, 2019, p. 5 Search PubMed.
- B. Geier, J. Oetjen, B. Ruthensteiner, M. Polikarpov, H. R. Gruber-Vodicka and M. Liebeke, Proc. Natl. Acad. Sci. U.S.A., 2021, 118, e2023773118 CAS.
- A. Belianinov, A. V. Ievlev, M. Lorenz, N. Borodinov, B. Doughty, S. V. Kalinin, F. M. Fernández and O. S. Ovchinnikova, ACS Nano, 2018, 12, 11798–11818 CrossRef CAS PubMed.
- K. J. Zemaitis, A. M. Izydorczak, A. C. Thompson and T. D. Wood, Metabolites, 2021, 11, 253 CAS.
- S. A. Iakab, L. Sementé, M. García-Altares, X. Correig and P. Ràfols, BMC Bioinf., 2020, 21, 448 CrossRef CAS PubMed.
- I. Rzagalinski and D. A. Volmer, Biochim. Biophys. Acta, Proteins Proteomics, 2017, 1865, 726–739 CAS.
- A. C. Grey, M. Tang, A. Zahraei, G. Guo and N. J. Demarais, Anal. Bioanal. Chem., 2021, 413, 2637–2653 CAS.
- M. Doppler, C. Bueschl, B. Kluger, A. Koutnik, M. Lemmens, H. Buerstmayr, J. Rechthaler, R. Krska, G. Adam and R. Schuhmacher, Front. Plant Sci., 2019, 10, 1366 Search PubMed.
- L. Feldberg, Y. Dong, U. Heinig, I. Rogachev and A. Aharoni, Anal. Chem., 2018, 90, 10231–10238 CrossRef CAS PubMed.
- Y. Dong, L. Feldberg, I. Rogachev and A. Aharoni, Phytochemistry, 2021, 186, 112740 CAS.
- R. B. Kinnel, E. Esquenazi, T. Leao, N. Moss, E. Mevers, A. R. Pereira, E. A. Monroe, A. Korobeynikov, T. F. Murray, D. Sherman, L. Gerwick, P. C. Dorrestein and W. H. Gerwick, J. Nat. Prod., 2017, 80, 1514–1521 CAS.
- R. Nakabayashi, K. Hashimoto, K. Toyooka and K. Saito, Anal. Chem., 2017, 89, 2698–2703 CrossRef CAS PubMed.
- R. Nakabayashi, T. Mori, N. Takeda, K. Toyooka, H. Sudo, H. Tsugawa and K. Saito, Anal. Chem., 2020, 92, 5670–5675 CrossRef CAS PubMed.
- D. Eckelmann, S. Kusari and M. Spiteller, Anal. Chem., 2018, 90, 13167–13172 CrossRef CAS PubMed.
- F. Blei, S. Dörner, J. Fricke, F. Baldeweg, F. Trottmann, A. Komor, F. Meyer, C. Hertweck and D. Hoffmeister, Chem. -Eur. J., 2020, 26, 729–734 CrossRef CAS PubMed.
- L. K. Honeker, G. A. Hildebrand, J. D. Fudyma, L. E. Daber, D. Hoyt, S. E. Flowers, J. Gil-Loaiza, A. Kübert, I. Bamberger, C. R. Anderton, J. Cliff, S. Leichty, R. AminiTabrizi, J. Kreuzwieser, L. Shi, X. Bai, D. Velickovic, M. A. Dippold, S. N. Ladd, C. Werner, L. K. Meredith and M. M. Tfaily, Environ. Sci. Technol., 2022, acs.est.1c06772 Search PubMed.
- T. B. Romsdahl, S. Kambhampati, S. Koley, U. P. Yadav, A. P. Alonso, D. K. Allen and K. D. Chapman, Metabolites, 2021, 11, 148 CrossRef CAS PubMed.
- M. Nieves-Morión, E. Flores, M. J. Whitehouse, A. Thomen and R. A. Foster, mBio, 2021, 12, e01314-21 CrossRef PubMed.
- H. Laeverenz Schlogelhofer, F. J. Peaudecerf, F. Bunbury, M. J. Whitehouse, R. A. Foster, A. G. Smith and O. A. Croze, PLoS One, 2021, 16, e0251643 CrossRef CAS PubMed.
- R. A. Foster, D. Tienken, S. Littmann, M. J. Whitehouse, M. M. M. Kuypers and A. E. White, ISME J., 2022, 16, 477–487 CrossRef CAS PubMed.
- S. R. Ellis, M. R. L. Paine, G. B. Eijkel, J. K. Pauling, P. Husen, M. W. Jervelund, M. Hermansson, C. S. Ejsing and R. M. A. Heeren, Nat. Methods, 2018, 15, 515–518 CrossRef CAS PubMed.
- M. E. Dueñas, E. A. Larson and Y. J. Lee, Front. Plant Sci., 2019, 10, 860 CrossRef PubMed.
- K. C. O'Neill, M. E. Dueñas, E. Larson, T. T. Forsman and Y.-J. Lee, in Mass Spectrometry Imaging of Small Molecules, ed. Y.-J. Lee, Springer US, New York, NY, 2022, vol. 2437, pp. 197–213 Search PubMed.
- M. R. L. Paine, B. L. J. Poad, G. B. Eijkel, D. L. Marshall, S. J. Blanksby, R. M. A. Heeren and S. R. Ellis, Angew. Chem., Int. Ed., 2018, 57, 10530–10534 CrossRef CAS PubMed.
- N. Verbeeck, R. M. Caprioli and R. Van de Plas, Mass Spectrom. Rev., 2020, 39, 245–291 CrossRef CAS PubMed.
- R. L. Hansen and Y. J. Lee, J. Am. Soc. Mass Spectrom., 2017, 28, 1910–1918 CrossRef CAS PubMed.
- D. S. Wishart, A. Guo, E. Oler, F. Wang, A. Anjum, H. Peters, R. Dizon, Z. Sayeeda, S. Tian, B. L. Lee, M. Berjanskii, R. Mah, M. Yamamoto, J. Jovel, C. Torres-Calzada, M. Hiebert-Giesbrecht, V. W. Lui, D. Varshavi, D. Varshavi, D. Allen, D. Arndt, N. Khetarpal, A. Sivakumaran, K. Harford, S. Sanford, K. Yee, X. Cao, Z. Budinski, J. Liigand, L. Zhang, J. Zheng, R. Mandal, N. Karu, M. Dambrova, H. B. Schiöth, R. Greiner and V. Gautam, Nucleic Acids Res., 2022, 50, D622–D631 CrossRef CAS PubMed.
- M. Sud, E. Fahy, D. Cotter, A. Brown, E. A. Dennis, C. K. Glass, A. H. Merrill, R. C. Murphy, C. R. H. Raetz, D. W. Russell and S. Subramaniam, Nucleic Acids Res., 2007, 35, D527–D532 CrossRef CAS PubMed.
- A. Palmer, P. Phapale, I. Chernyavsky, R. Lavigne, D. Fay, A. Tarasov, V. Kovalev, J. Fuchser, S. Nikolenko, C. Pineau, M. Becker and T. Alexandrov, Nat. Methods, 2017, 14, 57–60 CrossRef CAS PubMed.
- T. Alexandrov, K. Ovchinnikova, A. Palmer, V. Kovalev, A. Tarasov, L. Stuart, R. Nigmetzianov, D. Fay, Key METASPACE contributors, M. Gaudin, C. G. Lopez, M. Vetter, J. Swales, M. Bokhart, M. Kompauer, J. McKenzie, L. Rappez, D. Velickovic, R. Lavigne, G. Zhang, D. Thinagaran, E. Ruhland, M. Sans, S. Triana, D. A. Sammour, S. Aboulmagd, C. Bagger, N. Strittmatter, A. Rigopoulos, E. Gemperline, A. M. Joensen, B. Geier, C. Quiason, E. Weaver, M. Prasad, B. Balluff, K. Nagornov, L. Li, M. Linscheid, C. Hopf, D. Heintz, M. Liebeke, B. Spengler, B. Boughton, C. Janfelt, K. Sharma, C. Pineau, C. Anderton, S. Ellis, M. Becker, J. Pánczél, G. D. Violante, D. Muddiman, R. Goodwin, L. Eberlin, Z. Takats and S. Shahidi-Latham, METASPACE: A community-populated knowledge base of spatial metabolomes in health and disease, Syst. Biol., 2019 Search PubMed.
- D. D. Nguyen, V. Saharuka, V. Kovalev, L. Stuart, M. Del Prete, K. Lubowiecka, R. De Mot, V. Venturi and T. Alexandrov, Metabolites, 2021, 11, 477 CrossRef CAS PubMed.
- F. P. Y. Barré, M. R. L. Paine, B. Flinders, A. J. Trevitt, P. D. Kelly, R. Ait-Belkacem, J. P. Garcia, L. B. Creemers, J. Stauber, R. J. Vreeken, B. Cillero-Pastor, S. R. Ellis and R. M. A. Heeren, Anal. Chem., 2019, 91, 10840–10848 CrossRef PubMed.
- A. V. Pérez-López, J. Simpson, M. R. Clench, A. D. Gomez-Vargas and J. J. Ordaz-Ortiz, Front. Plant Sci., 2021, 11, 608850 CrossRef PubMed.
- L. Zhan, X. Huang, J. Xue, H. Liu, C. Xiong, J. Wang and Z. Nie, Food Chem., 2021, 338, 127984 CrossRef CAS PubMed.
- L. Lamont, G. B. Eijkel, E. A. Jones, B. Flinders, S. R. Ellis, T. Porta Siegel, R. M. A. Heeren and R. J. Vreeken, Anal. Chem., 2018, 90, 13229–13235 CrossRef CAS PubMed.
- C. Harkin, K. W. Smith, F. L. Cruickshank, C. Logan Mackay, B. Flinders, R. M. A. Heeren, T. Moore, S. Brockbank and D. F. Cobice, Mass Spectrom. Rev., 2021, mas.21680 CrossRef PubMed.
- Y. Su, X. Ma, J. Page, R. Shi, Y. Xia and Z. Ouyang, Int. J. Mass Spectrom., 2019, 445, 116206 CrossRef CAS PubMed.
- T.-H. Kuo, H.-H. Chung, H.-Y. Chang, C.-W. Lin, M.-Y. Wang, T.-L. Shen and C.-C. Hsu, Anal. Chem., 2019, 91, 11905–11915 CrossRef CAS PubMed.
- D. R. Klein, C. L. Feider, K. Y. Garza, J. Q. Lin, L. S. Eberlin and J. S. Brodbelt, Anal. Chem., 2018, 90, 10100–10104 CrossRef CAS PubMed.
- B. S. R. Claes, A. P. Bowman, B. L. J. Poad, R. S. E. Young, R. M. A. Heeren, S. J. Blanksby and S. R. Ellis, Anal. Chem., 2021, 93, 9826–9834 CrossRef CAS PubMed.
- J. T. Specker, S. L. Van Orden, M. E. Ridgeway and B. M. Prentice, Anal. Chem., 2020, 92, 13192–13201 CrossRef CAS PubMed.
- M.-E. N. Born and B. M. Prentice, Int. J. Mass Spectrom., 2020, 452, 116338 CrossRef CAS.
- A. Aharoni, M. Jongsma and H. Bouwmeester, Trends Plant Sci., 2005, 10, 594–602 CrossRef CAS PubMed.
- J. Ptacek, D. Locke, R. Finck, M.-E. Cvijic, Z. Li, J. G. Tarolli, M. Aksoy, Y. Sigal, Y. Zhang, M. Newgren and J. Finn, Lab. Invest., 2020, 100, 1111–1123 CrossRef CAS PubMed.
- B. Shrestha, J. M. Patt and A. Vertes, Anal. Chem., 2011, 83, 2947–2955 CrossRef CAS PubMed.
- J. A. Stolee, B. Shrestha, G. Mengistu and A. Vertes, Angew. Chem., Int. Ed., 2012, 51, 10386–10389 CrossRef CAS PubMed.
- S. A. Stopka, R. Khattar, B. J. Agtuca, C. R. Anderton, L. Paša-Tolić, G. Stacey and A. Vertes, Front. Plant Sci., 2018, 9, 1646 CrossRef PubMed.
- H.-M. Bergman and I. Lanekoff, Analyst, 2017, 142, 3639–3647 RSC.
- T. Van Acker, T. Buckle, S. J. M. Van Malderen, D. M. van Willigen, V. van Unen, F. W. B. van Leeuwen and F. Vanhaecke, Anal. Chim. Acta, 2019, 1074, 43–53 CrossRef CAS PubMed.
- Y. Meng, C. Gao, Q. Lu, S. Ma and W. Hang, ACS Nano, 2021, 15, 13220–13229 CrossRef CAS PubMed.
- M. E. Dueñas, A. D. Feenstra, A. R. Korte, P. Hinners and Y. J. Lee, in Maize, ed. L. M. Lagrimini, Springer New York, New York, NY, 2018, vol. 1676, pp. 217–231 Search PubMed.
- R. L. Hansen and Y. J. Lee, Chem. Rec., 2018, 18, 65–77 CrossRef CAS PubMed.
- M. E. Dueñas and Y. J. Lee, in Cancer Metabolomics, ed. S. Hu, Springer International Publishing, Cham, 2021, vol. 1280, pp. 69–82 Search PubMed.
- W. M. Abdelmoula, B. G.-C. Lopez, E. C. Randall, T. Kapur, J. N. Sarkaria, F. M. White, J. N. Agar, W. M. Wells and N. Y. R. Agar, Nat. Commun., 2021, 12, 5544 CrossRef CAS PubMed.
- M. C. Föll, L. Moritz, T. Wollmann, M. N. Stillger, N. Vockert, M. Werner, P. Bronsert, K. Rohr, B. A. Grüning and O. Schilling, GigaScience, 2019, 8, giz143 CrossRef PubMed.
- K. Haug, K. Cochrane, V. C. Nainala, M. Williams, J. Chang, K. V. Jayaseelan and C. O'Donovan, Nucleic Acids Res., 2019, gkz1019 CrossRef PubMed.
- A. Römpp, R. Wang, J. P. Albar, A. Urbani, H. Hermjakob, B. Spengler and J. A. Vizcaíno, Anal. Bioanal. Chem., 2015, 407, 2027–2033 CrossRef PubMed.
- O. Rübel, A. Greiner, S. Cholia, K. Louie, E. W. Bethel, T. R. Northen and B. P. Bowen, Anal. Chem., 2013, 85, 10354–10361 CrossRef PubMed.
- O. Rubel and B. P. Bowen, IEEE Trans. Visual. Comput. Graphics, 2018, 24, 1025–1035 Search PubMed.
| This journal is © The Royal Society of Chemistry 2022 |