DOI:
10.1039/D1NH00496D
(Communication)
Nanoscale Horiz., 2022,
7, 526-532
Scaling Planck's law: a unified approach to the Casimir effect and radiative heat-conductance in nanogaps
Received
20th September 2021
, Accepted 8th February 2022
First published on 10th February 2022
Abstract
Using Planck's law from an innovative point of view brings about the possibility to understand the common origin of the repulsive Casimir thermal pressure and the heat exchange in nanogaps. Based on a scale transformation, a procedure that removes divergences of the energy density, we prove the validity of Planck's law to describe confined thermal radiation properties in nanoscale gaps. This scaling involves a configurational temperature obtained from Wien's displacement law and having an entropic origin. We derive analytical expressions for the Casimir thermal pressure as well as for the heat conductance. Comparison of our results with experimental data shows a remarkable agreement.
New concepts
Here, we introduce the concept of configurational entropy associated with the confinement of thermal radiation in nanogaps. The key idea is that geometric confinements introduce entropy constraints. We demonstrate that the entropy constraints are consistent with a rescaling of Planck's distribution, which removes energy divergences of the confined radiation. Since the energy of the radiation in the gap cannot diverge, it follows by necessity the existence of a Wien's wavelength accounting for the crossover between the classical and quantum regimes under confinement. Thus, the entropic constraints rescale the Wien's wavelength of the confined radiation and redefine the whole range of frequencies and temperatures. This innovative point of view dramatically simplifies the understanding of radiative energy transfer at the nanoscale. It avoids using fluctuation-dissipation theorems and assuming diverse excitation modes to reproduce the fundamental scalings of the repulsive Casimir thermal forces and the radiative heat conductance. Thus, this unified view seems to be a promising alternative to understanding radiative energy transfer phenomena in nanodevices and nanotechnology.
|
Introduction
During the last two decades, several groups have been doing a significant amount of experimental and theoretical work in order to study thermal radiation at the nanoscale. Among others, two central phenomena have been studied, on the one hand, Casimir forces and, on the other hand, radiative heat exchange due to a temperature difference between objects separated a few nanometers from each other.1–8 Some experiments have shown that the Casimir force between two objects may be attractive or repulsive depending on the temperature and dielectric properties of the materials involved. The attractive force is of quantum origin (vanishing temperature), and scales with the gap size as d−4.1 However, the repulsive force depends linearly on the temperature and scales a d−3, see for instance ref. 3 and references therein.
In the second case, improved experimental setups have made it possible to obtain accurate measurements of the heat conductance associated with the above-mentioned radiative transfer.4–7 A significant increase in heat conductivity emerges at very short distances between two objects exchanging energy through radiation. The quantitative convergence of diverse series of experimental results and theoretical calculations, based mainly on Rytov's fluctuating EM theory, was impressive and allowed the development of several nanotechnological applications.9–19
Somehow surprisingly, the vast amount of experimental work done so far has originated the opinion that Planck's law of radiation fails to describe adequately thermal radiation and radiative heat exchange at the nanoscale.2,20–23 The narrowband emission spectrum almost coherent narrowband observed in the sub-wavelength scales seems not compatible with the broadband emission spectrum corresponding to Black-body radiation.
This apparent breakdown of the classical Planck law in high-confinement situations is the subject of the present work. Here, we opt for an alternative view of the physics involved in the Casimir effect and the radiative heat exchange in nanogaps. We exploit a peculiarity of these two phenomena: The appearance of a non-equilibrium radiation spectrum, highly peaked into a short wavelength region due to the extreme confinement.
Before proceeding with this article's primary content, let us get the reader's attention on the well-known physical implications of Planck's formula. According to classical EM theory, the density of energy of the radiation increases following the Raleigh–Jeans law, thus implying that the density of electromagnetic modes increases without a stop for increasing frequencies or decreasing wavelengths. Notice here that fluctuating EM theory approaches to the problem of radiative heat transfer in nanogaps have shown that corrections to the Debye density of states (DOS) of the confined radiation appear and are functions of the gap size and geometry.24
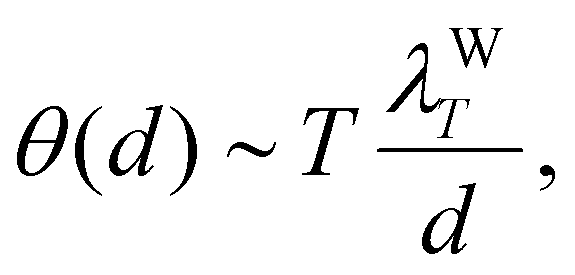
In the unbound case, Planck's law removes the unphysical divergence of the energy density by introducing the hypothesis of light quantization. This removal of the divergence entails the emergence of a threshold length characterizing the crossover between the classical and quantum regimes, that is, Wien's length λWT = CW/T. Of the utmost importance here is the fact that Wien's length depends on the temperature of the emission body. For instance, for a body at T = 300 K, the Wien's length is λWT = 9.66 μm. This result means that the transition between the classical and quantum behavior of light starts at sub-micrometer lengths. At T = 300 K, the Wien's length is two orders of magnitude larger than the actual gap sizes used in experiments. Thus, for confined thermal radiation inside nanoscale gaps, a question arises: does a rescaling of Planck's law remove energy divergences of the confined radiation? In other words: does Wien's length become conveniently rescaled in such a way that Planck's law is still helpful to remove unphysical divergences of the EM energy density inside the gap? Below, we discuss how the appropriate scaling restores Planck's formula. The main idea is that rescaling the formula maintains the corresponding law invariant and therefore, can describe the peculiarities of the confined radiation.
Removing energy divergences: rescaling Planck's law
Let us consider a configuration setup which consists of two flat surfaces maintained at temperature T. These parallel surfaces are separated by a distance d and, unlike the black-body size independent limit, the characteristic size d of the gap between both surfaces introduces a cutoff wavelength, λc ≃ d.
For extreme confinement, the distance d is smaller than Wien's length λWT when the surfaces are at room temperatures. Since the energy density of the confined radiation cannot diverge, the removal of the divergence can be done by rescaling Planck's distribution through the introduction of a gap-size dependent Wien's length λWθ. As a consequence of this scaling, the Wien's displacement law allows us to establish the following relation
| |  | (1) |
where
θ(
d) is the apparent or configurational temperature of the radiation consistent with Wien's length
λWθ. The previous relation implies that a rescaling of length brings about a rescaling of temperature. Assuming, for instance, that
λWθ ∼
d, then the apparent temperature obeys the relation
| |  | (2) |
For
T = 300 K and a gap size of
d = 10 nm the apparent temperature is
θ(
d) = 2.898 × 10
5 K. For
d = 3 nm then
θ(
d) = 9.66 × 10
5 K.
Fig. 1 represents this effect schematically.
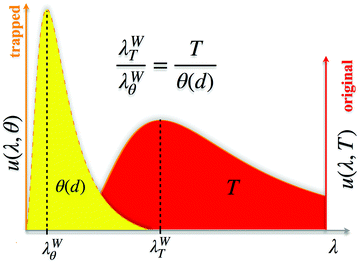 |
| | Fig. 1 The confined resonant electromagnetic energy density u(λ,θ). The trapped energy distribution corresponding to the configurational temperature θ, determined by eqn (2), is compressed into the length d. | |
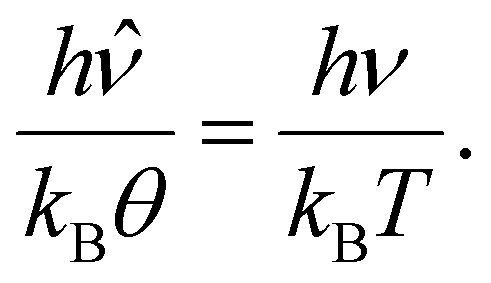
The only way to maintain invariant the Planck's law when the temperature becomes rescaled according to eqn (2) is by consistently redefining the frequencies in agreement with the relation
| |  | (3) |
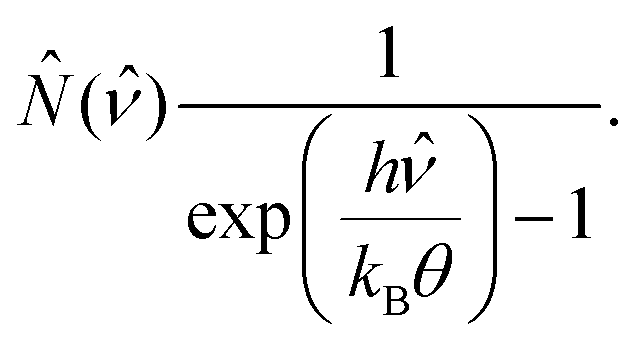
This scale transformation contracts the frequency domain maintaining invariant the Bose–Einstein distribution
| |  | (4) |
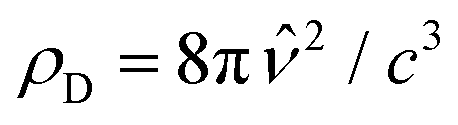
The previous result implies that, in thermal equilibrium, the rescaled energy density of electromagnetic radiation can be written in the form
| |  | (5) |
where

is the Debye density. Accordingly, since
θ → ∞when
d → 0, then

, that is, the distribution given by
eqn (5) tends to a Dirac delta function.
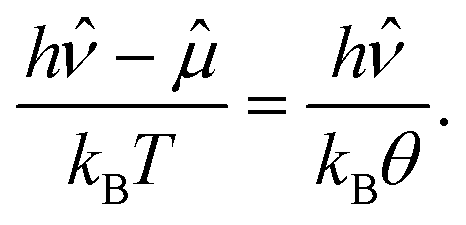
What are the physical implications of the rescaling performed here? The answer to this question is that it allows us to calculate the work necessary to confine the radiation into the gap. This follows from the fact that eqn (5) can be written in terms of the experimental control parameter, that is, the thermodynamic temperature T, by introducing a chemical potential25,26 through the relation
| |  | (6) |
From
eqn (2) and (6) we find that the chemical potential depends on the ratio between the bare and rescaled Wien's lengths or, in other words, on the ratio between the control temperature
T and the apparent temperature
θ:
| | 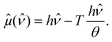 | (7) |
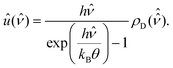
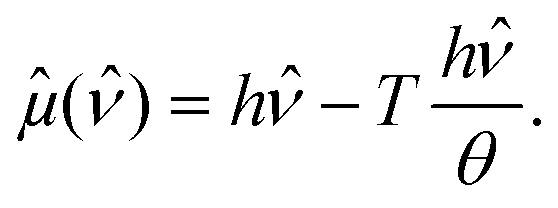
This result shows that light-confinement introduces an entropic correction to the energy of the photons at finite temperatures since the chemical potential can be written as:
μ =
Eph −
TSconf(
d), where
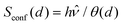
is the configuration entropy. Therefore, we can define an energy correction due to the confinement forces:
| | 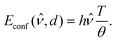 | (8) |
Thus, the response of the system depends linearly on the setup temperature. Similar dependence was previously obtained in ref.
27.
The previous result implies that, at zero temperature, the energy per photon is not modified by the confinement, whereas at finite temperatures, a correction term depending on the gap distance appears.
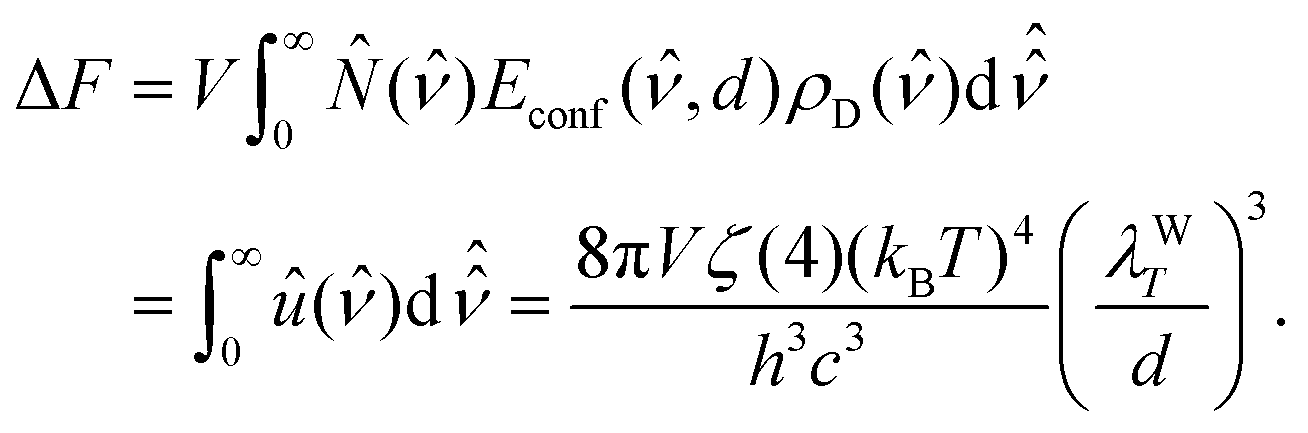
Configurational temperature and the Casimir effect from the free energy of the photon gas
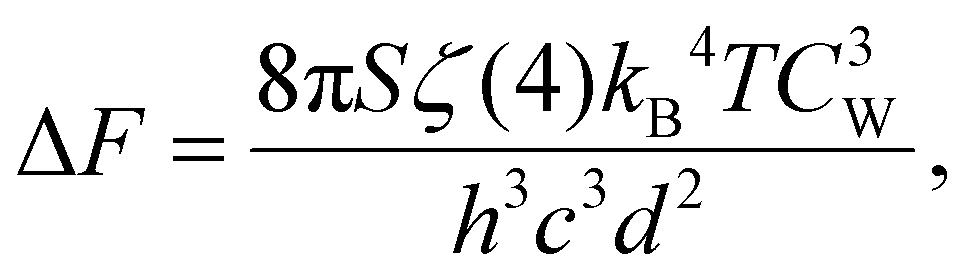
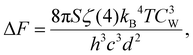
The work ΔF to confine the radiation contained in the gap at temperature T, can be calculated by performing the integral of the configurational energy, eqn (8). This contribution is therefore given by forces having entropic nature, as we discussed in the previous section. Therefore| | 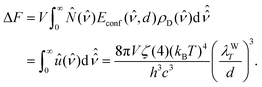 | (9) |
where ζ(4) is the Riemann function.
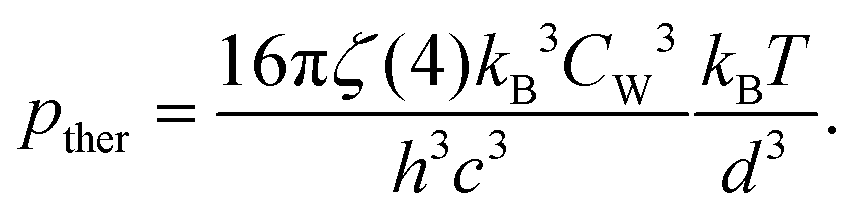
The volume in which the radiation is confined is V ≃ Sd, where S is the area of the surface section. Therefore, we can compute the pressure as p = −(∂F/∂V)T = − (1/S)(∂F/∂d)T, obtaining
| | 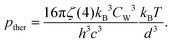 | (10) |
Here, we note that a rescaling of the temperature of the radiation confined in the nanogap is similar to assuming that the plasma frequency of the surfaces scale as the inverse of the gap size
d.
14,28,29
It is worth pointing out that for d → ∞, the rescaled temperature θ → 0 and eqn (3) requires that also  in order to keep a finite value for the ratio hν/kBT and thus,
  attains a flat profile. Hence, in this limit we recover the black-body radiation properties and therefore, we can write
where
F∞ is the black-body free energy. On the other hand, we have already noted that, when
d → 0 then

and, therefore, the free energy given by
eqn (9) does not diverge in the limit
d → 0.
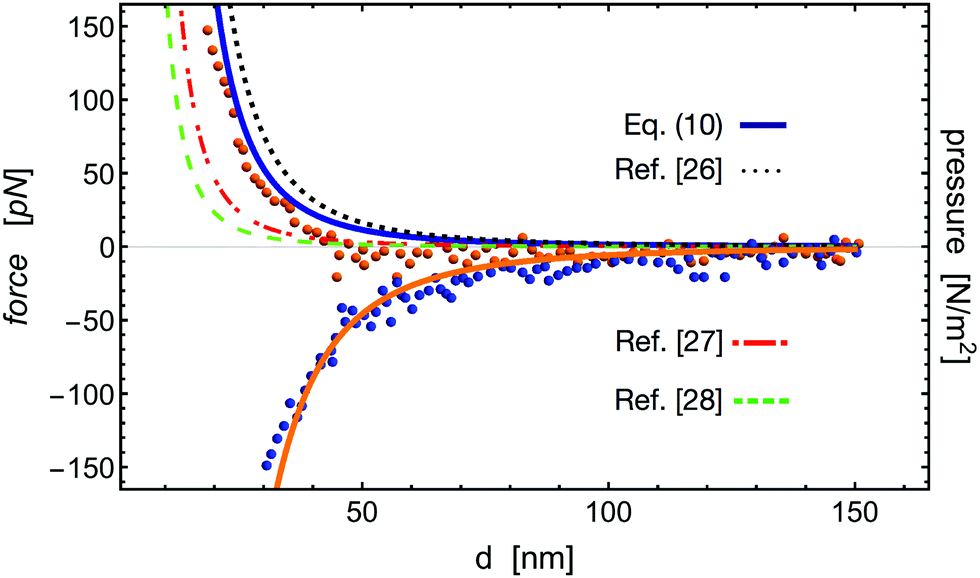
In Fig. 2 we plot the prediction of eqn (10) for the Casimir pressure in conjunction with the experimental results reported in ref. 3 for the Casimir force in terms of the surfaces separation. The orange circles and blue solid-line correspond to the repulsive force with no fitting parameters. The excellent agreement is attributable to the fact that experiments were done in the thermal regime, at a temperature T = 300 K, consistent with the theory and suggests that the effective interaction surface is approximately about 1 nm2. We have also included the prediction of the repulsive Casimir pressure reported by other approaches. The black dotted line corresponds to the prediction reported in ref. 30; the red dash-dotted line corresponds to the prediction of ref. 31, and the green dashed line corresponds to ref. 32. All expressions have the same scaling with the separation distance but differ in the prefactors. The blue circles and the orange solid-line show the correspondence between the attractive force data and eqn (10) with a prefactor −4.0. The scaling in terms of distance between surfaces is notably similar and the agreement with the experimental data is acceptably good in order to validate the correctness of our theoretical approach.
 |
| | Fig. 2 Attractive and repulsive Casimir forces. Comparison between experiments and theory. The experimental results were digitalized from ref. 3. The comparison between experimental data (orange symbols) and the theoretical repulsive force (blue solid line) at T = 300 K is given by eqn (10) without fitting parameters. The black dotted line corresponds to the prediction from ref. 30, the red dash-dotted line to the prediction from ref. 31, and the green dashed line to the prediction from ref. 32, all of them for the Casimir pressure and without fitting parameters. The attractive force, experimental (blue circles) and theory (orange solid line) is again given by eqn (10) multiplied by −4.0. | |
Heat conductance
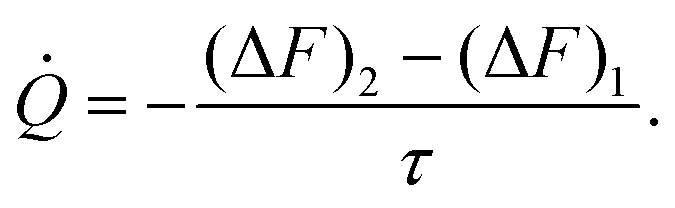
Further verification of the validity of the new approach we have introduced in Section 2 is related to a non-equilibrium effect. In particular, it deals with the heat exchange between two flat plates at different temperatures, T1 and T2 and makes it possible to obtain the correct scaling of the heat conductance.
The heat exchanged by the plates at temperatures T1 < T2, can be calculated by defining the flux of energy between both plates in the form
| | 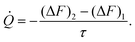 | (12) |
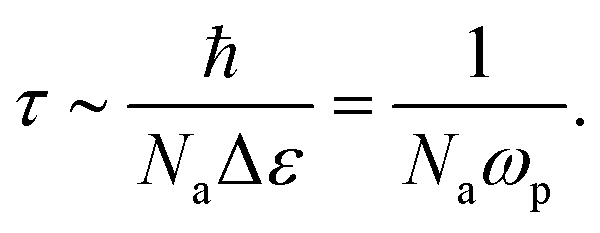
Here and on quantum basis, dimensional analysis suggests that the time scale characterizing the energy exchange takes the form
τ =
ħ/Δ
E, where Δ
E is the total amount of energy radiated. In the black body (thermodynamic) limit Δ
E is proportional to the number of degrees of freedom
n excited in the material with
n ∼
NA and
NA the Avogadro number. In going to the nanoscale level, the rescaling of the Planck distribution conserves the number of degrees of freedom and thus, Δ
E ∼
NaΔ
ε =
Naħωp, with
ωp the plasma frequency. Therefore,
| | 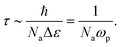 | (13) |
For typical values of the plasma frequency
ωp ∼ 10
15–10
16 Hz the characteristic time scale for energy exchange should be
τ ∼ 10
−38−10
−39 s.
Now, in terms of the Wien constant, eqn (9) can be written as
| |  | (14) |
which, after a first order expansion of
eqn (14) in the temperature difference Δ
T =
T2−
T1 allows us to rewrite
eqn (12) as follows
| | ![[Q with combining dot above]](https://www.rsc.org/images/entities/i_char_0051_0307.gif) d = −GΔT, d = −GΔT, | (15) |
where
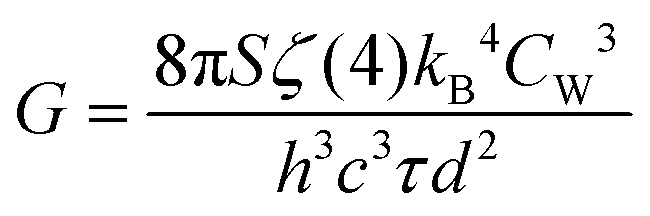
| | 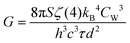 | (16) |
is the heat conductance. This result shows the
d−2 behavior observed in diverse experiments and widely reported.
16,33
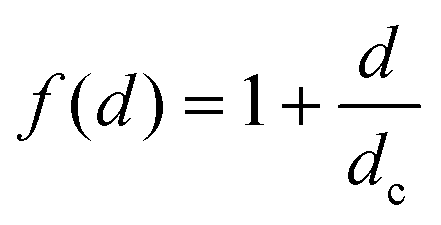
It is worth noticing that the scaling (16) is followed by metal and insulator surfaces. For metals it is valid at arbitrary distances, see Fig. 3a, whereas for insulators it is valid as long as they are separated by no more than a certain crossover distance dc, see Fig. 3b. Experiments evidence that when the insulator surfaces are separated at distances larger than dc then the scaling of the heat conductance becomes proportional to d−1. The physical explanation of this is based on the band theory of insulators,34 according to which insulating materials at very high temperatures behave as conductors. Here, we must emphasize that extremely high temperatures θ are equivalent to very short distances d in our approach, as it is clearly expressed by eqn (2). Therefore, for insulators we must correct the density of frequencies with a form function that depends on the gap separation distance, in the form
| | 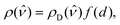 | (17) |
where
| |  | (18) |
is the simpler form function that can be formulated in order to include the crossover distance
dc. Thus
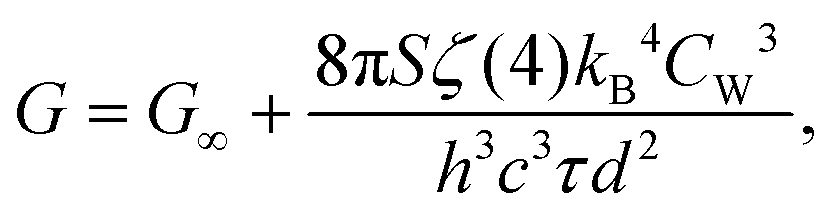
Therefore, for conducting materials we state the following result for the heat conductance
| | 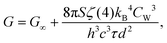 | (20) |
where
G∞ is the blackbody conductance while for insulators
| |  | (21) |
Previous theoretical works based on fluctuational electromagnetism have also provided asymptotic expressions for the scaling of the heat conductance.
35,36
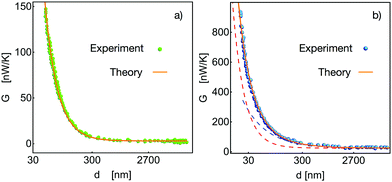 |
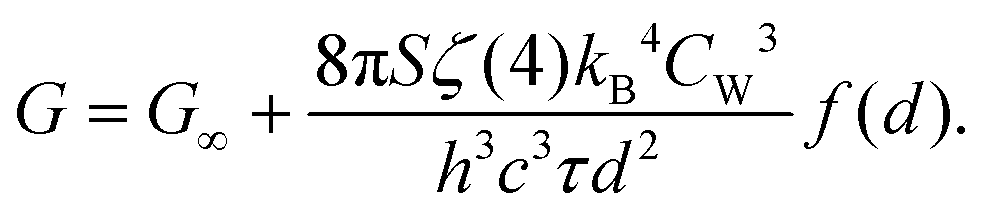
| | Fig. 3 Comparison between experiment (symbols) and theory (solid orange line). (a) Au plates, data taken from ref. 6 and eqn (20) with G∞ = 2.5 nW K−1 and τ = 1.63 × 10−38 s. (b) SiO2 surfaces, data taken from ref. 6 and eqn (21) with G∞ = 25 nW K−1, τ = 2.46 × 10−38 s and dc = 30 nm. | |
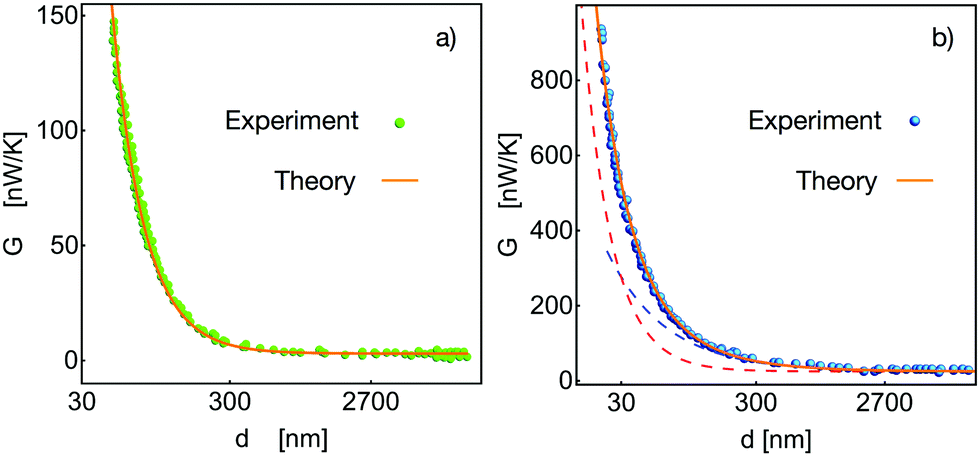
Fig. 3 shows the fit of experimental data (symbols) reported in ref. 6 with formulas (20) and (21) (lines). When the interacting surfaces are metals, Fig. 3a, we obtain that the expected 1/d2 scaling fits remarkably well when the characteristic time takes the value τ = 1.63 × 10−38 s. Through the inclusion of the form function f(d), the previous equation, (21) accounts for the crossover behavior of the heat conductance reported in recent experiments with SiO2 plates.5,6Fig. 3b evidences this crossover behavior from 1/d scaling for large gaps (blue line) to the 1/d2 scaling for very narrow gaps d < 30 nm (red line). The orange line is the interpolation given by eqn (21) using τ = 2.46 × 10−38 s and dc = 30 nm. On the other hand, Fig. 4 shows the comparison of our results with experimental data obtained with different experimental setups; see details in the caption. Likewise, Fig. 4 shows that the scaling behavior of the radiative heat conductance may be altered by the geometry of the experimental setup, this is particularly noticeable in Fig. 4b, where the behavior for metal surfaces is nearer to the scaling corresponding to dielectric plates. This fact indicates that a more precise analysis for complex geometries must include the surface collision cross section.23 This is by no means contrary to our theoretical results since it is well known that the specific characteristics of the quantization is a consequence of the boundary conditions inherent to the particular experimental structure.
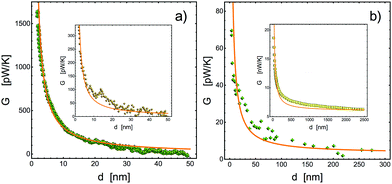 |
| | Fig. 4 Comparison between experiments (symbols) and theory (solid orange line). (a) Si02 surfaces (data taken from ref. 5) with τ = 1.44 × 10−39 s. The inset shows the comparison for SiN surfaces (data taken from ref. 5) with τ = 7.08 × 10−39 s. Both theoretical curves correspond to eqn (21) with G∞ = 0 and dc = 0.75 nm. (b) Au plate and triangular tip (data taken from ref. 5). The parameters used in eqn (20) were G∞ = 2.5 pW K−1, τ = 1.36 × 10−38 s. The inset shows a comparison with data from a silica sphere and a silica plate, taken from ref. 4. The theoretical curve corresponds to eqn (20) with G∞ = 6 nW K−1, τ = 7.08 × 10−39 s and dc = 7 nm. | |
The effect of a non-Debye density of states due to light confinement
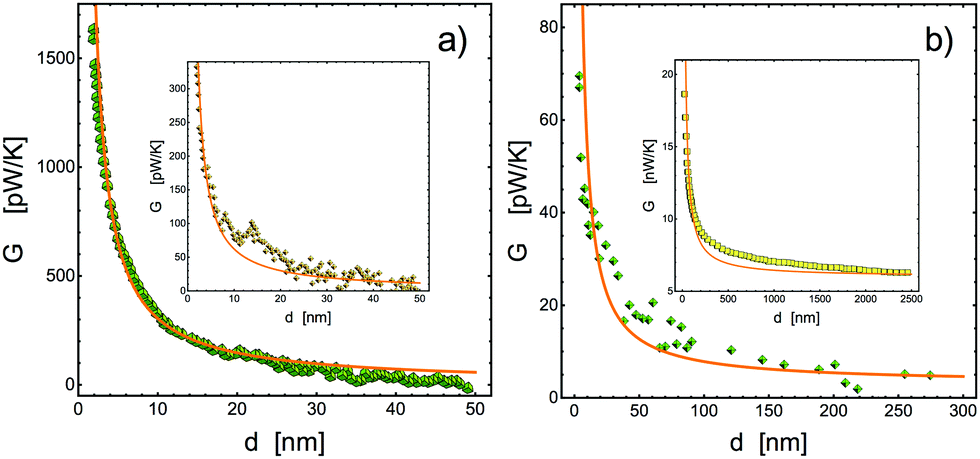
It is now convenient to consider some aspects that arise from other approaches to the original problem, that is, the equilibration of radiation in nanogaps. These approaches consider that light reflections between the surfaces induce corrections over the density of states (DOS) of the electromagnetic radiation since they activate different degrees of freedom that may be associated with, for instance, polaritons and other quasiparticles; see ref. 24 and references therein. These corrections are associated with the confinement of the light in the gap and introduce a dependence of the DOS on the gap size, as expected, see Fig. 5. In particular, when the gap reduces its size, the deviation with respect to the Debye behavior becomes more important in two ways: The increase of low frequency states as well as the appearance of a peak at high frequencies, that is, wavelengths consistent with the gap size.
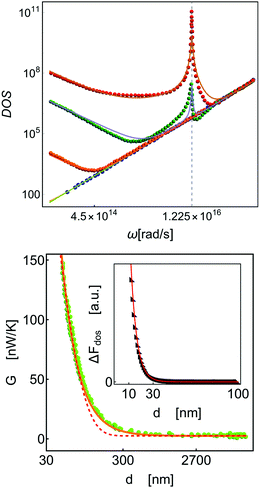 |
| | Fig. 5 DOS. Symbols are the result of numerical calculations using electromagnetic theory, taken from ref. 24. Lines are the fit with the model eqn (22). Fit of the heat conductance using eqn (16) and the exponential scaling trend obtained from the numerical integration of ΔFdos. The inset shows the fit of the numerical integration of eqn (23) (symbols) and a fit using a simple exponential function (red line). | |
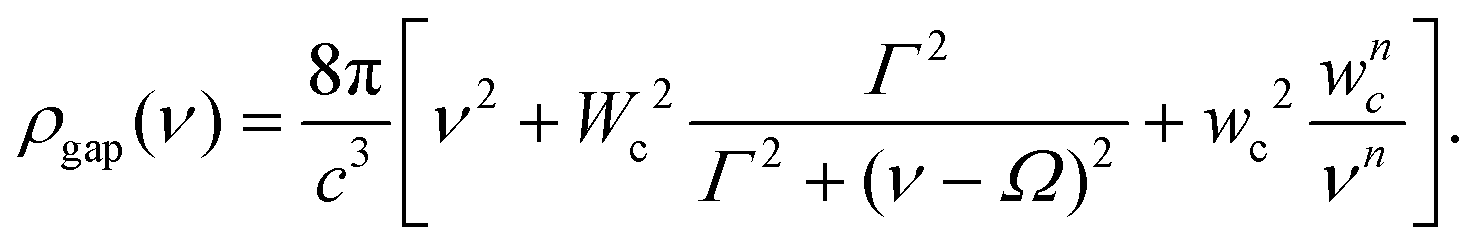
To simplify the discussion, let us take a simple model that qualitatively represents the reported DOS behavior and can be written in the form
| | 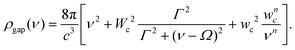 | (22) |
Here, the first term corresponds to the Debye density of states. The first correction is a Lorentzian function that introduces a peak of amplitude
Γ(
d) at a characteristic absorption frequency
Ω and is weighted with the parameter
Wc(
d). The second correction modifies the low frequency behavior (large wavelengths) in terms of a decreasing power law with exponent
n and weight
wc(
d). It is worth stressing here that the dependence of the parameters of the gap size reflects the fact that the confinement introduces corrections to the DOS. We interpret these corrections as non-equilibrium stationary effects (the surfaces separation does not change in time and the temperature is constant) that accordingly modify the DOS. A question arises at this point: What scaling on
d of the work done to confine light may be obtained from
eqn (22)? And consequently: What scaling on
d of the heat conductance may be obtained?
To answer these questions we use formula (22) to fit (lines) one of the DOS reported in ref. 24 (symbols) by giving values to the parameters after passing from 1/s (frequency) to rad s−1 (angular frequency) representation. The proportionality factor for the fit of the Debye DOS (blue line and symbols) was 4 × 10⁻²⁷, which disagrees with the value 2/(πc3) = 2.36 × 10⁻²⁶ by a factor of about 5.9. For d = 100 nm (orange line and symbols), the values of the other parameters were: Γ100 = 0.013 s−1, Wc100 = 7.2 × 10¹³ s−1 and wc100 = 1.98 × 10¹⁴ s−1. For d = 10 nm (green line and symbols), the values of the other parameters were: Γ10 = 5.6 × 10¹³ s−1, and wc10 = 1.08 × 10¹⁵ s−1. For d = 1 nm (red line and symbols), the values of the other parameters were: Γ1 = 8.5 × 10¹³ s−1, Wc1 = 1.9 × 10¹⁷ s−1 and wc1 = 2.79 × 10¹⁵ s−1. In all cases we used Ω = 1.225 × 10¹⁶ and n = 1.6. The previous results indicate that the parameters Γ, Wc and wc of the model are functions of the gap size. These parameters were plotted and their dependence on d was fitted with stretched exponentials: Γ(d) = 2.1 × 10¹⁴e−0.1d3/4, Wc(d) = 5.0 × 10¹⁷e−0.75d3/4 and Wc(d) = 2.5 × 10¹⁵e−0.15d3/4.
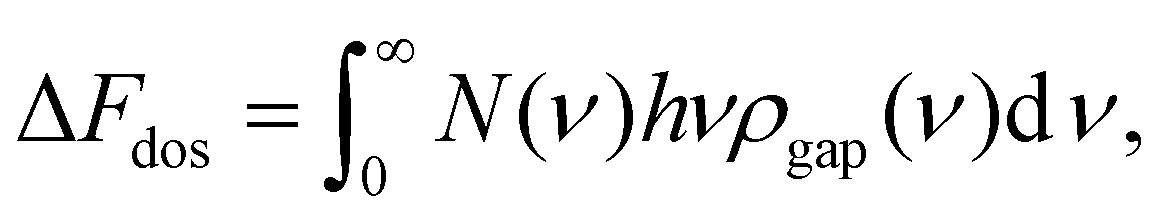
Thus, using eqn (22) to calculate the work necessary to confine the light follows from the well-known expression
| |  | (23) |
where now
N(
ν) is the Bose–Einstein distribution with the bare (non-rescaled) frequency. The numerical evaluation of the integral for different gap sizes is shown in the inset of
Fig. 5 (black triangles), together with a fit (red lines) using an exponential function. The figure also shows the comparison of the heat conductance of
Fig. 3 for metals, with the scaling obtained in
(16) and with the exponential trend shown by Δ
Fdos (red dashed lines). The calculation of the heat conductance shows the correct trend and it may be expected that taking into account all the excited degrees of freedom due to the light confinement should lead to the correct
d−2 scaling. This result is of interest since it shows that, in equilibrium, the radiation distribution should follow a Planck-like distribution that avoids divergences of the radiation contained in the gap irrespective of whether the confining surfaces are metals or insulators.
Conclusions
The problem of radiation pressure and heat exchange in nanocavities has been studied under a unified approach based on a rescaling of Planck's Law that removes unphysical divergences in the energy density distribution when radiation is confined in nanoscale gaps. This procedure involves a rescaling of Wien's length and, consequently, of the temperature yielding an apparent or configurational temperature that depends on the nanocavity size. This introduces a rescaled frequency domain that compresses the Planck distribution into the short wavelength region.
The scaling (3) was interpreted in terms of an entropic force, eqn (8), that allows us to calculate the work done by confining the light. This interpretation offers an original, thermostatistical explanation of the Casimir force at finite temperatures by reproducing the well known scaling of the repulsive forces observed in experiments.3
The unifying view we adopt also explains the behavior of the heat conductance in the nonequilibrium radiative energy exchange between planar surfaces at different temperatures, where the scaling d−2 for metals and d−1 for dielectrics, is consistently reproduced. Our results would also apply for d > λTW as well as for the radiation emitted by anisotropic nanomaterials, a work in progress.
Finally, beyond the fundamental importance of the results of this work, we believe that its simplicity and generality offers a new conceptual tool that could be of high relevance for the future theoretical approaches to the problem of confined radiation as well as for the design of nano, micro, and macro-devices based on this fascinating non-equilibrium phenomenon.
Author contributions
ISH and APM contributed equally to conceptualization, investigation, formal analysis, visualization and writing the original draft, review and editing. ISH contributed with data curation and validation.
Conflicts of interest
There are no conflicts to declare.
Acknowledgements
A. Pérez-Madrid is grateful to Ministerio de Ciencia e Innovación (MCNN), project reference: PGC2018-098373-B-100.
Notes and references
- E. Lifshitz, Sov. Phys., 1956, 2, 73 Search PubMed.
- C. M. Hargreaves, Phys. Lett., 1969, 30(A), 491 CrossRef.
- J. N. Munday, F. Capasso and V. A. Parsegian, Nature, 2009, 457, 170–173 CrossRef CAS PubMed.
- E. Rousseau,
et al.
, Nat. Photonics, 2009, 3, 514 CrossRef CAS.
- K. Kim,
et al.
, Nature, 2015, 528, 387 CrossRef CAS PubMed.
- B. Song,
et al.
, Nat. Nanotechnol., 2016, 11, 509 CrossRef CAS PubMed.
- S. Basu and L. Wang, Appl. Phys. Lett., 2013, 102, 053101 CrossRef.
- A. I. Volokitin and B. N. Persson, Rev. Mod. Phys., 2007, 79, 1291 CrossRef CAS.
- S. Basu, Z. Zhang and C. Fu, Int. J. Energy Res., 2009, 33, 1203 CrossRef CAS.
- A. Kittel,
et al.
, Phys. Rev. Lett., 2005, 95, 224301 CrossRef PubMed.
- Y. Wilde,
et al.
, Nature, 2006, 444, 740 CrossRef PubMed.
- M. H. Tanielian, R. B. Greegor, J. A. Nielsen and C. G. Parazzoli, Appl. Phys. Lett., 2011, 99, 123104 CrossRef.
- C. Guclu, T. S. Luk, G. T. Wang and F. Capolino, Appl. Phys. Lett., 2014, 105, 123101 CrossRef.
- X. Liu and Z. Zhang, ACS Photonics, 2015, 2, 1320 CrossRef CAS.
- I. Latella, A. Perez-Madrid, J. M. Rubi, S. Biehs and P. Ben-Abdallah, Phys. Rev. Appl., 2015, 4, 011001 CrossRef.
- J. Mulet, K. Joulain, R. Carminati and J. Greffet, Microscale Thermophys. Eng., 2002, 6, 209 CrossRef.
- S. Biehs, E. Rouseau and J. Greffet, Phys. Rev. Lett., 2010, 105, 234301 CrossRef PubMed.
- J. Pendry, J. Phys.: Condens. Matter, 1999, 11, 6621 CrossRef CAS.
- C. Park, H. Haus and M. Weinberg, J. Phys. D: Appl. Phys., 2002, 35, 2857 CrossRef CAS.
- C. Lucchesi, R. Vaillon and P.-O. Chapuis, Nanoscale Horiz., 2021, 6, 201–208 RSC.
- J. C. Cuevas, Nat. Commun., 2019, 10, 3342 CrossRef PubMed.
- A. Narayanaswamy, S. Shen, L. Hu, X. Chen and G. Chen, Appl. Phys. A: Mater. Sci. Process., 2009, 96, 357 CrossRef CAS.
-
T. P. Weldon, IEEE Southeastcon 2009, 2009 DOI:10.1109/SECON.2009.5174079, pp. 216–220.
- K. Joulain, R. Carminati, J.-P. Mulet and J.-J. Greffet, Phys. Rev. B: Condens. Matter Mater. Phys., 2003, 68, 245405 CrossRef.
- P. Wurfel, J. Phys. C-Solid State Phys., 1982, 15, 3967 CrossRef.
- H. Ries and A. McEvoy, J. Photochem. Photobiol., A, 1991, 59, 11 CrossRef CAS.
- V. I. Laptev, Russ. J. Phys. Chem., 2008, 84, 158–162 CrossRef.
- D. Polder and M. V. Hove, Phys. Rev. B: Solid State, 1971, 4, 3303 CrossRef.
- D. S. Boyuk, L.-W. Chouand and M. A. Filler, ACS Photonics, 2016, 3, 184 CrossRef CAS.
- O. Bschorr, J. Acoust. Soc. Am., 1999, 106, 3730–3731 CrossRef.
- L. S. Brown and G. J. Maclay, Phys. Rev., 1969, 184, 1272 CrossRef.
- M. Boström and B. E. Sernelius, Phys. Rev. Lett., 2000, 84, 4757 CrossRef PubMed.
- K. Joulain,
et al.
, Surf. Sci. Rep., 2005, 57, 59 CrossRef CAS.
-
C. Kittel, Introduction to Solid State Physics, Wiley, New York, 8th edn, 2005 Search PubMed.
- M. L. E. Rousseau and J. J. Greffet, Appl. Phys., 2012, 111, 014311 Search PubMed.
- P. O. Chapuis, S. Volz, C. Henkel, K. Joulain and J. J. Greffet, Phys. Rev. B: Condens. Matter Mater. Phys., 2008, 77, 035431 CrossRef.
|
| This journal is © The Royal Society of Chemistry 2022 |
Click here to see how this site uses Cookies. View our privacy policy here. 
 *a and
Agustín
Pérez-Madrid
*a and
Agustín
Pérez-Madrid


 is the Debye density. Accordingly, since θ → ∞when d → 0, then
 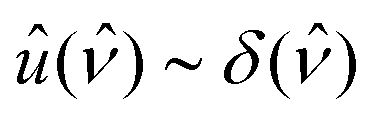 , that is, the distribution given by eqn (5) tends to a Dirac delta function.
 is the configuration entropy. Therefore, we can define an energy correction due to the confinement forces:
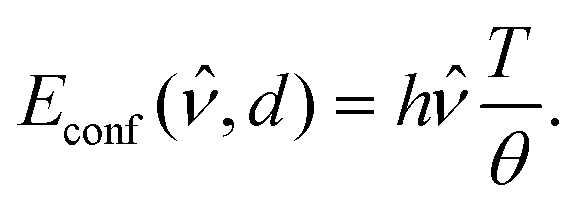
 in order to keep a finite value for the ratio hν/kBT and thus,
  attains a flat profile. Hence, in this limit we recover the black-body radiation properties and therefore, we can write
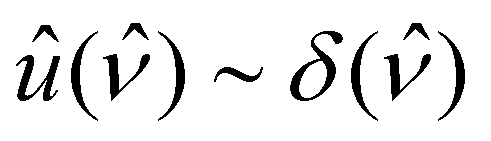 and, therefore, the free energy given by eqn (9) does not diverge in the limit d → 0.