
 Open Access Article
 This Open Access Article is licensed under a Creative Commons Attribution-Non Commercial 3.0 Unported Licence
An inorganic–organic hybrid nanomaterial with a core–shell structure constructed by using Mn–BTC and Ag5[BW12O40] for supercapacitors and photocatalytic dye degradation†
Caihong
Shi
a,
Ning
Kang
a,
Chunmei
Wang
a,
Kai
Yu
 *ab,
Jinghua
Lv
a,
Chunxiao
Wang
a and
Baibin
Zhou
*ab
*ab,
Jinghua
Lv
a,
Chunxiao
Wang
a and
Baibin
Zhou
*ab
aKey Laboratory for Photonic and Electronic Bandgap Materials, Ministry of Education, Harbin Normal University, Harbin, Heilongjiang 150025, China. E-mail: hlyukai188@163.com; zhou_bai_bin@163.com
bKey Laboratory of Synthesis of Functional Materials and Green Catalysis, Colleges of Heilongjiang Province, Harbin Normal University, Harbin, Heilongjiang 150025, China
First published on 1st September 2022
Abstract
Creating inorganic–organic hybrids with polyoxometalates (POMs) and metal–organic frameworks (MOFs) as energy storage and dye-degradation materials remains challenging. Here, a new hybrid nanomaterial Mn–BTC@Ag5[BW12O40] is synthesized by using Ag5[BW12O40] and Mn3(BTC)2(H2O)6 (Mn–BTC, BTC = 1,3,5-benzenetricarboxylic acid) through a plain grinding method. The structure and morphology characterization by scanning electron microscopy (SEM), powder X-ray diffraction (XRD), and transmission electron microscopy (TEM) shows that the synthetic products have core–shell construction. Due to its unique structure wherein the core is Mn–BTC and the shell is Ag5[BW12O40], it exhibits excellent capacitance performance. In a three-electrode system where nickel foam is a collector, at a current density of 1 A g−1, its specific capacitance is 198.09 F g−1; after 5000 cycles, the capacitance retention rate is 94.4%. When the power density is 503.1 W kg−1, the symmetrical supercapacitor reveals a high energy density which is 10.9 W h kg−1. At the same time, the capacitance retention is 92.9% after 5000 cycles which showed good cycle stability. The photocatalytic degradation efficiencies of rhodamine B (RhB), methyl orange (MO) and methylene blue (MB) dyes exceed 90% after 140 min, and the degradation results remained unchanged after five photocatalytic cycles. The photocatalytic degradation mechanism shows that ˙OH has a major effect. The results show that this research provides a fresh idea for the development of energy storage and dye photocatalytic degradation materials.
1. Introduction
With the development of science and technology, the shortage of energy and environmental pollution have become a severe problem for mankind.1 Therefore, the development and utilization of renewable clean energy and the design of efficient energy storage equipment need to be researched.2–4 As a kind of energy storage device with high specific capacitance and long cycle lifetime, supercapacitors have attracted extensive attention from scholars.5–8 The design and synthesis of high-performance electrode materials are key factors in the development of supercapacitors. However, traditional materials invariably have certain shortcomings, for example, a poor environmental protection effect and low price–performance ratio.9 Therefore, the exploitation of new electrode materials with high capacitance performance and environmental protection plays an important role in the development of supercapacitors.Polyoxometalates (POMs) are discrete, polynucleated metal–oxygen cluster compounds formed by transition metals in a high oxidation state, with a variety of structures and size and good electron transport capacity.10–16 Because of their acidity, invertible redox activity, thermal stability, high charge density and electron storage capacity, POMs have broad prospects in the application of supercapacitors.17–20 The Keggin type is the most widely studied type of POMs.21–24 Due to its excellent structural stability and easy modification, Keggin-type POMs can play different roles in the design and synthesis of peculiar structural compounds. Compared with other POMs, [BW12O40]5−({BW12}) has a high surface charge density and is more likely to have a mutual effect with transition metals, which is conducive to the formation of more complexes. Therefore, the synthesis and properties of inorganic–organic hybrids based on {BW12} have a good prospect. In recent years, scientists have used d-zone transition metals to synthesize many catalysts with excellent performance, among which Co, Ni, Cu and Mn have attracted extensive attention.25–31 According to reports in the literature,32–35 {BW12} hybrids are mostly synthesized by the hydrothermal method and are diffusely accustomed in electrocatalysis, photocatalysis and other fields. However, the electrode materials used as supercapacitors are less frequently reported.36,37 At the same time, the reaction conditions of the hydrothermal method are difficult to control, with low yield and poor reproducibility, which hinders its large-scale application. Therefore, it is still challenging to explore a more convenient method for the preparation of high capacitive POMs. To resolve this question, we designed POMs fixed on metal–organic frameworks (MOFs) by a solution or grinding method38–44 and prepared a POM-based hybrid that showed good stability in the water environment while maintaining its excellent electrochemical behavior. Because the grinding method is a fast and effective synthesis strategy, it has the advantages of simple operation, high yield and controllable reaction conditions.45–49 By introducing MOFs into a Keggin-type system to obtain polyoxometalate-based metal–organic frameworks (POMOFs) with a novel structure and excellent performance, the performance of such compounds can be improved.50,51
Based on the above study, we applied Keggin type [BW12O40]5−, Mn2+ and a H3BTC ligand to prepare the Mn–BTC@Ag5[BW12O40] nanomaterial by the grinding method. At the same time, Ag5[BW12O40], Mn–BTC, and Mn–BTC@Ag5[BW12O40] were used as the electrode materials of supercapacitors, and their electrochemical properties were studied. In addition, with Mn–BTC@Ag5[BW12O40] as a catalyst, the photocatalytic degradation of rhodamine B (RhB), methyl orange (MO) and methylene blue (MB) dyes was investigated.
2. Experimental section
2.1. Synthesis of Mn–BTC
H3BTC (0.1400 g, 0.6667 mmol) and Mn(NO3)2·6H2O (0.2400 g, 0.8361 mmol) were ground in an agate mortar for 2 h, gradually becoming a light pink color, and then scoured with ethanol and distilled water. The pale pink powder sample of Mn–BTC was procured after drying for 1 day at 60 °C.2.2. Synthesis of Mn–BTC@Ag5[BW12O40]
Mn–BTC (0.2651 g, 1 mmol) and Ag5[BW12O40] (1.6981 g, 0.5 mmol, its synthesis is provided in the ESI†) were ground in an agate mortar for 2 h, and the pale grey powdery sample Mn–BTC@Ag5[BW12O40] was procured and then scoured with ethanol and distilled water. In the end, the sample was dried for 1 day at 60 °C. The synthesis strategy of Mn–BTC@Ag5[BW12O40] is shown in Scheme 1.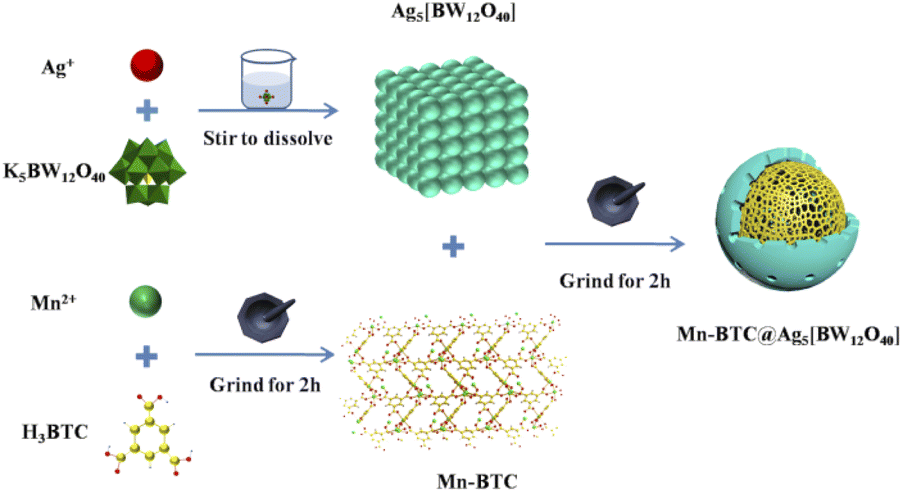 | ||
| Scheme 1 The synthesis strategy of the Mn–BTC@Ag5[BW12O40] nanomaterial. | ||
3. Results and discussion
3.1. Characterization
As can be seen from Fig. 1a, the IR spectra of Mn–BTC@Ag5[BW12O40], Ag5[BW12O40], and Mn–BTC show that the peak at 3430–3500 cm−1 is deemed as the typical vibration of water molecules. And characteristic bands of Ag5[BW12O40] appearing at 958.6, 917.1, 833.6, and 756.1 cm−1 correspond to the stretching vibrations of ν(W–Od), ν(B–Oa), ν(W–Ob–W), and ν(W–Oc–W) of [BW12O40]5−.52,53 The peak is slightly shifted compared with those reported in the literature,54 which is due to the interaction between [BW12O40]5− and Ag+, indicating the successful synthesis of Ag5[BW12O40]. The 1720.4, 1610.5, 1454.2, 1404.1 and 1278.7 cm−1 characteristic peaks of Mn–BTC belong to the characteristic bands of C![[double bond, length as m-dash]](https://www.rsc.org/images/entities/char_e001.gif) O, the benzene ring and C–O of BTC3−.55 However, the band was slightly shifted when compared to that of the free H3BTC ligand.55 This indicates that H3BTC and Mn2+ coordinate to form Mn–BTC, similar to that in the literature.56 In the IR spectrum of Mn–BTC@Ag5[BW12O40], 956.6, 917.1, 833.6, and 756.1 cm−1 are characteristic peaks of the [BW12O40]5− cluster and show that Ag5[BW12O40] maintained its original Keggin structure in Mn–BTC@Ag5[BW12O40]. The vibrations at 1404.1 and 1720.5 cm−1 correspond to the carboxyl vibration band of the BTC3− ligand, and the vibrations at 1610.5, 1454.2, and 1278.7 cm−1 correspond to the typical peaks of the benzene ring of the BTC ligand, indicating the successful synthesis of the nanomaterial. Relative to Ag5[BW12O40], the IR spectrum of Mn–BTC@Ag5[BW12O40] shows a mild variation, where the W–Od spectrum moves 2 cm−1, possibly because of the synergistic effect between Ag5[BW12O40] with Mn–BTC, which proves the successful synthesis of Mn–BTC@Ag5[BW12O40].
O, the benzene ring and C–O of BTC3−.55 However, the band was slightly shifted when compared to that of the free H3BTC ligand.55 This indicates that H3BTC and Mn2+ coordinate to form Mn–BTC, similar to that in the literature.56 In the IR spectrum of Mn–BTC@Ag5[BW12O40], 956.6, 917.1, 833.6, and 756.1 cm−1 are characteristic peaks of the [BW12O40]5− cluster and show that Ag5[BW12O40] maintained its original Keggin structure in Mn–BTC@Ag5[BW12O40]. The vibrations at 1404.1 and 1720.5 cm−1 correspond to the carboxyl vibration band of the BTC3− ligand, and the vibrations at 1610.5, 1454.2, and 1278.7 cm−1 correspond to the typical peaks of the benzene ring of the BTC ligand, indicating the successful synthesis of the nanomaterial. Relative to Ag5[BW12O40], the IR spectrum of Mn–BTC@Ag5[BW12O40] shows a mild variation, where the W–Od spectrum moves 2 cm−1, possibly because of the synergistic effect between Ag5[BW12O40] with Mn–BTC, which proves the successful synthesis of Mn–BTC@Ag5[BW12O40].
 | ||
| Fig. 1 (a) IR spectra and (b) XRD spectra. | ||
Fig. 1b shows the XRD patterns of Ag5[BW12O40], Mn–BTC, and Mn–BTC@Ag5[BW12O40]. The diffraction peaks of the synthesized Ag5[BW12O40]40 and Mn3(BTC)2(H2O)6 (Mn–BTC)41 are consistent with the previously reported results, indicating that Ag5[BW12O40] and Mn–BTC are synthesized. As can be seen from the figure, the crystallinity of Mn–BTC@Ag5[BW12O40] is not high enough, but the main diffraction is the same as that for Ag5[BW12O40] and Mn–BTC. This indicates that Ag5[BW12O40] and Mn–BTC are still retained in the new nanomaterial. In the meantime, the relative intensity of the diffraction peak of Mn–BTC@Ag5[BW12O40] is more consistent with that of Ag5[BW12O40], so this can prove that the compound is a core–shell structure of Mn–BTC encapsulated in Ag5[BW12O40]. Besides, the synthesized Mn–BTC@Ag5[BW12O40] has four new diffraction peaks with angles (2θ) of 36.16°, 53.36°, 60.38°, and 71.66° (see Fig. 1b ♥ identification), which can be attributed to the coordination effect between Ag5[BW12O40] ions with Mn–BTC, proving the synthesis of the target complex.
Fig. S1† shows the thermogravimetric (TG) curve of Mn–BTC@Ag5[BW12O40]. As can be seen from the figure, Mn–BTC@Ag5[BW12O40] involves two-step weightlessness steps. The first weight loss of 1.81% at 100 °C indicates that the compound has lost water molecules on its surface. The decomposition of the compound in the range of 260–550 °C is the second weightlessness process, and the weightlessness rate is 17.94%. The final calcination results in tungsten carbide, silver and manganese oxide, are consistent with the literature.40,41 The actual weight loss obtained through TG is consistent with the calculated theoretical weight loss, and the resulting substance is the target compound.
From Fig. 2, the morphology of Mn–BTC@Ag5[BW12O40] was further characterized though SEM, and the elemental composition and content were also tested by EDS and EDX. Among them, the structure of Mn-MOF has the morphology of long nanorods,56 Ag5[BW12O40] is a cube40 and the morphology of Mn–BTC@Ag5[BW12O40] is a long and thin rod, so it can be inferred that the compound is a core–shell structure in which Ag5[BW12O40] is attached to the surface of Mn–BTC, with Mn–BTC as the core and Ag5[BW12O40] as the shell (see Fig. 2a), and the core–shell structure is more likely to afford favourable attachment points for making the reaction more likely to proceed smoothly. The EDS (Fig. 2b) and EDX (Fig. S2a–g†) tests of Mn–BTC@Ag5[BW12O40] showed the presence and uniform distribution of the elements B, W, C, O, Ag and Mn.
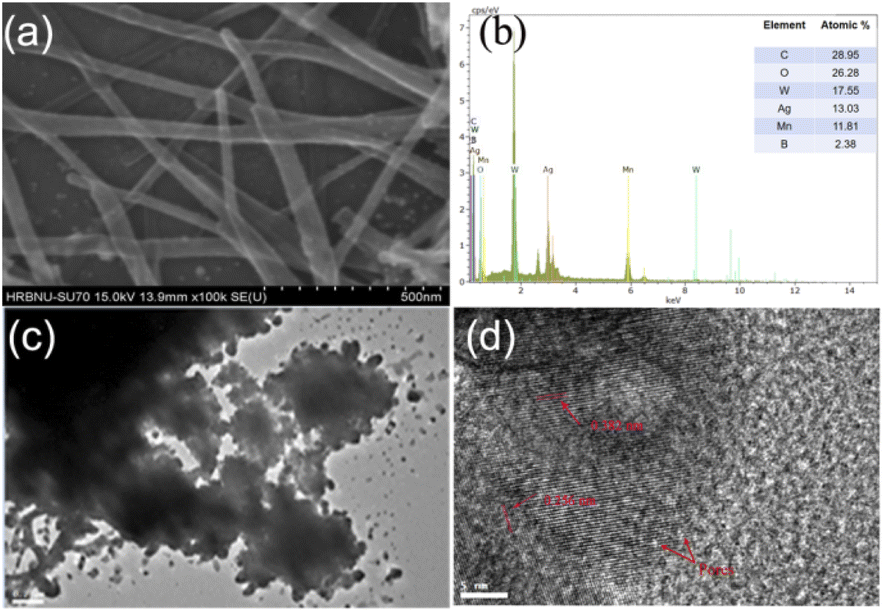 | ||
| Fig. 2 (a) SEM image, (b) EDS, (c) TEM image and (d) HRTEM image of Mn–BTC@Ag5[BW12O40]. | ||
Fig. 2c shows the TEM image of Mn–BTC@Ag5[BW12O40], which further shows the morphology of the core–shell structure. HRTEM was used to further illustrate the relationship between Mn–BTC and Ag5[BW12O40], as shown in Fig. 2d. As can be seen from the figure which shows the Mn–BTC@Ag5[BW12O40] nanomaterial, the crystal plane fringe spacings of Mn–BTC and Ag5[BW12O40] are 0.382 nm and 0.256 nm, respectively. In addition, there are lots of micropores with diameters of about 1–3 nm in the Mn–BTC@Ag5[BW12O40] composite (marked by red arrows in Fig. 2d). The observations prove that Ag5[BW12O40] can be covered on the Mn–BTC face, which is in accord with SEM observations.
Fig. S3† shows the N2 absorption isotherm of Mn–BTC@Ag5[BW12O40], and it shows a typical IV-type isotherm for a mesoporous structure. A mesoporous hysteresis loop was observed in the adsorption curve due to the pore structure between the particles. The BET surface area and average desorption pore sizes are 12.54 m2 g−1 and 8.72 nm for Mn–BTC@Ag5[BW12O40], greater than those of Mn–BTC (8.86 m2 g−1; 5.86 nm)41 and Ag5[BW12O40] (8.26 m2 g−1; 1.92 nm)40 (measured by the BJH method) (Fig. S4†). The above data indicate that the adhesion of Ag5[BW12O40] to the Mn–BTC surface improves the porosity of Mn–BTC@Ag5[BW12O40].
Furthermore, XPS measurements were performed to analyze the composition and elemental valence states for Mn–BTC@Ag5[BW12O40]. By analyzing the B spectrum (Fig. 3a), the typical peak of B–O is 193.8 eV, and the peak at 192.2 eV is B 1 s, indicating the existence of B3+.57 As can be seen from Fig. 3b, the W 4f energy spectrum has prominent peaks at 35.4 and 33.2 eV, designated to W 4f7/2 and W 4f5/2 of W6+.58–60 It conforms to the typical electronic states of polytungstate. In Fig. 3c, the high-resolution O 1s spectrum has an obvious peak at 529.4 eV, which is due to Ag–O binding energy.61Fig. 3d shows the XPS spectrum of the resolved C 1s with two peaks at 282.6 eV and 286.7 eV, belonging to the C–O, CO groups in the H3BTC ligand.55Fig. 3e shows that Ag 3d has two main peaks of 366.1 and 372.1 eV, designated to Ag 3d5/2 and Ag 3d3/2 of Ag+.62,63 What's more, the XPS survey scan of Mn in Fig. 3f shows that three peaks at 632.6, 640 and 658.9 eV correspond to Mn 2p3/2, Mn–O and Mn 2p1/2, which proves the existence of Mn2+.64 Fig. S5† shows the XPS full spectra of Mn–BTC@Ag5[BW12O40], which proves the coexistence of C, O, B, W, Ag and Mn elements; its content is similar to the molecular formula and is consistent with the EDS (Fig. 2b) results. All the above indicate that Mn–BTC@Ag5[BW12O40] was successfully synthesized.
 | ||
| Fig. 3 XPS spectra of (a) B 1s, (b) W 4f, (c) O 1s, (d) C 1s, (e) Ag 3d and (f) Mn 2p for the nanomaterial. | ||
3.2. Electrochemical performance
The three prepared electrodes of Mn–BTC@Ag5[BW12O40]-NF, Ag5[BW12O40]-NF and Mn–BTC-NF were subjected to three-electrode CV and GCD tests in 1 M Na2SO4. The voltage window and scan rates of CV measurements are respectively from −0.5 V to 0.6 V and from 5 mV s−1 to 100 mV s−1. As can be seen from Fig. 4a, the CV curve at a scanning speed of 50 mV s−1, an oxidation peak and both reduction peaks were observed at Ag5[BW12O40]-NF, which could be ascribed to a redox process for W65 and a reduction peak for Ag+.66 Mn–BTC could not show the redox peak,56 so it can be proved that two oxidation peaks and three reduction peaks of Mn–BTC@Ag5[BW12O40]-NF were caused by Ag5[BW12O40], which further proves that the synthesized compound is the target compound. For Mn–BTC@Ag5[BW12O40]-NF, there are two pairs of invertible redox peaks I–I′ and II–II′ with average peak potentials E1/2 = (Epa + Epc)/2 at +189.9 and +42.3 mV, respectively, corresponding to single-electron procedures at the W of [BW12O40]5 (ref. 65) (reaction (a)) and Mn2+ (ref. 66) (reaction (b)), respectively. This may be because after coordination with Ag5[BW12O40], Mn–BTC exhibited reversible redox peaks, which may have originated from the reversible valence state changes of Mn ions.66 The Mn–BTC@Ag5[BW12O40]-NF electrode also has one reduction peak III′ of potential −234.6 mV, which is considered to be the reduction of Ag+/Ag0 (reaction (c)),67 further evidence of the successful synthesis of Mn–BTC@Ag5[BW12O40]. It is noteworthy that the CV curve area of Mn–BTC@Ag5[BW12O40]-NF in the figure is obviously larger than those of the other two electrodes. The above data show that the Mn–BTC@Ag5[BW12O40]-NF has higher capacitance.| {Mn3(BTC)2(H2O)6}@Ag5[BW12VIO40] + H+ + e− ⇌ {Mn3(BTC)2(H2O)6}@Ag5[HBWVW11VIO40] | (a) |
| {Mn3(BTC)2(H2O)6}@Ag5[BW12O40] + H+ + e− ⇌ {HMnIMn2II(BTC)2(H2O)6}@Ag5[BW12O40] | (b) |
| {Mn3(BTC)2(H2O)6}@Ag5+[BW12O40] + H+ + e− → {Mn3(BTC)2(H2O)6}@AgAg4+H[BW12O40] | (c) |
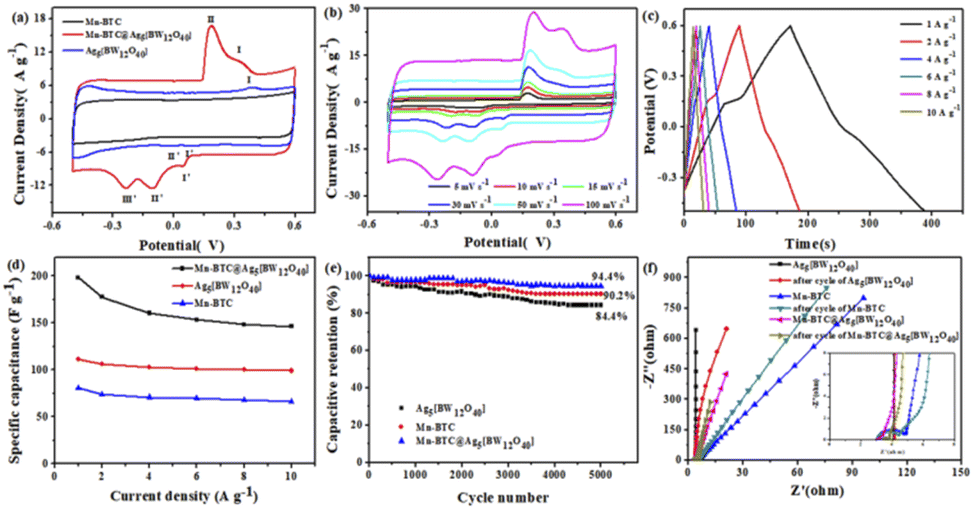 | ||
| Fig. 4 (a) The CVs at 50 mV s−1 scan rate; (b) the CVs at diverse scan rates for Mn–BTC@Ag5[BW12O40]-NF, and (c) GCD curves of different current densities for Mn–BTC@Ag5[BW12O40]-NF; (d) specific capacitance at diverse current densities; (e) 5000 cycles, and (f) EIS before and after 5000 cycles of the three compounds. | ||
As can be seen from Fig. 4b, the CV curves of Mn–BTC@Ag5[BW12O40]-NF at diverse scanning speeds show that all CV curves are similar in shape. With a scanning speed of up to 100 mV s−1, the redox peaks observed were the same, indicating that it has good kinetic reversibility.68 With the enhancement of scanning speed, the oxidation peaks and reduction peaks move to a positive potential and negative potential, respectively, indicating that electrode polarization will occur with the enhancement of the scanning rate. Moreover, the CV curve area augments gradually with the enhancement of scanning speed, indicating that Mn–BTC@Ag5[BW12O40]-NF has a large capacitance. The CV curves of Ag5[BW12O40]-NF and Mn–BTC-NF at diverse scan rates are shown in Fig. S6 and S7.†
As can be seen from Fig. 4c, the GCD curves of Mn–BTC@Ag5[BW12O40]-NF under diverse current densities show that the GCD curve area decreases with the enhancement of current density in the charge–discharge course. According to eqn (S1),† the specific capacitance of Mn–BTC@Ag5[BW12O40]-NF is 198.09 F g−1 at a current density of 1 A g−1, which is larger than those of Mn–BTC-NF (80.6 F g−1), Ag5[BW12O40]-NF(110.6 F g−1) and those in the literature, see Table S1.† The Faraday reaction is insufficient at higher current density, resulting in a significant reduction in Mn–BTC@Ag5[BW12O40]-NF capacitance as current density augments. And the capacitance of Mn–BTC@Ag5[BW12O40]-NF remains at 146.36 F g−1 at 10 A g−1, which is still 73.89% of the original capacity (Fig. 4d). The results show that Mn–BTC@Ag5[BW12O40]-NF has excellent energy storage capacity and rate reversibility. In addition, Mn–BTC@Ag5[BW12O40]-NF maintained good stability after 5000 cycles, and the capacitance retention was 94.4%, which was higher than those of the other two compounds (Fig. 4e).
In Fig. 4f, the EIS plots of Mn–BTC@Ag5[BW12O40], Ag5[BW12O40], and Mn–BTC are measured before and after the cycle are shown. The EIS curve can be viewed as two parts, with a high frequency range and a low frequency range, respectively. While the semicircular arc in the high frequency region is due to redox reactions on the electrode/electrolyte interface, the diagonal of the low frequency region corresponds to the diffusion of ions though the electrode. The Rs stands for solution resistance in an electrochemical system. It can be seen that Mn–BTC@Ag5[BW12O40] has the smallest circle radius at high frequency, which confirms that it has great ionic conductivity, lower electrode interfacial ohmic resistance and faster redox electron transfer kinetics.69 In addition, Mn–BTC@Ag5[BW12O40] has a high slope in the low frequency range, indicating that its diffusion resistance is small. What's more, the Rs values of Mn–BTC@Ag5[BW12O40] before and after cycles respectively are 2.89 Ω and 3.01 Ω with little change, indicating that it has excellent conductivity and high capacitance and is a good material for supercapacitors. Mn–BTC@Ag5[BW12O40] has low resistance and good cycle stability, probably due to the introduction of the transition metal Mn2+, which has good electronic conductivity.
For further research on the value of Mn–BTC@Ag5[BW12O40] as an electrode material for supercapacitors in practical application, with nickel foam as a collector and using 1 M Na2SO4 electrolyte solution, a symmetric supercapacitor (SSC) was prepared with Mn–BTC@Ag5[BW12O40]. Fig. S8† shows a simulation of a symmetric SSC system. The CV curves at a scanning speed of 5–100 mV s−1 in the 0–1.0 V voltage window are shown in Fig. S8.† Along with the increase of the sweep rate, the area of the CV curves also magnifies, and the graphs are generally the same with good symmetry. Its GCD curves at a current density of 1–5 A g−1 are shown (Fig. 5a). During the charging process, the electrolyte ion is embedded inside the electrode, and an electrochemical double layer is formed between the electrolyte and the electrode. The discharge process is when the electrolyte ion embedded in the electrode moves back into the electrolyte solution. The change in specific capacitance is related to the efficiency involved when the electrolyte ions are embedded in the electrode material.70 At the low current density, the electrolyte ions are fully embedded inside the electrode. As the current density increases, the contact between the ions and the electrode decreases, and the specific capacitance also decreases. According to eqn (S2),† the specific capacitance is 78.2 F g−1 at a current density of 1 A g−1. At this current density, the energy density and power density are 10.9 W h kg−1 and 503.1 W kg−1 (according to eqn (S3) and (S4)†), higher than most of the reported ones (Fig. 5b).71–78 When the current density is 10 A g−1, the capacitance retention rate is 92.9% after 5000 cycles (Fig. 5c). The electrochemical impedance (EIS) is evaluated so that we can better know the charge transfer rate. The Rs values of the nanomaterial before and after circulation are 18.56 and 19.37 Ω. A small change in resistance indicates great stability and a rapid charge transfer rate (Fig. 5d). Overall, the electrochemical performance is good.
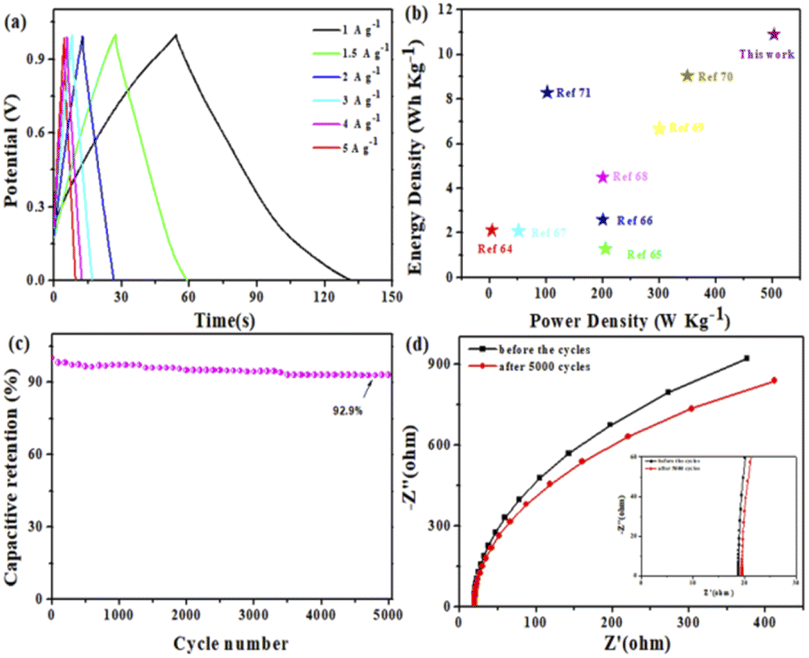 | ||
| Fig. 5 (a) GCD curves, (b) the Ragone plot, (c) 5000 cycles and (d) EIS before and after 5000 cycles of the SSC. | ||
3.3. Photocatalytic properties
Photocatalytic oxidation technology can completely decompose the toxic and refractory organic pollutants into ore-forming materials, so the photocatalytic degradation of organic dyes has attracted the attention of researchers.79–82 Studies have found that POMs have a high activity in photocatalytic degradation83 and the advantages of being green and safe. MOFs have a wide range of photocatalytic applications due to their abundant catalytically active sites.84 Based on the above considerations, using Mn–BTC@Ag5[BW12O40], Mn–BTC, and Ag5[BW12O40] as catalysts, the degradation of RhB, MB, and MO was tested under ultraviolet irradiation. Fig. S10† shows the adsorption–desorption curve of the organic dyes by the three compounds under light avoidance conditions. It can be seen that the adsorption of the organic dye by each of the three compounds within 30 min increased with increasing time, and the adsorption amount did not change after 30 min, indicating that all the three compounds reached the absorption and detachment equilibrium after 30 min. According to formula 1 − Ct/C0 (C0 and Ct express the concentration of photocatalytic degradation or absorption of dyes at times 0 and t, respectively), it can be seen that Mn–BTC@Ag5[BW12O40] (RhB 2.65%, MO 3.52%, and MB 2.25%), Mn–BTC (RhB 5.86%, MO 4.04%, and MB 3.74%), and Ag5[BW12O40] (RhB 3.78%, MO 3.61%, and MB 3.76%) have weak light absorption properties and little adsorption to organic dyes. The photocatalytic degradation properties of the three compounds were then tested separately. As can be seen from Fig. 6a–c, the degradation efficiency of the three dyes did no longer change 140 min later. Without the addition of a catalyst, the photocatalytic degradation speeds of RhB, MB, and MO are 1.7%, 2.1%, and 2.5%, respectively (see Fig. S11†). Fig. S12 and S13† show the photocatalytic degradation profiles for organic dyes of Ag5[BW12O40] (RhB 39.26%, MO 37.38%, and MB 32.26%) and Mn–BTC (RhB 25.87%, MO 33.33%, and MB 24.27%). The degradation rates of Mn–BTC@Ag5[BW12O40] for the three dyes of MB, RhB, and MO are 95.6%, 94.1% and 90.7%, respectively, which are higher than those of Ag5[BW12O40] and Mn–BTC. These results indicate that the synergistic interaction between the core and shell is beneficial for enhancing the photocatalytic performance of the compound, so that Mn–BTC@Ag5[BW12O40] has a significant catalytic effect. In order to know the stability of the nanomaterial in the first photocatalysis was used for five photocatalytic cycles for three dyes (Fig. 6d–f). The residuary concentration (Ct/C0) was almost unchanged after five cycles. The IR of the nanomaterial after five cycles was almost the same as before (see Fig. S14†). The results show that Mn–BTC@Ag5[BW12O40] has stable photocatalytic performance and good application potential.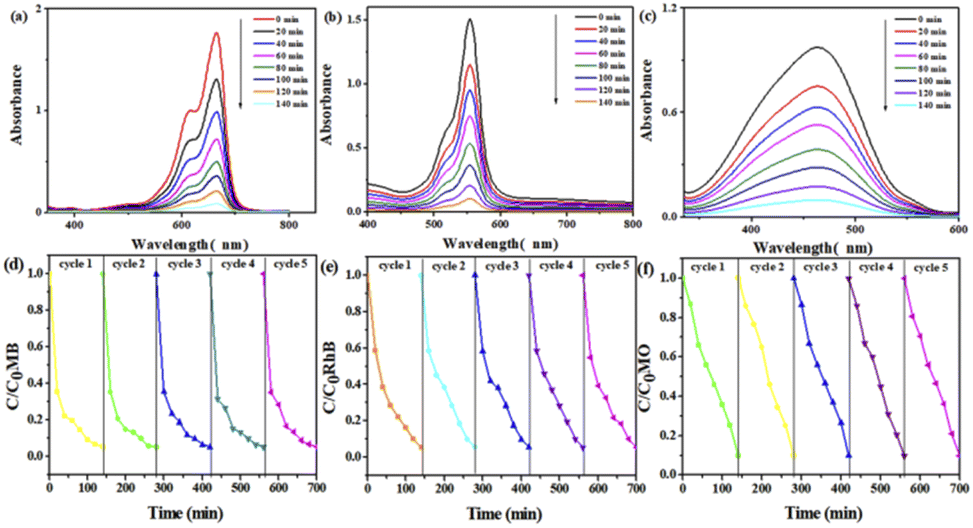 | ||
| Fig. 6 UV absorption spectra of (a) MB, (b) RhB, and (c) MO organic dyes by photodegradation; the degradation effects toward (d) RhB, (e) MB, and (f) MO organic dyes for 5 recycles. | ||
To research the mechanism of photocatalytic degradation of dyes, photoluminescence (PL) spectroscopy and free radical capture experiments were performed. PL has been widely used to study the electron–hole composite probability to explore the photocatalytic properties of catalysts. According to the theory, it is generally believed that the lower the emission peak intensity, the lower the electron–hole composite probability, indicating that if the photogenerated charge has a longer lifetime, the photocatalysis would be better.85Fig. 7a shows that three compounds were subjected to the PL test at an excitation wavelength of 325 nm, and it shows that Mn–BTC@Ag5 [BW12O40] has the lowest emission peak intensity, indicating a low electron–hole composite probability and theoretically better photocatalysis, consistent with the photocatalytic degradation dye results. Benzoquinone (BQ), isopropyl alcohol (IPA) and ethylenediaminetetraacetic acid (EDTA) were added to the three dyes as masking agents to mask superoxide radicals (˙O2−), hydroxyl radicals (˙OH), and holes (h+), respectively. As can be seen from Fig. 7b, the degradation speed of the dyes reduced slightly after adding BQ and EDTA, proving that ˙O2− and h+ aren't the decisive active intermediates. After adding IPA, the degradation rates of the dyes decreased significantly, and the degradation rates were as low as 23.32% (RhB), 24.51% (MO) and 55.3% (MB), respectively, indicating that ˙OH played a dominant role in this reaction, which is consistent with results in the literature.40,43
 | ||
| Fig. 7 (a) PL spectra of the three compounds; the (b) effect of masking agents (IPA, BQ, and EDTA) on MO, MB, and RhB degradation rates. | ||
Furthermore, the speculated mechanism of photocatalytic degradation of dyes is as follows from Fig. 8: under ultraviolet radiation, photogenerated electrons (e−) move away from the valence band (VB) and move to the conduction band (CB), and they produce holes (h+) on the VB (reaction (1)).86 And h+ can move from the VB of Mn–BTC to the VB of {BW12} and get adsorbed on the surface of {BW12} in large quantities. Moreover, h+ can be easily captured by H2O and generate ˙OH on the surface of the catalyst (reaction (2)).87 The CB negative potential of Mn–BTC is larger than that of {BW12}, so the electrons in the CB of {BW12} transfer to the CB of Mn–BTC, and the electrons react with O2 dissolved in water to form ˙O2− (reaction (3)).88 ˙OH, as a strong oxidant, will spontaneously degrade the surrounding organic dye, eventually forming H2O and CO2 (reaction (4)).89 The synergistic effect between the core–shell structure of Mn–BTC@Ag5[BW12O40] can promote e− transfer and the effective segregation of e−–h+ pairs and extends the service life of the carrier, which is the crucial factor to enhance photocatalytic activity.86 And valence electrons of Mn generate new energy levels and split energy levels, which will shorten the electron transition time and also improve the photocatalytic reaction activity effectively.90
 | ||
| Fig. 8 The degradation mechanism of Mn–BTC@Ag5[BW12O40]. | ||
4. Conclusions
In summary, Mn–BTC@Ag5[BW12O40] with a core–shell structure was triumphantly compounded though a simple grinding method and was successfully synthesized and directly used as a supercapacitor and photocatalyst. In the three-electrode system, the capacitance of the Mn–BTC@Ag5[BW12O40] electrode is 198.09 F g−1 at a current density of 1 A g−1, which is larger than those of Ag5[BW12O40] (110.6 F g−1) and Mn–BTC (80.6 F g−1). What's more, the preservation speed of the capacitance maintains 94.4% after 5000 cycles. In the symmetric SSC system, the power density, energy density, and specific capacitance of the symmetric supercapacitor are 503.1 W kg−1, 10.9 W h kg−1 and 78.2 F g−1. Meanwhile, capacitance preservation speed maintains 92.9% after 5000 cycles. Under ultraviolet radiation, Mn–BTC@Ag5[BW12O40] exhibits excellent photocatalytic degradation ability for typical dyes. Little change in the dye degradation rate occurred after five cycles. Therefore, the synthesized nanomaterials could be used for the development of satisfactory photocatalytic materials.Author contributions
Caihong Shi: writing – original draft. Ning Kang: data curation. Chunmei Wang: visualization. Kai Yu: formal analysis. Jinghua Lv: methodology. Chunxiao Wang: validation. Baibin Zhou: visualization, conceptualization, and writing – review & editing.Conflicts of interest
There are no conflicts to declare.Acknowledgements
This work was supported by the National Natural Science Foundation of China (22171061 and 21771046), the 2020 Central Government's Plan to Support the Talent Training Project of the Reform and Development Fund of Local Universities (1401120002), the Natural Science Foundation of Heilongjiang Province of China (ZD2021B002), and the Excellent Scientific Research Team Project of Harbin Normal University (XKYT2020001).Notes and references
- Y. Zheng, J. Liu, J. Liang, M. Jaroniec and S. Z. Qiao, Energy Environ. Sci., 2012, 5, 6717–6731 RSC.
- X. Y. Chu, F. L. Meng, T. Deng and W. Zhang, Nanoscale, 2021, 13, 5570–5593 RSC.
- S. Makino, Y. Yamauchi and W. Sugimoto, J. Power Sources, 2013, 227, 153–160 CrossRef CAS.
- J. Tang, R. R. Salunkhe, H. Zhang, V. Malgras, T. Ahamad, S. M. Alshehri, N. Kobayashi, S. Tominaka, Y. Ide and J. H. Kim, Sci. Rep., 2016, 6, 1–8 CrossRef PubMed.
- S. Chen, Y. F. Xiang, M. K. Banks, C. Peng, W. J. Xu and R. X. Wu, Nanoscale, 2018, 10, 20043–20052 RSC.
- H. Y. Chen, R. Al-Oweini, J. Friedl, C. Y. Lee, L. L. Li, U. Kortz, U. Stimming and M. Srinivasan, Nanoscale, 2015, 7, 7934–7941 RSC.
- X. H. Wang, F. Rong, F. F. Huang, P. He and Y. Yang, J. Alloys Compd., 2019, 789, 684–692 CrossRef CAS.
- K. B. Wang, Z. K. Wang, S. Wang, Y. Chu, R. Xi, X. Y. Zhang and H. Wu, Chem. Eng. J., 2019, 367, 239–248 CrossRef CAS.
- B. Akinwolemiwa, C. Wei and G. Z. Chen, Electrochim. Acta, 2017, 247, 344–357 CrossRef CAS.
- A. V. Anyushin, A. Kondinski and T. N. Parac-Vogt, Chem. Soc. Rev., 2022, 49, 382–432 RSC.
- G. N. Wang, T. T. Chen, C. J. Gómez-García, F. Zhang, M. Y. Zhang, H. Y. Ma, H. J. Pang, X. M. Wang and L. C. Tan, Small, 2020, 16, 2001626–2001633 CrossRef CAS PubMed.
- Y. Wang, Y. Y. Wang, L. Zhang, C. S. Liu and H. Pang, Inorg. Chem. Front., 2019, 6, 2514–2520 RSC.
- M. Yang, S. Rong, X. M. Wang, H. Y. Ma, H. J. Pang, L. C. Tan and Y. X. Jiang, ChemNanoMat, 2021, 7, 299–306 CrossRef CAS.
- N. I. Gumerova and A. Rompel, Chem. Soc. Rev., 2020, 49, 7568–7601 RSC.
- M. R. Horn, A. Singh, S. Alomari, S. Goberna-Ferrón, R. Benages-Vilau, N. Chodankar, N. Motta, K. Ostrikov, J. MacLeod, P. Sonar, P. Gomez-Romero and D. Dubal, Energy Environ. Sci., 2021, 14, 1652–1700 RSC.
- H. Y. Zhao, Y. Z. Li, J. W. Zhao, L. Wang and G. Y. Yang, Coord. Chem. Rev., 2021, 443, 213966–213985 CrossRef CAS.
- D. Wang, L. Liu, J. Jiang, L. Chen and J. Zhao, Nanoscale, 2020, 12, 5705–5718 RSC.
- W. Jia, J. L. Zhang, Z. J. Lu, S. Q. Wang and S. Z. Feng, Nanoscale, 2020, 12, 3902–3906 RSC.
- M. L. Wang, Y. Zhang, T. Y. Zhang, Y. Li, M. Z. Cui, X. Cao, Y. Lu, D. D. Peng, W. F. Liu, X. G. Liu, T. Wang and Y. Z. Huang, Nanoscale, 2020, 12, 11887–11898 RSC.
- A. J. Liu, F. Xu, S. D. Han, J. Pan and G. M. Wang, Cryst. Growth Des., 2020, 20(11), 7350–7355 CrossRef CAS.
- A. Naim, Y. Chevalier, Y. Bouzidi, P. Gairola, P. Mialane, A. Dolbecq, F. Avenier and J. P. Mahy, Inorg. Chem. Front., 2020, 7, 2362–2369 RSC.
- C. T. Buru, P. Li, B. L. Mehdi, A. Dohnalkova, A. E. Platero-Prats, N. D. Browning, K. W. Chapman, J. T. Hupp and O. K. Farha, Chem. Mater., 2017, 29, 5174–5181 CrossRef CAS.
- M. Samaniyan, M. Mirzaei, R. Khajavian, H. Eshtiagh-Hosseini and C. Streb, ACS Catal., 2019, 9, 10174–10191 CrossRef CAS.
- J. H. Shi, H. X. Zhang, P. S. Wang, P. Wang, J. J. Zha, Y. Liu, J. Gautam, L. N. Zhang, Y. Wang, J. Xie, L. B. Ni, G. W. Diao and Y. G. Wei, CrystEngComm, 2021, 23, 8482–8489 RSC.
- H. R. Chen, K. Shen, Q. Mao, J. Y. Chen and Y. W. Li, ACS Catal., 2018, 8, 1417–1426 CrossRef CAS.
- H. Y. Jin, C. X. Guo, X. Liu, J. L. Liu, A. Vasileff, Y. Jiao, Y. Zheng and S. Z. Qiao, Chem. Rev., 2018, 118, 6337–6408 CrossRef CAS PubMed.
- D. Yang and B. C. Gates, ACS Catal., 2019, 9, 1779–1798 CrossRef CAS.
- S. F. Ma, J. Ying, Y. P. Zhang and A. X. Tian, CrystEngComm, 2022, 24, 2891–2902 RSC.
- J. L. Zhuo, Y. L. Wang, Y. G. Wang, M. Q. Xu and J. Q. Sha, CrystEngComm, 2022, 24, 579–586 RSC.
- X. Xu, Y. P. Zhang, J. Ying, L. Jin, A. X. Tian and X. L. Wang, CrystEngComm, 2022, 24, 1267–1278 RSC.
- C. X. Sun, J. Ying, Y. P. Zhang, L. Jin, A. X. Tian and X. L. Wang, CrystEngComm, 2022, 24, 587–600 RSC.
- C. Wang, S. Yao, Y. Chen, Z. Zhang and E. Wang, RSC Adv., 2016, 6, 99010–99015 RSC.
- C. Zhao, S. Li, H. Ma, C. Zhang, H. Pang, Y. Yu and Z. Zhang, CrystEngComm, 2016, 18, 6233–6244 RSC.
- S. Wang, K. Yu, B. Wang, L. Wang, C. X. Wang, H. Zhang, C. M. Wang and B. B. Zhou, New J. Chem., 2016, 40, 7011–7017 RSC.
- K. Guo, X. Jiang, M. Xu, F. Li, S. Dong, Y. Zheng and L. Xu, Chem. Commun., 2021, 57, 11398–11401 RSC.
- Q. L. Liang, N. N. Du, L. G. Gong, C. X. Wang, C. M. Wang, K. Yu and B. B. Zhou, New J. Chem., 2021, 45, 14444–14450 RSC.
- W. J. Zhang, L. G. Gong, N. N. Du, C. X. Wang, K. Yu, C. M. Wang and B. B. Zhou, Inorg. Chem., 2021, 60, 16357–16369 CrossRef CAS PubMed.
- S. J. Pang, L. G. Gong, N. N. Du, H. Luo, K. Yu, J. Q. Gao, Z. W. Zheng and B. B. Zhou, Mater. Today Energy, 2019, 13, 239–248 CrossRef.
- X. Y. Zhao, L. G. Gong, C. X. Wang, C. M. Wang, K. Yu and B. B. Zhou, Chem.–Eur. J., 2020, 26, 4613–4619 CrossRef CAS PubMed.
- L. Y. Wang, N. Kang, L. G. Gong, C. X. Wang, K. Yu, C. M. Wang and B. B. Zhou, J. Energy Storage, 2022, 46, 103873 CrossRef.
- Z. W. Zheng, X. Y. Zhao, L. G. Gong, C. X. Wang, C. M. Wang, K. Yu and B. B. Zhou, J. Solid State Chem., 2020, 288, 121409 CrossRef CAS.
- H. Liu, L. G. Gong, C. X. Wang, C. M. Wang, K. Yu and B. B. Zhou, J. Mater. Chem. A, 2021, 9, 13161–13169 RSC.
- Y. Liang, N. Kang, C. M. Wang, K. Yu, J. H. Lv, C. X. Wang and B. B. Zhou, Dalton Trans., 2022, 51, 7613–7621 RSC.
- L. J. Xu, X. Y. Zhao, K. Yu, C. M. Wang, J. h. Lv, C. X. Wang and B. B. Zhou, CrystEngComm, 2022, 24, 5614–5621 RSC.
- R. Mao, F. Y. Zhan, N. J. Bu, Y. L. Cao, P. F. Hu, G. D. Gong and Q. Zhen, Mater. Lett., 2016, 173, 111–114 CrossRef CAS.
- X. H. Zhong, Y. Lu, F. Luo, Y. W. Liu, X. H. Li and S. X. Liu, Chem.–Eur. J., 2018, 24, 3045–3051 CrossRef CAS PubMed.
- S. B. Li, L. Zhang, Y. Q. Lan, K. P. O. Halloran, H. Y. Ma and H. J. Peng, Chem. Commun., 2018, 54, 1964–1967 RSC.
- P. F. Hu and Y. L. Cao, Dalton Trans., 2012, 41, 8908–8912 RSC.
- A. M. Zhang, M. Zhang, D. Lan, H. N. Wang, Y. J. Tang, X. L. Wang, L. Z. Dong, L. Zhang, S. L. Li and Y. Q. Lan, Inorg. Chem., 2018, 57, 11726–11731 CrossRef CAS.
- Y. Benseghir, A. Lemarchand, M. Duguet, P. Mialane, M. Gomez-Mingot, C. Roch-Marchal, T. Pino, M. H. Ha-Thi, M. Haouas, M. Fontecave, A. Dolbecq, C. Sassoye and C. Mellot-Draznieks, J. Am. Chem. Soc., 2020, 142, 9428–9438 CrossRef CAS PubMed.
- S. Roy, V. Vemuri, S. Maiti, K. S. Manoj and U. Subbarao, Inorg. Chem., 2018, 57, 12078–12092 CrossRef CAS PubMed.
- C. Rocchiccioli-Deltcheff, M. Fournier, R. Franck and R. Thouvenot, Inorg. Chem., 1983, 22, 207–216 CrossRef CAS.
- N. N. Du, L. G. Gong, L. Y. Fan, K. Yu, H. Luo, S. J. Pang, J. Q. Gao, Z. W. Zheng, J. H. Lv and B. B. Zhou, ACS Appl. Nano Mater., 2019, 2, 3039–3049 CrossRef CAS.
- H. Lv, J. Song, Y. V. Geletii, J. W. Vickers, J. M. Sumliner, D. G. Musaev, P. Koegerler, P. K. Zhuk, J. Bacsa, G. Zhu and C. L. Hill, J. Am. Chem. Soc., 2014, 136, 9268–9271 CrossRef CAS.
- M. Bou, J. M. Martin and T. L. Mogne, Appl. Surf. Sci., 1991, 47, 149–161 CrossRef CAS.
- K. M. L. Taylor, W. J. Rieter and W. B. Lin, J. Am. Chem. Soc., 2008, 130, 14358–14359 CrossRef CAS.
- W. Luo, Z. H. Bao, W. H. Jiang, J. M. Liu, G. Feng, Y. Q. Xu, H. D. Tang and T. Wang, Ceram. Int., 2019, 45, 24750–24756 CrossRef CAS.
- Y. Wang, Y. Peng, L. N. Xiao, Y. Y. Hu, L. M. Wang, Z. M. Gao, T. G. Wang, F. Q. Wu, X. B. Cui and J. Q. Xu, CrystEngComm, 2012, 14, 1049–1056 RSC.
- J. W. Zhao, Y. P. Song, P. T. Ma, J. P. Wang and J. Y. Niu, J. Solid State Chem., 2009, 182, 1798–1805 CrossRef CAS.
- Y. L. Ren, D. D. Yang, N. Li and R. D. Huang, Chin. J. Chem., 2017, 35, 347–353 CrossRef CAS.
- Z. H. Yang, C. H. Ho and S. Lee, Appl. Surf. Sci., 2015, 349, 609–614 CrossRef CAS.
- J. G. Lv, R. Miao, M. Zhang, G. He, M. Zhao, B. Yu, W. Wang, B. Li and Z. Q. Sun, J. Mater. Sci.: Mater. Electron., 2018, 29, 16282–16288 CrossRef CAS.
- Y. M. Liang, N. Guo, L. L. Li, R. Q. Li, G. J. Ji and S. C. Gan, New J. Chem., 2016, 40, 1587–1594 RSC.
- M. A. Stranick, Surf. Sci. Spectra, 1997, 6, 47 CrossRef.
- C. J. Wang, S. Yao, Y. Z. Chen, Z. M. Zhang and E. B. Wang, RSC Adv., 2016, 6, 99010–99015 RSC.
- S. Maiti, A. Pramanik, U. Manju and S. Mahanty, ACS Appl. Mater. Interfaces, 2015, 7, 16357–16363 CrossRef CAS.
- H. L. Zhu, Y. X. Tong and X. M. Chen, J. Chem. Soc., Dalton Trans., 2000, 4182–4186 RSC.
- G. J. Liang, X. L. Li, Y. B. Wang, S. Yang, Z. D. Huang, Q. Yang, D. h. Wang, B. B. Dong, M. S. Zhu and C. Y. Zhi, Nano Research Energy, 2022, 1, e9120002 CrossRef.
- X. H. Xiong, C. H. Yang, G. H. Wang, Y. W. Lin, X. Ou, J. H. Wang, B. T. Zhao, M. L. Liu, Z. Lin and K. V. Huang, Energy Environ. Sci., 2017, 10, 1757–1763 RSC.
- X. C. Ye, Z. H. Lin, S. J. Liang, X. H. Huang, X. Y. Qiu, Y. C. Qiu, X. M. Liu, D. Xie, X. H. Xiong and H. Deng, Nano Lett., 2019, 19, 1860–1866 CrossRef CAS PubMed.
- A. M. White and R. C. T. Slade, Synth. Met., 2003, 139, 123–131 CrossRef CAS.
- M. Skunik, M. Chojak, I. A. Rutkowska and P. J. Kulesza, Electrochim. Acta, 2008, 53, 3862–3869 CrossRef CAS.
- W. H. Li, K. Ding, H. R. Tian, M. S. Yao, B. Nath, W. H. Deng, Y. B. Wang and G. Xu, Adv. Funct. Mater., 2017, 27, 1702067–1702073 CrossRef.
- D. Y. Fu, H. W. Li, X. M. Zhang, G. Y. Han, H. H. Zhou and Y. Z. Chang, Mater. Chem. Phys., 2016, 179, 166–173 CrossRef CAS.
- F. J. Miao, C. L. Shao, X. H. Li, K. X. Wang, N. Lu and Y. C. Liu, J. Mater. Chem., 2016, 4, 5623–5631 RSC.
- S. H. Yang, Z. Z. Han, J. Sun, X. P. Yang, X. Hu, C. C. Li and B. Q. Cao, Electrochim. Acta, 2018, 268, 20–26 CrossRef CAS.
- J. Wu, X. P. Zhang, F. X. Wei, Y. W. Sui and J. Q. Qi, Mater. Lett., 2020, 258, 126761 CrossRef CAS.
- Y. N. Li, D. P. Xu, M. M. Zhang, Q. Qin, M. Song, J. L. Zhou, Z. H. Chen, C. Teng and G. R. Ren, J. Electroanal. Chem., 2021, 901, 115781 CrossRef CAS.
- K. N. Li, S. S. Zhang, Y. H. Li, J. J. Fan and K. L. Lv, Chin. J. Catal., 2021, 42, 3–14 CrossRef CAS.
- H. Wang, W. X. Liu, X. He, P. Zhang, X. D. Zhang and Y. Xie, J. Am. Chem. Soc., 2020, 142, 14007–14022 CrossRef CAS PubMed.
- M. B. Wazir, M. Daud, F. Ali and M. A. Al-Harthi, J. Mol. Liq., 2020, 315, 113775–113819 CrossRef CAS.
- X. Zhang, J. Wang, X. X. Dong and Y. K. Lv, Chemosphere, 2020, 242, 125144–125195 CrossRef CAS PubMed.
- J. Q. Gao, L. G. Gong, X. Y. Fan, K. Yu, Z. W. Zheng and B. B. Zhou, ACS Appl. Nano Mater., 2020, 3, 1497–1507 CrossRef CAS.
- J. Gu, Y. Peng, T. Zhou, J. Ma, H. Pang and Y. Yamauchi, Nano Research Energy, 2022, 1, e9120009 CrossRef.
- B. Wang, M. Y. Wang, F. Y. Liu, Q. Zhang, S. Yao, X. L. Liu and F. Huang, Angew. Chem., Int. Ed., 2020, 59, 1914–1918 CrossRef CAS PubMed.
- L. Yue, Y. Cao, Y. Han, Z. Li, X. Luo and Y. Liu, J. Alloys Compd., 2021, 870, 159339 CrossRef CAS.
- M. Ding, H. Yang, T. Yan, C. Wang, X. Deng, S. Zhang, J. Huang, M. Shao and X. Xu, Nanoscale Res. Lett., 2018, 13, 260 CrossRef PubMed.
- H. Shen, X. Zhao, L. Duan, R. Liu, H. Wu, T. Hou, X. Jiang and H. Gao, Appl. Surf. Sci., 2017, 391, 627–634 CrossRef CAS.
- L. G. Gong, X. X. Qi, K. Yu, J. Q. Gao, B. B. Zho and G. Y. Yang, J. Mater. Chem. A, 2020, 8, 5709–5720 RSC.
- W. B. Zhang, Z. J. Zhang, S. W. Kwon, F. C. Zhang, B. Stephen, K. K. Kim, R. Jung, S. Kwon, K. Chung and W. Yang, Appl. Catal., B, 2017, 206, 271–281 CrossRef CAS.
Footnote |
| † Electronic supplementary information (ESI) available. See https://doi.org/10.1039/d2na00510g |
| This journal is © The Royal Society of Chemistry 2022 |