
 Open Access Article
 This Open Access Article is licensed under a Creative Commons Attribution-Non Commercial 3.0 Unported Licence
Hyperspectral dark field optical microscopy for orientational imaging of a single plasmonic nanocube using a physics-based learning method†
Nishir
Mehta
a,
Amirreza
Mahigir
bc,
Georgios
Veronis
bc and
Manas Ranjan
Gartia
 *a
*a
aDepartment of Mechanical and Industrial Engineering, School of Electrical Engineering and Computer Science, Louisiana State University, Baton Rouge, Louisiana 70803, USA. E-mail: mgartia@lsu.edu; Tel: +1-225-578-5900
bSchool of Electrical Engineering and Computer Science, Louisiana State University, Baton Rouge, Louisiana 70803, USA
cCenter for Computation and Technology, Louisiana State University, Baton Rouge, Louisiana 70803, USA
First published on 24th August 2022
Abstract
Rotational dynamics at the molecular level could provide additional data regarding protein diffusion and cytoskeleton formation at the cellular level. Due to the isotropic emission pattern of fluorescence molecules, it is challenging to extract rotational information from them during imaging. Metal nanoparticles show a polarization-dependent response and could be used for sensing rotational motion. Nanoparticles as an orientation sensing probe offer bio-compatibility and robustness against photo-blinking and photo-bleaching compared to conventional fluorescent molecules. Previously, asymmetric geometrical structures such as nanorods have been used for orientational imaging. Here, we show orientational imaging of symmetric geometrical structures such as 100 nm isolated silver nanocubes by coupling a hyperspectral detector and a focused ion beam (FIB)-fabricated correlating substrate. More than 100 nanocubes are analyzed to confirm spectral shifts in the scattering spectra due to variations in the orientation of the nanocubes with respect to the incoming light. Results are further validated using finite-difference time-domain simulations. Our observations suggest a novel strategy for high-throughput orientation imaging of nanoparticles.
1. Introduction
Orientation of nanostructures is critical in many applications such as the detection of single polymer chains in biomedicine,1,2 catalysts,3 DNA biosensors,4 protein interactions and detection,5 hotspots of surface-enhanced Raman spectroscopy (SERS),6 opto-magnetic data storing devices,7 and fluorescence resonant energy transfer (FRET)8,9 experiments. Control over orientation is vital in order to modify single nanoparticles to create Janus particles, as well as to create dimers by placing two different metal nanostructures in close vicinity.10,11 Understanding the interactions of nanoparticles of different shapes and orientations with cell membranes is crucial in drug transport and gene delivery.12–15 Younan Xia's group16 compared the intake of gold nanocubes, nanorods and nanohexapods for photothermal cancer treatment, and found that nanohexapods have better internalization than nanocubes and nanorods. Hu et al.17 found that vertical orientation of ellipsoid nanoparticles is more effective for phagocytosis compared to horizontal orientation. This is because of the better alignment of the vertical orientation during macrophage phagocytosis.18,19 The roles of shape, aspect ratio, and orientation in the cellular internalization process were previously demonstrated experimentally and using molecular dynamics simulations.20–23 However, it is difficult to acquire the actual orientation of a nanostructure using standard optical microscopes due to the optical diffraction limit.Conventional techniques to characterize nanoparticles, such as fluorescence imaging24,25 and magnetic resonance spectroscopy26 involve complex sample preparation, probing, and labeling expertise. Existing methods of interrogation of nanoparticles like fluorescence polarization spectroscopy are not suitable for studying single-particle ensembles, are time intensive, expensive, and require many resources for sample preparation and analysis. At the same time, conventional optical microscopes are limited by diffraction (to approximately 250 nm)27 and only provide intensity images without spectral information. Due to inhomogeneous and uncontrolled labeling, there is a loss of information and generation of artifacts that offer false impressions generating erroneous data.28 Previously, absorption-based photothermal imaging,29 single- and two-photon luminescence,30 and defocused imaging31 methods were used to study the orientation of a single nanoparticle. In previous studies, a laser was utilized, and wherein laser generates heat which creates possibilities of thermal deformation32 and limits applications in biology/soft matters. A challenge in defocusing microscopy33 is its inability to accurately determine the spectral distribution without reducing the quality of the image.
Polarized-scattered-light-based plasmonic orientation sensing has been performed by the direct fitting of the cosine squared function to angular intensity profiles34 and by using polarization-dependent color change, where images were collected at only a few spectral bands.35 Kim et al.36 performed a comprehensive study in which polarization-dependent color change of low aspect ratio (AR = 1.5) gold nanorods (AuNRs), non-optimal color assignments, and near-infrared plasmon resonances were studied. However, information was limited to three color channels (and the CCD detector) – three data points and orientation assignments based on the underlying colorimetric change.
Polarized dark-field hyperspectral microscopy provided a five-fold improvement in determining the orientation of the nanoparticles compared to photothermal and defocused imaging.37 The use of a broadband light source allowed to achieve wide-field and hyperspectral imaging capabilities compared to photothermal imaging. High-throughput high-accuracy orientational studies of nanostructures via polarized scattering microscopy require a novel protocol. The polarization of the incoming light affects the plasmonic resonances. Light scattered or absorbed by the nanoparticles can be quantified to reflect orientation as well as other intrinsic properties. Previously studies have used AuNRs, which have one less axis of symmetry than nanocubes. Recently, Teri Odom's group38 described a machine learning method for nanorods and nanostars to determine the orientation using differential interference contrast (DIC) images.
In this paper, we evaluate cubical (more complex) probes and report different intensity peaks for diagonal and planar oscillation modes compared to longitudinal and transverse modes in nanorods. We also demonstrate spectral information in more than three bands (hyperspectral) in the visible and near-infrared (VNIR) wavelength range. Super-imposition of spectroscopic data over the CCD-imaged data allows us to quantify orientation changes based on spectral shift, in contrast to qualitative color change demonstrated in previous studies. We perform correlative studies between quantified spectral features and scanning electron microscopy images. Unlike previous studies, we perform finite-difference time-domain (FDTD) numerical simulations to confirm the experimental results. Our results demonstrate a new platform application for orientational imaging with single nanoparticle resolution.
2. Materials and methods
Materials
ITO slides were purchased from Sigma Aldrich. Polyvinylpyrrolidone (PVP) silver nanocubes were purchased from nanoComposix, Inc.Structural characterization
High-resolution transmission electron microscopy (TEM) images of the nanocubes were acquired with JEOL JEM-2011 equipped with a Gatan SC1000 CCD camera.Sample preparation
We drop-cast the 100 nm Ag nanoparticles on a 75 mm × 25 mm ITO-coated glass slide. Prior to drop-casting, we etch the patterns in the ITO-coated slides via focused-ion beam milling. A focused gallium ion beam tilted at 52° allows for nano and micro-scaled cutting of substrate in order to index individual nanoparticles. Square arrays of X–Y dimensions 1–1.5 μm were generated for a fine view of 100 nm nanocubes. The micro-milled glass substrate is preheated in an oven to 40° for 10 minutes before drop-casting particles to prevent coffee-ring phenomena in nanostructure distribution by quickly eliminating the water solution. Next, a 5 μL solution containing silver nanocubes was drop-coated on the above indexed slide, and water was allowed to vaporize. An electron beam analytical tool such as scanning electron microscopy (SEM) is used to determine the angular orientation of the nanostructure with respect to the indexed substrate. SEM images are processed in ImageJ software to provide angular assignment of individual nanostructures. A UV-6300 double beam spectrophotometer was used to investigate the wavelength range for plasmon resonance due to scattering from nanostructures in solution.Hyperspectral imaging
A CytoViva hyperspectral microscope equipped with a high-intensity halogen light source was used to provide hyperspectral imaging in the wavelength ranges of λ = 400–1000 nm. A liquid light guide was used to focus light at oblique angles through the illumination condenser. The spectral resolution obtained is 2 nm, and the spatial area of each pixel is 25 nm × 25 nm. An oil objective with 100× magnification was used to acquire the images. Immersion oil contributes to reducing the speed of light, thereby shortening the wavelength while at the same time keeping the frequency constant, according to the relation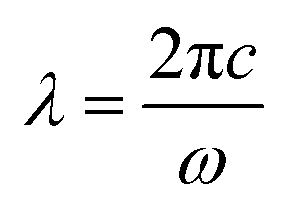 where c is the speed of light and ω is the angular frequency.39 To minimize random glare, we used a polarizing filter between the condenser and the glass substrate. Particles were sandwiched by gently placing a coverslip over the substrate. The coverslip was sealed using nail polish to avoid oil moving into the sample space. The exposure time for each pixel was 0.25 s. We used the hyperspectral spectrograph to collect spectral data at room temperature. To improve signal-to-noise ratio, the intensity count was adjusted between 1000 and 10
![[thin space (1/6-em)]](https://www.rsc.org/images/entities/char_2009.gif) 000. The image analysis was performed using the ENVI 4.8 software (CytoViva®, Inc.) in dark-field mode. Spectral data of nanoparticles obtained from experiments and simulations were normalized to a maximum intensity of 1. After carefully subtracting background irregularities, regions of interest were defined to collect spectra from selected pixels containing nanostructures. No special tagging or staining was done for the nanostructures. PCA data analysis and spectrum plotting were performed using the OriginLab software.
000. The image analysis was performed using the ENVI 4.8 software (CytoViva®, Inc.) in dark-field mode. Spectral data of nanoparticles obtained from experiments and simulations were normalized to a maximum intensity of 1. After carefully subtracting background irregularities, regions of interest were defined to collect spectra from selected pixels containing nanostructures. No special tagging or staining was done for the nanostructures. PCA data analysis and spectrum plotting were performed using the OriginLab software.
Computational method
FDTD simulations were performed using Lumerical FDTD Solutions. The refractive index of silver was obtained from CRC data,40 and the refractive index of glass used was 1.51. The mesh size was chosen equal to 2 nm throughout the simulation domain, which was terminated to perfectly matched layers (PMLs) in all directions. We used the total-field scattered-field formulation with a plane wave normally incident from the top as the pump signal to excite the nanostructure from λ = 400–900 nm. The local electric field distribution in the surface of the nanocube at the resonance frequency was obtained using a plane frequency-domain field monitor.Orientation detection algorithm
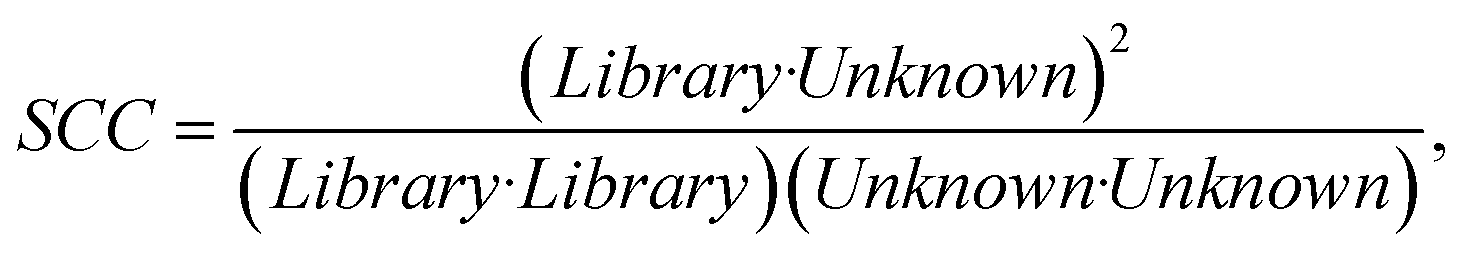
We constructed a large dataset of scattering spectra of nanocubes observed with hyperspectral microscopy and FDTD simulations. We then labeled the orientation of the nanocube in each spectra by comparing them with the FDTD simulations and validated our algorithm using a correlative imaging approach (SEM images). We trained the model to interpret the spectra. Using what it “learned” from that dataset created by “physics-based” electromagnetic FDTD simulations, the resulting model can use new scattering spectra (obtained with a hyperspectral microscope) to predict the orientation of a nanoparticle (in this case of a nanocube). The similarity between the unknown spectrum and the library spectrum is identified by the spectral correlation coefficient (SCC) calculated using the following equation:where Unknown denotes the spectrum of the nanocube for which orientation is sought, and Library denotes the reference spectrum in the constructed library. The SCC approaches 1.0 when the Library spectrum and the Unknown spectrum are similar. The SCC will approach 0, when there is no similarity between the Library spectrum and the Unknown spectrum.
3. Results and discussion
The optical properties of metal nanoparticles are significantly dominated by surface plasmons associated with electron oscillations. Photon energies in the visible and mid-infrared regions of the light spectrum are sufficient to excite the surface plasmons of nanostructures.39 The plasmon resonance characteristics of the nanoparticles depend mainly on the particle size, shape and orientation, especially when the structures are small compared to the incident light wavelength.41 The optical response due to surface plasmons is dominated by the orientation of the nanostructures when probing structures with similar size and shape. Fig. 1a shows schematically the physics-based learning method that we use to determine the orientation of a plasmonic nanoparticle. To challenge the algorithm, we select a highly symmetric nanoparticle, i.e. a silver nanocube with 100 nm in length dimensions. Fig. 1b and c show representative TEM images of a single nanocube. From the image analysis (Fig. 1f) of several nanocubes, the average edge length of the nanocubes was found to be ∼100 nm. Fig. 1d shows the corresponding dark field image of the nanocubes. Fig. 1e shows the experimental extinction coefficient spectra of ensemble nanocube particles in solution (water). The experimental extinction spectra exhibit several peaks. The peaks at λ = 347 and 393 nm are due to the bulk plasmon resonance of Ag. Nanocubes in water showed two other intense peaks at λ = 466 and 547 nm. The origin of these peaks was identified by performing FDTD simulations of nanocubes in water (Fig. 1h). The locations of these extinction maxima are found to be size-dependent (Fig. S1a and S1b†). Increase in the edge length of the cube leads to a red shift in the absorption maxima due to the retardation effect (Fig. S1c†). The FWHM of the absorption peaks increase with the increase in the cube edge length and the peaks become less intense (Fig. S1a, S1c†). By comparing the contribution of scattering and absorption to the extinction spectra, we found that scattering plays a bigger role compared to absorption (Fig. S1d†). The theoretical spectra of the nanocubes are shown in Fig. 1g. The plasmon modes of the nanocubes are also dependent on the corner geometry, i.e. the sharpness of the nanocube corner. Fig. 1g compares the absorption spectra of single nanocubes with either sharp or rounded corners. The peak plasmon resonance of the rounded-cornered nanocube (λpeak = 494 nm, FWHM = 56 nm) showed a blueshift in the resonance wavelength compared to the sharp-cornered nanocube (λpeak = 520 nm, FWHM = 43 nm). The corner geometry has a strong influence on the plasmon resonance because of the dependence of the charge density distribution on the corner geometry. The distributions of electric field intensity (|E|2) and charge density are shown in Fig. 1h and i, respectively. The dominant mode (peak 1) has its induced charges concentrated at the cube's corner, and the positive and negative charges are situated on each side. Thus, they have a large dipole moment p = qd, where q is the charge, and d is the cube's edge length, and hence couple strongly to light. Further, peak 1 corresponds to a dipolar mode, whereas peaks 2–4 correspond to multipolar modes.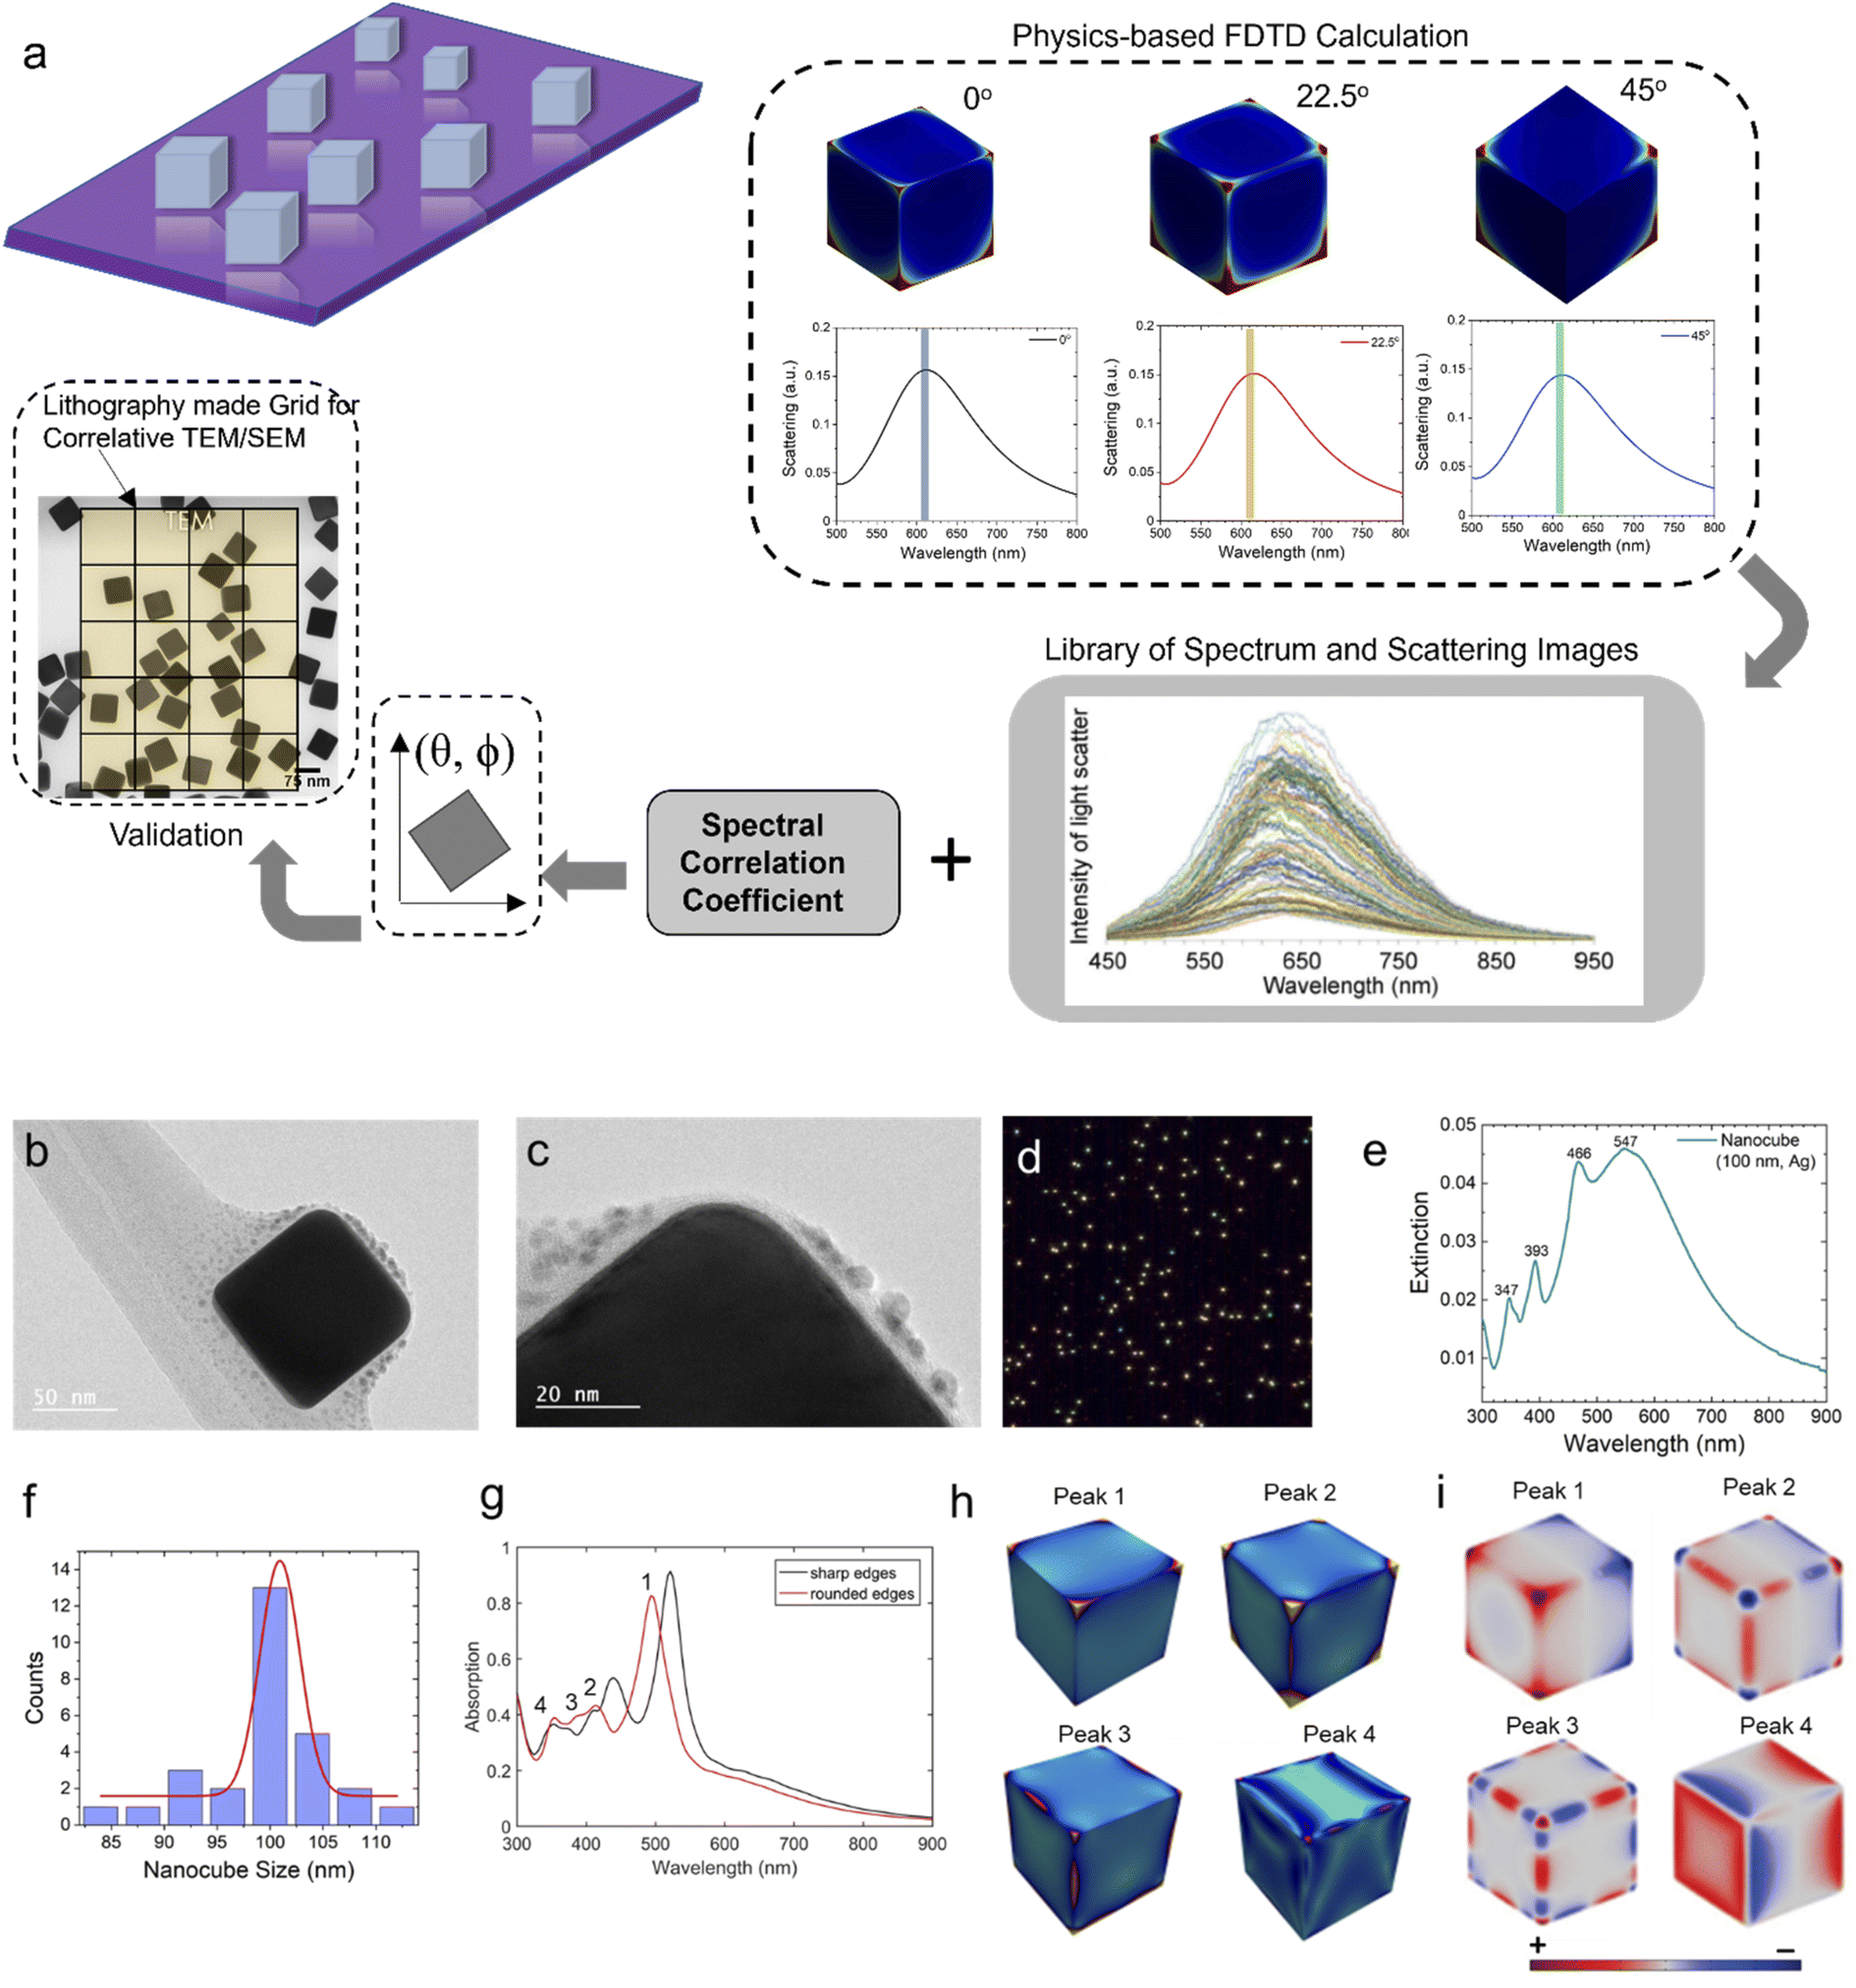 | ||
| Fig. 1 (a) Schematic of Ag nanocubes isolated and drop-casted on the substrate; Schematic of the physics-based learning method that we use to determine the orientation of a plasmonic nanoparticle; (b and c) transmission electron microscopy (TEM) images of a single nanocube; (d) dark-field image of nanoparticles taken using an optical image detector; (e) extinction spectra of the nanocube sample collected in VNIR (visible-near infrared range) using a UV-vis spectrophotometer; (f) size distribution of nanocubes obtained from the TEM images using ImageJ. The average nanocube edge length is 98.5 (g) absorption spectra of a nanocube in water using finite-difference time-domain (FDTD) simulations. Results are shown for nanocubes with sharp edge (black curve) and round edge (red curve); (h) the distribution of electric field intensity (|E|2), and (i) the corresponding charge density distribution on the nanocube. | ||
Fig. 2 shows the FDTD simulated scattering spectra of a nanocube in the air at different orientations with respect to the polarization direction of the incoming illumination. We see redshifts in the scattering peaks for the nanocubes that are oriented at 22.5°, 45°, and 67.5° compared to the nanocube at 0°. The corresponding electric field distributions are shown in Fig. 2b–g. Comparison of the charge density distribution of a nanocube in air vs. a nanocube on ITO showed that their dominant modes are different.42 The dominant mode for a nanocube in air is dipolar (D), whereas for a nanocube on ITO slides it is primarily quadrupolar (Q) (Fig. 2h–k). The dipole moment of a nanocube in air is much larger compared to the dipole moment of a nanocube on ITO (Fig. 2j–k). Hence, it is difficult to couple the quadrupolar mode to the incident light. The magnitude of induced charge is dependent on the dielectric constant of the substrate as 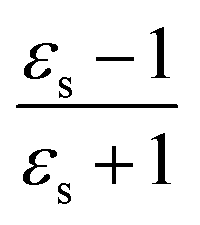 ; εs = 1.0 for air, εs = 1.77 for water, and εs = 3.46 for ITO. In air, the D and Q modes do not interact. On ITO, the D and Q modes interact forming hybridized bonding and anti-bonding modes. The antibonding mode (D − Q) has higher energy (shorter wavelength) compared to the bonding mode (D + Q) (as bond formation requires some energy). The antibonding mode (D − Q) loses energy with θ, but does not shift its peak position, whereas the bonding mode (D + Q) shifts its peak position with θ (Fig. 2a). The shift between the positions of bonding and antibonding modes (λD+Q − λD−Q) for ITO (= 160 nm) is much larger than the one for air (= 85 nm). The peak position of the bonding mode redshifts with the increase of the dielectric constant (λD+Q = 488 nm for air, 600 nm for water, and 619 nm for ITO) (Fig. 2l). The corresponding FWHM linewidths are 100 nm, 289 nm, and 140 nm for air, water, and ITO, respectively (Fig. 2l).
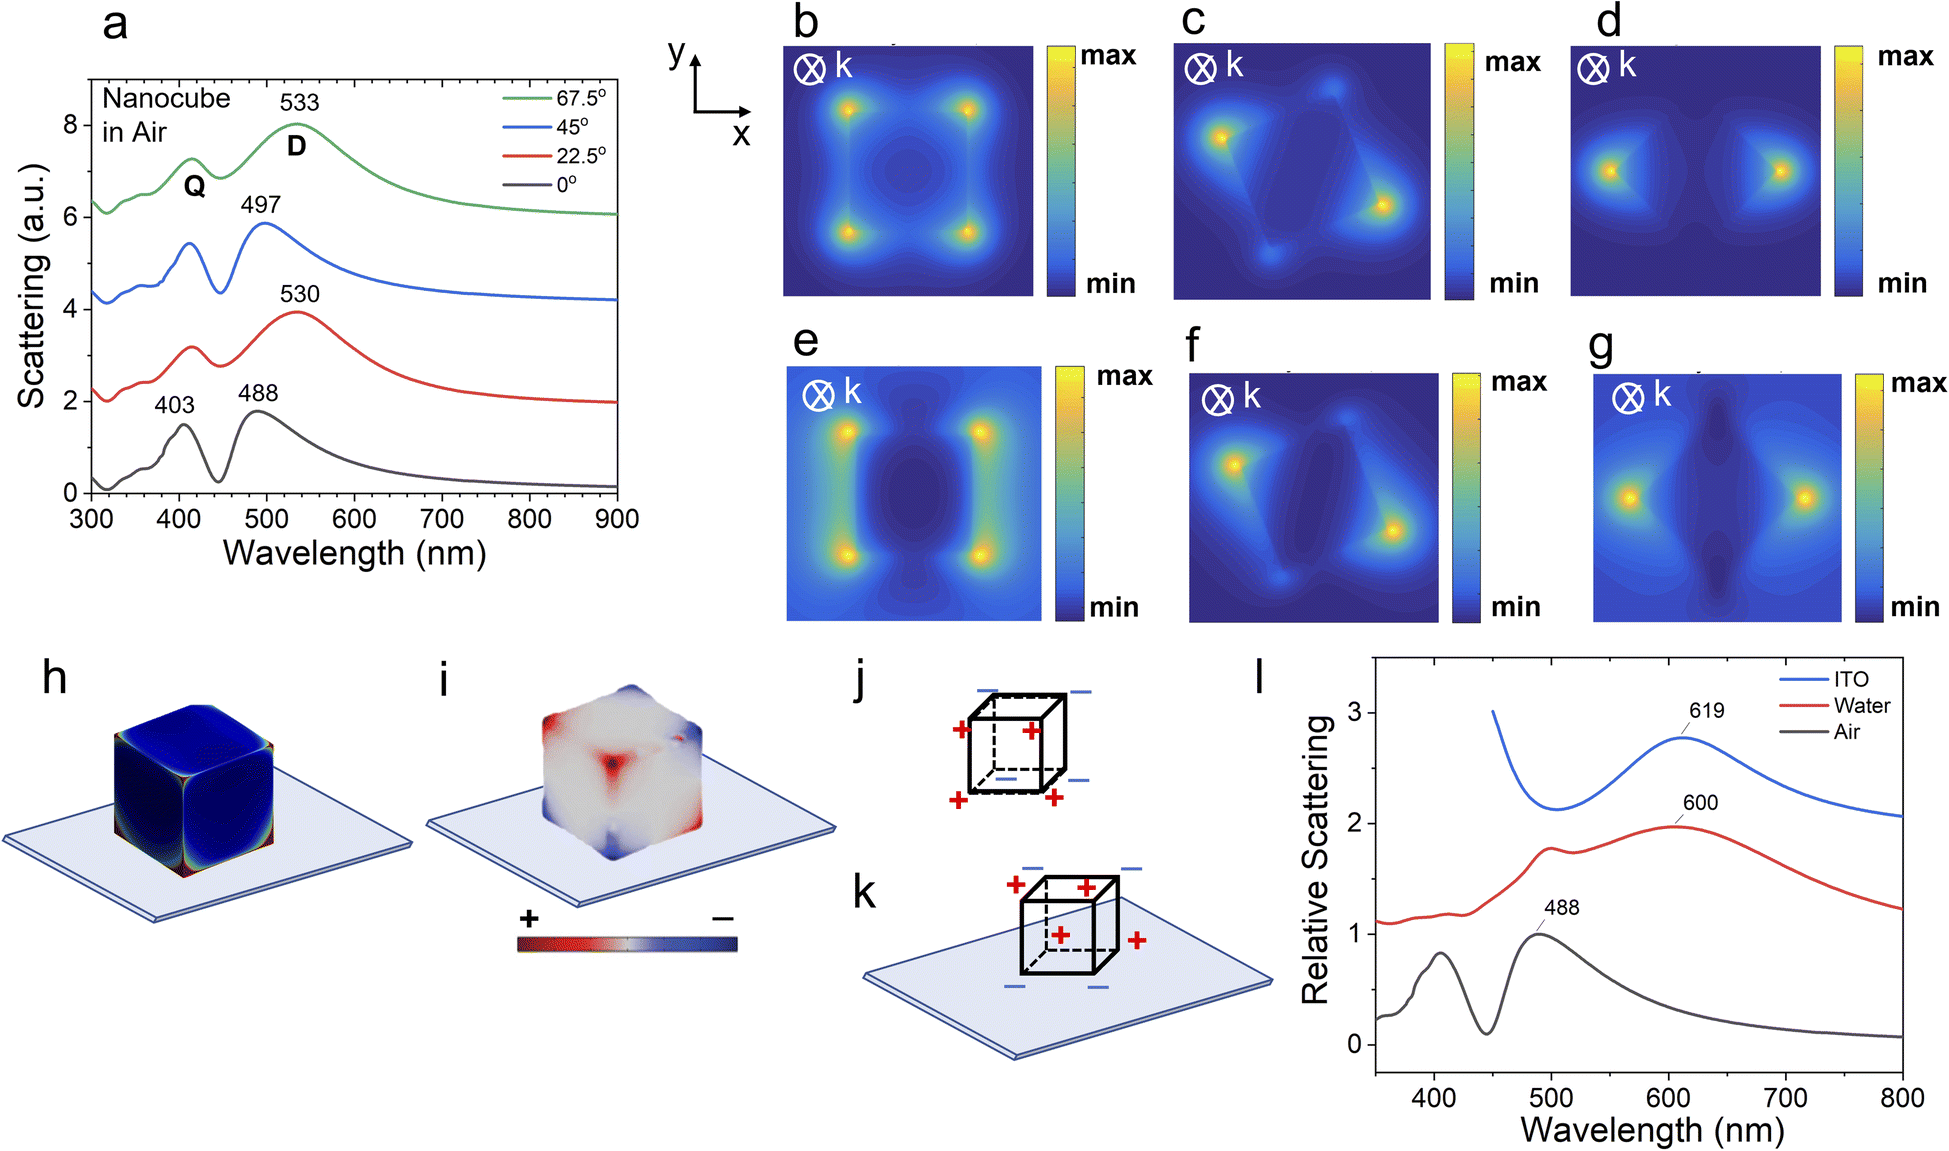 | ||
| Fig. 2 (a) Scattering spectra of a nanocube in air at different orientations calculated using FDTD. The dipole (D) and quadrupole (Q) modes are marked in the plot; electric field intensity distribution at (b) λ = 404 nm, θ = 0°; (c) λ = 414 nm, θ = 22.5°; (d) λ = 412 nm, θ = 45°; (e) λ = 486 nm, θ = 0°; (f) λ = 533 nm, θ = 22.5°; and (g) λ = 497 nm, θ = 45°; distribution of (h) electric field intensity, and (i) charge density of a nanocube on ITO substrate. The schematics of the corresponding charge distributions are shown for nanocubes (j) in air, and (k) on ITO substrate; (l) normalized scattering spectra of a nanocube in air, water, and on ITO substrate obtained using FDTD simulations. | ||
To determine the angle of a single nanoparticle, we use correlative microscopy to obtain scanning electron microscopy and dark-field optical microscopy data from the same sets of nanoparticles. Correlation was achieved by generating distinctive marker grids on the light-transparent ITO-coated glass slides.43 Focused ion beam (FIB) milling was used to generate sharp 90° angled grooves of ∼0.5 μm depth using high ion beam energy of 20 keV (Fig. 3a). The dark field optical image and the corresponding hyperspectral image are shown in Fig. 3b and c, respectively. The SEM image presented for the selected area (Fig. 3a) clearly shows the nanocubes. The orientation is determined with respect to the square groove horizontal lines. The scattering spectra of the nanocubes (#P1–P16) collected by the hyperspectral detector are shown in Fig. 3e. The angular orientations of the particles are analyzed by the ImageJ software. Comparison of the linewidth of the pixels across a single nanoparticle as captured in SEM (FWHM ∼100 nm) and of the same nanoparticle as it appears in a diffraction-limited hyperspectral dataset image (FWHM ∼500 nm) is shown in Fig. 3d. For transforming the high dimensional spectral data into a data set with reduced dimension, we used an unsupervised statistical technique, the principal component analysis (PCA).44,45 We have previously used PCA approach for Raman spectral analysis.46,47 PCA result (Fig. 3f) showed that the first principal component (PC1) can distinguish between single nanoparticles (+PC1 values) and multiple particles (−PC1 values) in a hyperspectral image. We found that PCA has an angular accuracy of ∼45° (Fig. 3g).
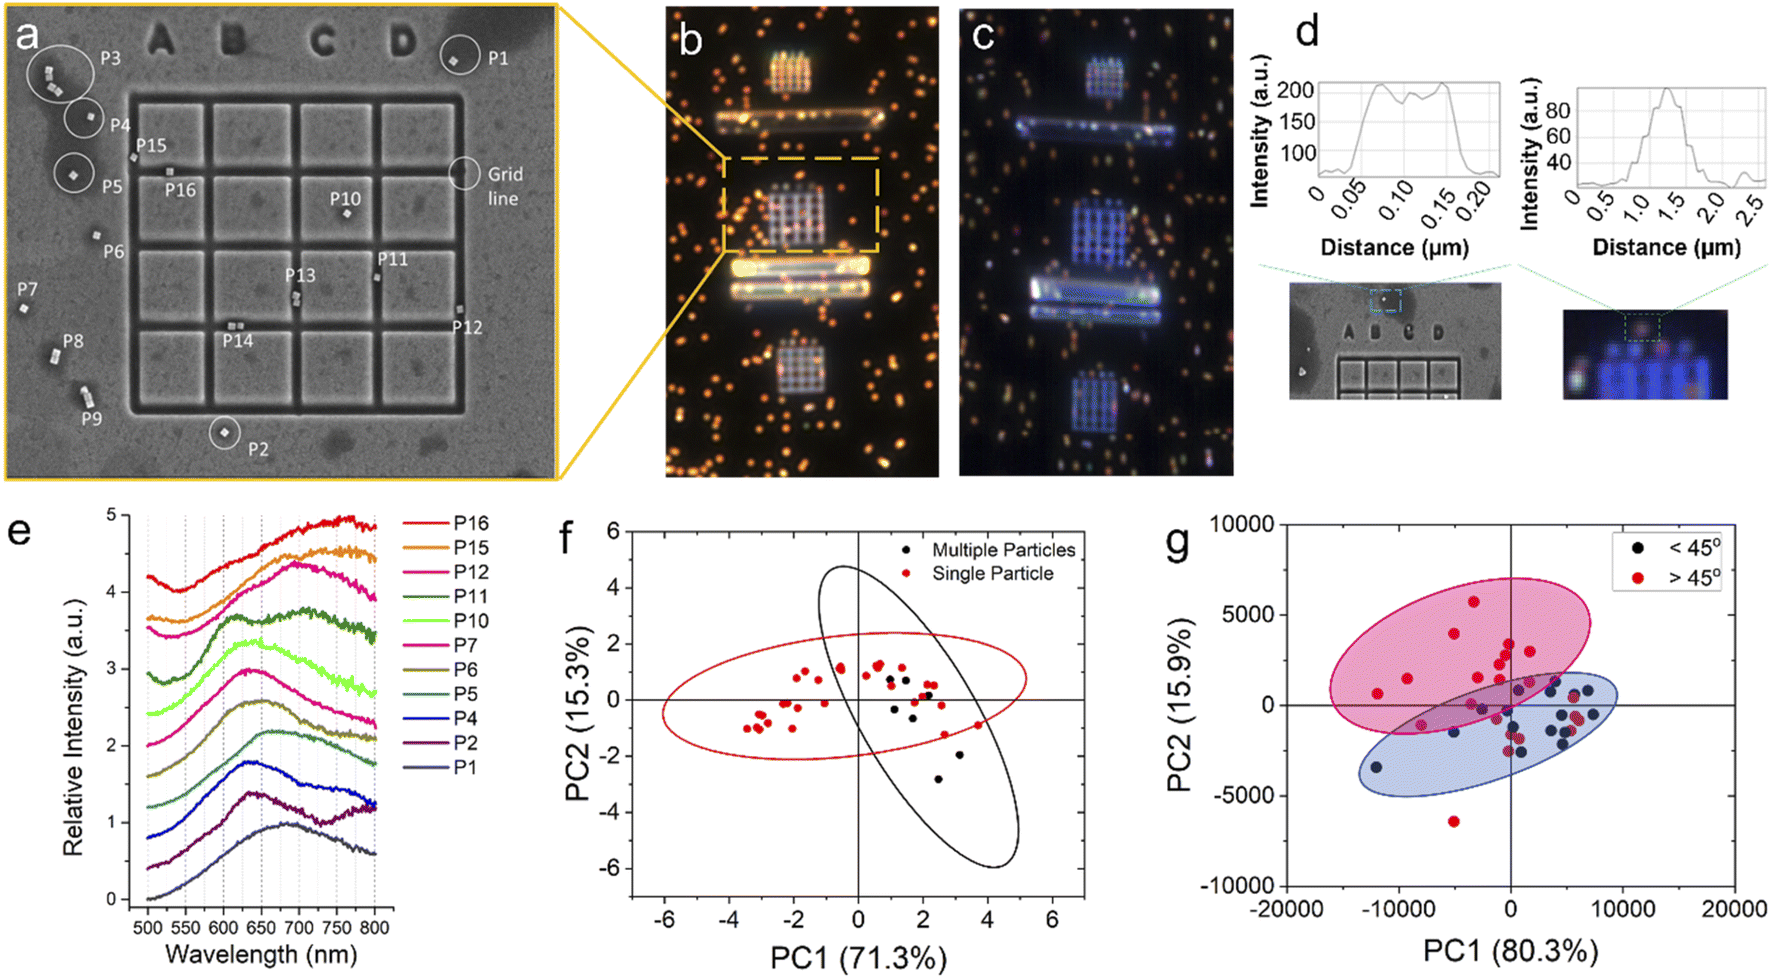 | ||
| Fig. 3 (a) SEM image of the ITO-coated glass substrate patterned using FIB milling. P1–P16 are the nanoparticles marked in the SEM image for which darkfield, hyperspectral image, and scattering spectra are taken; (b) dark-field optical image of three different grids with several nanocubes on and near them. A subset of this image is shown in (a); (c) dark-field hyperspectral image of the nanocubes shown in (b); (d) Comparison of the linewidth of pixels across a single nanoparticle as captured in SEM (FWHM ∼100 nm) and of the same nanoparticle as it appears in the diffraction-limited hyperspectral dataset image (FWHM ∼500 nm); (e) scattering spectra obtained from the hyperspectral images for the particles numbered P1–P16 in (a); (f) PCA analysis of the single particle spectra as compared to spectra obtained from a cluster of more than one particle; (g) PCA analyses of the scattering spectra for particles with angles θ <45° and θ >45°. | ||
Fig. 4a shows an example of two nanocubes with different orientation, their corresponding hyperspectral images, and their scattering spectra. It shows the spectral distribution of the scattered light from a single nanocube particle. We have analyzed more than 100 nanocubes (see Fig. S2†). We observe that the peak values lie between 652–657 nm when the orientation of the nanocubes is ∼67.5° or 22.5°, whereas the peak values lie between 630–635 nm when the orientation of the nanocubes is ∼0° or 45°. We observe redshifts of ∼12–15 nm in the peak of the spectra for particles that are oriented with 15°< θ <35° and 60°< θ <80°with respect to the spectrum obtained at θ = 0°. We observe that particles with orientation θ and (90° − θ) show similar scattering spectra. The FDTD simulation results (Fig. 4c and d) match with the experimental spectra shown in Fig. 4b. Finally, we correlate the angles obtained from the SEM images for 44 nanocubes with the scattering spectra obtained using the hyperspectral microscope (Fig. 4e). The predicted angle for the scattering peak using FDTD is plotted against the experimental angle in Fig. 4f. The results showed Pearson's correlation r = 0.86, indicating good correlation48 between the experimental and predicted results. The Pearson correlation coefficient (PCC)49,50 measures the extent of linear correlation between two data sets. The close correspondence between FDTD simulation and experimental results indicates that a hyperspectral system coupled with simulated spectra libraries could be used for quick, label-free and cost-efficient analysis of nanostructures.
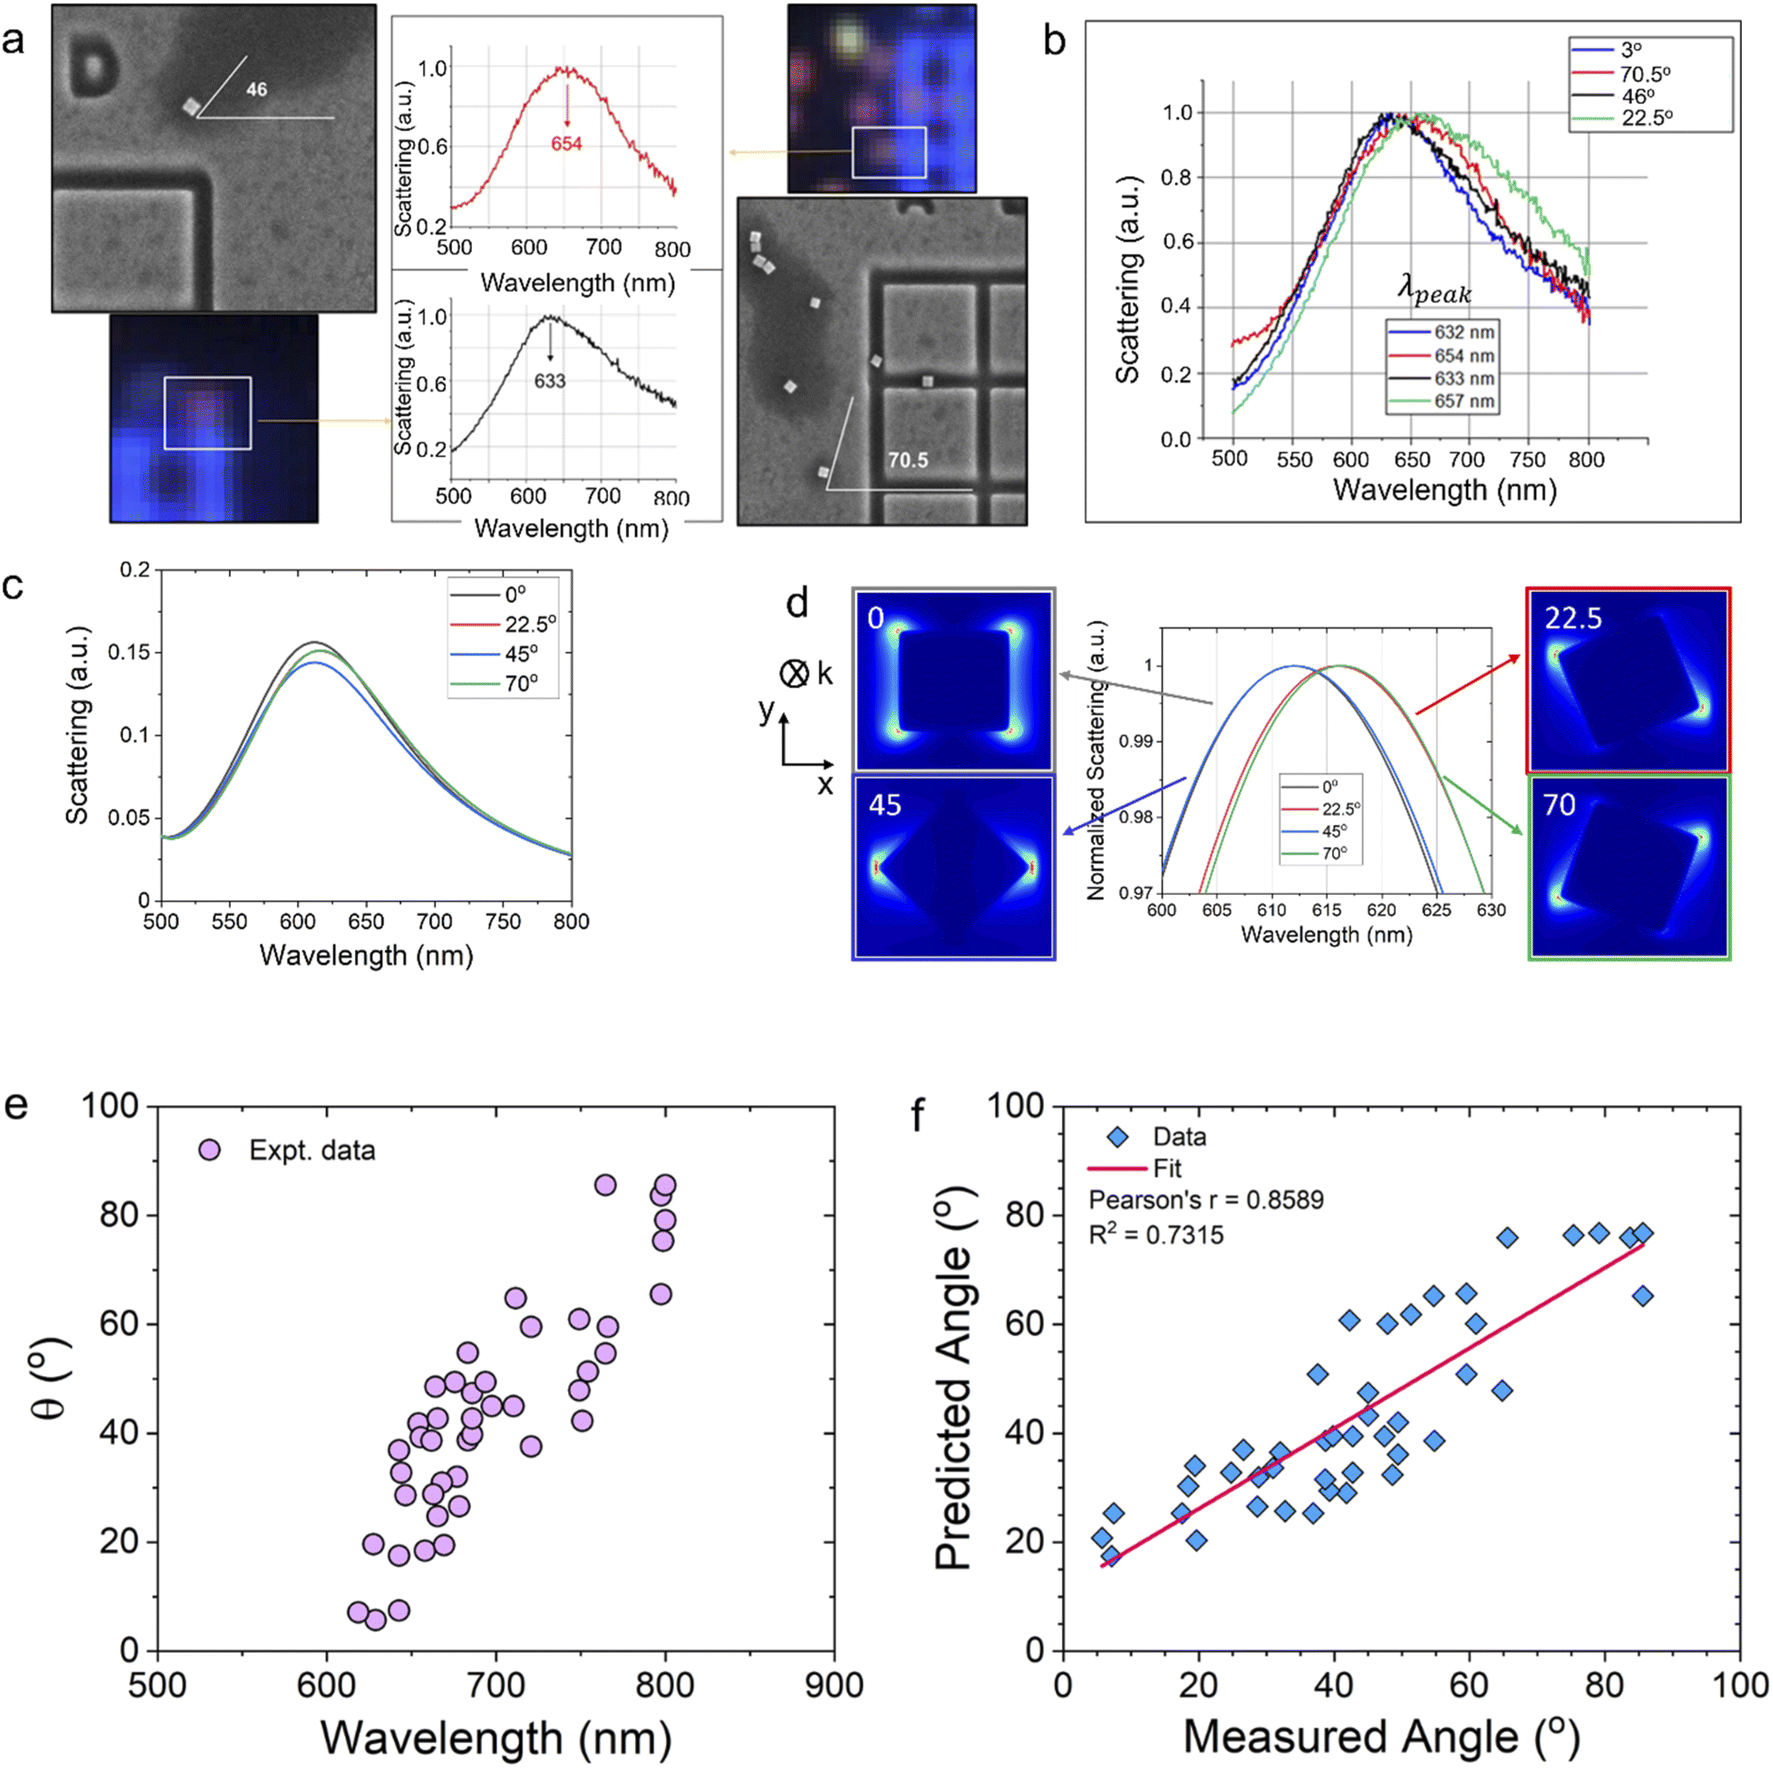 | ||
| Fig. 4 (a) SEM images showing two nanocubes with different orientation. The hyperspectral images of the nanocubes and their corresponding scattering spectra are also shown; (b) scattering spectra collected from four different nanocubes with orientation, θ = 3°, 22.5°, 46°, and 70.5°; (c) scattering spectra obtained using FDTD simulations for nanocubes with orientation θ = 0°, 22.5°, 45°, and 70° and (d) the corresponding electric field intensity distributions; (e) scattering peaks obtained from hyperspectral microscopy results and the corresponding measured angles obtained from the SEM images; (f) correlation between the measured orientation of the nanocubes using SEM images and the predicted orientation of the nanocubes using FDTD simulations for the scattering peaks shown in (e). | ||
4. Conclusions
In this study, we developed the optical imaging correspondence between hyperspectral data and scanning electron microscopy using a patterned substrate. Validation of the experimentally obtained results with FDTD numerical simulations and electron microscopy techniques allowed us to confirm the validity of our nanocube orientation assignments. We exploited the capability to probe the orientational dependence of the extinction cross section of a single nanocube. High-throughput imaging has been performed and the corresponding orientation of the nanocubes has been identified using the developed method. Furthermore, reference spectral libraries can be built and stored in order to develop a protocol for precise and high-throughput machine learning-driven analysis to determine the orientation of scattering nanoprobes.Author contributions
Nishir Mehta: Data curation; formal analysis; investigation; software; writing – original draft preparation (lead). Amirreza Mahigir: Investigation; software. Georgios Veronis: Conceptualization (supporting); resources; supervision; writing – review & editing. Manas Ranjan Gartia: Conceptualization (lead); funding acquisition; methodology; project administration; resources; supervision; writing – original draft preparation (supporting); writing – review & editing.Conflicts of interest
There are no conflicts to declare.Acknowledgements
M. R. G. acknowledge the support from National Science Foundation (NSF CAREER award number: 2045640). Scanning Electron Microscopy (SEM) and Transmission Electron Microscopy (TEM) were performed at the Shared Instrumentation Facility (SIF) at Louisiana State University.References
- G. Ciofani, Smart nanoparticles for biomedicine, Elsevier, 2018 Search PubMed.
- E. C. Dreaden, et al., The golden age: gold nanoparticles for biomedicine, Chem. Soc. Rev., 2012, 41(7), 2740–2779 RSC.
- B. F. Johnson, Nanoparticles in catalysis, Top. Catal., 2003, 24(1), 147–159 CrossRef CAS.
- H.-I. Peng and B. L. Miller, Recent advancements in optical DNA biosensors: exploiting the plasmonic effects of metal nanoparticles, Analyst, 2011, 136(3), 436–447 RSC.
- C.-S. Tsai, T.-B. Yu and C.-T. Chen, Gold nanoparticle-based competitive colorimetric assay for detection of protein–protein interactions, Chem. Commun., 2005,(34), 4273–4275 RSC.
- S. Sergiienko, et al., Nanoparticle–nanoparticle vs. nanoparticle–substrate hot spot contributions to the SERS signal: studying Raman labelled monomers, dimers and trimers, Phys. Chem. Chem. Phys., 2017, 19(6), 4478–4487 RSC.
- E. Hema, et al., A novel synthesis of Zn2+-doped CoFe2O4 spinel nanoparticles: structural, morphological, opto-magnetic and catalytic properties, J. Supercond. Novel Magn., 2015, 28(8), 2539–2552 CrossRef CAS.
- M. Lessard-Viger, et al., FRET enhancement in multilayer core–shell nanoparticles, Nano Lett., 2009, 9(8), 3066–3071 CrossRef CAS PubMed.
- L. Feng, et al., Detection of TNT based on conjugated polymer encapsulated in mesoporous silica nanoparticles through FRET, Chem. Commun., 2012, 48(38), 4633–4635 RSC.
- J. I. Chen, Y. Chen and D. S. Ginger, Plasmonic nanoparticle dimers for optical sensing of DNA in complex media, J. Am. Chem. Soc., 2010, 132(28), 9600–9601 CrossRef CAS PubMed.
- P. Nordlander, et al., Plasmon hybridization in nanoparticle dimers, Nano Lett., 2004, 4(5), 899–903 CrossRef CAS.
- R. F. Service, Nanotechnology takes aim at cancer, Science, 2005, 310(5751), 1132–1134 CrossRef PubMed.
- Y. Xia, Nanomaterials at work in biomedical research, Nat. Mater., 2008, 7(10), 758–760 CrossRef CAS PubMed.
- S. Mitragotri and J. Lahann, Physical approaches to biomaterial design, Nat. Mater., 2009, 8(1), 15–23 CrossRef CAS PubMed.
- A. E. Nel, et al., Understanding biophysicochemical interactions at the nano-bio interface, Nat. Mater., 2009, 8(7), 543–557 CrossRef CAS PubMed.
- Y. Wang, et al., Comparison study of gold nanohexapods, nanorods, and nanocages for photothermal cancer treatment, ACS Nano, 2013, 7(3), 2068–2077 CrossRef CAS PubMed.
- W. Hu, et al., Vertical Orientation Probability Matters for Enhancing Nanoparticle-Macrophage Interaction and Efficient Phagocytosis, Small Methods, 2022, 2101601 CrossRef CAS PubMed.
- H.-Y. Lou, et al., Membrane curvature underlies actin reorganization in response to nanoscale surface topography, Proc. Natl. Acad. Sci. U. S. A., 2019, 116(46), 23143–23151 CrossRef CAS PubMed.
- J. A. Champion and S. Mitragotri, Role of target geometry in phagocytosis, Proc. Natl. Acad. Sci. U. S. A., 2006, 103(13), 4930–4934 CrossRef CAS PubMed.
- K. Yang and Y.-Q. Ma, Computer simulation of the translocation of nanoparticles with different shapes across a lipid bilayer, Nat. Nanotechnol., 2010, 5(8), 579–583 CrossRef CAS PubMed.
- K. Yang, B. Yuan and Y.-q. Ma, Influence of geometric nanoparticle rotation on cellular internalization process, Nanoscale, 2013, 5(17), 7998–8006 RSC.
- H. Herd, et al., Nanoparticle geometry and surface orientation influence mode of cellular uptake, ACS Nano, 2013, 7(3), 1961–1973 CrossRef CAS PubMed.
- R. Vácha, F. J. Martinez-Veracoechea and D. Frenkel, Receptor-mediated endocytosis of nanoparticles of various shapes, Nano Lett., 2011, 11(12), 5391–5395 CrossRef PubMed.
- X. He, K. Wang and Z. Cheng, In vivo near-infrared fluorescence imaging of cancer with nanoparticle-based probes, Wiley Interdiscip. Rev.: Nanomed. Nanobiotechnol., 2010, 2(4), 349–366 CAS.
- Y. Liu, Y.-c. Tseng and L. Huang, Biodistribution studies of nanoparticles using fluorescence imaging: a qualitative or quantitative method?, Pharm. Res., 2012, 29(12), 3273–3277 CrossRef CAS PubMed.
- S. Pal, et al., Surface Spin Disorder in Fe $ _ {3} $ O $ _ {4} $ Nanoparticles Probed by Electron Magnetic Resonance Spectroscopy and Magnetometry, IEEE Trans. Magn., 2007, 43(6), 3091–3093 CAS.
- O. L. Monti, J. T. Fourkas and D. J. Nesbitt, Diffraction-limited photogeneration and characterization of silver nanoparticles, J. Phys. Chem. B, 2004, 108(5), 1604–1612 CrossRef CAS.
- M. Seydack, Nanoparticle labels in immunosensing using optical detection methods, Biosens. Bioelectron., 2005, 20(12), 2454–2469 CrossRef CAS PubMed.
- D. P. O'Neal, et al., Photo-thermal tumor ablation in mice using near infrared-absorbing nanoparticles, Cancer Lett., 2004, 209(2), 171–176 CrossRef PubMed.
- A. Tcherniak, et al., One-photon plasmon luminescence and its application to correlation spectroscopy as a probe for rotational and translational dynamics of gold nanorods, J. Phys. Chem. C, 2011, 115(32), 15938–15949 CrossRef CAS.
- H. Wang, et al., In vitro and in vivo two-photon luminescence imaging of single gold nanorods, Proc. Natl. Acad. Sci. U. S. A., 2005, 102(44), 15752–15756 CrossRef CAS PubMed.
- S. Hashimoto, D. Werner and T. Uwada, Studies on the interaction of pulsed lasers with plasmonic gold nanoparticles toward light manipulation, heat management, and nanofabrication, J. Photochem. Photobiol., C, 2012, 13(1), 28–54 CrossRef CAS.
- T. Li, et al., Three-dimensional orientation sensors by defocused imaging of gold nanorods through an ordinary wide-field microscope, ACS Nano, 2012, 6(2), 1268–1277 CrossRef CAS PubMed.
- C. Sönnichsen and A. P. Alivisatos, Gold nanorods as novel nonbleaching plasmon-based orientation sensors for polarized single-particle microscopy, Nano Lett., 2005, 5(2), 301–304 CrossRef PubMed.
- S. Biswas, et al., Orientation sensing with color using plasmonic gold nanorods and assemblies, J. Phys. Chem. Lett., 2012, 3(18), 2568–2574 CrossRef CAS PubMed.
- Y. Huang and D.-H. Kim, Dark-field microscopy studies of polarization-dependent plasmonic resonance of single gold nanorods: rainbow nanoparticles, Nanoscale, 2011, 3(8), 3228–3232 RSC.
- N. Mehta, et al., Dark-field hyperspectral imaging for label free detection of nano-bio-materials, Wiley Interdiscip. Rev.: Nanomed. Nanobiotechnol., 2021, 13(1), e1661 CAS.
- J. Hu, et al., Single-nanoparticle orientation sensing by deep learning, ACS Cent. Sci., 2020, 6(12), 2339–2346 CrossRef CAS PubMed.
- S. Kawata, Y. Inouye and P. Verma, Plasmonics for near-field nano-imaging and superlensing, Nat. Photonics, 2009, 3(7), 388–394 CrossRef CAS.
- R. C. Weast, M. J. Astle and W. H. Beyer, CRC handbook of chemistry. Physics, CRC Press, Boca Raton 1988, p. 151 Search PubMed.
- N. Khlebtsov, L. Trachuk and A. Mel’nikov, The effect of the size, shape, and structure of metal nanoparticles on the dependence of their optical properties on the refractive index of a disperse medium, Opt. Spectrosc., 2005, 98(1), 77–83 CrossRef CAS.
- W. L. Barnes, A. Dereux and T. W. Ebbesen, Surface plasmon subwavelength optics, nature, 2003, 424(6950), 824–830 CrossRef CAS PubMed.
- C. Wu, et al., Surface modification of indium tin oxide by plasma treatment: An effective method to improve the efficiency, brightness, and reliability of organic light emitting devices, Appl. Phys. Lett., 1997, 70(11), 1348–1350 CrossRef CAS.
- R. Gautam, et al., Review of multidimensional data processing approaches for Raman and infrared spectroscopy, EPJ Techniques and Instrumentation, 2015, 2(1), 1–38 CrossRef.
- J. R. Beattie and F. W. Esmonde-White, Exploration of principal component analysis: deriving principal component analysis visually using spectra, Appl. Spectrosc., 2021, 75(4), 361–375 CrossRef CAS PubMed.
- N. Mehta, et al., Multimodal Label-Free Monitoring of Adipogenic Stem Cell Differentiation Using Endogenous Optical Biomarkers, Adv. Funct. Mater., 2021, 31(43), 2103955 CrossRef CAS PubMed.
- E. Ikponmwoba, et al., A Machine Learning Framework for Detecting COVID-19 Infection Using Surface-Enhanced Raman Scattering, Biosensors, 2022, 12(8), 589 CrossRef PubMed.
- M. M. Mukaka, A guide to appropriate use of correlation coefficient in medical research, Malawi Medical Journal, 2012, 24(3), 69–71 CAS.
- J. Adler and I. Parmryd, Quantifying colocalization by correlation: the Pearson correlation coefficient is superior to the Mander's overlap coefficient, Cytometry, Part A, 2010, 77(8), 733–742 CrossRef PubMed.
- K. W. Dunn, M. M. Kamocka and J. H. McDonald, A practical guide to evaluating colocalization in biological microscopy, Am. J. Physiol.: Cell Physiol., 2011, 300(4), C723–C742 CrossRef CAS PubMed.
Footnote |
| † Electronic supplementary information (ESI) available. See https://doi.org/10.1039/d2na00469k |
| This journal is © The Royal Society of Chemistry 2022 |