
 Open Access Article
 This Open Access Article is licensed under a
 Creative Commons Attribution 3.0 Unported Licence
Impact of bismuth-doping on enhanced radiative recombination in lead-free double-perovskite nanocrystals†
Xiaoyu
Huang
 ab,
Yoshitaka
Matsushita
c,
Hong-Tao
Sun
a and
Naoto
Shirahata
*abd
ab,
Yoshitaka
Matsushita
c,
Hong-Tao
Sun
a and
Naoto
Shirahata
*abd
aInternational Center for Materials Nanoarchitectonics (MANA), National Institute for Materials Science (NIMS), Ibaraki 305-0044, Japan. E-mail: SHIRAHATA.Naoto@nims.go.jp
bGraduate School of Chemical Sciences and Engineering, Hokkaido University, Sapporo 060-0814, Japan
cResearch Network and Facility Services Division, National Institute for Materials Science (NIMS), Ibaraki 305-0047, Japan
dDepartment of Physics, Chuo University, Tokyo 112-8551, Japan
First published on 24th June 2022
Abstract
Lead-free double-perovskite nanocrystals (NCs) have received considerable attention as promising candidates for environmentally friendly optical applications. Furthermore, double-perovskite nanostructures are known to be physically stable compared to most other inorganic halide perovskites, with a generic chemical formula of ABX3 (e.g., A = Cs+; B = Sn2+ or Ge2+; X = Cl−, Br−, I−, or their combination). However, relevant experimental studies on the photophysical properties are still insufficient for Pb-free double-perovskite NCs. Herein, we synthesized Cs2Ag0.65Na0.35InCl6 NCs doped with bismuth (Bi3+) ions and investigated their photophysical properties to reveal the role of the dopant on the enhanced photoemission properties. Specifically, it was found that the photoluminescence quantum yield (PLQY) increased up to 33.2% by 2% Bi-doping. The optical bandgap of the NCs decreased from 3.47 eV to 3.41 eV as the amount of the dopant increased from 2% to 15%. To find out the effect of Bi-doping, the temperature-dependent PL properties of the undoped and doped NCs were investigated by utilizing steady-state and time-resolved PL spectroscopy. With increasing the temperature from 20 K to 300 K, the PL intensities of the doped NCs decreased slower than the undoped ones. The correlated average PL lifetimes of both the bismuth-doped and undoped NCs decreased with increasing the temperature. The experimental results revealed that all the NC samples showed thermal quenching with the temperature increasing, and the PL quenching was suppressed in bismuth-doped NCs.
1. Introduction
Lead halide perovskite (LHP) nanocrystals (NCs) APbX3 (A = Cs+, CH3NH3+ or NH2HCNH2+, X = Cl−, Br− or I−) have become up-and-coming materials in various optoelectronic applications, including light-emitting devices,1–6 solar cells,7–12 photodetectors,13–17 photocatalysis,18–20 and lasers,21–23 which is attributed to their distinguished optical and electrical properties, such as high defect tolerance,24,25 high photoluminescence (PL) quantum yield (QY),26–28 tunable bandgap,29,30 high color purity,31,32 high carrier mobility, large diffusion length,33 and high absorption coefficient,34 as well as solution processability.35,36 Despite the many above-mentioned advantages, the toxicity and instability of lead halide perovskite NCs are still a concern and represent a non-negligible hindrance toward their practical applications.37,38To surmount these obstacles, stable and environmentally friendly perovskite compositions are urgently desired. To replace Pb2+, the obvious approach is to use Sn2+ and Ge2+ because of their similar electronic properties.39,40 However, Sn2+- and Ge2+-based halide perovskites are quite unstable and are easily oxidized to Sn4+ and Ge4+. Additionally, trivalent cations Bi3+ and Sb3+ halide perovskites have also been studied,41 but compounds with the chemical formula A3B2X9 have shown unfavorable properties, such as a large bandgap and low defect tolerance.42 In particular, replacing two Pb2+ ions with a combination of monovalent and trivalent cation could be one solution for forming three-dimensional (3D) perovskite structures, whose chemical formula is A2B(I)B(III)X6, which is called the double-perovskite structure. For instance, Cs2AgBiCl6 and Cs2AgInCl6 compounds have shown good photophysical characteristics after effective alloying or doping engineering.43,44
Among the reported lead-free double-perovskite materials, it has been reported recently that the bulk crystals of alloyed Cs2AgxNa1−xInCl6:Bi double perovskites show a high PLQY of 86 ± 5% with self-trapped exciton (STE) emitting warm white light.45 STE is normally formed by fast self-trapped excitons in materials that possess a soft lattice and strong exciton-coupling characteristics, such as halide crystals46 and organic molecular crystals,47 wherein the excitons relax back to the ground state by emitting photons with a broad band and large Stokes shift after being trapped; therefore the emission energy of an STE is smaller than the bandgap (Scheme 1).48 In 2022, Bi3+-doped Cs2Ag0.4Na0.6InCl6 microcrystals (∼10 μm) with a remarkable high PLQY of 97.33% were achieved by Peng et al. through a precipitation approach.43 Since then, double-perovskite NCs have also become a potential material for single-emitter layers applied in optical applications.49
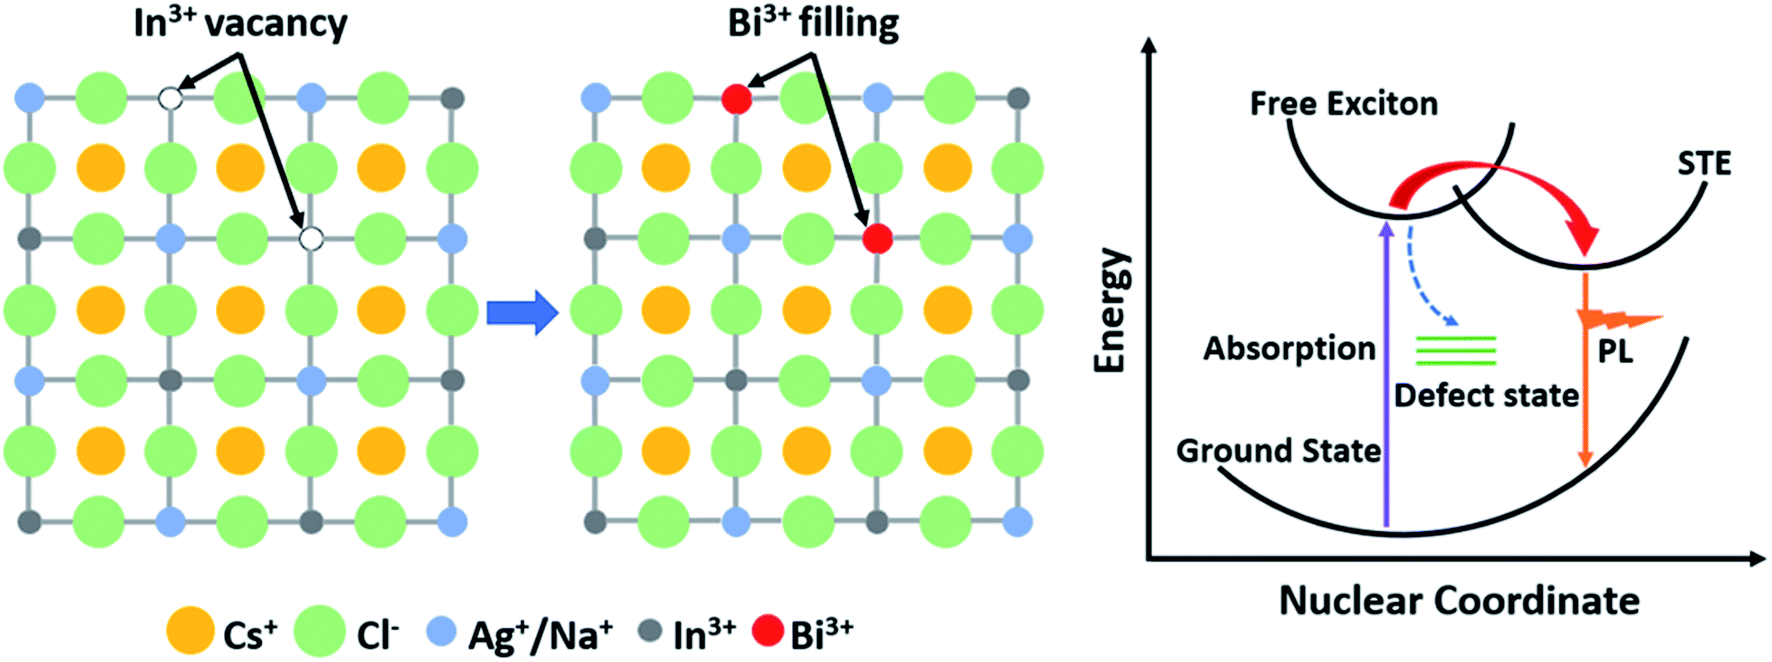 | ||
| Scheme 1 Schematic diagram of the Bi-doping effect and proposed self-trapped emission. | ||
Colloidal perovskite NCs terminated with surfactant ligands for high dispersibility in non-polar solvents are promising for optoelectronic applications, due to their convenient deposition on substrates based on solution processes.50 Thereafter, for further enhancing the practicality in applications, there are efforts being directed toward the colloidal synthesis of double-perovskite NCs.51–53 More recently, Hu et al. synthesized white light-emitting Cs2Ag0.17Na0.83In0.88Bi0.12Cl6 NCs with a PLQY of 64% by elemental ratio optimization and ligand passivation.54 In the double-perovskite structure system, it has been reported that Bi-doping is responsible for the increased PLQY.51,55,56 For the underlying mechanism of improving the PLQY through doping bismuth, there are several reported viewpoints: one is defect passivation as proved by the comparison of PL lifetimes, and another is that exciton localization is promoted after Bi-doping, which was concluded from theoretical simulations.45 Theory predicts the radiative recombination of photogenerated carriers in the Bi–Ag centers providing that the Bi cations are present in only a small amount.53 However, understanding and designing the experimentally fundamental photophysical properties of Bi-doped double-perovskite NCs, which could be favorable for understanding the doping effect, are still challenging themes.
A temperature-dependent PL study was established to discuss the nonradiative relaxation processes and electron–phonon interactions in the quantum dots of semiconductors.57–59 In the present study, we used the temperature-dependent PL approach to reveal the possible excitation and emission mechanism arising from the doping of Bi3+ ions in Cs2Ag0.65Na0.35InCl6 NCs. Changes in the PL intensity and linewidth as a function of temperature were measured to gain insights into the carrier relaxation and electron–phonon coupling processes. Additionally, the temperature-dependent time-resolved PL spectra of the NCs were measured. Furthermore, the structural characterizations of the NCs at different temperatures were analyzed by the low-temperature X-ray diffraction (LT-XRD) technique to clarify the crystal-phase condition with varying the temperature.
2. Experimental
2.1 Reagents and chemicals
All the reagents were used without further purification. Cesium acetate (CsOAc, 99.99%), silver acetate (AgOAc, 99%), sodium acetate (NaOAc, 99.99%), indium(III) acetate (In(OAc)3, 99.99%), bismuth(III) acetate (Bi(OAc)3, 99.99%), chlorotrimethylsilane (TMSCl, 98%), oleic acid (OA, 90%), and 1-octadecane (ODE, 95%) were purchased from Sigma-Aldrich. Oleylamine (OAm, 80–90%) was purchased from Kanto Kagaku. Toluene (99.5%), hexane (96%), and ethyl acetate (99.5%) were purchased from Wako Chemicals.2.2 Preparation of Cs2Ag0.65Na0.35In1−xBixCl6 NCs
The NCs were fabricated following a modified version of the hot-injection method reported by Han and co-workers.52 In a typical synthesis, 1.3 mmol CsOAc, 0.36 mmol AgOAc, 0.54 mmol NaOAc, 1.98 mmol In(OAc)3, and 0.02 mmol Bi(OAc)3 were loaded in a 50 mL three-neck flask containing 5.6 mL OA, 1.4 mL OLA, and 20 mL ODE, after degassing for 1 h at 110 °C, and then heated to 165 °C in 12 min under a N2 flow. Next, 0.8 mL TMSCl was injected quickly, with the temperature increasing for 2 min longer, and then the production was rapidly cooled down to 25 °C by placing in an ice-water bath. The resultant NCs were centrifuged at 9000 rpm for 20 min and washed with toluene to remove any unreacted precursors. Then, the collected precipitate was further dispersed in hexane, and thereafter the resultant solution was centrifuged at 6000 rpm for 15 min and the supernatant was collected. The same volume of ethyl acetate was added for the final centrifugation, and the final precipitate was collected and vacuum-dried for further characterization.2.3 Characterization
The powder samples with different Bi-doping amounts were analyzed using a JASCO V-650 UV-visible spectrometer. High-resolution transmission electron microscopy (HR-TEM) characterization was performed using a JEM-2100F2 instrument (JEOL) at 200 kV acceleration voltage. Scanning transmission electron microscopy energy dispersive spectroscopy (STEM-EDS) was utilized for the element analysis. Samples for the TEM analysis were prepared by drop-casting the 0.1 mg mL−1 hexane solution of NCs onto carbon-coated copper grids. PLQYs were measured at room temperature using the absolute PLQY spectrometer C11347-11 from Hamamatsu Photonics Co. Ltd with a 150 W xenon light source coupled to a monochromator for wavelength discrimination, an integrating sphere as a sample chamber, and a multichannel spectroscope for signal detection. The powder forms of the specimens of NCs were used for the characterization of the PLQY. The PL properties were measured with the powder samples pressed and coated onto the interlayer between two 1 cm × 1 cm quartz glasses. Measurements were conducted using a modular double-grating Czerny–Turner monochromator and an iHR 320 emission monochromator (1200 lines per mm of gratings) coupled to a photodetector on a NanoLog Horiba Jobin Yvon spectrofluorometer with a 450 E Xe arc lamp. The value of photon power for the excitation estimated using a power meter (PD 300, Ophir Optronics Solutions Ltd and NOVA II display) was 0.014 mW cm−2. To measure the temperature-dependent PL spectra, the samples were placed inside a cryostat holder connected to a Gifford–McMahon cooler and controlled by a Mercury iTC temperature controller. The temperature was tuned from 3 K to 300 K with 20 K per step. The LT-XRD characterization in the temperature range between 5 K and 300 K was carried out using a Rigaku SmartLab system (9 kW, Cu Kα1) equipped with a cryostat attachment, where the sample was tightly attached using Apiezon-N grease on a copper sample holder.3. Results and discussion
Bi-doped and undoped Cs2Ag0.65Na0.35InCl6 NCs were synthesized by the modified hot-injection method.52 Here, PeNC0, PeNC1, and PeNC10 represent Cs2Ag0.65Na0.35InCl6 double-perovskite NCs with 0%, 1%, and 10% Bi precursor concentration, respectively. The STEM-EDS analysis revealed that the final products of PeNC1 and PeNC10 had 2% and 15% Bi. It should be noted that all the composition values stand for the actual value for the results that we obtained from STEM-EDS as listed in Table S1.† The atom ratios of Cs/In and Cl/In showed the ranges of 2.32–2.48 and 4.86–5.61, respectively. This deviation with the feeding ratio was reasonable compared with other double-perovskite nanocrystals.60,61 On the one hand, the large ratio of Cs/In might be caused by the indium vacancies in this structure, and this ratio decreased with the increasing bismuth amount. Meanwhile, the elemental ratio deviation was also found in Cs2AgBiCl6, whereas the ratios were 2.25 and 20 for Cs/Ag and Cl/Ag, respectively.60 However, the cause of the large ratio on Cl/In has not been clearly clarified yet, and needs to be investigated in future work. HR-TEM images of Cs2Ag0.65Na0.35InCl6 NCs showed that the crystals had a cubic structure. As shown in Fig. 1c–e, the average sizes of PeNC0, PeNC1, and PeNC10 were 10.45 ± 1.97, 10.03 ± 1.72, and 10.01 ± 1.68 nm, respectively. Their sizes were quite close to each other. Based on that, the particle size difference was not considered in the subsequent discussion of the optical properties. Additionally, the corresponding measured lattice distances were 3.71, 3.71, and 3.63 Å, which were in accord with the (220) planes in Cs2Ag0.65Na0.35InCl6 NCs, as shown by XRD in the following part. The XRD patterns of Cs2Ag0.65Na0.35InCl6 NCs matched well with the cubic double-perovskite structure (Cs2AgInCl6 ICSD code 1546186, Cs2NaInCl6 ICSD code 4003575) in all three samples, and no impurity phases were observed (see Fig. 1b), which demonstrated the good phase stability of the Cs2Ag0.65Na0.35InCl6 double-perovskite. Comparing the XRD pattern of PeNC1 with that of PeNC10, we could see a small shift of the 220 peak from 23.9° to 23.8° with increasing the bismuth amount from 2% to 15%, which was possibility due to the lattice expansion resulting from the substitution of Bi3+ ions (117 pm) for In3+ ions (92 pm) in the cubic lattice.62 Cs2Ag0.65Na0.35InCl6 NCs with a higher concentration of Bi-dopant were also synthesized, and the lattice parameters of NCs as a function of the Bi-dopant concentration (see Fig. S1†) were investigated, which showed that when the Bi amount increased, the crystal structure of the NCs obeyed Vegard's law,63 and there was no impurity phase or phase separation.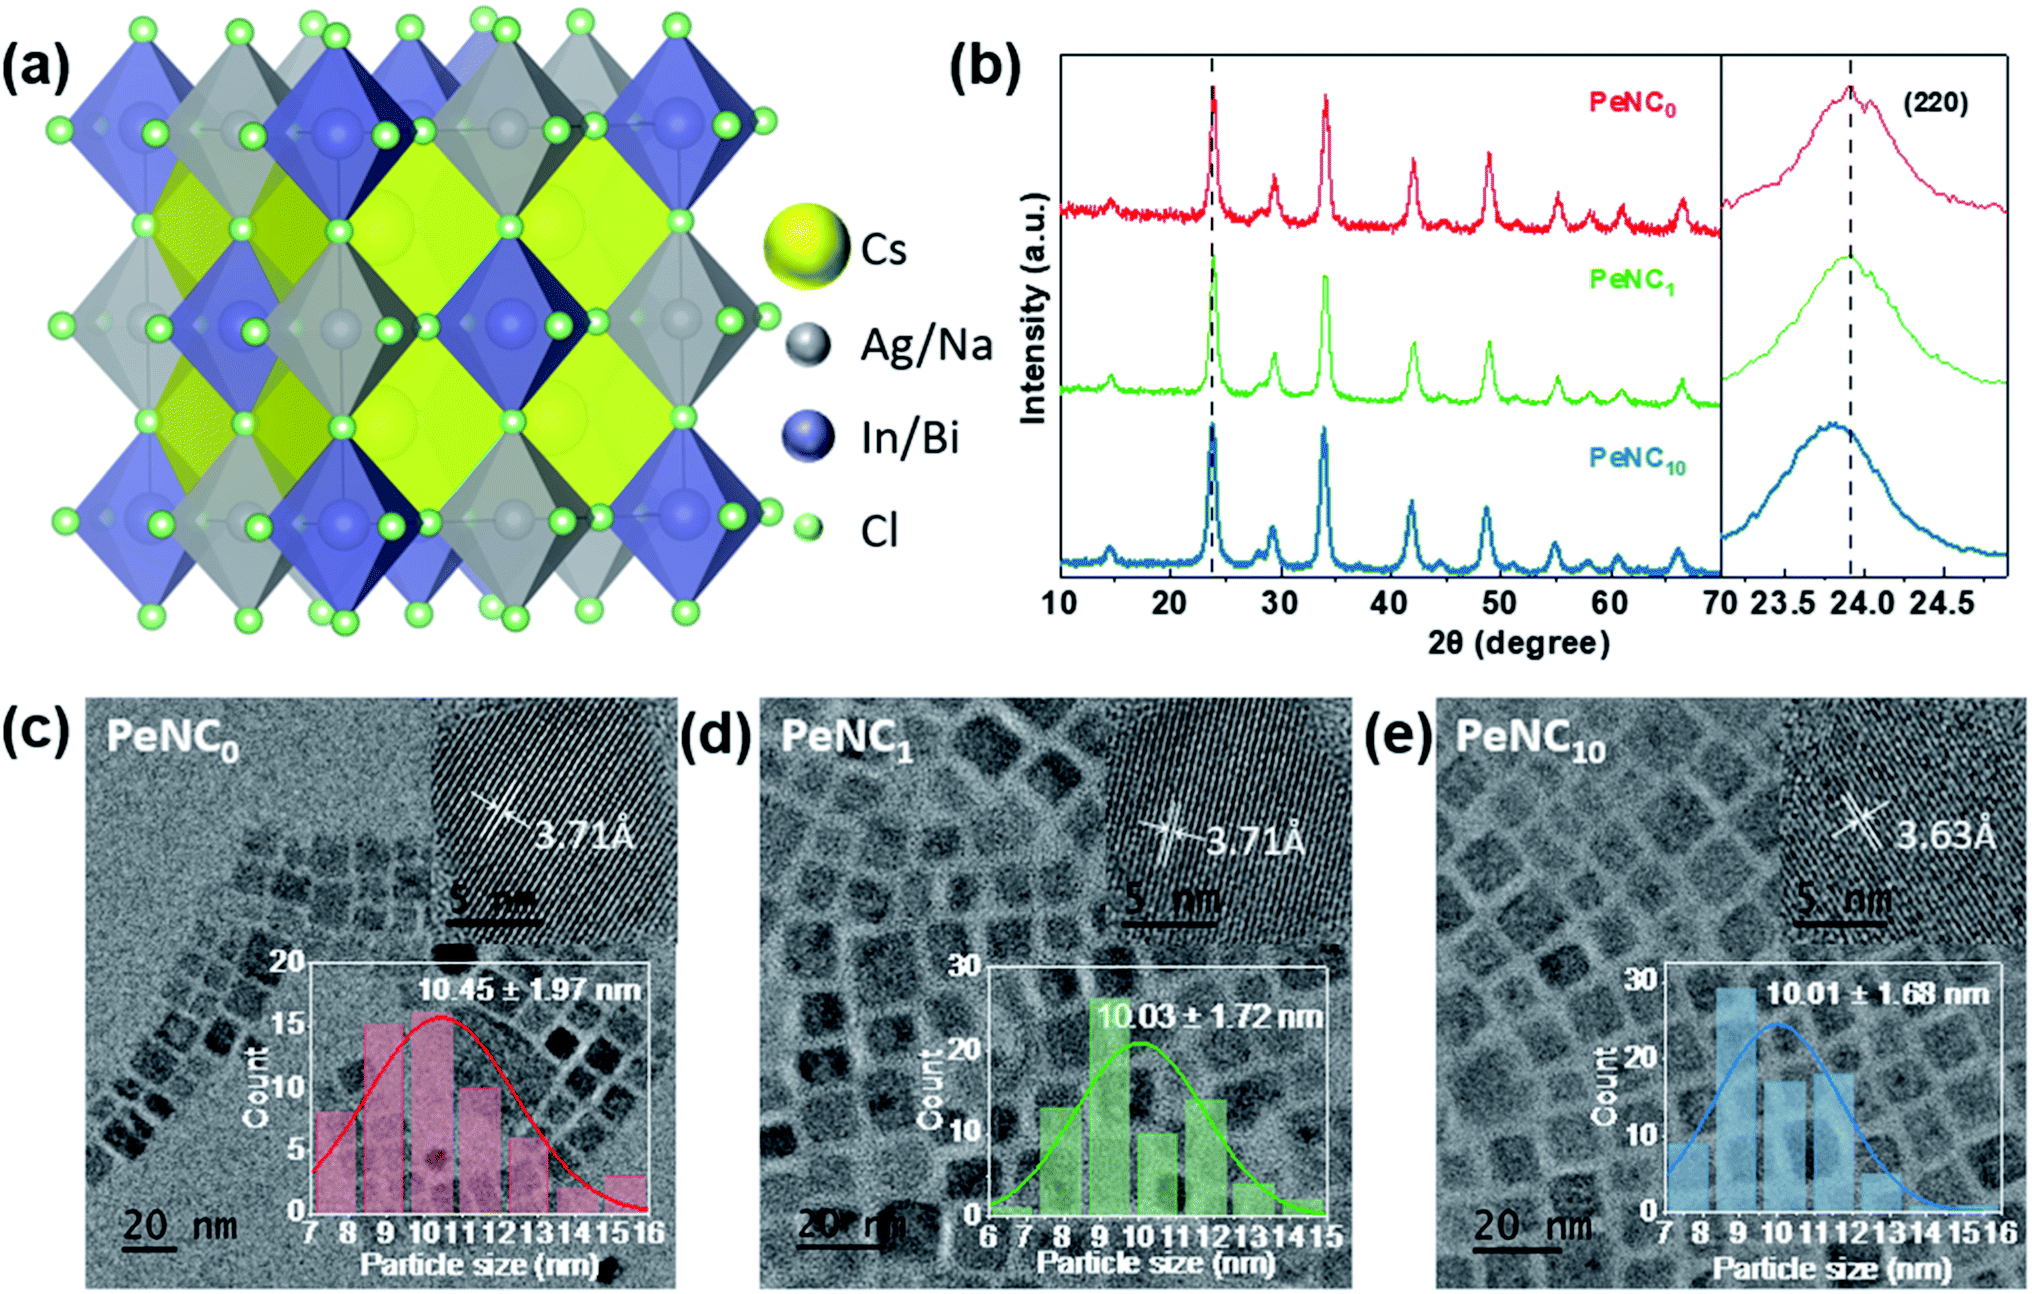 | ||
| Fig. 1 Crystal structure of Cs2Ag1−xNaxIn1−yBiyCl6 double perovskite. Yellow, silver, purple, and green spheres represent Cs, Ag/Na, In/Bi, and Cl atoms, respectively. (b) X-ray diffraction (XRD) patterns measured at room temperature of PeNCx (Cs2Ag0.65Na0.35In1−x%Bix%Cl6, x = 0, 1, 10) and the enlarged XRD patterns of the samples between 23° and 25°. Transmission electron microscopy (TEM) images of (c) PeNC0, (d) PeNC1, and (e) PeNC10. The scale bar is 20 nm. The inset in the top-right corner is the high-resolution TEM image, whose scale bar is 5 nm. The inset in the bottom right corner is the size-distribution histogram. | ||
It is common that structural phase transition happens in lead halide perovskite NCs under low temperature, which is caused by size effects or doping effects.64–66 A phase transition from tetragonal- to cubic structures has been observed at 122 K for Cs2AgBiBr6 which is one of the double-perovskite crystals.67 Such a temperature-dependent phase transition influences adversely the device performance in some cases. To investigate the structural stability of the Cs2Ag0.65Na0.35InCl6 NCs when the temperature varies, LT-XRD measurements were performed. For the LT-XRD measurements between 5 K and 300 K, the PeNC0, PeNC1, and PeNC10 samples were selected (see Fig. 2a–c). All the LT-XRD patterns of the doped samples were found to be similar to that of the undoped sample. The absence of additional peaks appeared over the whole temperature range for the doped samples. This indicates that the phase stayed in the cubic phase, implying a good crystallinity and purity. At 5 K, when the Bi amount increased to 2%, the diffraction lines of the PeNC1 showed a relative shift compared to that of the PeNC0, with the 15% Bi-doped PeNC10 showing a 0.22° smaller shift than PeNC0, which was consistent with the characteristics shown at room temperature (see Fig. S2†). On the temperature dependence, all the XRD peaks shifted toward a smaller diffraction angle with increasing the temperature, possibly due to a lattice expansion. The experimental data of the lattice constant were fitted by a second-order polynomial, as shown in Fig. S3.† The linear coefficient of thermal expansions for PeNC0, PeNC1, and PeNC10 was found to be 1.71 × 10⁻⁵/K, 1.27 × 10⁻⁵/K, and 1.52 × 10⁻⁵/K, respectively. The results from these calculations indicated that the doped sample changed slowly with temperature, which would permit high thermal stability for their target applications.
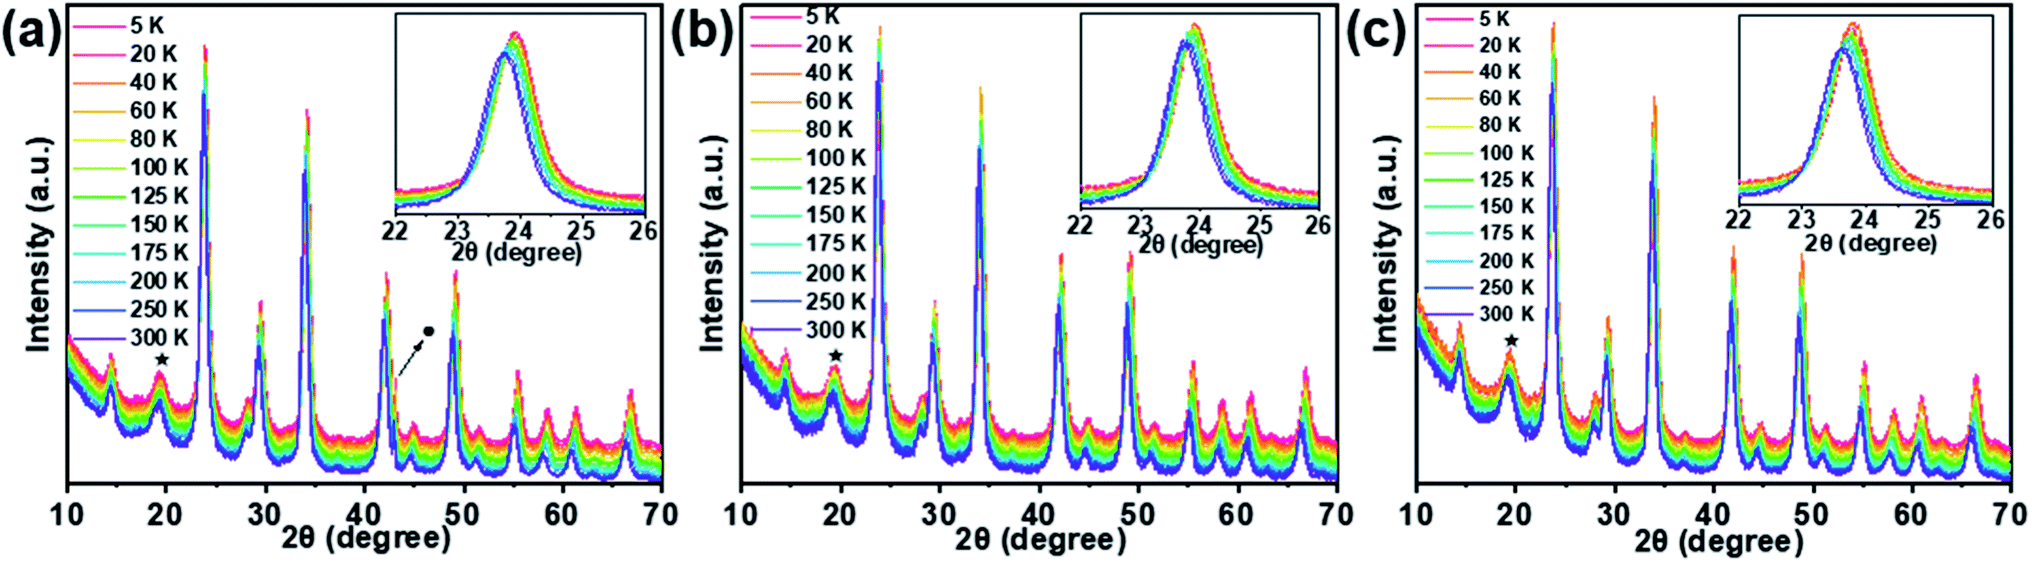 | ||
| Fig. 2 LT-XRD patterns of (a) PeNC0, (b) PeNC1, and (c) PeNC10 in the temperature range from 5–300 K. Peaks indicated as ★ and ● are from the X-ray window materials of the cryostat and from the Cu sample holder, respectively. | ||
The optical properties of Cs2Ag0.65Na0.35InCl6 NCs were studied by UV-Vis and PL spectroscopies. Also, the resultant optical absorption and PL spectra of the Cs2Ag0.65Na0.35InCl6 NC samples were determined and are shown in Fig. 3. Cation doping has complicated impacts on the perovskite nanocrystals because even a very small substitution of In3+ by Bi3+ would greatly affect the bandgap and exciton radiation channel. For the undoped sample PeNC0, the conduction band minimum (CBM) was mainly contributed by In-5s and Cl-3p, and the valence band maximum (VBM) was contributed by Ag-4d and Cl-3p.45 When Bi3+ ions were doped into the NCs, it was noted that an additional excitonic absorption peak was presented near 3.7 eV, which was attributed to band-edge absorption where Bi could be the localization center for electrons at the conduction band edges.55,68 With the incremental addition of Bi ions from 2% to 15%, the optical bandgap estimated by the Tauc plots (Fig. S4†) narrowed from 3.47 eV to 3.41 eV, which was caused by the lower CBM of the p-orbital derived from Bi cations.69 The excitation energy was obtained from the photoluminescence excitation (PLE) peak value (Fig. S5†). The PL spectrum of the PeNC0 was observed by excitation with 4.51 eV, while the PL spectra of PeNC1 and PeNC10 were obtained by excitation at 3.76 eV. The red-shift in the PL spectra of PeNC10 compared to PeNC1 corresponded to the narrowed bandgap. The highest PLQY of 33.2% was observed for PeNC1, while it was 3% for PeNC0 and 15.5% for PeNC10 as shown in Table 1 and Fig. S6.†
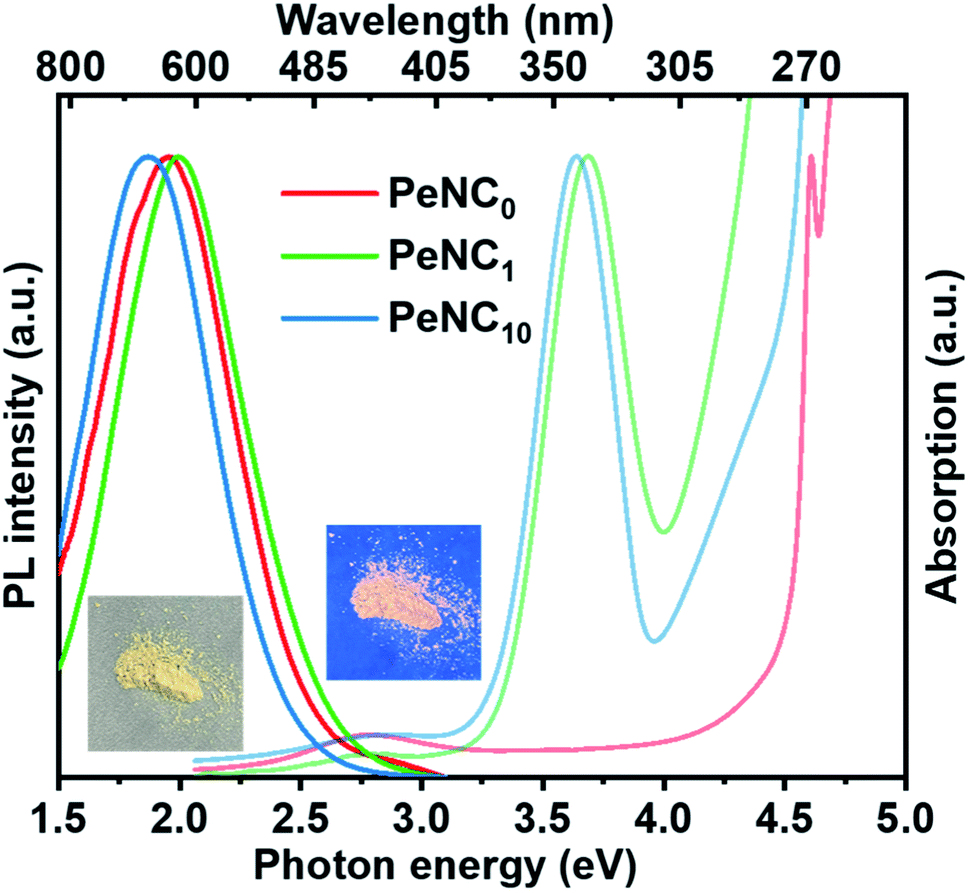 | ||
| Fig. 3 UV-Vis absorption and PL spectra of PeNC0 (λex = 275 nm), PeNC1 (λex = 330 nm), and PeNC10 (λex = 330 nm) with nanocrystals in the powder form. Photographs showing the PeNC1 powder sample under room illumination (left) and UV irradiation (right). | ||
| Sample | PLQY (%) | τ 1 (μs) (A1%) | τ 2 (μs) (A2%) | τ avg (μs) | k r (μs−1) | k nr (μs−1) | R-Square |
|---|---|---|---|---|---|---|---|
| a PLQY: photoluminescence quantum yield; τ1-short and τ2-long lifetime; A1 and A2 are the contributions for τ1 and τ2, respectively; τavg: average lifetime, which was calculated by τavg = τ1A1 + τ2A2; kr-radiative recombination rate and knr-nonradiative recombination rate, which were calculated by kr = PLQY/τavg and knr = 1/τavg − kr, respectively. | |||||||
| PeNC0 | 3 | 0.23 | — | 0.23 | 0.13 | 4.20 | 0.998 |
| PeNC1 | 33.2 | 1.10 (79%) | 7.26 (21%) | 2.40 | 0.14 | 0.28 | 0.973 |
| PeNC10 | 15.5 | 0.81 (80%) | 3.53 (20%) | 1.36 | 0.11 | 0.62 | 0.999 |
To discuss a possible mechanism of the doping effect on the PL performance, the PL spectra of PeNC0, PeNC1, and PeNC10 in powder form were measured in the temperature range between 20 K to 300 K. Fig. 4 shows the variation in the PL spectra of PeNC0, PeNC1 and PeNC10 photoexcited at 4.51, 3.76, and 3.76 eV, respectively. It is worth mentioning that there was a weak peak at around 2.76 eV for the PeNC0 (see Fig. 4a), which could be attributed to the free-exciton emission.45Fig. 4a–c shows the decreasing trend in the PL intensity of all the three samples with the temperature rise. Meanwhile, the samples exhibited a red-shift in the PL peak when the temperature was increased from 20 K to 100 K. Interestingly, this behavior is the opposite of most reported perovskite NCs.64,70–72 There are a few papers showing a red-shift trend, but those crystals are known to show the temperature-dependent phase transition or halide-type effect.63,73 However, the results of the LT-XRD measurements showed that all three samples maintained an ideal cubic perovskite structure and unchanged crystal phase in the temperature range between 5 K and 300 K. As mentioned before, the broad emission of the Cs2Ag0.65Na0.35InCl6 NCs originated from STE emission. Herein we propose that the red-shift of the PL peak could be attributed to the narrowing emission bandgap of the self-trapped state with the temperature increasing, which resulted from the lattice dilatation and electron–phonon interaction, similar to conventional semiconductor materials.74
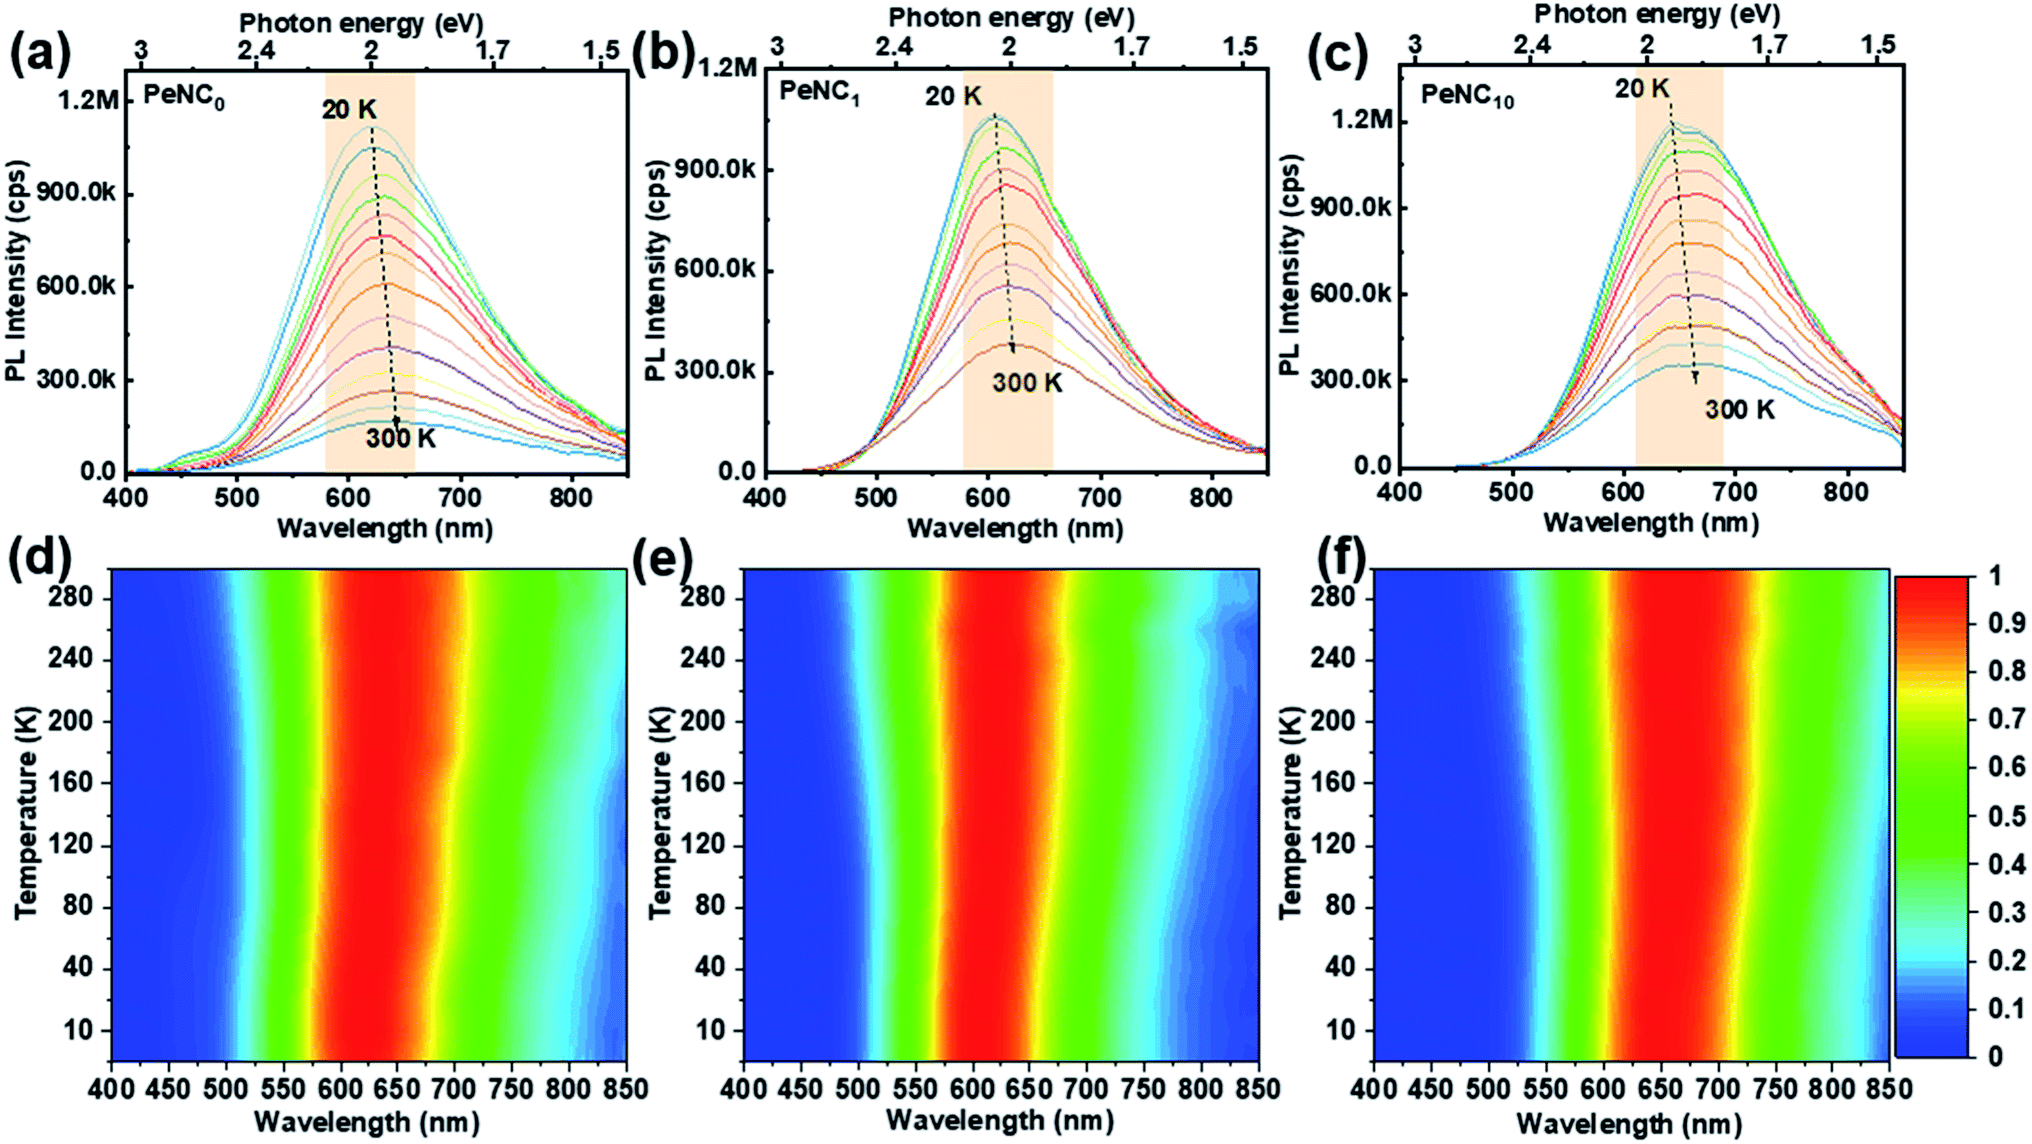 | ||
| Fig. 4 Temperature-dependent PL spectra of (a) PeNC0 (λex = 275 nm), (b) PeNC1 (λex = 330 nm), and (c) PeNC10 (λex = 330 nm) from 20 to 300 K. Normalized PL intensity mapped with the emission wavelength and temperature for (d) PeNC0 (e) PeNC1, and (f) PeNC10. | ||
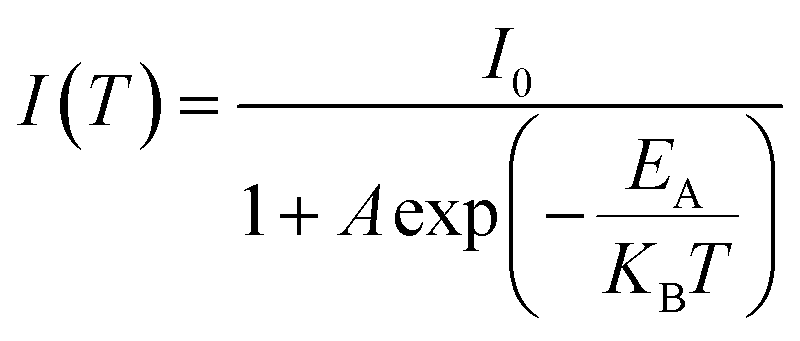
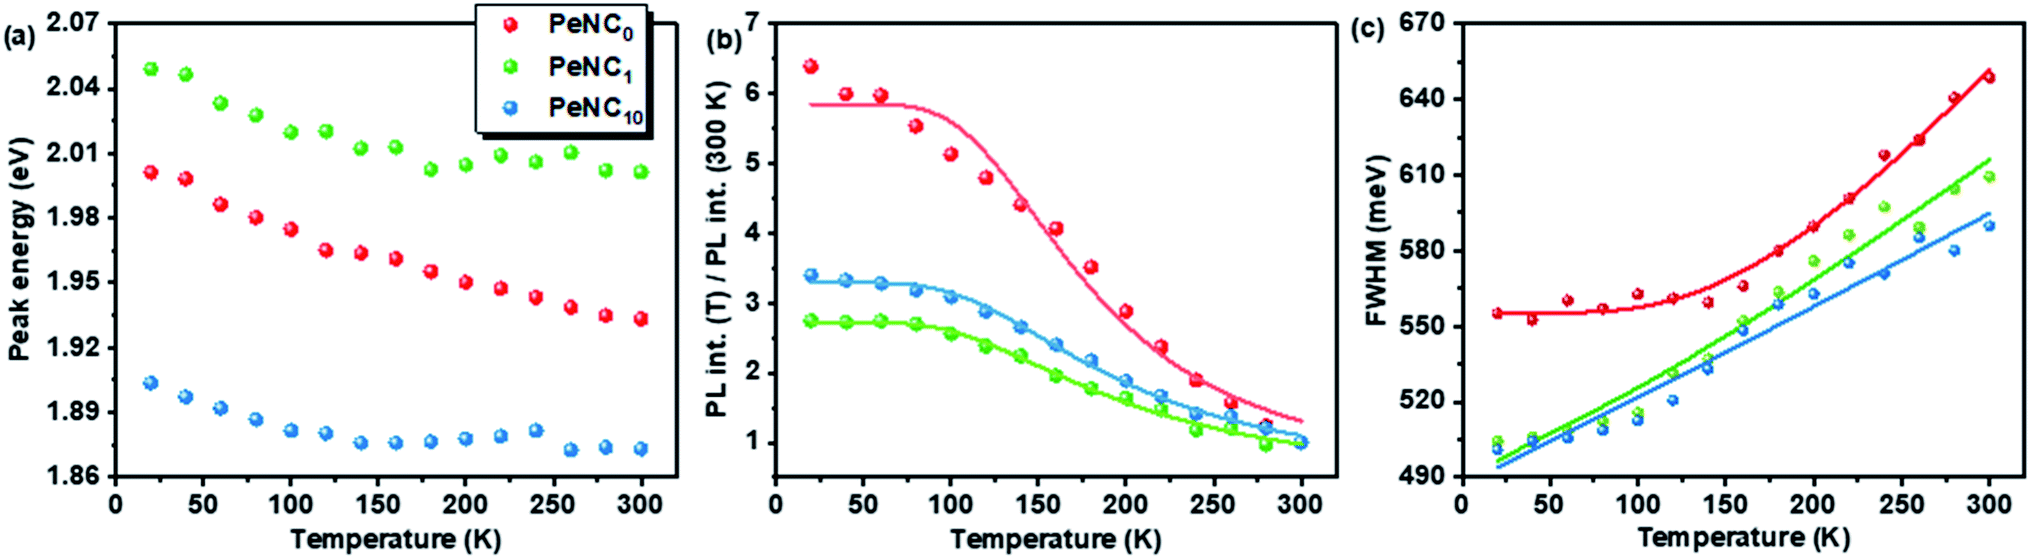
The variation in the PL peak energy with temperature from 20 K to 300 K for the three samples is shown in Fig. 5a. The PL peak energies of the NC powders for PeNC0, PeNC1, and PeNC10 were determined to be 2.00, 2.05, and 1.90 eV at 20 K and 1.93, 2.00, and 1.87 eV at 300 K, respectively. It was seen that the PL peak energy of PeNC0 decreased significantly (0.25 meV K−1) while the other two doped samples (i.e. PeNC1 and PeNC10) exhibited smaller shifts of 0.18 and 0.11 meV K−1 with the increasing temperature. On the other hand, the integrated PL intensities for the PeNC0, PeNC1, and PeNC10 samples slightly decreased with the increasing temperature as shown in Fig. 5b, yielding PL quenching. The successive decreasing behaviors of the PL intensity with the rise in temperature appeared due to the thermal activation of the nonradiative channels present in the NCs. According to this context, PeNC0 contained the largest amounts of defects as nonradiative channels, whereas PeNC1 had the smallest defect density (Scheme 1), consistent with the difference in PLQY. The temperature-dependent PL intensities could be fitted well according to the Arrhenius formula:75
 | (1) |
 | ||
| Fig. 5 Temperature-dependent PL (a) emission peak energy, (b) peak intensity, and (c) FWHM of PeNC0, PeNC1, and PeNC10. | ||
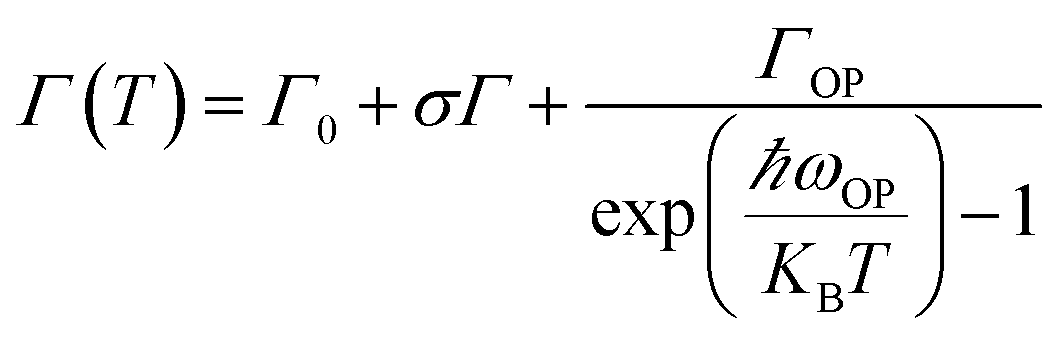
It can be seen from Fig. 4d–f that the PL full-width at half maximum (FWHM) was broadened for each sample with the temperature increasing, which was attributed to the strong exciton–phonon coupling. As shown in Fig. 5c, the PL FWHM was fitted by adapting the independent Boson model:76
 | (2) |
| Sample | Γ o (meV) | σ (meV K−1) | E ph (meV) | Γ op (meV) | E A (meV) |
|---|---|---|---|---|---|
| a Γ o: inhomogeneous broadening; σ: coupling coefficient of exciton–acoustic phonons; Eph: longitudinal optical (LO) phonon energy; Γop: coupling strength of exciton–LO phonons; EA: activation energy. | |||||
| PeNC0 | 555.4 ± 2.2 | 1.33 × 10⁻¹³ | 47.9 | 519.3 ± 22.0 | 55.8 ± 6.2 |
| PeNC1 | 489.7 ± 7.1 | 0.353 ± 0.069 | 41.2 | 80.3 ± 70.7 | 46.3 ± 2.3 |
| PeNC10 | 487.1 ± 6.0 | 0.345 ± 0.068 | 42.0 | 16.7 ± 72.0 | 48.8 ± 2.4 |
Besides the broadband and large Stokes shift emission, a long radiative PL lifetime is also a specific property of STEs, and is shown in Fig. 6a–c. To study the effect of doped Bi on the charge-carrier lifetime as a function of temperature, we measured time-resolved PL as a function of temperature for the PeNC0, PeNC1, and PeNC10 samples between 20 K and 300 K. As shown in Fig. 6d, the average lifetimes of PeNC1 and PeNC10 were longer than that of PeNC0 at all the temperatures, while the short lifetime component was ascribed to the trap-assisted nonradiative recombination channel, which when combined with the calculated nonradiative recombination rate in Table 1 allows concluding that the Bi-doping passivates the defects and suppresses the nonradiative recombination rate. The temperature-dependent average lifetimes of exciton decay for the Bi-doped samples were calculated by fitting the data to a biexponential fit (Table S2†) with a long-lived component (3–50 μs) and a less-long-lived component (0.8–3 μs), while the PL decay of undoped NCs was fitted by a mono-exponential function with a less-long-lived component (0.23 μs). The R-square values of the three plots were larger than 0.97, indicating a good fit. As shown in Fig. 6d, all three samples demonstrated that the changes in the lifetime were shortened a lot from 20 K to 60 K, but quite mild in the range from 60 K to 300 K, which could be described as the Boltzmann distribution,82 in accordance with the reported broadband-emission double perovskites.52 The proportion of the less-long-lived components versus temperature is shown in Fig. S8,† and this contribution became prominent when the temperature increased in both PeNC1 and PeNC10. Combined with the decreased PL intensity when the temperature increased, the less-long-lived component could be ascribed to fast nonradiative losses, likely due to the defects, while the long-lived part was contributed by the recombination of the STE. This phenomenon has also been observed in other double-perovskite nanocrystals.53 As a result, the average PL lifetimes decreased with the increasing temperature due to the increasing contribution of the faster nonradiative decay channels.
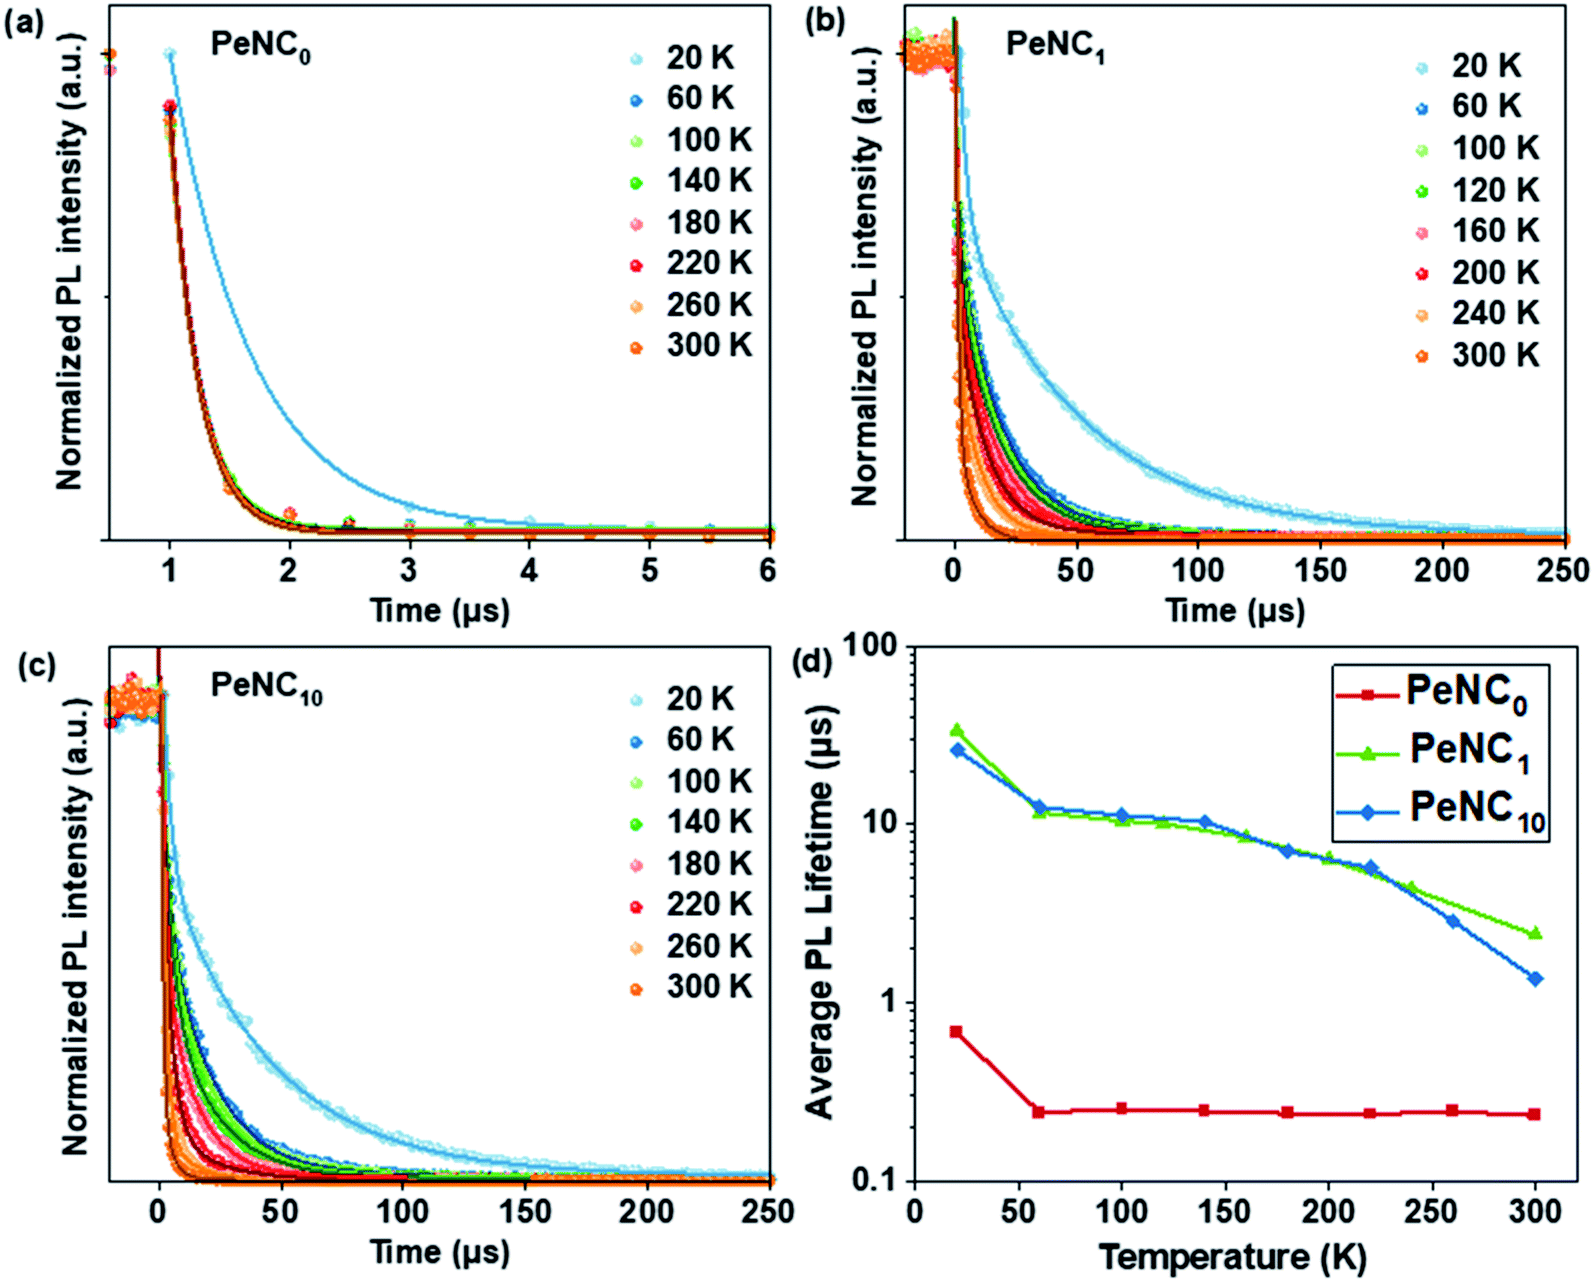 | ||
| Fig. 6 TR-PL curves of (a) PeNC0 (b) PeNC1, (c) PeNC10 from 20 to 300 K and (d) their average lifetimes extracted from biexponential fitting at various temperatures. | ||
4. Conclusions
We synthesized undoped and bismuth-doped Cs2Ag0.65Na0.35InCl6 double-perovskite NCs to investigate the role of the dopant on the enhanced PL performance through LT-XRD and low-temperature PL spectroscopic studies. The LT-XRD characterization indicated the successful doping and showed that there was no phase transition between 5 K and 300 K. The absolute value of PLQY was as high as 33.2%, which was obtained by 2% bismuth doping. The temperature-dependent PL study suggested that the diminished nonradiative channels brought about the increase in the PLQY. The PL linewidth broadening from 20 K to 300 K of the NCs was explained by electron–phonon coupling.Funding sources
JSPS KAKENHI Grant-in-Aid for Scientific Research (B) Grant Number 21H01910 and 21H01743, The Murata Science Foundation. JSPS KAKENHI (Grant Number 21K18942).Author contributions
X. H. performed research; Y. M. measured the samples with XRD at different temperatures; all the authors discussed the results, and X. H. and N. S. wrote the paper.Conflicts of interest
There are no conflicts to declare.Acknowledgements
This work was supported by WPI program, JSPS KAKENHI Grant-in-Aid for Scientific Research (B) Grant Number 21H01910 and The Murata Science Foundation. H. T. thanks to JSPS KAKENHI (Grant Number 21H01743 and 21K18942).References
- J. Song, J. Li, X. Li, L. Xu, Y. Dong and H. Zeng, Adv. Mater., 2015, 27, 7162–7167 CrossRef CAS PubMed.
- H. Huang, L. Polavarapu, J. A. Sichert, A. S. Susha, A. S. Urban and A. L. Rogach, NPG Asia Mater., 2016, 8, e328 CrossRef CAS.
- L. Zhao, Y.-W. Yeh, N. L. Tran, F. Wu, Z. Xiao, R. A. Kerner, Y. L. Lin, G. D. Scholes, N. Yao and B. P. Rand, ACS Nano, 2017, 11, 3957–3964 CrossRef CAS PubMed.
- F. Yan, J. Xing, G. Xing, L. Quan, S. T. Tan, J. Zhao, R. Su, L. Zhang, S. Chen, Y. Zhao, A. Huan, E. H. Sargent, Q. Xiong and H. V. Demir, Nano Lett., 2018, 18, 3157–3164 CrossRef CAS PubMed.
- Y. Wei, Z. Cheng and J. Lin, Chem. Soc. Rev., 2019, 48, 310–350 RSC.
- Y. Hassan, J. H. Park, M. L. Crawford, A. Sadhanala, J. Lee, J. C. Sadighian, E. Mosconi, R. Shivanna, E. Radicchi, M. Jeong, C. Yang, H. Choi, S. H. Park, M. H. Song, F. De Angelis, C. Y. Wong, R. H. Friend, B. R. Lee and H. J. Snaith, Nature, 2021, 591, 72–77 CrossRef CAS PubMed.
- J. Yuan, X. Ling, D. Yang, F. Li, S. Zhou, J. Shi, Y. Qian, J. Hu, Y. Sun, Y. Yang, X. Gao, S. Duhm, Q. Zhang and W. Ma, Joule, 2018, 2, 2450–2463 CrossRef CAS.
- Q. A. Akkerman, M. Gandini, F. Di Stasio, P. Rastogi, F. Palazon, G. Bertoni, J. M. Ball, M. Prato, A. Petrozza and L. Manna, Nat. Energy, 2017, 2, 16194 CrossRef CAS.
- J. Kim, B. Koo, W. H. Kim, J. Choi, C. Choi, S. J. Lim, J.-S. Lee, D.-H. Kim, M. J. Ko and Y. Kim, Nano Energy, 2019, 66, 104130 CrossRef CAS.
- J. Xi, C. Piao, J. Byeon, J. Yoon, Z. Wu and M. Choi, Adv. Energy Mater., 2019, 9, 1901787 CrossRef.
- L. Hu, Q. Zhao, S. Huang, J. Zheng, X. Guan, R. Patterson, J. Kim, L. Shi, C.-H. Lin, Q. Lei, D. Chu, W. Tao, S. Cheong, R. D. Tilley, A. W. Y. Ho-Baillie, J. M. Luther, J. Yuan and T. Wu, Nat. Commun., 2021, 12, 466 CrossRef CAS PubMed.
- Y. Wang, J. Yuan, X. Zhang, X. Ling, B. W. Larson, Q. Zhao, Y. Yang, Y. Shi, J. M. Luther and W. Ma, Adv. Mater., 2020, 32, 2000449 CrossRef CAS PubMed.
- P. Ramasamy, D.-H. Lim, B. Kim, S.-H. Lee, M.-S. Lee and J.-S. Lee, Chem. Commun., 2016, 52, 2067–2070 RSC.
- L. Zhou, K. Yu, F. Yang, J. Zheng, Y. Zuo, C. Li, B. Cheng and Q. Wang, Dalton Trans., 2017, 46, 1766–1769 RSC.
- C. Bi, S. V. Kershaw, A. L. Rogach and J. Tian, Adv. Funct. Mater., 2019, 29, 1902446 CrossRef.
- T. Zou, X. Liu, R. Qiu, Y. Wang, S. Huang, C. Liu, Q. Dai and H. Zhou, Adv. Opt. Mater., 2019, 7, 1801812 CrossRef.
- L. Jin, Y. Zhang, M. Cao, Y. Yu, Z. Chen, Y. Li, Z. Zhong, X. Hua, L. Xu, C. Cai, Y. Hu, X. Tong and J. Yao, Nanotechnology, 2021, 32, 235203 CrossRef CAS PubMed.
- L. Wu, Y. Mu, X. Guo, W. Zhang, Z. Zhang, M. Zhang and T. Lu, Angew. Chem., Int. Ed., 2019, 58, 9491–9495 CrossRef CAS PubMed.
- A. Pan, X. Ma, S. Huang, Y. Wu, M. Jia, Y. Shi, Y. Liu, P. Wangyang, L. He and Y. Liu, J. Phys. Chem. Lett., 2019, 10, 6590–6597 CrossRef CAS PubMed.
- Z. Chen, Y. Hu, J. Wang, Q. Shen, Y. Zhang, C. Ding, Y. Bai, G. Jiang, Z. Li and N. Gaponik, Chem. Mater., 2020, 32, 1517–1525 CrossRef CAS.
- C.-Y. Huang, C. Zou, C. Mao, K. L. Corp, Y.-C. Yao, Y.-J. Lee, C. W. Schlenker, A. K. Y. Jen and L. Y. Lin, ACS Photonics, 2017, 4, 2281–2289 CrossRef CAS.
- J. Chen, W. Du, J. Shi, M. Li, Y. Wang, Q. Zhang and X. Liu, InfoMat, 2020, 2, 170–183 CrossRef CAS.
- W. Gao, T. Wang, J. Xu, P. Zeng, W. Zhang, Y. Yao, C. Chen, M. Li and S. F. Yu, Small, 2021, 17, 2103065 CrossRef CAS PubMed.
- S. Mandal, S. Mukherjee, C. K. De, D. Roy, S. Ghosh and P. K. Mandal, J. Phys. Chem. Lett., 2020, 11, 1702–1707 CrossRef CAS PubMed.
- J. Kang and L.-W. Wang, J. Phys. Chem. Lett., 2017, 8, 489–493 CrossRef CAS PubMed.
- J.-W. Lee, Y. J. Choi, J.-M. Yang, S. Ham, S. K. Jeon, J. Y. Lee, Y.-H. Song, E. K. Ji, D.-H. Yoon, S. Seo, H. Shin, G. S. Han, H. S. Jung, D. Kim and N.-G. Park, ACS Nano, 2017, 11, 3311–3319 CrossRef CAS PubMed.
- B. A. Koscher, J. K. Swabeck, N. D. Bronstein and A. P. Alivisatos, J. Am. Chem. Soc., 2017, 139, 6566–6569 CrossRef CAS PubMed.
- N. Mondal, A. De and A. Samanta, ACS Energy Lett., 2019, 4, 32–39 CrossRef CAS.
- I. Levchuk, A. Osvet, X. Tang, M. Brandl, J. D. Perea, F. Hoegl, G. J. Matt, R. Hock, M. Batentschuk and C. J. Brabec, Nano Lett., 2017, 17, 2765–2770 CrossRef CAS PubMed.
- H. Huang, J. Raith, S. V. Kershaw, S. Kalytchuk, O. Tomanec, L. Jing, A. S. Susha, R. Zboril and A. L. Rogach, Nat. Commun., 2017, 8, 996 CrossRef PubMed.
- S. Y. Lee, G. Lee, D. Y. Kim, S. H. Jang, I. Choi, J. Park, H.-K. Park, J. W. Jung, K. H. Cho and J. Choi, APL Photonics, 2021, 6, 056104 CrossRef CAS.
- X. Wang, W. Li, X. Zhao, J. Fu, G. Zhang, W. Ma, W.-H. Zhang and H. W. Choi, Appl. Phys. Lett., 2022, 120, 011903 CrossRef CAS.
- G. R. Yettapu, D. Talukdar, S. Sarkar, A. Swarnkar, A. Nag, P. Ghosh and P. Mandal, Nano Lett., 2016, 16, 4838–4848 CrossRef CAS PubMed.
- J. Maes, L. Balcaen, E. Drijvers, Q. Zhao, J. De Roo, A. Vantomme, F. Vanhaecke, P. Geiregat and Z. Hens, J. Phys. Chem. Lett., 2018, 9, 3093–3097 CrossRef CAS PubMed.
- C.-S. Jo, K. Noh, S. H. Noh, H. Yoo, Y. Kim, J. Jang, H. H. Lee, Y.-J. Jung, J.-H. Lee, J. Han, J. Lim and S.-Y. Cho, ACS Appl. Nano Mater., 2020, 3, 11801–11810 CrossRef CAS.
- Y. Wang, X. Li, V. Nalla, H. Zeng and H. Sun, Adv. Funct. Mater., 2017, 27, 1605088 CrossRef.
- Q. A. Akkerman, G. Rainò, M. V. Kovalenko and L. Manna, Nat. Mater., 2018, 17, 394–405 CrossRef CAS PubMed.
- J. Ye, M. M. Byranvand, C. O. Martínez, R. L. Z. Hoye, M. Saliba and L. Polavarapu, Angew. Chem., Int. Ed., 2021, 60, 21636–21660 CrossRef CAS PubMed.
- L.-J. Chen, RSC Adv., 2018, 8, 18396–18399 RSC.
- Q. Liu, J. Yin, B.-B. Zhang, J.-K. Chen, Y. Zhou, L.-M. Zhang, L.-M. Wang, Q. Zhao, J. Hou, J. Shu, B. Song, N. Shirahata, O. M. Bakr, O. F. Mohammed and H.-T. Sun, J. Am. Chem. Soc., 2021, 143, 5470–5480 CrossRef CAS PubMed.
- K. M. McCall, C. C. Stoumpos, S. S. Kostina, M. G. Kanatzidis and B. W. Wessels, Chem. Mater., 2017, 29, 4129–4145 CrossRef CAS.
- B. Saparov, F. Hong, J.-P. Sun, H.-S. Duan, W. Meng, S. Cameron, I. G. Hill, Y. Yan and D. B. Mitzi, Chem. Mater., 2015, 27, 5622–5632 CrossRef CAS.
- K. Peng, L. Yu, X. Min, M. Hu, Y. Yang, S. Huang, Y. Zhao, Y. Deng and M. Zhang, J. Alloys Compd., 2022, 891, 161978 CrossRef CAS.
- H. Yin, Q. Kong, R. Zhang, D. Zheng, B. Yang and K. Han, Sci. China Mater., 2021, 64, 2667–2674 CrossRef CAS.
- J. Luo, X. Wang, S. Li, J. Liu, Y. Guo, G. Niu, L. Yao, Y. Fu, L. Gao, Q. Dong, C. Zhao, M. Leng, F. Ma, W. Liang, L. Wang, S. Jin, J. Han, L. Zhang, J. Etheridge, J. Wang, Y. Yan, E. H. Sargent and J. Tang, Nature, 2018, 563, 541–545 CrossRef CAS PubMed.
- W. B. Fowler, M. J. Marrone and M. N. Kabler, Phys. Rev. B: Solid State, 1973, 8, 5909–5919 CrossRef.
- R. Scholz, A. Y. Kobitski, D. R. T. Zahn and M. Schreiber, Phys. Rev. B: Condens. Matter Mater. Phys., 2005, 72, 1–18 CrossRef.
- S. Li, J. Luo, J. Liu and J. Tang, J. Phys. Chem. Lett., 2019, 10, 1999–2007 CrossRef CAS PubMed.
- Y. Zhang, Z. Zhang, W. Yu, Y. He, Z. Chen, L. Xiao, J. Shi, X. Guo, S. Wang and B. Qu, Adv. Sci., 2022, 9, 2102895 CrossRef CAS PubMed.
- H. Zhao, R. Sun, Z. Wang, K. Fu, X. Hu and Y. Zhang, Adv. Funct. Mater., 2019, 29, 1902262 CrossRef.
- Y. Liu, Y. Jing, J. Zhao, Q. Liu and Z. Xia, Chem. Mater., 2019, 31, 3333–3339 CrossRef CAS.
- P. Han, X. Mao, S. Yang, F. Zhang, B. Yang, D. Wei, W. Deng and K. Han, Angew. Chem., Int. Ed., 2019, 58, 17231–17235 CrossRef CAS PubMed.
- F. Locardi, E. Sartori, J. Buha, J. Zito, M. Prato, V. Pinchetti, M. L. Zaffalon, M. Ferretti, S. Brovelli, I. Infante, L. De Trizio and L. Manna, ACS Energy Lett., 2019, 4, 1976–1982 CrossRef CAS.
- Q. Hu, G. Niu, Z. Zheng, S. Li, Y. Zhang, H. Song, T. Zhai and J. Tang, Small, 2019, 15, 1903496 CrossRef CAS PubMed.
- D. Manna, T. K. Das and A. Yella, Chem. Mater., 2019, 31, 10063–10070 CrossRef CAS.
- M. Gray, J. Majher, T. A. Strom and P. Woodward, Inorg. Chem., 2019, 58, 13403–13410 CrossRef CAS PubMed.
- N. Shirahata, J. Nakamura, J. Inoue, B. Ghosh, K. Nemoto, Y. Nemoto, M. Takeguchi, Y. Masuda, M. Tanaka and G. A. Ozin, Nano Lett., 2020, 20, 1491–1498 CrossRef CAS PubMed.
- P. Jing, J. Zheng, M. Ikezawa, X. Liu, S. Lv, X. Kong, J. Zhao and Y. Masumoto, J. Phys. Chem. C, 2009, 113, 13545–13550 CrossRef CAS.
- K. Wei, Z. Xu, R. Chen, X. Zheng, X. Cheng and T. Jiang, Opt. Lett., 2016, 41, 3821 CrossRef CAS PubMed.
- S. E. Creutz, E. N. Crites, M. C. D. Siena and D. R. Gamelin, Nano Lett., 2018, 18, 1118–1123 CrossRef CAS PubMed.
- P. Han, X. Zhang, C. Luo, W. Zhou, S. Yang, J. Zhao, W. Deng and K. Han, ACS Cent. Sci., 2022, 6, 566–572 CrossRef PubMed.
- L. H. Ahrens, Geochim. Cosmochim. Acta, 1952, 2, 155–169 CrossRef CAS.
- A. R. Denton and N. W. Ashcroft, Phys. Rev. A: At., Mol., Opt. Phys., 1991, 43, 3161 CrossRef CAS PubMed.
- S. B. Naghadeh, S. Sarang, A. Brewer, A. Allen, Y.-H. Chiu, Y.-J. Hsu, J.-Y. Wu, S. Ghosh and J. Z. Zhang, J. Chem. Phys., 2019, 151, 154705 CrossRef PubMed.
- L. Liu, R. Zhao, C. Xiao, F. Zhang, F. Pevere, K. Shi, H. Huang, H. Zhong and I. Sychugov, J. Phys. Chem. Lett., 2019, 10, 5451–5457 CrossRef CAS PubMed.
- J.-P. Ma, J.-K. Chen, J. Yin, B.-B. Zhang, Q. Zhao, Y. Kuroiwa, C. Moriyoshi, L. Hu, O. M. Bakr, O. F. Mohammed and H.-T. Sun, ACS Mater. Lett., 2020, 2, 367–375 CrossRef CAS.
- L. Schade, A. D. Wright, R. D. Johnson, M. Dollmann, B. Wenger, P. K. Nayak, D. Prabhakaran, L. M. Herz, R. Nicholas, H. J. Snaith and P. G. Radaelli, ACS Energy Lett., 2019, 4, 299–305 CrossRef CAS.
- J. Luo, S. Li, H. Wu, Y. Zhou, Y. Li, J. Liu, J. Li, K. Li, F. Yi, G. Niu and J. Tang, ACS Photonics, 2018, 5, 398–405 CrossRef CAS.
- P. Zhang, J. Yang and S.-H. Wei, J. Mater. Chem. A, 2018, 6, 1809–1815 RSC.
- J. Zhang, Y. Yang, H. Deng, U. Farooq, X. Yang, J. Khan, J. Tang and H. Song, ACS Nano, 2017, 11, 9294–9302 CrossRef CAS PubMed.
- Y. Tang, L. Gomez, M. van der Laan, D. Timmerman, V. Sebastian, C.-C. Huang, T. Gregorkiewicz and P. Schall, J. Mater. Chem. C, 2021, 9, 158–163 RSC.
- B. M. Benin, D. N. Dirin, V. Morad, M. Wörle, S. Yakunin, G. Rainò, O. Nazarenko, M. Fischer, I. Infante and M. V. Kovalenko, Angew. Chem., Int. Ed., 2018, 57, 11329–11333 CrossRef CAS PubMed.
- R. Saran, A. Heuer-Jungemann, A. G. Kanaras and R. J. Curry, Adv. Opt. Mater., 2017, 5, 1–9 Search PubMed.
- Y. P. Varshni, Physica, 1967, 34, 149–154 CrossRef CAS.
- M. Leroux, N. Grandjean, B. Beaumont, G. Nataf, F. Semond, J. Massies and P. Gibart, J. Appl. Phys., 1999, 86, 3721–3728 CrossRef CAS.
- A. Al Salman, A. Tortschanoff, M. B. Mohamed, D. Tonti, F. van Mourik and M. Chergui, Appl. Phys. Lett., 2007, 90, 093104 CrossRef.
- H. C. Woo, J. W. Choi, J. Shin, S. H. Chin, M. H. Ann and C. L. Lee, J. Phys. Chem. Lett., 2018, 9, 4066–4074 CrossRef CAS PubMed.
- E. M. Janke, N. E. Williams, C. She, D. Zherebetskyy, M. H. Hudson, L. Wang, D. J. Gosztola, R. D. Schaller, B. Lee, C. Sun, G. S. Engel and D. V. Talapin, J. Am. Chem. Soc., 2018, 140, 15791–15803 CrossRef CAS PubMed.
- L. Wang, W. Zheng, F. Vitale, X. Zhang, X. Li, Y. Ji, Z. Liu, O. Ghaebi, C. T. Plass, R. Domes, T. Frosch, G. Soavi, E. Wendler, Y. Zhang and C. Ronning, Adv. Funct. Mater., 2022, 32, 2111338 CrossRef CAS.
- V. Türck, S. Rodt, O. Stier, R. Heitz, R. Engelhardt, U. W. Phol, D. Bimberg and R. Steingrüber, Phys. Rev. B: Condens. Matter Mater. Phys., 2000, 61, 9944–9947 CrossRef.
- X. Lao, Z. Yang, Z. Su, Z. Wang, H. Ye, M. Wang, X. Yao and S. Xu, Nanoscale, 2018, 10, 9949–9956 RSC.
- J. E. Parks, Department of Physics and Astronomy, The University of Tennessee, Tech. Rep., 2013.
Footnote |
| † Electronic supplementary information (ESI) available. See https://doi.org/10.1039/d2na00238h |
| This journal is © The Royal Society of Chemistry 2022 |