
 Open Access Article
 This Open Access Article is licensed under a Creative Commons Attribution-Non Commercial 3.0 Unported Licence
Developing a rational approach to designing recombinant proteins for peptide-directed nanoparticle synthesis†
Adithya
Polasa
 a,
Imann
Mosleh
bc,
James
Losey
a,
Alireza
Abbaspourrad
*c,
Robert
Beitle
*b and
Mahmoud
Moradi
*a
a,
Imann
Mosleh
bc,
James
Losey
a,
Alireza
Abbaspourrad
*c,
Robert
Beitle
*b and
Mahmoud
Moradi
*a
aDepartment of Chemistry and Biochemistry, University of Arkansas, Fayetteville, AR 72701, USA. E-mail: moradi@uark.edu
bDepartment of Food Science, College of Agriculture and Life Sciences, Cornell University, Ithaca, NY 14853, USA
cRalph E. Martin Department of Chemical Engineering, University of Arkansas, Fayetteville, AR 72701, USA
First published on 18th May 2022
Abstract
The controlled formation of nanoparticles with optimum characteristics and functional aspects has proven successful via peptide-mediated nanoparticle synthesis. However, the effects of the peptide sequence and binding motif on surface features and physicochemical properties of nanoparticles are not well-understood. In this study, we investigate in a comparative manner how a specific peptide known as Pd4 and its two known variants may form nanoparticles both in an isolated state and when attached to a green fluorescent protein (GFPuv). More importantly, we introduce a novel computational approach to predict the trend of the size and activity of the peptide-directed nanoparticles by estimating the binding affinity of the peptide to a single ion. We used molecular dynamics (MD) simulations to explore the differential behavior of the isolated and GFP-fused peptides and their mutants. Our computed palladium (Pd) binding free energies match the typical nanoparticle sizes reported from transmission electron microscope pictures. Stille coupling and Suzuki–Miyaura reaction turnover frequencies (TOFs) also correspond with computationally predicted Pd binding affinities. The results show that while using Pd4 and its two known variants (A6 and A11) in isolation produces nanoparticles of varying sizes, fusing these peptides to the GFPuv protein produces nanoparticles of similar sizes and activity. In other words, GFPuv reduces the sensitivity of the nanoparticles to the peptide sequence. This study provides a computational framework for designing free and protein-attached peptides that helps in the synthesis of nanoparticles with well-regulated properties.
1 Introduction
Recent advances in nanotechnology have resulted in the development of various efficient synthesis and characterization procedures for nanoparticles. Within the last two decades, in particular, many peptides have been introduced to identify inorganic metal surfaces,1–14 some of which have been utilized to produce nanomaterials.13–15 Production of nanoparticles with varying size, shape, or aggregation stability using peptide immobilization is useful in sub-fields of biotechnology,16 sensors,17–19 and bioanalytical procedures.20–22 Small variations in the composition and sequence of the peptide conjugate may have a significant effect on the configuration of the resulting nanoparticle assembly. It has become apparent that by carefully tailoring the peptide sequence, one can regulate the composition of nanoparticles.23Self-assembly motif peptides guide nanoparticle assembly into specific architectures.23,24 Peptides may produce well-defined nanostructures such as nanotubes, nanofibers, nanoparticles, nanotapes, gels, and nanorods by self-assembly.25 Changes in the amino acid sequence of a peptide used in the synthesis of a nanoparticle can alter the nanoparticle properties. Studies have found evidence that oligopeptides with tryptophan and tyrosine in their sequence are potentially involved in reducing metal ions into their respective metals, thus forming nanoparticles.26–28 In contrast, histidine (His) containing oligopeptides, bound to the material surfaces, may increase the interaction between the solvent and metallic surface.29 Recent computational studies have demonstrated that aromatic residues His10 and His12 for Pd2 and His6 and His11 for Pd4 have lower surface interaction and mobility on the surface of palladium nanoparticles compared to other peptides in the study.29 Substitution of these His residues with an alanine (Ala) affects the reactivity and nanoparticle fabrication capability of the peptide, resulting in varying turnover frequencies (TOFs) for the Stille coupling reaction.29 Furthermore, minor mutations in the amino acid sequence, such as cysteine and alanine modifications, will significantly reduce the surface structure of nanocatalysts, lowering the peptide absorption energy of the palladium nanoparticle.30–32 The difference between His6 and His11 in the Pd4 peptide has been the focus of some studies, as mutation of either of these residues is known to completely modify the structural and functional abilities of the peptide in nanoparticle synthesis.24,30 A computational study has proposed that His6 has a slightly lower surface interaction energy and mobility on the surface of the palladium substrate than His11.29 However, His11 has more interaction sites than His6, which explains the difference in the free energy profiles of these residues in many studies.24,29,30 Attaching the peptides to a green fluorescent protein (GFPuv) using recombinant fusion proteins can offer an alternative strategy to using chemically synthesized, isolated peptides that is more cost effective.33–35 Additionally, studies have shown that the use of this GFPuv protein helps in monitoring the synthesis of the nanoparticle in a single-step process.36 Despite the success of this approach to successfully produce functional nanoparticles similar to common peptide-mediated nanoparticles, relying only on experimental techniques does not provide the insight needed to understand the phenomenon at the molecular level. Here the focus of our study is to develop a computational framework for investigating the peptide-nanoparticle interaction in both isolated peptides and protein-attached peptides. We do not claim to have a methodology that fully explains all aspects of the peptide-nanoparticle interaction but we only focus, in this work, on the interaction with a single Pd ion. Interestingly, the Pd binding free energies measured for several systems including isolated and GFPuv-fused Pd4 and its two known mutants (H6A and H11A denoted by A6 and A11, respectively) provided a good predictor of the behavior of the resulting nanoparticles both in terms of their sizes and activities. Employing all-atom molecular dynamics (MD) simulations and enhanced sampling techniques, we have investigated the differential behavior of isolated and protein-fused Pd4 peptides and their mutants at the atomic level. The peptides studied in this MD simulation study are the peptide models Pd4 (TSNAVHPTLRHL) and alanine substitution mutants called A6 (TSNAVAPTLRHL) and A11 (TSNAVHPTLRAL) (Fig. 1A–C). Additionally, for each peptide described above, computationally generated GFPuv bound peptide models (Fig. 1D–F) were created. Following structural modeling of the peptides, MD simulations were performed in an aqueous environment, and free energy calculations were done to measure the absolute binding free energy between each His and Pd ion. The experimental recombinant peptide fusion GFPuv-mediated palladium nanoparticle synthesis results for the particle size and turnover frequencies (TOFs) were used to validate our computational results, and provide a comparison to existing experimental data for free peptides. These simulations provide valuable insights into the sequence-dependent structural and functional dynamics of the peptides at the atomic level. The results of this study could potentially be used to guide the design or selection of peptides for isolated or protein-fused peptide-directed nanoparticle synthesis.
 | ||
| Fig. 1 The initial and final MD snapshots of Pd4, A6, A11 (A–C), GFP-Pd4, GFP-A6 and GFP-A11 (D–F) in cartoon representation. The peptide in each protein is colored red and GFPuv is colored yellow (D–F). Histidines in the peptide are colored green and shown in licorice representation. | ||
2 Methods
All-atom MD simulations were performed to obtain relaxed structures of peptide models to investigate conformational dynamics and calculate binding energies of His residues on the surface of the Pd ion. For the fusion peptides, the crystal structure of GFPuv (PDB:1W7S)37 was obtained from the protein data bank with a resolution of 1.85 Å. Initially, Modeller38 was used for the construction of all peptide and GFPuv fusion peptide systems (Fig. 1). Next, the CHARMM-GUI39,40 web-server was used to build the MD simulation models of peptide and GFPuv fusion peptide systems in aqueous solution of TIP3P41 water. Na+ and Cl− ions were used to both neutralize and add 0.15 M salt to each system. The total number of atoms of peptide and GFPuv fusion peptide systems was ≈22![[thin space (1/6-em)]](https://www.rsc.org/images/entities/char_2009.gif) 300 and ≈68000, respectively. NAMD 2.13 (ref. 42) was utilized to run the MD simulations under periodic boundary conditions (PBC) at 310 K in the NPT ensemble, and 1 atm pressure was maintained using the Nosé–Hoover Langevin piston method.43,44 Initially, we used the conjugate gradient45 technique to energy-minimize each system for 10000 steps. Following that, we used the standard CHARMM-GUI46 protocol to progressively relax the systems using restricted MD simulations. An NVT ensemble was used for the initial relaxation, whereas an NPT ensemble was used for all production runs. Simulations were performed using a Langevin integrator with a damping value of γ = 0.5 ps−1 and a 2 fs time step at 310 K temperature. Every system was equilibrated for 100 nanoseconds using CHARMM36m all-atom force field47,48 parameters. VMD49 was used to visualize and analyze trajectory data. Principal component analysis (PCA) was performed on each trajectory using PRODY50 software. Only Cα atoms of the peptide were considered in the PCA calculations of both free and fused peptide simulations. Secondary structure analysis of each residue was done using the ϕ < ψ angles51 to identify various areas in the Ramachandran plot. The definitions of different regions in the Ramachandran plot (F, β, αR, and αL regions) labeled in Fig. 2 and 4 are based on boundaries defined by Moradi et al.51 Further, we calculated the binding free energy of the palladium ion and histidines in the peptide sequence using the following methodology.
300 and ≈68000, respectively. NAMD 2.13 (ref. 42) was utilized to run the MD simulations under periodic boundary conditions (PBC) at 310 K in the NPT ensemble, and 1 atm pressure was maintained using the Nosé–Hoover Langevin piston method.43,44 Initially, we used the conjugate gradient45 technique to energy-minimize each system for 10000 steps. Following that, we used the standard CHARMM-GUI46 protocol to progressively relax the systems using restricted MD simulations. An NVT ensemble was used for the initial relaxation, whereas an NPT ensemble was used for all production runs. Simulations were performed using a Langevin integrator with a damping value of γ = 0.5 ps−1 and a 2 fs time step at 310 K temperature. Every system was equilibrated for 100 nanoseconds using CHARMM36m all-atom force field47,48 parameters. VMD49 was used to visualize and analyze trajectory data. Principal component analysis (PCA) was performed on each trajectory using PRODY50 software. Only Cα atoms of the peptide were considered in the PCA calculations of both free and fused peptide simulations. Secondary structure analysis of each residue was done using the ϕ < ψ angles51 to identify various areas in the Ramachandran plot. The definitions of different regions in the Ramachandran plot (F, β, αR, and αL regions) labeled in Fig. 2 and 4 are based on boundaries defined by Moradi et al.51 Further, we calculated the binding free energy of the palladium ion and histidines in the peptide sequence using the following methodology.
 | ||
| Fig. 2 The structural propensities of peptides Pd4, A6, and A11 shown as Ramachandran plots (x-axis ϕ and y-axis ψ angles) of residue 6 (top) and residue 11 (bottom). Secondary structures are colored as follows: αR-green, αL-magenta, β-orange, and F-blue. | ||
2.1 Binding free energy calculations
The Pd binding free energy of histidines in the peptide was calculated for all systems mentioned above (Fig. 1) using the free energy perturbation (FEP) method.52 All simulations were carried out using NAMD 2.13.42 For FEP calculations, 20 snapshots from a 100 ns equilibrated system trajectory were obtained, and the Pd2+ ion was positioned within 2 Å of the His aromatic ring structure's center of mass. For the Pd ion, the force field parameters developed by Heinz et al.53 were used, which is already available within CHARMM-METAL.47 The CHARMM-METAL53 parameters provide reliable results for calculating values such as the surface binding energy of metals (e.g., palladium). This force field model, on the other hand, ignores the contribution of metal atom polarizability to dynamic forces and a realistic representation of the spatial and orientational structure of liquid water at the metal interface.54 These characteristics are expected to have a significant role in biomolecule adsorption behavior.54 However, previous computational investigations of peptide binding for bio-based nanomaterials,55,56 using the CHARMM-METAL force field, significantly demonstrated the relationship between peptide surface binding and nanoparticle size and structure. Thus, we used the CHARMM-METAL force field to demonstrate the qualitative difference between free peptide and GFPuv fused peptide binding to nanoparticles and show a phenomenological relationship between histidine binding affinity and nanoparticle size and catalytic activity. Employing polarizable force fields would be beneficial in future studies to gain a deeper understanding of the relationship between nanoparticle synthesis and binding free energies. Solvation free energy calculations for the palladium ion were carried out under PBC conditions at constant pressure in aqueous TIP3P41 water solution. The systems were simulated with a 2 fs time step using Langevin dynamics at a temperature of 310 K. Initially, we utilized the conjugate gradient45 approach to minimize the energy in each system for 10000 steps. Every system was equilibrated for 3 nanoseconds (ns). To constrain the distance between the Pd ion and the His aromatic ring structure in all FEP simulations, we employed a harmonic restraint57 in terms of the center of the mass distance between the Pd ion and His aromatic ring structure. To restrain the protein conformational dynamics, we also used the root mean square deviation (RMSD) of the protein as a collective variable.57 FEP simulations were performed by varying λ from zero to one (forward) or from one to zero (backward) in 32 stages (i.e., Δλ = 0.03125). Each stage had a simulation time of 100 ps including 2 ps of equilibration and 98 ps of data collection. A soft-core potential was used to avoid the endpoint problem for van der Waals interactions58,59 and the electrostatic interactions were gradually decoupled from λ = 0 to 0.9 in the forward direction and they were coupled from λ = 0.9 to 0 in the backward direction.
The free energy values were computed using the Bennette acceptance ratio method60 within the ParseFEP plugin61 from forward and backward simulations. The thermodynamic cycle illustrated in Fig. S1† was used for final calculation of the binding free energies. This cycle connects the binding of the palladium ion with histidine in the peptide individually for each system from the unbound state to the bound state, i.e.,  = ΔG2 with solvation of the palladium ion in aqueous solution
  = ΔG1 (ΔG1 = 282.5 kcal mol−1). Overall, the binding free energy of palladium was calculated based on the equation ΔGbinding = ΔG1 − ΔG2 derived from the thermodynamic cycle (Fig. S1†). The mean value and standard deviation of the mean were estimated from 20independent FEP calculations based on 20 different snapshots of each system obtained as described above.
2.2 Fusion protein preparation
According to the codon preference of E. coli, plasmids encoding Pd4, A6, and A11 peptides fused to GFPuv were constructed. The fragment containing codons of peptides were introduced to the 5′ end of the GFPuv gene using forward primers through the polymerase chain reaction (PCR). Synthetic genes containing desired peptides and Addgene-plasmid-51559 were double digested with EcoRI and XbaI restriction enzymes before the ligation. Finally, the designed DNA containing desired peptides was ligated to the DNA to construct plasmids containing GFPuv fusion proteins. Bacterial lysates from arabinose induced cells were obtained, following a method adapted from our previous research.33 Protein concentrations were determined using the detergent compatible (DC) protein assay (Bio-Rad, Hercules, CA).2.3 Nanoparticle synthesis
To synthesize palladium nanoparticles (Pd NPs) at room temperature, 0.16 mg K2PdCl4 was added to synthesis mixtures (one milliliter total volume) containing 0.23 mg fusion protein. These amounts result in a 2:1 ratio of Pd2+ to Pd4. After mixing for 0.5 hour, 1.5 mg NaBH4 was added to the mixture to reduce Pd2+ ions to metallic Pd and NPs were formed rapidly after reduction indicated by a color change (yellow to light brown). The NP shape and size distribution were analyzed using transmission electron microscopy (TEM). A droplet containing ten microliter samples of the reaction mixture was placed on a 300 mesh standard lacey carbon grid. An FEI Titan 80-300 instrument was used for producing nanoparticle size distribution and morphology images. TEM images were analyzed using ImageJ software33 in order to measure particle sizes. Experimental data on the nanoparticle size for the three systems were limited. Using bootstrapping, the particle size data were re-sampled 100 times for each system for statistics calculations. The bootstrap method involves iteratively resampling a set of data to generate a sub-sample that is smaller than or equal to the size of the given data set. This sub-sample is produced using replacement, which allows each data point to be sampled multiple times or not at all. The bootstrap particle size data were also processed to generate probability density functions using a kernel density estimator. The corresponding histograms (Fig. 3A) were generated using the 100 probability density functions derived from kernel density estimate.
 | ||
| Fig. 3 (A) Nanoparticle size as a function of binding free energies (the line represents linear regression of the free peptide results). The inset shows the kernel density estimation of 100 bootstrap resamples of experimentally measured nanoparticle sizes. The size distribution of nanoparticles synthesized using GFPuv fusion peptides. (B and C) RMSD profile of free peptides and GFPuv fused peptides, respectively. (*) Only the peptide region was used for RMSD calculations in (C). | ||
2.4 Screening of reaction parameters for the Suzuki–Miyaura coupling reaction
For optimizing the reaction conditions, a method developed by Mosleh et al. was adopted.33 The different reaction conditions including the base, temperature, and solvent were evaluated using the model coupling reaction (Table S1†). The reaction did not result in high yield when KOtBu, K2HPO4, and KH2PO4 (entries 1–3) were used as the base while the reaction proceeded with excellent catalytic activity in the presence of K2CO3 (entry 4). The catalytic performance of the reaction at different temperatures indicated that by increasing the temperature, higher yields could be obtained. Indeed, the presence of EtOH in water-containing solvents as a green solvent with a ratio of 1:1 was found to be the best solvent for the Suzuki–Miyaura coupling reaction (entries 6–8).
2.5 Screening of reaction parameters for the Stille coupling reaction
To obtain the optimized conditions for the Stille coupling reaction, the reaction of iodobenzene and phenyltin trichloride was used as the model reaction and other reaction conditions including the base, temperature, and catalyst loading were evaluated (Table S2†). For the base study, a series of bases were explored and K3PO4 was found to be the best base as the yield of biphenyl production was 97% (entries 1–4). Higher yields could be obtained when higher temperatures were used. Although 70% yield of biphenyl was obtained at 60 °C, the reaction was performed for 20 h. Employing 80 °C resulted in biphenyl production with 96% yield after 6 h. Furthermore, increasing the amount of the catalyst did not alter the yield of biphenyl while lower catalytic activities were observed when 2 mmol% and 1 mmol% of Pd were present in the reaction (entries 7–9).3 Results and discussion
3.1 Histidine–palladium binding free energies for free peptides
The Pd4, A6, and A11 peptides described above were first computationally modeled and equilibrated using MD as described in the Methods section. The binding free energy of Pd with histidine residues at positions 6 and 11 was then calculated using the free energy perturbation (FEP) method52 to determine the site-specific binding strengths of the peptide (see the Methods section – Binding free energy calculations). The Pd binding free energies of the histidines are reported in Table 1 along with the average particle size and turnover frequency (TOF) from ref. 24 and 30.| Peptide | Binding free energy (kcal mol−1) | TOF (h−1) | Average particle size (nm) | ||||
|---|---|---|---|---|---|---|---|
| His6 | His11 | Effective | Ref. 24 | Ref. 30 | Ref. 24 | Ref. 30 | |
| Pd4 | −89 ± 5 | −157 ± 8 | −157 ± 8 | 2234 ± 99 | 2200 ± 100 | 1.9 ± 0.3 | 2.1 ± 0.4 |
| A6 | −145 ± 7 | −145 ± 7 | 5224 ± 381 | 5200 ± 400 | 2.2 ± 0.4 | 2.2 ± 0.7 | |
| A11 | −118 ± 6 | −118 ± 6 | 1298 ± 107 | 1300 ± 10 | 2.4 ± 0.5 | 2.6 ± 0.4 | |
The differential binding free energy values highlight the importance of the histidine residues in these free peptides. As the peptide sequence is modified, the binding free energy value changes significantly. For systems with the presence of His11, the free energy of Pd ion binding with His11 was −157 ± 8 and −145 ± 7 kcal mol−1 for Pd4 and A6, respectively. On the other hand, the free energy for binding with His6 was −89 ± 5 and −118 ± 6 kcal mol−1, in Pd4 and A11, respectively. The lower free energy for binding with His11 made it the preferred Pd binding site when it was available, which is directly related to its high affinity and TOF value in palladium nanoparticle synthesis. Therefore, His11 has a much higher affinity to Pd than His6. His6 is also potentially involved in the production of nanoparticles, even in the absence and presence of His11 in A11 and Pd4 peptides, respectively. However, it is unlikely to be the dominant binding site due to its low affinity for the palladium ion, possibly resulting in a lower TOF value.
The binding free energies shown in Table 1 provided more insight into existing catalytic rate data of TOF values from ref. 24 and 30. Even though the Pd binding free energy of His11 in A6 is slightly higher than that of His11 in Pd4, the TOF of A6 was doubled, from 2200 ± 100 h−1 (Pd4) to 5200 ± 400 h−1 (A6). Conversely, when only His6 is present, as in A11, the TOF decreases to 1298 ± 107 h−1. With both His6 and His11 present in Pd4, the catalytic activity was slowed down. The lower TOF in Pd4 as compared to A6 has been attributed to the shared interaction activity of the two histidines in Pd4, where a larger area of nanoparticle is covered by the peptide when two histidines can bind to the nanoparticle.30 It is apparent from the binding free energy data that both histidine residues can be involved in the nanoparticle interaction. In prior studies, it was discovered that when the peptide was altered at residue His6, the experimentally estimated binding free energy of the peptide had a greater affinity for the palladium nanoparticle than when modified at residue His11.55,56
Other synthesis measures showed a similar relationship with the free energy calculations. Existing nanoparticle size data from transmission electron microscopy (TEM) measurements24,30 displayed a linear relationship with the minimum binding free energy of the histidines (Fig. 3A). Higher binding free energy of palladium with the peptide during synthesis is correlated with the larger particle size. These free energy calculations shed light on the competitive relationships between histidine binding sites that determine catalytic activity of the peptide and the size of the nanoparticle produced. To investigate these differences, the peptide simulation trajectories were subjected to further in-depth examination.
3.2 Secondary structure propensity for free peptides
To evaluate the influence of the mutations on the secondary structure of peptide, the ϕ − ψ angles of the peptide residues 6 and 11 were analyzed on Ramachandran plots51,62 (Fig. 2).This analysis revealed that the αL propensity of residues was significantly affected by the mutation of His6 and His11 to alanine. The secondary structure of the residues was primarily acquired within the F area of the Ramachandran plots in wild type Pd4 peptides (Fig. 2). However, the mutation H6A in A6 changed the secondary structure of His11, which features a significantly higher αL propensity value giving it more α helical structure compared to the residue in peptides Pd4 and A11 (Fig. 2). In A11, the mutation of His11 to an alanine changed the propensity of the αL secondary structure of residue 11 but not as prominently as that in the A6 and Pd4 peptide structure (Fig. 2). This explains the low TOF of A11 relative to those of Pd4 and A6 (Table 1). The αL propensities of both His6 and His11 in the Pd4 peptide are comparable, but not as high as that of His11 in the A6 peptide; as a result, we believe that Pd4 has lower binding free energy and TOF than A6 (Table 1). This secondary structure difference could be a reason for the difference in the TOF and free energy results, as the α structure of the amino acid is directly proportional to the reactivity because of the rigid structure of the residue. Although similar results have been reported in a previous study,55 our method for calculating this is unique and distinct, and the major purpose of this study is to examine the differences between peptides and GFP-fused recombinant peptides (Fig. S2 and S3†). The following section of our findings shows how the fusion of the GFPuv protein to these peptides affects the structure of the peptide and the production of nanoparticles.
3.3 GFPuv fusion peptide simulations and experiments
To study the ability of the GFPuv fusion peptide framework to produce Pd nanoparticles, MD and FEP simulations of peptides bound to the GFPuv protein were conducted. GFPuv fused peptide directed palladium nanoparticles were generated experimentally and used as catalysts for the Stille and Suzuki–Miyaura coupling reactions for characterization. A schematic of the different reactions and a plot of the catalytic data are presented in Fig. S4.† The turnover frequency (TOF) values from these catalytic rate results are reported in Table 2. The nanoparticles directed by three GFPuv fused peptide (Pd4, A6 and A11) systems were analyzed by transmission electron microscopy (TEM) to measure the particle size (Fig. S5†). Regardless of mutation, the in silico binding free energy of palladium with histidines in GFPuv fused peptides is consistent with each other (Table 2). Interestingly, the binding free energy estimates for His6 are identical (−118 ± 6 kcal mol−1) in GFP-Pd4 and GFP-A6. Similarly, the binding free energy estimates for His11 are identical (−122 ± 6 kcal mol−1) in GFP-Pd4 and GFP-A11. Even His6 and His11 have quite similar binding free energies with only 4 kcal mol−1 difference, which is within the uncertainty of the calculations. Note that these binding free energies are estimated from 20 distinct sets of independent FEP simulations each with a different initial conformation, so our findings are statistically significant. TOF and nanoparticle size estimates, on the other hand, follow the same pattern as the free energy values in which the mutations do not have a significant impact on the size and function of the nanoparticles. Previous studies29,63 of nanoparticle synthesis using free peptides produced nanoparticles with varying particle sizes. This could be because of the difference in the effective binding free energy between the histidine and Pd ion in the free peptides.| Peptide | Binding free energy (kcal mol−1) | TOF (h−1) | Average particle size (nm) | |||
|---|---|---|---|---|---|---|
| His6 | His11 | Effective | Stille | Suzuki–Miyaura | ||
| GFP-Pd4 | −118 ± 6 | −122 ± 6 | −122 ± 6 | 2945 ± 103 | 11731 ± 839 |
2.6 ± 0.5 |
| GFP-A6 | −122 ± 6 | −122 ± 6 | 2912 ± 101 | 11093 ± 481 |
2.7 ± 0.7 | |
| GFP-A11 | −118 ± 6 | −118 ± 6 | 2942 ± 65 | 10867 ± 443 |
2.6 ± 0.4 | |
To test this hypothesis, we investigated the particle size of nanoparticles made with recombinant fusion peptides to see whether there was a relationship between free energy values and the size of the particles produced. Average particle sizes of 2.6 ± 0.5 (nm), 2.7 ± 0.7 (nm), and 2.6 ± 0.4 (nm) were observed when the nanoparticles were prepared from GFPuv fused Pd4, A6 and A11 peptides, respectively. The particle sizes of the three systems are not only identical on average, but also have similar density distributions (Fig. 3A). The TEM particle size findings for every GFPuv fusion peptide-mediated nanoparticle production were re-sampled 100 times using bootstrapping to estimate the kernel density distribution (Fig. 3A). These nanoparticle size (Table 2) and distribution results (Fig. 3A) are significantly similar and have a consistent trend like binding free energies calculated in our study (Table 2). In Stille coupling processes, similarities between TOF values were also observed for all fusion peptides, which follows the same pattern as the binding free energies. The Suzuki–Miyaura reaction provided different and higher TOF values than the Stille coupling method, but the uniform catalytic behavior of the fusion peptides persisted across these two different reaction types. When compared to the free peptide simulation results (Table 1), the TOF of the fusion peptides in nanoparticle synthesis is different for each peptide, which is expected because the binding free energy of all the His combinations in the free state is significantly different. However in the fused form, the TOF observations from both tests are considerably comparable; as a result, the binding free energies of all His combinations in the fused state are quite similar. This confirms that the binding free energy values of His residues with the Pd ion are proportional to the catalytic rate (Table 2).
As previously discussed, the TOF is varied when either histidine in the free Pd4 peptide is mutated to alanine with A6 and A11 having the greatest and lowest TOF, respectively (Table 1). The TOF variability is not observed in GFP fused peptides (Table 2). While the lower TOF in A11 is justifiable by assuming that His11 is more reactive than His6, which is also consistent with our free energy estimates (Table 1), the reason for higher TOF of the A6 peptide is less clear. This has been attributed to the presence of two histidines in Pd4 and their ability to cover more of the nanoparticle surface as compared to one histidine in A6.30 However, this justification does not seem to be consistent with what we have observed with the GFP fused peptides. Here, we observe very similar TOF values for A6, A11, and Pd4 peptides when attached to the GFP protein. Although we agree with Bedford et al.30 that the presence of two histidines rather than one causes the lower TOF in Pd4 as compared to A6, we hypothesize that the intramolecular interaction of the two histidines may be the more important factor in lowering the activity as compared to the shared interaction with the nanoparticle. This argument is consistent with the fact that we observe significantly more frequent histidine–histidine interactions in free Pd4 than GFP-Pd4. To quantify the interactions more accurately, we have measured His6–His11 interaction energies in Pd4 and GFP-Pd4. We specifically measured the frequency of observing His6–His11 interaction energies that are larger than 1 kcal mol−1 in magnitude (as a measure of non-negligible interactions). In GFP-Pd4, this frequency is only 7% as compared to 23% in free Pd4, indicating that there is a 3-fold decrease in the frequency of His6–His11 interactions when Pd4 is attached to GFP as compared to when it is free. Alternatively, one may consider the interaction energy distributions, which similarly indicates that larger interaction energies are observed more frequently in free Pd4 than in GFP-Pd4 (Fig. S6†). We therefore hypothesize that the histidine–histidine interactions may be behind the lower TOF of Pd4 relative to A6 and since these interactions are less significant in the GFP fused peptide, we no longer observe a lower TOF for GFP-Pd4 relative to GFP-A6.
All GFPuv fusion peptides show a similar trend in the binding free energy, TOF, average nanoparticle size and distribution, supporting our above assumption. Root mean square deviation (RMSD) of the peptides was stable and unvarying in all GFPuv fused systems (Fig. 3C). This implies that GFPuv might be stabilizing the peptide structure during nanoparticle production. In contrast to fused peptides, the free peptide backbone RMSD (Fig. 3B) fluctuated more. Based on the RMSD data, we believe that the conformational stability of the peptide is important in the production of uniform nanoparticles. In support of this claim, all GFPuv fusion peptide experiments produced consistent nanoparticles. GFPuv controlled the peptide structural variations throughout the nanoparticle synthesis, resulting in a quite similar nanoparticle size and distribution (Fig. 3A) across all GFPuv fused peptide-mediated nanoparticle syntheses.
3.4 Secondary structure propensity for GFPuv fusion peptides
A secondary structure analysis of the simulated GFPuv fusion peptides revealed further differences between free peptide simulations and the fusion peptide simulations. The Ramachandran plots of peptides Pd4, A6, and A11 bound to GFPuv are shown in Fig. 4. | ||
| Fig. 4 Structural propensity of the GFPuv fused peptide Pd4, A6, and A11 shown as Ramachandran plots (x-axis ϕ and y-axis ψ angles) of residue 6 (top row) and residue 11 (bottom row). Secondary structures are colored with αR as green, αL as magenta, β as orange, and F as blue. | ||
The coloring cluster of the plots is consistent with Fig. 2. The propensity for αL states was lower in all the bound peptide simulations. Also, the relationship between histidine and αL propensity observed in the free peptide simulations did not exist for the GFPuv fusion peptides. The presence of histidine at positions 6 and 11 had either no correlation or inverse correlation with the αL propensity. For GFP-Pd4, the αL propensity was almost identical for residues 6 and 11. In the GFP-A6 simulations, the histidine at residue 6 showed a very slight increase in the αL propensity, while residue 11 had a secondary structure propensity similar to that of GFP-Pd4. Finally, GFP-A11 showed near zero αL states for both residues, regardless of the presence of a histidine. Unlike the free peptide secondary structure properties discussed previously, the secondary structure of amino acid residues at positions 6 and 11 remains consistent across all GFP-bound states. Furthermore, in contrast to the free peptide-mediated method, the lack of high αL propensity differences resulted in identical binding free energy and similar size nanoparticles in the GFPuv fusion peptide approach. Hence, the secondary structure of the protein ultimately altered the peptide behaviour, which had direct implications for the nanoparticle size (Fig. 3), catalytic reactivity (Table 2) and binding free energy (Table 2) calculations in our examination. The experimental TOF calculations and TEM (Table 2) outcomes for GFPuv fused peptides strongly support the computationally determined free energy (Table 2) results and structural properties of peptides (Fig. 4), thus showing the effectiveness of the approach. Peptides are generated chemically, which makes them expensive. GFP-fused recombinant peptides, on the other hand, can be made more quickly and at a lower cost.
3.5 Hydrogen bond analysis
To further explore the structural differences observed in simulation, a hydrogen bond analysis was performed. Hydrogen bonds are significant interactions in proteins and peptides, contributing to backbone conformational stability differences.64 To quantify hydrogen bonds in the peptide backbones, the hydrogen bond occupancies were calculated with a bond length and angle cutoff of 4.0 Å and 40 °C, respectively, for the simulated trajectories of the free and fusion peptides. To account for the weak hydrogen bond interactions, we used a relatively loose definition of hydrogen bonding; however, a more strict definition (a distance and angle cutoff of 3.5 Å and 30 °C, respectively) gives qualitatively similar results (Fig. S7†). In the hydrogen bond analysis of the free peptides (Fig. 5A), the A6 peptide formed more stable backbone hydrogen bond interactions throughout the course of the simulation than Pd4 and A11, which both had very few hydrogen bonds in the occupancy percentage. We discovered the hydrogen bonds that resulted in significant occupancy in the A6 peptide in free peptide simulations. There are two major hydrogen bond interactions (R10-P7 and A6-L9). The A6-L9 bond is particularly important, with 38 percent occupancy. This hydrogen bond was formed only in the A6 peptide, and being associated with the mutated residue suggests that the H6A (A6) mutation may play a critical role in protein stability. In the A6 peptide, another hydrogen bond with 46 percent occupancy was formed between R10 and P7 residues. Residue 11 had the greatest αL propensity in the A6 free peptide simulations, which might be due to the hydrogen bond between R10 and P7, as they are adjacent residues. And, hydrogen bond interactions are also responsible for backbone conformational stability and secondary structure differences.64 As a result, we can see the difference in the secondary structure between Pd4 and A11 with the absence of these two hydrogen bonds.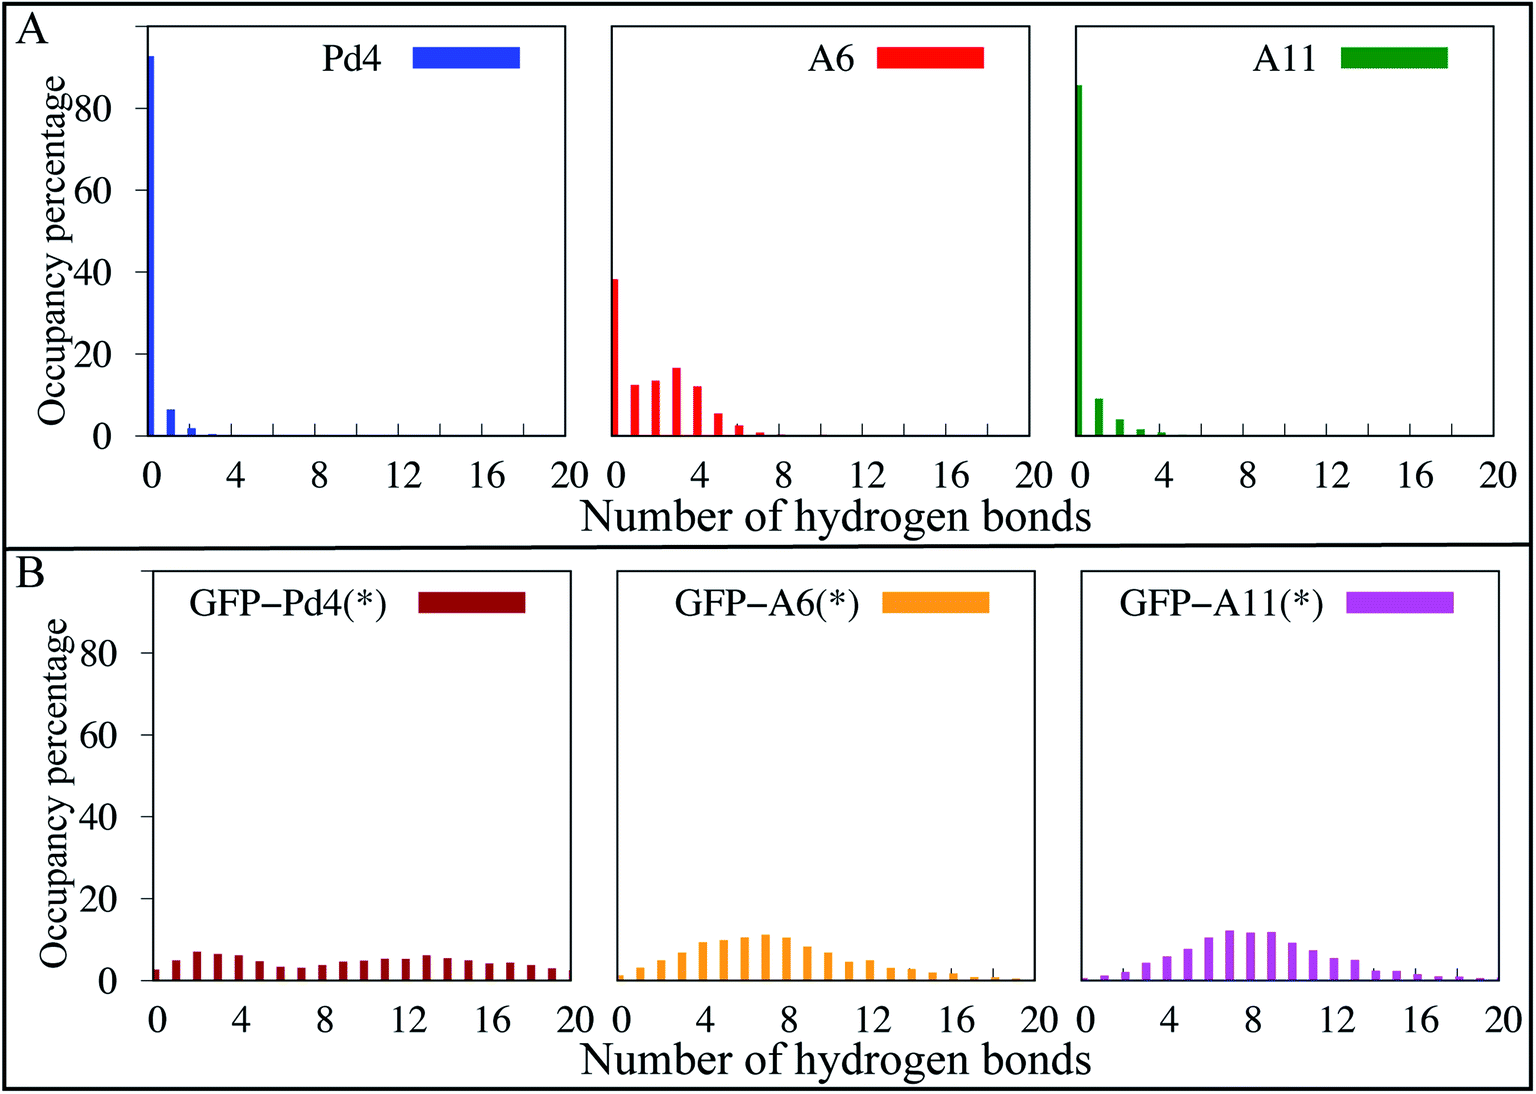 | ||
| Fig. 5 The occupancy percentage of hydrogen bonds calculated from the MD simulations for the (A) free peptides and (B) GFPuv fused peptide region. (*) Only the peptide region in the GFPuv fused peptide simulations was used for hydrogen bond analysis. | ||
In Fig. 5B, hydrogen bond interactions of just the peptide region for GFPuv fusion peptides are reported. The distribution of hydrogen bonds was qualitatively similar for all the GFPuv fusion peptides, with a broad distribution in the number of hydrogen bonds observed. The inclusion of GFPuv improves the peptide stabilization by forming evenly distributed hydrogen bonds, resulting in decreased RMSD of the peptides and a comparable αL propensity regardless of mutation. The principal component analysis (PCA) of Cα atoms in Fig. S9† also reveals substantial differences in the conformations of A6, Pd4, and A11. Pd4 and A11 are equally dispersed along PC1 and PC2, but A6 is clustered differently. When peptides were fused to GFPuv, the PCA of the fusion peptides showed even higher stability, with thicker clusters than free peptides, suggesting minimal variation during simulations. Our findings imply that the GFPuv fused peptide can govern the size and functioning of nanoparticles by stabilizing peptide fluctuations, secondary structure, and surface binding abilities, resulting in a uniform nanoparticle and TOF in experimental data. Mutations in GFPuv fused peptides had no effect on the binding free energies and secondary structure of the peptide, as well as the experimentally measured nanoparticle size and TOF values. Hence, all of our computational findings are in agreement with the experiment results.
Using a combination of simulations and experiments, we have shown a phenomenological relationship between histidine binding affinity, secondary structure, peptide size, and catalytic reactivity. Our simulation models, however, do not explain why a relationship exists between the TOF and binding free energy. We believe that histidine binding affinity, peptide conformational stability, and the secondary structure all influence catalytic reactivity and the size of the nanoparticle. However, understanding these relationships at the molecular level requires a more detailed study and a more complete picture of nanoparticle synthesis and activity, which may enable the development of more effective peptides for nanoparticle formation. Our findings may contribute to the development of other simulation studies investigating the observed relationships.
4 Conclusions
Overall, our computational and experimental results have added molecular level details to the existing sequence dependent different catalytic results in Pd nanoparticle production using free peptides. This research demonstrates how a single amino acid substitution in the free Pd4 peptide sequence may alter the structure and catalytic properties of nanoparticle production. Our findings demonstrate that the H6A mutation increased the αL propensity of residue 11 (Fig. 2) and hydrogen bond occupancy (Fig. 5) in the peptide backbone. This increased the affinity of palladium ions for residue 11 in the A6 peptide. Peptide stability and the secondary structure have a significant impact on these differences in nanoparticle production induced by single mutations in free peptide. The uniformity in the experimental turnover frequency (TOF), particle size (Table 2) and distribution (Fig. 3A) results of nanoparticles using GFPuv fused peptides showed consistent results for all nanoparticles produced and without any aggregation, the nanoparticles remained stable. One of the advantages of our method is that the coupling process was carried out in a water/EtOH mixture, which resulted in a sufficient dipole moment, which prevented the nanoparticles from aggregating even at 80 degrees Celsius. The catalytic activity was attributed to Pd nanoparticles, which are crucial in coupling processes. Based on simulation predictions, GFPuv fused peptides are unaffected by peptide sequence changes which are reported under free peptide conditions. GFPuv acted as a stabilizer when linked to peptides. Since the peptide was stabilized in a fused state, the palladium binding free energy with the histidines (Table 2), RMSD (Fig. 3C), secondary structure (Fig. 4), and hydrogen bond occupancy (Fig. 5) are all extremely comparable between all systems.This paper describes a novel approach for generating multi-functional peptides with distinct amino acid domains for the cost-effective production of nanoparticles. Using FEP/MD simulations, the approach used in this study might be used to successfully manufacture additional nano catalysts, and to explain and perhaps find peptide regions critical to nanoparticle production.
Conflicts of interest
There are no conflicts to declare.Acknowledgements
This research was supported by the National Science Foundation under Award CHE-1945465. This research is part of the Blue Waters sustained-petascale computing project, which is supported by the National Science Foundation (awards OCI-0725070 and ACI-1238993) and the state of Illinois. This work also used the Extreme Science and Engineering Discovery Environment (allocation MCB200215), which is supported by National Science Foundation, grant number ACI-1548562. This research was also supported by the Arkansas High Performance Computing Center, which is funded through multiple National Science Foundation grants and the Arkansas Economic Development Commission.References
- D. J. Gaskin, K. Starck and E. N. Vulfson, Biotechnol. Lett., 2000, 22, 1211–1216 CrossRef CAS.
- S. R. Whaley, D. S. English, E. L. Hu, P. F. Barbara and A. M. Belcher, Nature, 2000, 405, 665–668 CrossRef CAS PubMed.
- R. R. Naik, S. E. Jones, C. J. Murray, J. C. McAuliffe, R. A. Vaia and M. O. Stone, Adv. Funct. Mater., 2004, 14, 25–30 CrossRef CAS.
- R. R. Naik, S. J. Stringer, G. Agarwal, S. E. Jones and M. O. Stone, Nat. Mater., 2002, 1, 169–172 CrossRef CAS PubMed.
- K. I. Sano and K. Shiba, J. Am. Chem. Soc., 2003, 125, 14234–14235 CrossRef CAS PubMed.
- S. Wang, E. S. Humphreys, S. Y. Chung, D. F. Delduco, S. R. Lustig, H. Wang, K. N. Parker, N. W. Rizzo, S. Subramoney, Y. M. Chiang and A. Jagota, Nat. Mater., 2003, 2, 196–200 CrossRef CAS PubMed.
- M. B. Dickerson, R. R. Naik, M. O. Stone, Y. Cai and K. H. Sandhage, Chem. Commun., 2004, 4, 1776–1777 RSC.
- C. K. Thai, H. Dai, M. S. Sastry, M. Sarikaya, D. T. Schwartz and F. Baneyx, Biotechnol. Bioeng., 2004, 87, 129–137 CrossRef CAS PubMed.
- C. Mao, D. J. Solis, B. D. Reiss, S. T. Kottmann, R. Y. Sweeney, A. Hayhurst, G. Georgiou, B. Iverson and A. M. Belcher, Science, 2004, 303, 213–217 CrossRef CAS PubMed.
- B. D. Reiss, C. Mao, D. J. Solis, K. S. Ryan, T. Thomson and A. M. Belcher, Nano Lett., 2004, 4, 1127–1132 CrossRef CAS.
- R. Zuo, D. Örnek and T. K. Wood, Appl. Microbiol. Biotechnol., 2005, 68, 505–509 CrossRef CAS PubMed.
- M. Umetsu, M. Mizuta, K. Tsumoto, S. Ohara, S. Takami, H. Watanabe, I. Kumagai and T. Adschiri, Adv. Mater., 2005, 17, 2571–2575 CrossRef CAS.
- M. Sarikaya, C. Tamerler, A. K. Jen, K. Schulten and F. Baneyx, Nat. Mater., 2003, 2, 577–585 CrossRef CAS PubMed.
- J. M. Slocik and R. R. Naik, Adv. Mater., 2006, 18, 1988–1992 CrossRef CAS.
- M. Sarikaya, C. Tamerler, D. T. Schwartz and F. Baneyx, Annu. Rev. Mater. Res., 2004, 34, 373–408 CrossRef CAS.
- R. Narayanan and M. A. El-Sayed, J. Phys. Chem. B, 2005, 109, 12663–12676 CrossRef CAS PubMed.
- C. K. Kim, R. R. Kalluru, J. P. Singh, A. Fortner, J. Griffin, G. K. Darbha and P. C. Ray, Nanotechnology, 2006, 17, 3085–3093 CrossRef CAS.
- J. Liu and Y. Lu, J. Fluoresc., 2004, 14, 343–354 CrossRef CAS PubMed.
- X. Luo, A. Morrin, A. J. Killard and M. R. Smyth, Electroanalysis, 2006, 18, 319–326 CrossRef CAS.
- J. J. Storhoff, R. Elghanian, R. C. Mucic, C. A. Mirkin and R. L. Letsinger, J. Am. Chem. Soc., 1998, 120, 1959–1964 CrossRef CAS.
- S. Liang, D. T. Pierce, C. Amiot and X. Zhao, Synth. React. Inorg., Met.-Org., Nano-Met. Chem., 2005, 35, 661–668 CrossRef CAS.
- S. G. Penn, L. He and M. J. Natan, Curr. Opin. Chem. Biol., 2003, 7, 609–615 CrossRef CAS PubMed.
- L. Hwang, G. Zhao, P. Zhang and N. L. Rosi, Small, 2011, 7, 1938–1942 CrossRef PubMed.
- R. Coppage, J. M. Slocik, M. Sethi, D. B. Pacardo, R. R. Naik and M. R. Knecht, Angew. Chem., Int. Ed., 2010, 49, 3767–3770 CrossRef CAS PubMed.
- N. Habibi, N. Kamaly, A. Memic and H. Shafiee, Nano Today, 2016, 11, 41–60 CrossRef CAS PubMed.
- P. R. Selvakannan, S. Mandal, S. Phadtare, A. Gole, R. Pasricha, S. D. Adyanthaya and M. Sastry, J. Colloid Interface Sci., 2004, 269, 97–102 CrossRef CAS PubMed.
- S. Si and T. K. Mandal, Chem.–Eur. J., 2007, 13, 3160–3168 CrossRef CAS PubMed.
- R. R. Bhattacharjee, A. K. Das, D. Haldar, S. Si, A. Banerjee and T. K. Mandal, J. Nanosci. Nanotechnol., 2005, 5, 1141–1147 CrossRef CAS PubMed.
- R. B. Pandey, H. Heinz, J. Feng, B. L. Farmer, J. M. Slocik, L. F. Drummy and R. R. Naik, Phys. Chem. Chem. Phys., 2009, 11, 1989–2001 RSC.
- N. M. Bedford, H. Ramezani-Dakhel, J. M. Slocik, B. D. Briggs, Y. Ren, A. I. Frenkel, V. Petkov, H. Heinz, R. R. Naik and M. R. Knecht, ACS Nano, 2015, 9, 5082–5092 CrossRef CAS PubMed.
- N. M. Bedford, A. R. Showalter, T. J. Woehl, Z. E. Hughes, S. Lee, B. Reinhart, S. P. Ertem, E. B. Coughlin, Y. Ren, T. R. Walsh and B. A. Bunker, ACS Nano, 2016, 10, 8645–8659 CrossRef CAS PubMed.
- H. Ramezani-Dakhel, N. M. Bedford, T. J. Woehl, M. R. Knecht, R. R. Naik and H. Heinz, Nanoscale, 2017, 9, 8401–8409 RSC.
- I. Mosleh, M. Benamara, L. Greenlee, M. H. Beyzavi and R. Beitle, Mater. Lett., 2019, 252, 68–71 CrossRef CAS.
- I. Mosleh, H. R. Shahsavari, R. Beitle and M. H. Beyzavi, ChemCatChem, 2020, 12, 2942–2946 CrossRef CAS.
- R. Tejada-Vaprio, I. Mosleh, R. P. Mukherjee, H. Aljewari, McK. Fruchtl, A. Elmasheiti, N. Bedford, L. Greenlee, M. H. Beyzavi and R. Beitle, Biotechnol. Prog., 2020, 36, 3 CrossRef PubMed.
- P. Sanpui, S. B. Pandey, S. S. Ghosh and A. Chattopadhyay, J. Colloid Interface Sci., 2008, 326, 129–137 CrossRef CAS PubMed.
- J. J. Van Thor, G. Y. Georgiev, M. Towrie and J. T. Sage, J. Biol. Chem., 2005, 280, 33652–33659 CrossRef CAS PubMed.
- A. Ali, Mol. Med. Today, 1995, 1, 270–277 CrossRef.
- S. Jo, T. Kim, V. G. Iyer and W. Im, J. Comput. Chem., 2008, 29, 1859–1865 CrossRef CAS PubMed.
- J. Lee, X. Cheng, J. M. Swails, M. S. Yeom, P. K. Eastman, J. A. Lemkul, S. Wei, J. Buckner, J. C. Jeong, Y. Qi, S. Jo, V. S. Pande, D. A. Case, C. L. Brooks, A. D. MacKerell, J. B. Klauda and W. Im, J. Chem. Theory Comput., 2016, 12, 405–413 CrossRef CAS PubMed.
- W. L. Jorgensen, J. Chandrasekhar, J. D. Madura, R. W. Impey and M. L. Klein, J. Chem. Phys., 1983, 79, 926–935 CrossRef CAS.
- J. C. Phillips, R. Braun, W. Wang, J. Gumbart, E. Tajkhorshid, E. Villa, C. Chipot, R. D. Skeel, L. Kalé and K. Schulten, J. Comput. Chem., 2005, 26, 1781–1802 CrossRef CAS PubMed.
- G. J. Martyna, D. J. Tobias and M. L. Klein, J. Chem. Phys., 1994, 101, 4177–4189 CrossRef CAS.
- S. E. Feller, Y. Zhang, R. W. Pastor and B. R. Brooks, J. Chem. Phys., 1995, 103, 4613–4621 CrossRef CAS.
- B. N. Parlett, SIAM Rev., 1974, 16, 396–398 CrossRef.
- S. Jo, T. Kim and W. Im, PLoS One, 2007, 2, e880 CrossRef PubMed.
- R. B. Best, X. Zhu, J. Shim, P. E. M. Lopes, J. Mittal, M. Feig and A. D. MacKerell, J. Chem. Theory Comput., 2012, 8, 3257–3273 CrossRef CAS PubMed.
- J. Huang, S. Rauscher, G. Nawrocki, T. Ran, M. Feig, B. L. De Groot, H. Grubmüller and A. D. MacKerell, Nat. Methods, 2017, 14, 71–73 CrossRef CAS PubMed.
- W. Humphrey, A. Dalke and K. Schulten, J. Mol. Graphics, 1996, 14, 33–38 CrossRef CAS PubMed.
- A. Bakan, L. M. Meireles and I. Bahar, Bioinformatics, 2011, 27, 1575–1577 CrossRef CAS PubMed.
- M. Moradi, V. Babin, C. Sagui and C. Roland, J. Phys. Chem. B, 2011, 115, 8645–8656 CrossRef CAS PubMed.
- R. W. Zwanzig, J. Chem. Phys., 1954, 22, 1420–1426 CrossRef CAS.
- H. Heinz, R. Vaia, B. Farmer and R. Naik, J. Phys. Chem. C, 2008, 112, 1728–17290 CrossRef.
- Z. E. Hughes and T. R. Walsh, J. Phys. Chem. C, 2018, 122, 19625–19638 CrossRef CAS.
- R. Coppage, J. M. Slocik, B. D. Briggs, A. I. Frenkel, R. R. Naik and M. R. Knecht, ACS Nano, 2012, 6, 1625–1636 CrossRef CAS PubMed.
- R. Coppage, J. M. Slocik, H. Ramezani-Dakhel, N. M. Bedford, H. Heinz, R. R. Naik and M. R. Knecht, J. Am. Chem. Soc., 2013, 135, 11048–11054 CrossRef CAS PubMed.
- G. Fiorin, M. Klein and J. Hénin, Mol. Phys., 2013, 111, 3345–3362 CrossRef CAS.
- M. Zacharias, T. P. Straatsma and J. A. McCammon, J. Chem. Phys., 1994, 100, 9025–9031 CrossRef CAS.
- T. C. Beutler, A. E. Mark, R. C. van Schaik, P. R. Gerber and W. F. van Gunsteren, Chem. Phys. Lett., 1994, 222, 529–539 CrossRef CAS.
- C. H. Bennett, J. Comput. Phys., 1976, 22, 245–268 CrossRef.
- P. Liu, F. Dehez, W. Cai and C. Chipot, J. Chem. Theory Comput., 2012, 8, 2606–2616 CrossRef CAS PubMed.
- G. N. Ramachandran, C. Ramakrishnan and V. Sasisekharan, J. Mol. Biol., 1963, 7, 95–99 CrossRef CAS PubMed.
- M. B. Dickerson, S. E. Jones, Y. Cai, G. Ahmad, R. R. Naik, N. Kröger and K. H. Sandhage, Chem. Mater., 2008, 20, 1578–1584 CrossRef CAS.
- C. Pace, H. Fu, K. Fryar, J. Landua, S. Trevino, D. Schell, R. Thurlkill, S. Iimura, J. M. Scholtz, K. Gajiwala, J. Sevcik, L. Urbániková, J. Myers, K. Takano, E. Hebert, B. Shirley and G. Grimsley, Protein Sci., 2014, 23, 5 CrossRef PubMed.
Footnote |
| † Electronic supplementary information (ESI) available: Supporting figures and tables. See https://doi.org/10.1039/d2na00212d |
| This journal is © The Royal Society of Chemistry 2022 |