
 Open Access Article
 This Open Access Article is licensed under a Creative Commons Attribution-Non Commercial 3.0 Unported Licence
Optical humidity sensors based on lead-free Cu-based perovskite nanomaterials
Hoseok Leea,
Donghwa Leea,
Haedam Jinb,
Dohun Baeka,
Mi Kyong Kimb,
Jeongbeom Chab,
Sung-Kon Kim *a and
Min Kim*ab
*a and
Min Kim*ab
aSchool of Chemical Engineering, Jeonbuk National University, Jeonju 54896, Republic of Korea. E-mail: skkim@jbnu.ac.kr
bGraduate School of Integrated Energy-AI, Jeonbuk National University, Jeonju 54896, Republic of Korea. E-mail: minkim@jbnu.ac.kr
First published on 8th June 2022
Abstract
Organometallic halide perovskite materials possess unique and tunable optical properties with a wide range of optoelectronic applications. However, these materials suffer from humidity-driven degradation in ambient atmospheres. In this paper we investigate stable copper-based perovskite nanocrystals for potential use in humidity sensors, specifically examining their unique humidity-dependent optical properties and reversibility. We controlled stoichiometric ratios of Cu-based perovskites and demonstrated that (methylammonium)2CuBr4 nanocrystals showed excellent reversible physisorption of water molecules. These perovskite nanocrystals exhibited reversible hydro-optical properties, including transparency changes in response to variations in relative humidity under ambient conditions. The perovskite nanomaterial humidity sensor was highly reliable and stable, with a linear correlation in a relative humidity range of 7% to 98%. Accordingly, the lead-free Cu-based perovskite materials developed herein have the potential to be employed as real-time, self-consistent humidity sensors.
Introduction
Humidity sensing plays an important role across numerous fields, including agriculture, food processing and storage, biology, chemistry, pharmaceuticals, and manufacturing.1 Various types of sensors have been developed to monitor humidity levels, including electronic and optical sensors. Electronic sensors have been widely used to measure humidity in diverse atmospheres by detecting fluctuations in electrical conductivity, capacitance, and resistance.2–5 However, electronic sensors are not always safe to us, for example when the atmosphere contains flammable gases.6Optical humidity sensors change their properties, such as their transparency or color, depending on the relative humidity, and provide a simple, safe, self-sustaining, and equipment-free means of measurement.7 Accordingly, optical humidity sensors are increasingly deployed across research fields. In the past few years alone, optical humidity sensing materials as diverse as photonic crystals, minerals, graphene composites, and gold nanoparticles have been investigated.6–9 Despite their potential, conventional humidity sensing materials still require complicated syntheses and exhibit low detection sensitivity.
Recently, organic–inorganic lead halide perovskites have been generating interest because of their excellent optoelectronic properties in photovoltaics including their high photoluminescence quantum yield (PLQY), tunable band gap, and superior charge transport performance.10 These qualities have allowed them to rapidly incorporate into optoelectronic devices, including solar cells, photodetectors, light-emitting diodes, and chemical sensors.11–13 The favorable molecular adsorption of cation elements by organometal hybrid perovskites provides them with a high sensitivity to specific chemicals, such as NH3, H2O, and O3,14 a capability that naturally suggests a potential role for them in chemical sensors.15 Unfortunately, the strong reactivity of perovskite materials induces phase instability under chemical exposure, limiting their usefulness.16 Efforts are nevertheless being undertaken to improve the structural tolerance of organometal halide perovskites in anticipation of their deployment in sensory devices.15 Some researchers have analyzed a fluence humidity sensor based on methylammonium lead tribromide perovskite.17,18 Alternatively, nanostructuring and surface modification of perovskite materials have been performed in an effort to improve chemical sensitivity.19–24 With either method, however, the risk remains of including a hazardous lead element in the developed perovskites.
In this paper, we demonstrate a novel application of a lead-free halide perovskite material in an optical humidity sensor. We compared two different perovskite phases (CH3NH3)2CuBr4 and (CH3NH3)3Cu2Br5 from precursors methylammonium (MA) and copper bromide (CuBrx). We introduced MA to improve moisture-reactivity, and introduced Cu to avoid the possible negative environmental impacts associated with the inclusion of lead. The material stability and moisture-absorbing properties of the synthesized perovskite nanomaterials were examined and correlated with humidity sensing performance. To accomplish this, thin films processed from the nanomaterials were monitored for a transition in optical properties, a process which can be observed with the naked eye. Using this simple synthesis method, we developed a material that excluded harmful components, i.e., we fabricated an environmentally friendly optical humidity sensor using Cu-based perovskite nanomaterials that does not require an external power supply. This material is therefore suitable for mass-production and incorporation into humidity-sensing optoelectronic devices.
Experimental
Synthesis of perovskites
CuBr (99.999%), CuBr2 (99%), and CH3NH3Br, MABr (98%) were purchased from Sigma-Aldrich (USA). All chemicals were used without further purification. We synthesized MA2CuBr4 and MA3Cu2Br5 copper-based perovskite nanoparticles using a reprecipitation method. The stoichiometric ratio of MA2CuBr4 was 2![[thin space (1/6-em)]](https://www.rsc.org/images/entities/char_2009.gif) :1:4, and the stoichiometric ratio of MA3Cu2Br5 was controlled to be 3:2:5. The MA2CuBr4 nanoparticles were synthesized by dissolving a mixture of 0.2 mmol CH3NH3Br and 0.1 mmol CuBr2 in 1 mL DMF. And 300 μL of precursor solution was added to 3 mL of chloroform under conditions of vigorous stirring. For the synthesis of the MA3Cu2Br5 nanoparticles, a mixture of 0.3 mmol CH3NH3Br and 0.2 mmol CuBr was dissolved in 1 mL of DMF. 300 μL of precursor solution was added to 3 mL of chloroform under conditions of vigorous stirring.
:1:4, and the stoichiometric ratio of MA3Cu2Br5 was controlled to be 3:2:5. The MA2CuBr4 nanoparticles were synthesized by dissolving a mixture of 0.2 mmol CH3NH3Br and 0.1 mmol CuBr2 in 1 mL DMF. And 300 μL of precursor solution was added to 3 mL of chloroform under conditions of vigorous stirring. For the synthesis of the MA3Cu2Br5 nanoparticles, a mixture of 0.3 mmol CH3NH3Br and 0.2 mmol CuBr was dissolved in 1 mL of DMF. 300 μL of precursor solution was added to 3 mL of chloroform under conditions of vigorous stirring.
Fabrication of optical humidity sensors
Polymethyl methacrylate (PMMA) was coated on a glass substrate to prevent perovskite nanoparticle aggregation on the substrate during hydration/dehydration cycle testing. 1 g of PMMA was dissolved in 20 mL of THF (50 mg mL−1). The PMMA solution was coated by using a spin coater on glass (300 μL, 3000 rpm, 15 s). The perovskite nanoparticle solution was coated on PMMA coated glass. We used the perovskite nanoparticle films for detecting relative humidity under ambient conditions.Preparation of saturated salt aqueous solution
Various saturated salt solutions were used to provide different RH atmospheres in a manner consistent with that described in previous literature. 20 mL of saturated solutions of LiBr, LiCl, CH3COOK, MgCl2, K2CO3, NaBr, KI, NaCl, KCl, and K2SO4 were put into closed Petri dishes. These saturated salt solutions provided different RH values (7, 11, 23, 33, 43, 59, 70, 75, 85 and 98%, respectively).Hydration and dehydration processes
We constructed several chambers with closed Petri dishes containing the respective saturated salt solution that provides 7% to 98% RH. The perovskite nanoparticle films were placed in the respective chambers with the RH variations to observe the absorbance change using a spectrophotometer. The chambers are designed to have two opposing windows that allow light to pass through. We put the perovskite nanoparticle films in the 98% RH chamber and 7% RH chamber alternately for the extreme cyclic hydration and dehydration processes.Optical sensing characterization
UV spectra were collected using a spectrophotometer (JASCO V-670, Japan) at room temperature. We constructed a chamber (320 mL) to fit into the spectrophotometer and put a Petri dish containing each salt solution in the chamber to control humidity. Both sides of the chamber were designed to have the opposing glasses so the light source could be transmitted toward the detector. The absorbance spectra were collected from 350 nm to 850 nm after the perovskite films were placed in a closed chamber at each RH for 30 minutes.Characterization
X-ray diffraction (XRD) data were measured using a MAX-2500 X-ray diffractometer (RIGAKU, Japan). Scanning electron microscopy (SEM) images were obtained using an SEM (Bruker, Germany) at the Future Energy Convergence Core Center (FECC). Fourier Transform Infrared (FT-IR) spectra were collected from 400 cm−1 to 4000 cm−1 using a FT-IR spectrometer (PerkinElmer, Frontier, USA) at room temperature installed in the Center for University-wide Research Facilities (CURF) at Jeonbuk National University. The surface composition of the perovskite was checked by X-ray photoelectron spectroscopy (XPS) analysis using a Nexsa XPS system (ThermoFisher Scientific, UK) with a monochromatic Al X-ray source.Results and discussion
As shown in Fig. 1a, we synthesized Cu-based perovskite nanoparticles (NPs) via reprecipitation.25 Our synthesis scheme injects the precursor solution, which was obtained by dissolving MABr, CuBr and/or CuBr2 in DMF. This solution is then added into a vigorously stirred poor solvent (chloroform). Notably, we synthesized those chemicals without any organic ligand because the long hydrocarbon chains of organic ligands would have inhibited the adsorption of H2O molecules to the perovskite NPs. We selected and compared two different perovskite phases: MA2CuBr4 and MA3Cu2Br5. These two phases were successfully synthesized by controlling the stoichiometric ratio of the precursor ratio of MABr to copper bromide. | ||
| Fig. 1 (a) Schematic illustration of the synthesis of perovskite nanoparticles (MA2CuBr4 and MA3Cu2Br5 NPs). (b) Crystal structures and (c) X-ray diffraction patterns of MA2CuBr4 and MA3Cu2Br5. SEM images of the top-view and cross-sectional view of (d) MA2CuBr4 and (e) MA3Cu2Br5 NPs. | ||
The MA2CuBr4 NPs were prepared from a solution containing MABr and CuBr2 (stoichiometry ratio = 2:1), and they exhibit a dark color of the 2D Ruddlesden–Popper (RP) perovskite phase. This black color of MA2CuBr4 NPs in the 2D RP phase has been reported previously.26,27 In the case of MA3Cu2Br5 NPs, the NPs were prepared from a solution of dissolved MABr and CuBr (stoichiometry ratio = 3:2), presenting a brown color within the 3D perovskite phase (Fig. 1b). Analysis of subsequent X-ray diffraction (XRD) patterns confirmed that the MA2CuBr4 crystal structure corresponded to the orthorhombic crystal system (space group = Pbca),26,27 thereby forming a 2D perovskite phase with alternating organic and inorganic slabs of CuBr42− (Fig. 1c). The XRD characteristics were consistent with previously reported results and simulated patterns, exhibiting the (001), (003), and (004) diffraction peaks of the 2D perovskite phase.26 In the case of MA3Cu2Br5, its crystal structure was that of an orthorhombic crystal system (space group = Pnma) with a 3D perovskite phase. MA3Cu2Br5 is composed of two types of Cu+ sites present in [Cu2Br5] clusters, including a tetrahedral [CuBr4] site and a trigonal planar [CuBr3] site.28,29 These two units are edge-sharing to form a dimeric [Cu2Br5] cluster, isolated by MA+ ions. The crystal morphologies of our perovskite NPs were analyzed from SEM images. The pristine MA2CuBr4 NPs showed nanoplatelet formations between 200 and 300 nm in size, while the MA3Cu2Br5 NPs exhibited grain-shaped particles several hundred nanometers in size. The morphologies of these perovskite NPs, which had a high volume to surface ratio, were found to contribute to high moisture adsorption sensitivity. The thicknesses of the Cu perovskite NP films are compared in the cross-section SEM images: ∼3 μm for MA2CuBr4 and ∼4 μm for MA3Cu2Br5, respectively (Fig. 1d and e). The thicker film of MA3Cu2Br5 is attributed to the higher molar concentration of the precursor solution.
The perovskite NPs were drop-cast, formed into thin films, and placed in a humidity-controlled chamber. The relative humidity (RH) was raised from 7% to 98% by vaporizing water from saturated salt solutions.30,31 We monitored absorption spectra under each RH condition. The MA2CuBr4 film showed a blackish-gray color at low RH in a pristine film state and became increasingly transparent as RH increased, finally becoming completely transparent at RH 98% (Fig. 2a). The absorption spectra of MA2CuBr4 NP showed typical features of copper complexes CuX42− in square planar coordination and the sub-bandgap absorption feature ranging from 700 to 850 nm, assigned to d–d transitions within the d levels of Cu.32–34 The absorption edge located at 700 nm and with a corresponding band gap energy of 1.80 eV slightly shifted to a shorter wavelength (680 nm) as RH increased (Fig. 2b). The absorption spectrum of MA2CuBr4 NPs did not show characteristic absorption peaks at an RH of 98%. As RH decreased, the MA2CuBr4 NP film returned to its black-colored phase. The absorbance intensity at a wavelength of 570 nm was evaluated with regard to relative humidity, showing a linear correlation with an R2 of 0.9658 (Fig. 2d). Such a clear relationship indicated that the MA2CuBr4 nanomaterial could be an effective building block for humidity sensing.
 | ||
| Fig. 2 (a) Optical images of MA2CuBr4 and MA3Cu2Br5 NP films kept in a chamber with controlled RH conditions. Absorbance spectra of (b) MA2CuBr4 NP and (c) MA3Cu2Br5 NP films at controlled RH from 7% to 98%. RH versus normalized absorbance value at 570 nm of (d) the MA2CuBr4 NP film with a linear fit and (e) the MA3Cu2Br5 NP film. | ||
In contrast, in the case of MA3Cu2Br5, the NPs exhibited a dark-brown color when kept at low RH and became transparent when RH rose (Fig. 2a). The absorption spectra of MA3Cu2Br5 show an absorption edge at 650 nm and a corresponding band gap energy of 1.70 eV. The absorption edge shifted to longer wavelengths of up to 700 nm as RH increased (Fig. 2c). However, unlike MA2CuBr4, the absorbance of MA3Cu2Br5 NPs did not vary as a function of RH within the 7% to 59% RH range (Fig. 2e). Once RH is over 60%, however, the absorption spectra changed dramatically to become transparent as RH increased. This non-linear absorption transition behavior suggests that the hydration mechanism of MA3Cu2Br5 differs from that of MA2CuBr4. The magnitude of the absorbance of MA3Cu2Br5 perovskite NPs is higher than that of MA2CuBr4, which is attributed to the thicker film thickness, as confirmed by the cross-sectional SEM images of the NP films. The hydration mechanisms of NPs will be discussed later.
The repeatable nature of the transparency change of the Cu-perovskite NPs was tested by monitoring the absorbance of NPs during cyclic variations of RH between 7% and 98%. The absorbance intensity of the MA2CuBr4 recovered its original value when RH was changed from 98% to 7% (Fig. 3a). After RH was changed 9 times, a stable recovery of the absorbance value of MA2CuBr4 was observed, confirming excellent reversibility. In contrast, the NP film of MA3Cu2Br5 exhibited a weakened variation in its absorbance value during repetitive RH cycling, indicating that the MA3Cu2Br5 NPs experienced phase degradation as the cycles were repeated (Fig. 3b). At the end of RH cyclic testing, the MA3Cu2Br5 film showed a yellowish translucent morphology. We further measured the response time of the absorbance change of the Cu-perovskite NP films under the RH changes by alternately transferring the sensing films between 7% and 98% RH. We tracked the absorbance at the wavelength of 515 nm during the RH change. The response time for the MA2CuBr4 film and MA3Cu2Br5 film was measured similarly and was found to be trise = ∼200 s when changing RH from 98% to 7% and tfall = ∼400 s when changing RH from 7% to 98% (Fig. 3c and d). Based on the slower fall time of response behavior than the rise time, it is speculated that the adsorption process of water on the nanoparticle surface is slower than the desorption process. Interestingly, a stark difference in the response curve was observed that, contrary to MA2CuBr4, the MA3Cu2Br5 film showed a significant drop of absorbance after reaching the designated absorbance at 7%, which indicates that the MA3Cu2Br5 film undergoes a slight degradation during hydration and dehydration processes.
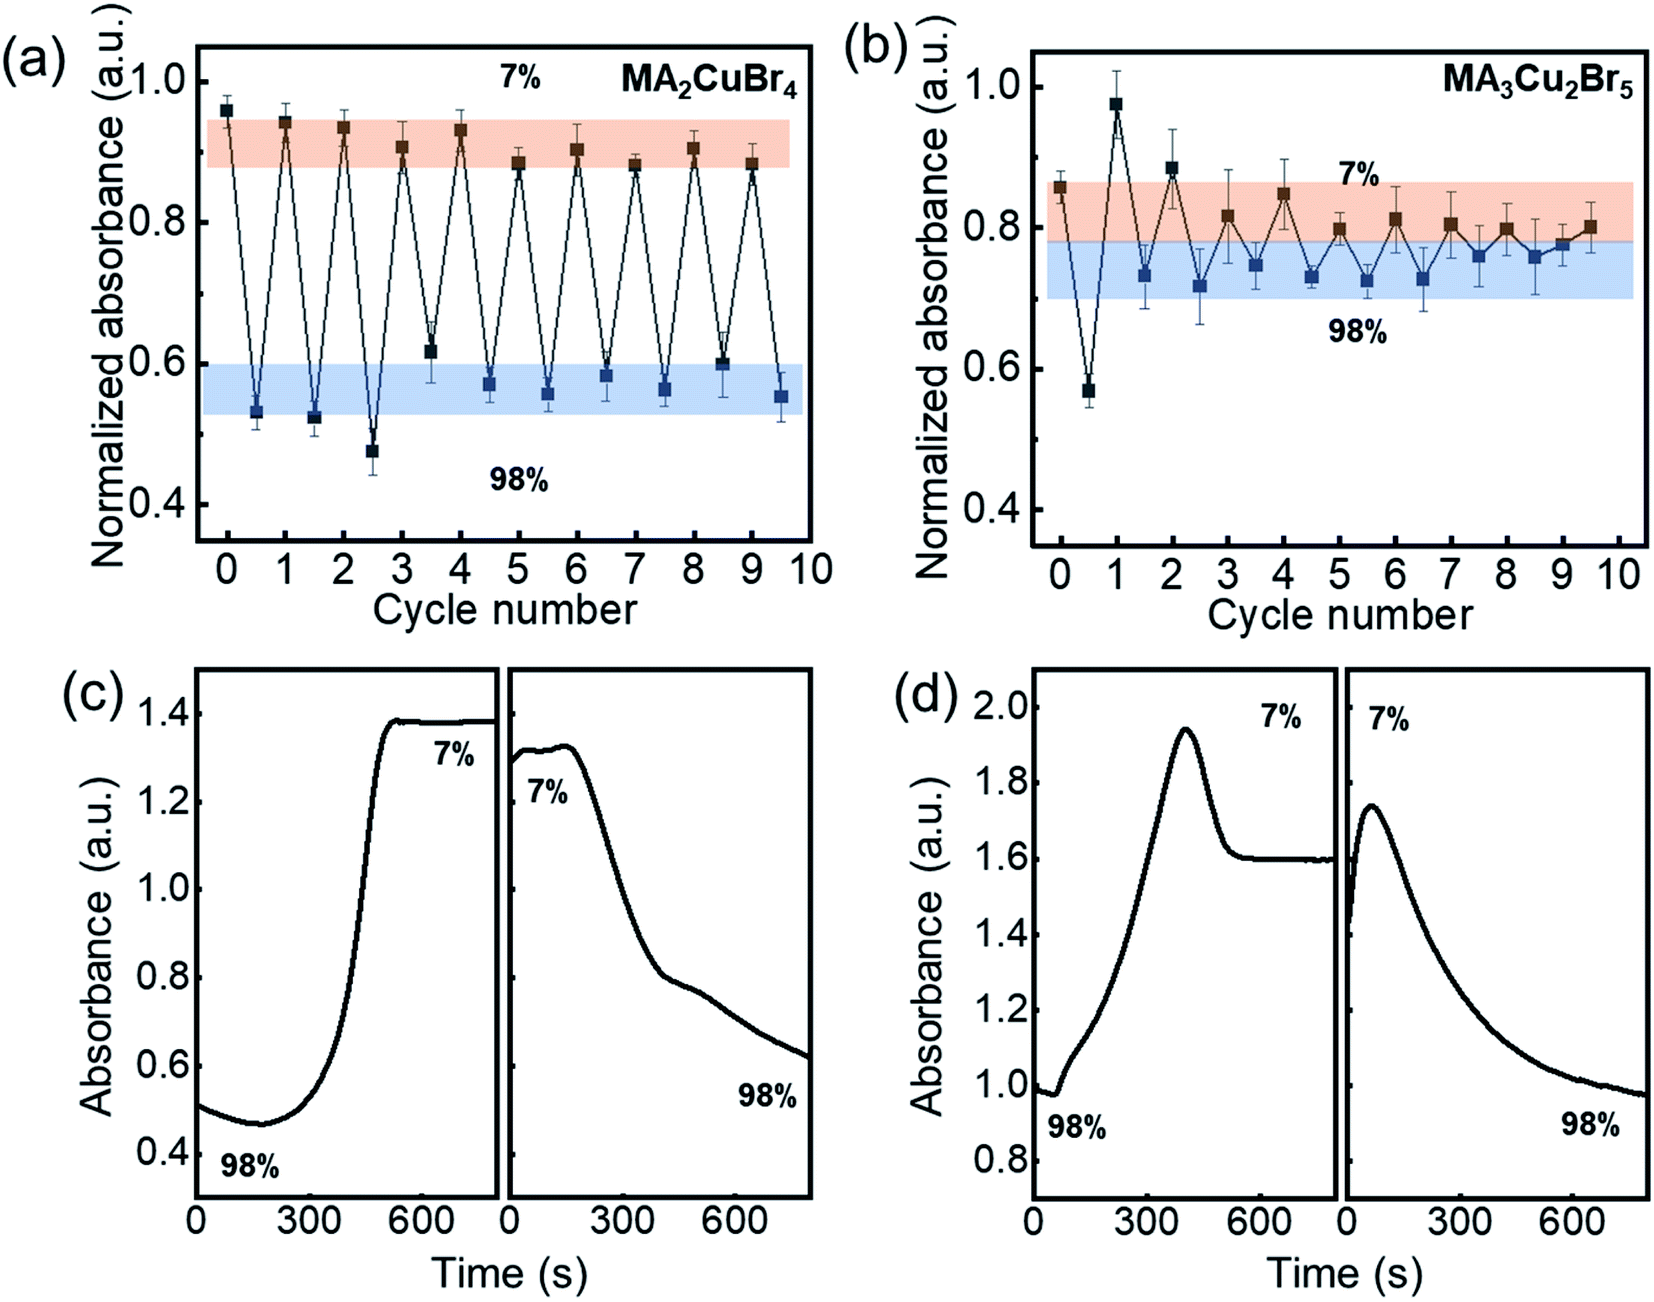 | ||
| Fig. 3 Cyclic hydration and dehydration tests (between relative humidity, RH = 7% and 98%) of the optical humidity sensor by measuring the absorbance of (a) MA2CuBr4 and (b) MA3Cu2Br5 NP films. Response test of the optical humidity sensor by measuring absorbance as a function of time, switching RH from 98% to 7%, and vice versa, based on (c) MA2CuBr4, and (d) MA3Cu2Br5 NP films. | ||
To verify the crystalline phase during the hydration test, we performed X-ray diffraction of our NP films before and after hydration. A chamber was designed to hold a sample, which was hydrated for XRD measurements. The XRD profile of the MA2CuBr4 film exhibited a characteristic diffraction pattern with dominant peaks at 9°, 28°, and 38° consistent with a 2D perovskite crystal structure (Fig. 4a). Upon hydration of the MA2CuBr4 film, the diffraction peaks disappeared in their entirety, suggesting that the crystalline phase had become amorphous by adsorbing water molecules. As the samples were dehydrated, the intensity of the diffraction peaks returned to its original state, as the crystalline phase had recovered completely. The XRD profile of the MA3Cu2Br5 film showed characteristic diffraction peaks in the 8° to 13° region (Fig. 4b). The hydrated NPs, in contrast, show a completely different XRD profile from the pristine XRD profile, which corresponds to the diffraction peak at 14.7° of the CuBr2 crystal phase. The XRD pattern of the hydrated NP retains the CuBr2 peak positions even after dehydration, suggesting that hydration decomposed the MA3Cu2Br5 phase into CuBr2 and other decomposed species. We hypothesize that the MA3Cu2Br5 perovskite undergoes an easy transformation during a hydration reaction, during which Cu2Br5 becomes CuBr2 as Cu+ oxidizes to Cu2+.
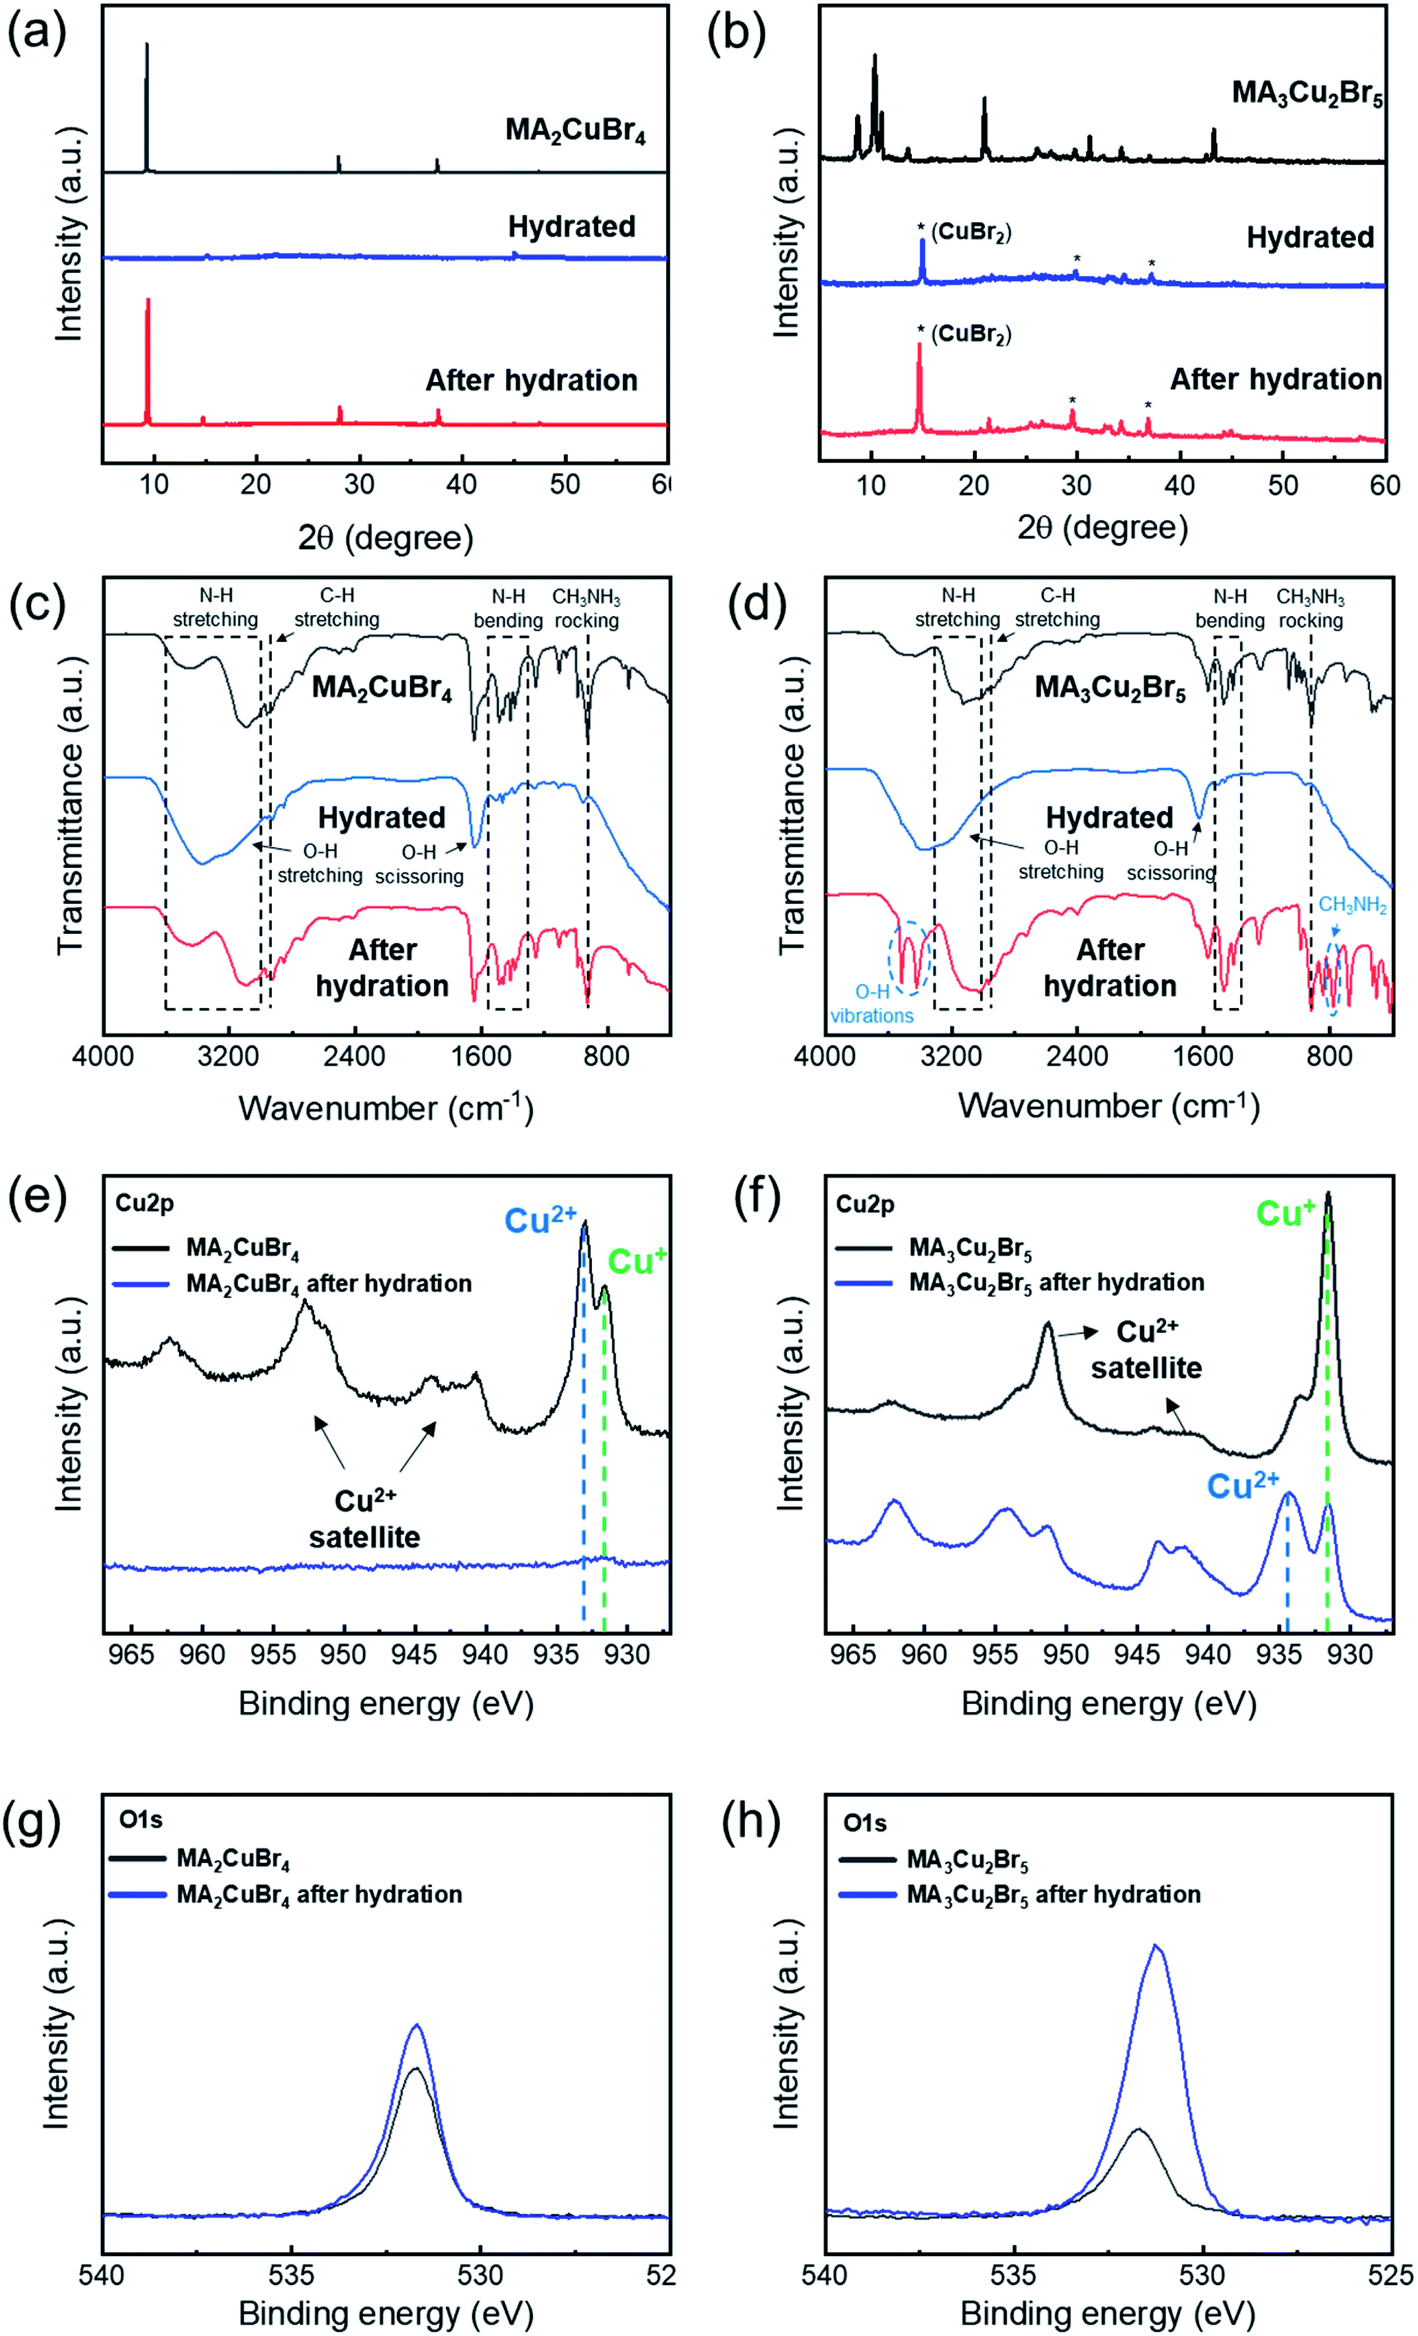 | ||
| Fig. 4 XRD patterns of (a) MA2CuBr4 and (b) MA3Cu2Br5 under pristine, hydrated, and post-hydration conditions. FT-IR spectra of (c) MA2CuBr4 and (d) MA3Cu2Br5 under pristine, hydrated, and post-hydration conditions. XPS spectra of (e) MA2CuBr4 for Cu2p, (f) MA3Cu2Br5 for Cu2p, (g) MA2CuBr4 for O1s, and (h) MA3Cu2Br5 for O1s pre- and post-hydration. | ||
We performed FT-IR and XPS analyses to investigate the hydro-optical transition mechanisms of the perovskite NPs. The FT-IR spectra of both MA2CuBr4 and MA3Cu2Br5 showed strong peaks (1630 cm−1 and 3370 cm−1), corresponding to a stretching mode of the OH group that originates from water molecules during the hydration process (Fig. 4c). In the case of MA2CuBr4 (when the NPs were dehydrated), the FTIR spectra recovered their original shape after hydration. In the case of MA3Cu2Br5, post-hydration, the FTIR spectrum pattern changed to show additional peaks representing chemical decomposition, located at 780 cm−1, 810 cm−1, 3420 cm−1, and 3500 cm−1. The emerging peaks at 780 cm−1 and 810 cm−1 correspond to the rocking mode of the CH3NH2 molecule, indicating the formation of a methylamine molecule (CH3NH2) (Fig. 4d). We speculate that MA3Cu2Br5 decomposes during hydration reactions, producing methylamine. In addition, the two well-defined peaks at 3420 cm−1 and 3500 cm−1 are associated with the OH vibration of water molecules,35 indicating that water molecules, captured in the perovskite NPs, remained as a hydrate product in the MA3Cu2Br5 NPs after dehydration.
We compared the XPS spectra of Cu2p from the MA2CuBr4 and MA3Cu2Br5 NPs before and after hydration. In the case of MA2CuBr4, post-hydration the peaks corresponding to Cu2p had weakened considerably, and the intensity of the peak corresponding to O1s had slightly increased (Fig. 4e and g). These findings as a result of MA2CuBr4 NPs becoming enriched with water molecules after hydration lead the crystalline structure and molecular vibration characteristics to revert to their original state following dehydration.
In the case of MA3Cu2Br5, an XPS peak (931.6 eV) corresponding to a Cu+ ion was the largest among the Cu2p peaks observed in this original state (Fig. 4f and h). However, after hydration, the intensity of the peak at 934.3 eV, which corresponds to a Cu2+ ion, is higher than the intensity of the peak that corresponds to the Cu+ ion.26 This is because Cu exists as a monovalent ion in the pristine perovskite structure, but is decomposed into CuBr2 after hydration, whereupon it is converted into a divalent ion. In addition, the peak corresponding to O1s increased significantly after hydration as water molecules formed hydrates with decomposed CuBr2.
For a practical humidity sensor, stability is one of the essential properties. To check the sensor performance for long-term stability, we kept the perovskite films under ambient conditions for 30 days. The absorbance of the films was measured under cyclic conditions between RH = 98% and 7% in a pristine state and after one month of storage (Fig. 5a and b). The MA2CuBr4 film maintained its modulation of the absorbance between RH 98% and 7%, whereas the MA3Cu2Br5 film exhibited deteriorated repeatability of absorbance even after 7 day storage. The higher robustness of the MA2CuBr4 humidity sensor than that of MA3Cu2Br5 agrees with the experimental data from XRD, FT-IR, and XPS studies. To further demonstrate the advantages of our designed sensor, we compare the humidity sensing performances of Cu perovskite NP films with those of other optical humidity sensors (Table 1).6,36–39 Our humidity sensor with the MA2CuBr4 film exhibits a wide RH sensing range and comparable response time.
 | ||
| Fig. 5 Cyclic stability test of the humidity sensor between RH = 98% and 7% in the pristine state, after 7 days, and after 1 month based on (a) MA2CuBr4 and (b) MA3Cu2Br5 NP films. Schematic illustrations of (c) the MA2CuBr4 crystal structure and its reversible transformation during hydration and dehydration processes, and (d) the MA3Cu2Br5 crystal structure and its irreversible chemical process, which forms CuBr2··6H2O and CH3NH2. | ||
| Material | Target | Measurement | Measuring range (RH) | Sensitivity | Response time | Stability | Ref |
|---|---|---|---|---|---|---|---|
| CdTe@Au/NaOH | Humidity | Absorbance | 5–97% | 910 a.u./% RH | ∼30 s | 30 days | 36 |
| BTB-palygorskite | Humidity | Reflectance | 11–75% | — | 4 min | — | 6 |
| Methylene blue/zeolite | Humidity | Absorbance | 9–92% | 2.27 × 10⁻³/% RH | 2–4 min | 1 month | 37 |
| Methylene blue/polymer | Humidity | Absorbance | 0–50% | — | 60 s | 7 months | 38 |
| Polyamide/cobalt chloride | Humidity | Absorbance | 12.4–97.2% | — | 65.4 s | — | 39 |
| This work | Humidity | Absorbance | 7–98% | 5.29 × 10⁻³/% RH | ∼300 s | 1 month |
Based on the sensing and material properties collected in this study, the schematic illustrations of the hydration and dehydration mechanisms of MA2CuBr4 and MA3Cu2Br5 are presented in Fig. 5c and d. In the case of MA2CuBr4, once it was hydrated, the penetration of H2O molecules caused its crystal structure to collapse into an amorphous phase. Once dehydrated, however, the MA2CuBr4 NPs recovered their original crystal structure while also forming an H2O-enriched thin sheath film on the NP surfaces. This structural transition proved to be reversible during hydration and dehydration cyclic testing. With regard to MA3Cu2Br5, the adsorbed water molecules underwent a chemical reaction with [Cu2Br5]3−, producing CuBr2 hydrate, CuBr2, and methylamine via oxidation, with the result that the MA3Cu2Br5 crystal structure did not recover its original state after dehydration, instead maintaining its CuBr2 component. This limitation of the MA3Cu2Br5 NPs makes them unfit for incorporation into humidity sensors, while the MA2CuBr4 NPs offer robust humidity sensitivity and potentially have numerous optical humidity sensor applications.
Conclusions
In summary, we synthesized lead-free perovskite MA2CuBr4 and MA3Cu2Br5 by a simple ligand-free reprecipitation method. After comparing MA2CuBr4 and MA3Cu2Br5 NPs, we concluded that MA2CuBr4 manifested a higher sensitivity to water molecule adsorption, changing its optical properties from black to transparent. Importantly, the MA2CuBr4 NPs exhibited robust stability and repeatability throughout hydration cyclic testing, suggesting their excellent potential as humidity sensor components. The proposed humidity sensor would not require external power to measure relative humidity, as the necessary changes in the state can be observed with the naked eye. In light of these advantages, we anticipate that this material will find a home in a wide range of humidity sensors or hydrochromic materials.Conflicts of interest
The authors state that there are no conflicts to declare.Acknowledgements
H. Lee, D. Lee, and H. Jin contributed equally to this work. This work was supported by a grant from the National Research Foundation of Korea (NRF) funded by the Korean government (MSIT) (No. 2021R1C1C1012188) and “Human Resources Program in Energy Technology” of the Korea Institute of Energy Technology Evaluation and Planning (KETEP), which was granted financial resources from the Ministry of Trade, Industry & Energy, Republic of Korea (No. 20204010600470). S.-K. K acknowledges the support from the National Research Foundation of Korea (NRF) grant funded by the Korea government (MSIT) (NRF-2021M2D2A1A0204148211). The authors would like to thank the Writing Center at Jeonbuk National University for its skilled proofreading service.References
- L. Alwis, T. Sun and K. T. V. Grattan, Measurement, 2013, 46, 4052–4074 CrossRef.
- M. Matsuguchi, S. Umeda, Y. Sadaoka and Y. Sakai, Sens. Actuators, B, 1998, 49, 179–185 CrossRef CAS.
- A. Rivadeneyra, J. Fernández-Salmerón, M. Agudo, J. A. López-Villanueva, L. F. Capitan-Vallvey and A. J. Palma, Sens. Actuators, B, 2014, 195, 123–131 CrossRef CAS.
- Z. Chen and C. Lu, Sens. Lett., 2005, 3, 274–295 CrossRef CAS.
- R.-J. Wu, Y.-L. Sun, C.-C. Lin, H.-W. Chen and M. Chavali, Sens. Actuators, B, 2006, 115, 198–204 CrossRef CAS.
- Z. Wang, Y. Zhang, W. Wang, Q. An and W. Tong, Chem. Phys. Lett., 2019, 727, 90–94 CrossRef CAS.
- M. B. Sobhanimatin, S. Pourmahdian and M. M. Tehranchi, Polym. Test., 2021, 98, 106999 CrossRef CAS.
- H. Chi, L. J. Ze, X. Zhou and F. Wang, Dyes Pigm., 2021, 185, 108916 CrossRef CAS.
- M. A. Squillaci, X. Zhong, L. Peyruchat, C. Genet, T. W. Ebbesen and P. Samorì, Nanoscale, 2019, 11, 19315–19318 RSC.
- S. G. Motti, D. Meggiolaro, A. J. Barker, E. Mosconi, C. A. R. Perini, J. M. Ball, M. Gandini, M. Kim, F. De Angelis and A. Petrozza, Nat. Photonics, 2019, 13, 532–539 CrossRef CAS.
- M. Kim, J. M. Figueroa-Tapia, M. Prato and A. Petrozza, Adv. Energy Mater., 2020, 10, 1903221 CrossRef CAS.
- H. Wei, Y. Fang, P. Mulligan, W. Chuirazzi, H.-H. Fang, C. Wang, B. R. Ecker, Y. Gao, M. A. Loi, L. Cao and J. Huang, Nat. Photonics, 2016, 10, 333–339 CrossRef CAS.
- Z. Zhu, Q. Sun, Z. Zhang, J. Dai, G. Xing, S. Li, X. Huang and W. Huang, J. Mater. Chem. C, 2018, 6, 10121–10137 RSC.
- M. Shellaiah and K. W. Sun, Chemosensors, 2020, 8, 55 CrossRef CAS.
- M. A. Haque, A. Syed, F. H. Akhtar, R. Shevate, S. Singh, K.-V. Peinemann, D. Baran and T. Wu, ACS Appl. Mater. Interfaces, 2019, 11, 29821–29829 CrossRef CAS PubMed.
- R. Guo, D. Han, W. Chen, L. Dai, K. Ji, Q. Xiong, S. Li, L. K. Reb, M. A. Scheel, S. Pratap, N. Li, S. Yin, T. Xiao, S. Liang, A. L. Oechsle, C. L. Weindl, M. Schwartzkopf, H. Ebert, P. Gao, K. Wang, M. Yuan, N. C. Greenham, S. D. Stranks, S. V. Roth, R. H. Friend and P. Müller-Buschbaum, Nat. Energy, 2021, 6, 977–986 CrossRef CAS.
- W. Xu, F. Li, Z. Cai, Y. Wang, F. Luo and X. Chen, J. Mater. Chem. C, 2016, 4, 9651–9655 RSC.
- G. Huang, Y. Zhou, F. Li, X. Tan, Z. Cai, D. Luo, T. Chen and M. Zhang, Sens. Actuators, B, 2021, 347, 130618 CrossRef CAS.
- Y. Cheng, H. Wang, L. Li, T. Han, X. Liang and L. Dong, Sens. Actuators, B, 2019, 284, 258–264 CrossRef CAS.
- M.-Y. Cho, S. Kim, I.-S. Kim, E.-S. Kim, Z.-J. Wang, N.-Y. Kim, S.-W. Kim and J.-M. Oh, Adv. Funct. Mater., 2020, 30, 1907449 CrossRef CAS.
- A. S. Ilin, P. A. Forsh, M. N. Martyshov, A. G. Kazanskii, E. A. Forsh and P. K. Kashkarov, ChemistrySelect, 2020, 5, 6705–6708 CrossRef CAS.
- S. K. Kailasa, G. N. Vajubhai, J. R. Koduru, T. J. Park and C. M. Hussain, Trac. Trends Anal. Chem., 2021, 144, 116432 CrossRef CAS.
- R. Li, J. Yu, S. Wang, Y. Shi, Z. Wang, K. Wang, Z. Ni, X. Yang, Z. Wei and R. Chen, Nanoscale, 2020, 12, 13360–13367 RSC.
- K. Brintakis, E. Gagaoudakis, A. Kostopoulou, V. Faka, A. Argyrou, V. Binas, G. Kiriakidis and E. Stratakis, Nanoscale Adv., 2019, 1, 2699–2706 RSC.
- S. Sun, D. Yuan, Y. Xu, A. Wang and Z. Deng, ACS Nano, 2016, 10, 3648–3657 CrossRef CAS PubMed.
- D. Cortecchia, H. A. Dewi, J. Yin, A. Bruno, S. Chen, T. Baikie, P. P. Boix, M. Grätzel, S. Mhaisalkar, C. Soci and N. Mathews, Inorg. Chem., 2016, 55, 1044–1052 CrossRef CAS PubMed.
- A. M. Elseman, A. E. Shalan, S. Sajid, M. M. Rashad, A. M. Hassan and M. Li, ACS Appl. Mater. Interfaces, 2018, 10, 11699–11707 CrossRef CAS PubMed.
- Z. Luo, Q. Li, L. Zhang, X. Wu, L. Tan, C. Zou, Y. Liu and Z. Quan, Small, 2020, 16, 1905226 CrossRef CAS PubMed.
- X. Hu, Y. Li, Y. Wu, W. Chen, H. Zeng and X. Li, Mater. Chem. Front., 2021, 5, 6152–6159 RSC.
- P. W. Winston and D. H. Bates, Ecology, 1960, 41, 232–237 CrossRef.
- J. F. Young, J. Appl. Chem., 1967, 17, 241–245 CrossRef CAS.
- S. R. Desjardins, K. W. Penfield, S. L. Cohen, R. L. Musselman and E. I. Solomon, J. Am. Chem. Soc., 1983, 105, 4590–4603 CrossRef CAS.
- R. Valiente and F. Rodríguez, Phys. Rev. B: Condens. Matter Mater. Phys., 1999, 60, 9423–9429 CrossRef CAS.
- A. Jaffe, Y. Lin, W. L. Mao and H. I. Karunadasa, J. Am. Chem. Soc., 2015, 137, 1673–1678 CrossRef CAS PubMed.
- J. Idígoras, A. Todinova, J. R. Sánchez-Valencia, A. Barranco, A. Borrás and J. A. Anta, Phys. Chem. Chem. Phys., 2016, 18, 13583–13590 RSC.
- M. Chen, S. Xue, L. Liu, Z. Li, H. Wang, C. Tan, J. Yang, X. Hu, X.-F. Jiang, Y. Cheng, H. Wang, X. Xing and S. He, Sens. Actuators, B, 2019, 287, 329–337 CrossRef CAS.
- M. A. Zanjanchi and S. Sohrabnezhad, Sens. Actuators, B, 2005, 105, 502–507 CrossRef CAS.
- M. D. Fernández-Ramos, Y. F. Ordóñez, L. F. Capitán-Vallvey, I. M. P. d. Vargas-Sansalvador and J. Ballesta-Claver, Sens. Actuators, B, 2015, 220, 528–533 CrossRef.
- M.-H. You, X. Yan, J. Zhang, X.-X. Wang, X.-X. He, M. Yu, X. Ning and Y.-Z. Long, Nanoscale Res. Lett., 2017, 12, 360 CrossRef PubMed.
| This journal is © The Royal Society of Chemistry 2022 |