
 Open Access Article
 This Open Access Article is licensed under a Creative Commons Attribution-Non Commercial 3.0 Unported Licence
Panther chameleon-inspired, continuously-regulated, high-saturation structural color of a reflective grating on the nano-patterned surface of a shape memory polymer†
Jiaqin
Zhao
,
Liang
Zhang
,
Xinyue
Du
,
Jinyan
Xu
,
Taotao
Lin
,
Yongjin
Li
 ,
Xuxin
Yang
* and
Jichun
You
*
,
Xuxin
Yang
* and
Jichun
You
*
Hangzhou Normal University, No. 2318 Yuhangtang Rd., Hangzhou 311121, China. E-mail: xxyang@hznu.edu.cn; you@hznu.edu.cn
First published on 21st May 2022
Abstract
In this work, surface nano-stripes and a reflective grating have been fabricated on shape memory polymers (SMPs) to simulate the active color change of chameleons. The structural color resulting from the interference of reflected light exhibits high saturation and it can be regulated continuously based on the shape memory effect. In addition to the viewing angle, the attained color is sensitive to the deformation at the macroscale. Uniaxial tension along stripes at high temperature produces a remarkable blueshift of the resultant color (from red to green and blue) which can switch back to red after shape recovery upon heating. The evolution of structural color can be attributed to the lower and higher magnitudes of nano-structure periods in temporary (deformed) and permanent (recovery) states respectively. Based on the combination of angle and deformation dependences of structural color, a “colorful” product code has been fabricated. It exhibits enhanced ability to hide and display information which plays an important role in anti-counterfeiting.
Introduction
In nature, there are many animals exhibiting structural color including tropical fish, longhorn beetles and panther chameleons.1–6 Unlike pigments and dyes, in which the color is produced by the energy consumption of light, structural color is mainly based on special optical processes of photonic crystals, such as interference, diffraction, scattering and so on.7,8 With the aid of the development of fabrication strategies, many structural color materials are available. The precise adjustment of structural color plays a key role in their various applications, e.g., sensors and anti-counterfeiting.9 For this purpose, two kinds of strategies have been developed. On one hand, structural color can be manipulated by means of the refractive index contrast between the surrounding media and the periodic structures.10 For instance, Choi et al. presented a sensor comprising micro-pillar arrays coated with hydrogel.11 The refractive index of the hydrogel is under the control of its swollen/dried states while that of the pillar remains constant, which is an efficient way to reduce or enhance the refractive index contrast between them and the consequent structural color. On the other hand, it is possible to tailor the structural color by means of periodic structures. In earlier studies, much effort has been made in parameter optimization during fabrication of photo crystals.12–19 In the result from Wu et al., structural color patterns have been fabricated by printing monodisperse nano-spheres.20 Brilliant red, orange, and green colors can be achieved using inks containing nano-spheres with different diameters according to the linear relationship between the reflection peak position and the diameter of the spheres. In recent years, stimuli-responsive structural colors have been paid much attention.21–32 Inspired by the ability to change the skin color during male contests or courtship of panther chameleons, some strategies have been developed to adjust the periodic structures after their preparation. Yang et al. prepared photonic crystals in shape memory polymers (SMPs) by self-assembling silica particles in a polymer matrix and the subsequent removal of silica colloids by wet etching.33 The structural color in the attained photonic crystals can be tuned reversibly by means of mechanical deformation at the macroscale. During stretching, the reduced lattice space contributes to a remarkable blueshift of the resultant reflection peak.So far, some structural color materials as well as their stimuli-responsive behaviors have been available. In their efficient fabrication and applications, however, there are still some open and important problems. For one thing, it remains a great challenge to realize the adjustment of structural color continuously, especially within the whole visible wavelength range on the same sample. In particle-based photonic crystals, it is easy to obtain various colors by varying the particle diameter. The absence of a strategy for the precise manipulation of micro- or nano-structure periods makes it difficult to achieve the desired color covering the whole wavelength range. In the reported results, only limited color change has been achieved.23,34–36 For another thing, the brightness and saturation of structural color, which can be attributed to the following issues, need to be improved further. First, relative to two- and three-dimensional photonic crystal structures, a one-dimensional (1-D) grating exhibits much higher reflectivity and higher color saturation because of the sufficient interference of reflected light. There have been some reports concerning structural color in a 1-D grating.37,38 Most of them, however, focused on the inorganic materials (e.g., metals) in which it is difficult to tailor the structural color after their preparation.39 Secondly, compared with scattering in the bulk of structural color materials, diffraction or interference on a patterned surface produces a much higher intensity of diffraction, color saturation and brightness. Finally, the interference or diffraction of reflected light can be described by using the Bragg equation:
2d![[thin space (1/6-em)]](https://www.rsc.org/images/entities/char_2009.gif) sinθ = nλ sinθ = nλ | (1) |
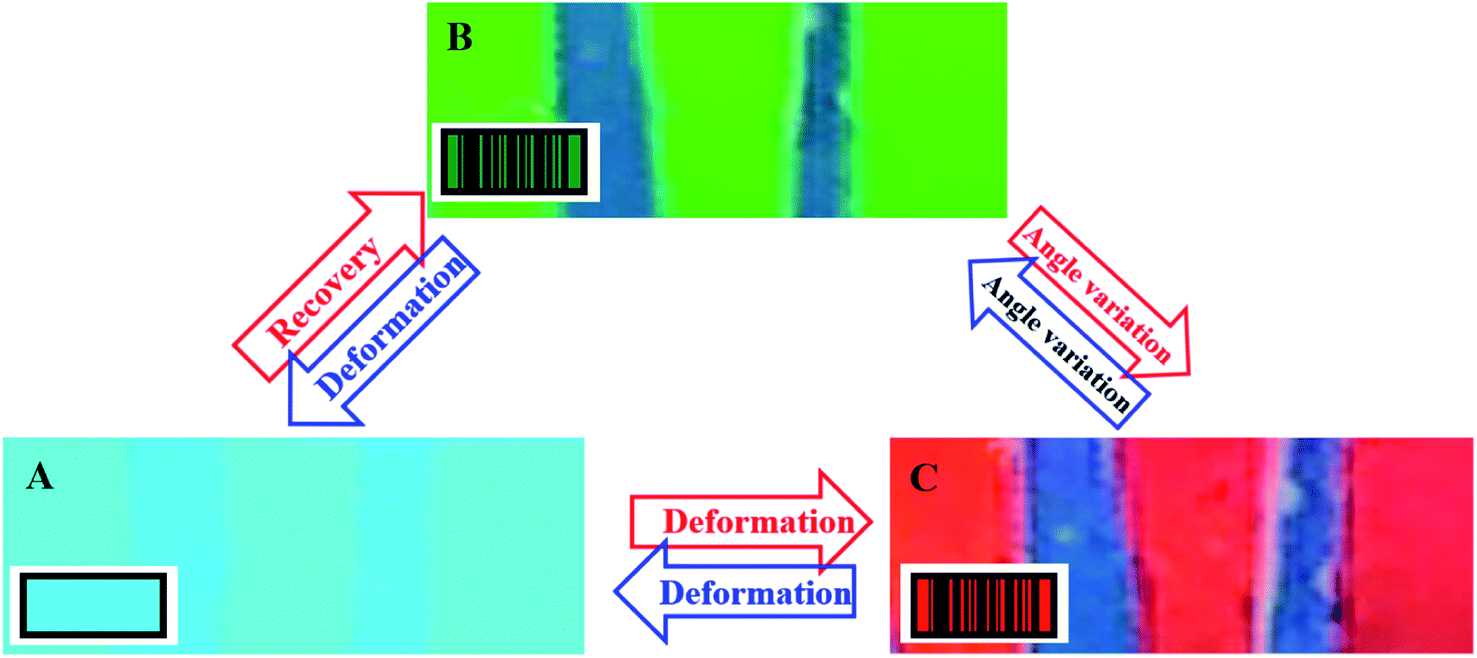
In this work, therefore, it is proposed to fabricate surface nano-stripes (according to a hard template, Scheme 1A) and simulate active and reversible color change in chameleons based on deformation/recovery of SMPs. The structure period of the resultant 1-D grating is comparable with visible light, corresponding to primary diffraction. The structural color is sensitive to both incident light/viewing angles (Scheme 1B) and grating constants (Scheme 1C). The latter can be tailored by means of uniaxial tension or recovery of SMPs based on proportional deformations at the macro- and micro-scales developed in our previous work. This is an efficient way not only to manipulate structural color precisely and continuously, but also to enlarge the spectral-tuning range to the entire visible light wavelength.
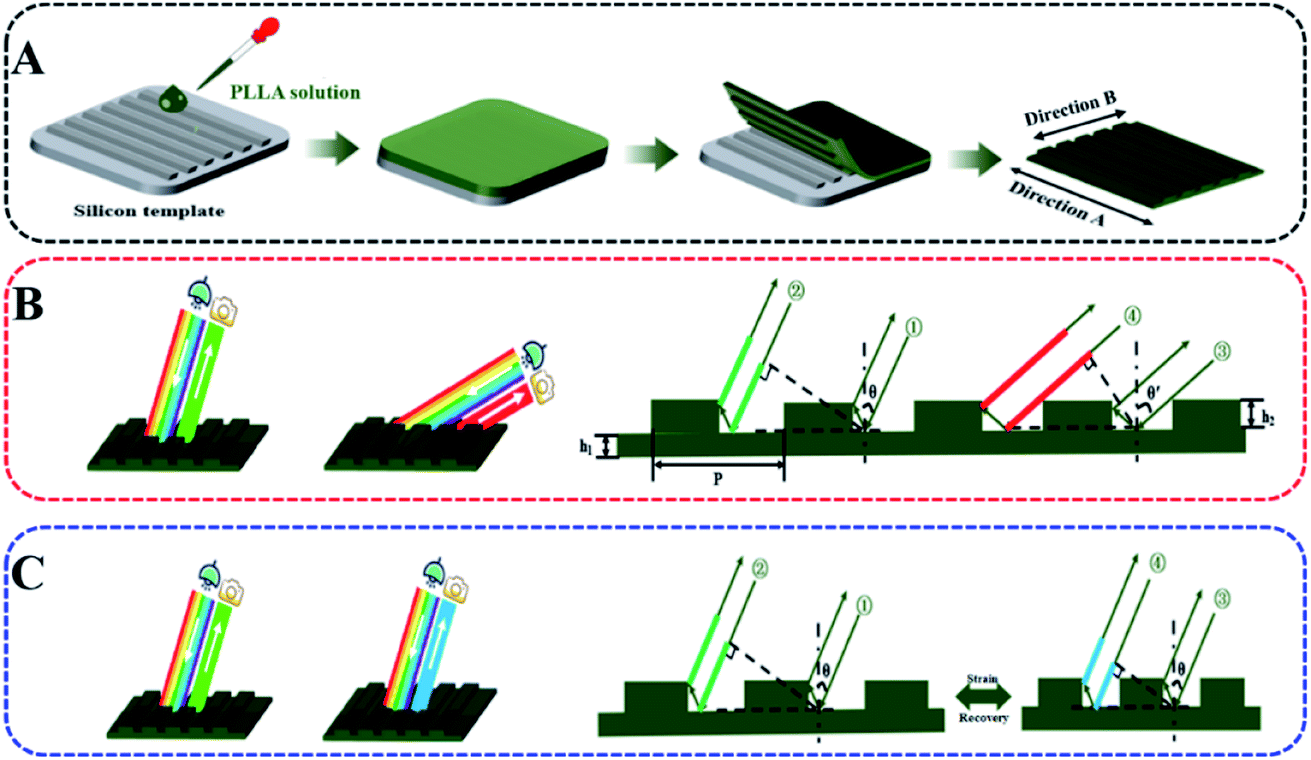 | ||
| Scheme 1 Fabrication of nano-patterned shape memory PLLA (A), structural color exhibiting angle (B) and deformation (C) dependence. | ||
Experimental
Preparation of poly (l-lactic acid) (PLLA) thin films
At room temperature, PLLA solution in chloroform (2.5 g L−1) with a certain volume (2.5 ml, 5 ml, 10 ml, and 15 ml) was cast on the silicon template (Zhongding Nano-Technology Co., Ltd, China). After the evaporation of chloroform, the polymer was slowly deposited on the silicon template. Then, the samples were placed in vacuum for 24 hours to remove residual solvents. At 70 °C, higher than the switching temperature of the shape memory effect, PLLA films were peeled off from the silicon template and put in the hot water-bath.Deformation and recovery of PLLA films
Uniaxial tension was performed on PLLA films along direction A in a water bath at 70 °C. The recovery of the film is accomplished by soaking in a hot water-bath. The draw and recovery ratios were determined by measuring the length of PLLA films.Microscopic morphology measurements
The surface morphologies of a silicon wafer were observed by using a scanning electron microscope (SEM, Hitachi S-4800) with an accelerating voltage of 5.0 kV. Atomic force microscopy (AFM, E-Sweep, Seiko, Japan) characterization of the membranes was conducted under ambient conditions in a tapping mode.Optical measurements
Reflection measurements of PLLA films with different draw ratios were performed at various angles with linear polarization for wavelengths ranging from 350 to 800 nm in an angle-resolved spectrophotometer (S1, Shanghai Chenchang Instrument Equipment Co., Ltd, China). An OPPO R17 was used to take sample photographs with its own camera and an LED lamp as the light source.Results and discussion
Poly (l-lactic acid) (PLLA) solution in chloroform was dip-coated on a silicon template with 1-D patterns (SEM and AFM images are shown in Fig. S1†). Then, the PLLA films were peeled off from the template after evaporation of solvent. This is an efficient method to prepare shape memory PLLA films with highly ordered surface patterns containing concave-convex nano-stripes. It is suitable for scale-up. For brevity, the specimens were observed at the same angles with incident light in this work (Scheme 1B and C). Fig. 1A shows the optical photographs of the as-prepared PLLA films. In the results from direction B as shown in Scheme 1A (vertical to the stripes), there are obvious structural colors at different incident light/viewing angles, which can be attributed to the constructive interference of reflected light with different wavelengths induced by the periodic structures of concave-convex stripes. The attained structural color is independent of the casting liquid volume and the film thickness (h1, Fig. S2†). It changes in the visible light range from blue (17°) and green (22°) to red (27°). By increasing the angle further, the transition discussed above takes place for the second time (from 37° to 52°). The corresponding periodic transition in the entire visible light wavelength ranging from purple to red can be observed in the film by adjusting the angle of incident light (Movie S1†), indicating a wide color-tuning range. The simultaneous occurrence of green and orange in the photograph at 22° in Fig. 1A is caused by the slightly changed incident light/viewing angle resulting from the different distances from the observing point between the top and bottom edges of our specimen. In direction A, however, no obvious structural color has been detected in any angle due to plane reflection, which has been further confirmed in a movie in the ESI (Movie S2†). To investigate the color as well as its evolution discussed above, the quantitative reflectance data in direction A and B have been taken at various incident and reflection angles. In the black line (17°), for instance, the peak position is located at 476.9 nm, corresponding to the color of blue (wavelength from 492 to 455 nm). In all the results shown in Fig. 1B, the positions of the reflection peak are in good agreement with the colors shown in the photographs in Fig. 1A. During the variation of the viewing angle, the reflection peak position shifts to the direction of a higher wavelength from 476.9 nm (black curve at 17°) to 717.4 nm (blue curve at 27°). In the result of 32°, however, the peak drops to 428.0 nm, followed by an increase to 629.2 nm in the brown curve (52°). This result makes it clear that there are two periodic changes, corresponding to primary and second diffraction in the former and latter respectively, which will be discussed quantitatively in the following sections. As shown in Fig. 1C, there is no reflection peak at any viewing angle along direction A, which is consistent with the transparent and colorless state shown in Fig. 1A. The full width at half maximum (FWHM) in the reflection spectra can act as an efficient parameter to assess the saturation of structural color. In this work, the FWHM covers a very narrow wavelength (down to ∼20 nm as shown in Fig. 1D), which is much lower than the results in the references.41–48 The lower magnitude of the FWHM, resulting from a 1-D grating and the monodispersed size of nano-stripes (Scheme 1), indicates a structural color with higher saturation.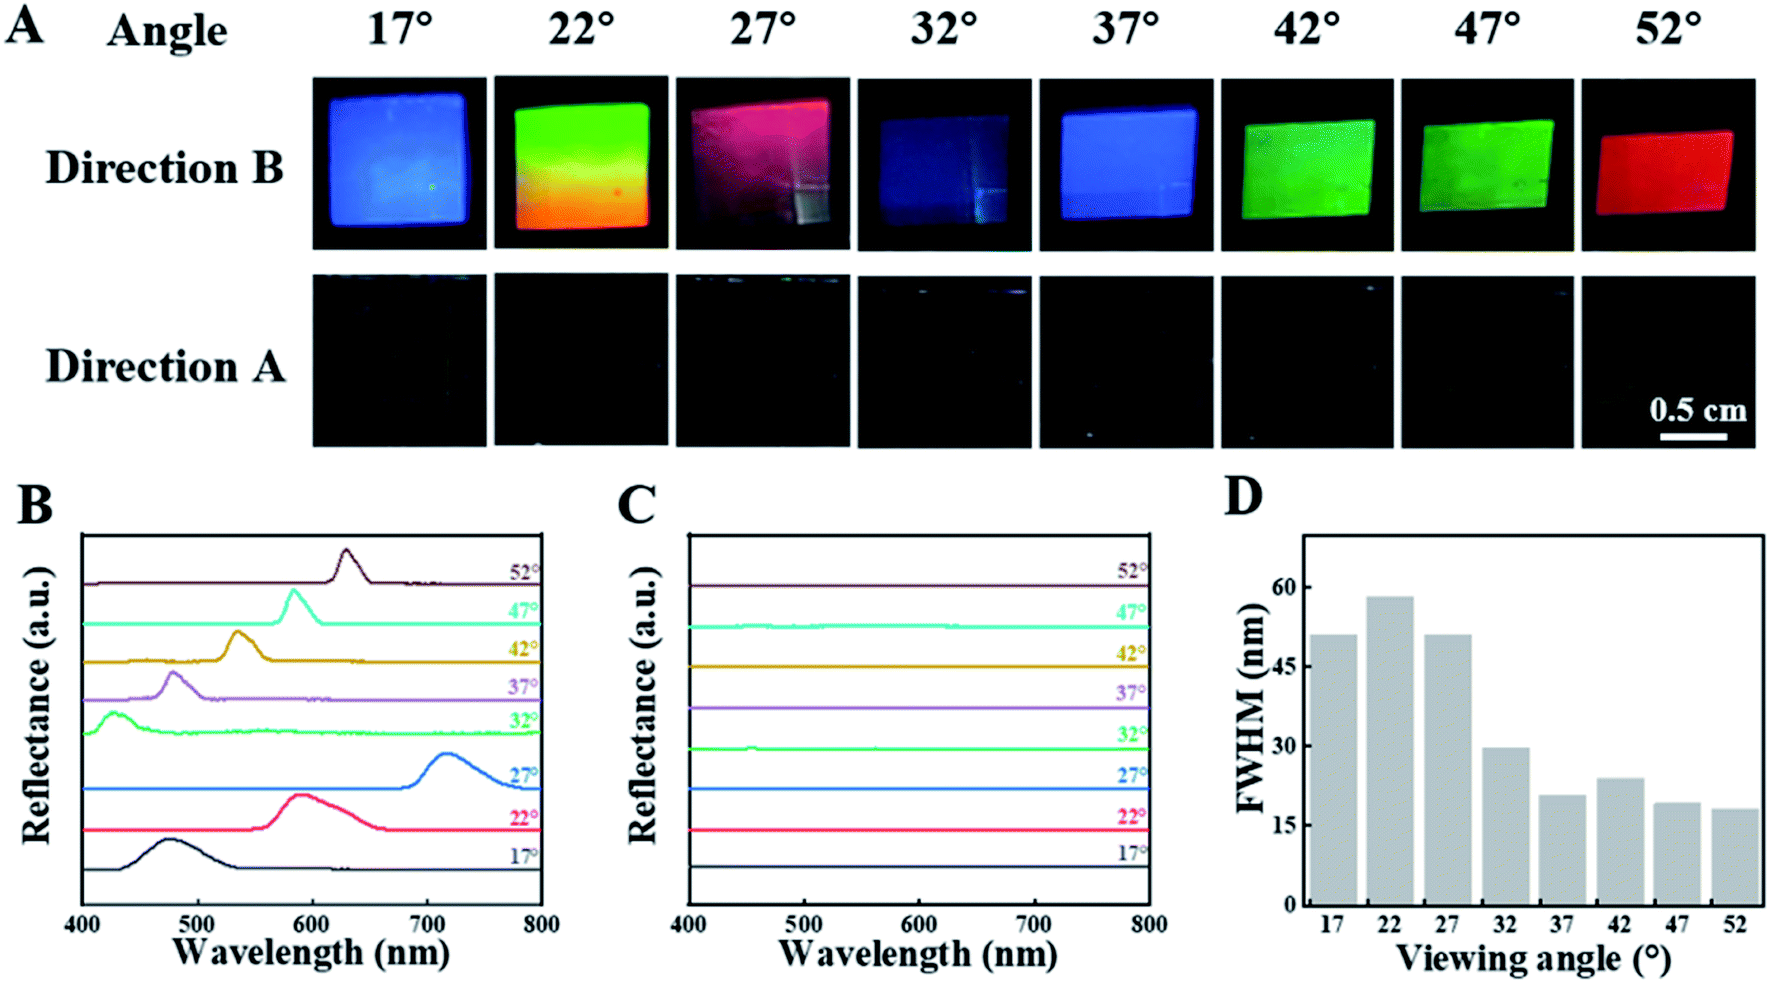 | ||
| Fig. 1 Optical photographs of the as-prepared PLLA film (A). Spectrum in direction B (B) and direction A (C). The full width at half maximum (FWHM) of the spectrum in direction B (D). The dimension of each color square is 0.5 cm. | ||
PLLA is a typical shape memory polymer, in which tiny crystals and an amorphous matrix act as the shape-fixed phase and shape-recovery phase respectively. The shape memory effect has been discussed in detail in our previous work.49–52 As a result, PLLA films with a surface pattern can be deformed at high temperature (above the glass transition temperature of PLLA) and the shape can be fixed by cooling down to room temperature. Upon heating above the switching temperature again, it can recover its initial shape spontaneously. The interrelated deformations at the macro- and micro-scales make it possible to control the periods of nano-structures precisely and continuously.40 To investigate the relationship between structural color at the macroscale and the surface nano-structure of a PLLA film, uniaxial tension along direction A (Scheme 1A) has been introduced in the as-prepared film. This is an efficient way to decrease the periods, tailor the subsequent structural color and simulate active color change in chameleons. The initial square specimen exhibits the color red at a viewing angle of 27° (Fig. 2A). It changes to green upon uniaxial tension with a draw ratio of 1.3 (30% strain, named as strain-30). By increasing the strain to 50% (strain-50), we can find a mixed color of green and blue on the film surface. In strain-30 and strain-50, the deformation in direction A yields a rectangular specimen. Upon heating to 70 °C, it recovers its initial shape (square) and color (red). The reversible transition between red and green (blue) shown in Fig. 2A closely resembles the active color change in panther chameleons during excitation and relaxation.2 In the process discussed above, the optical spectrum is in good agreement with color evolution (Fig. 2B). The reflection peak position is located at 717.4 nm (red light, 622 to 760 nm) before uniaxial tension. It moves to 529.9 nm (green light, 492 to 577 nm) and 526.6 nm (mixed color of green and blue) in the case of strain-30 and strain-50, respectively. Finally, this peak moves back to 726.4 nm (in the range of red light) when the specimen recovers its permanent shape. In a PLLA film with nano-structures on the surface, therefore, the structural color can be tailored according to deformations in two scales. The color evolution and corresponding reflection spectrum during uniaxial tension (Fig. S3†) and recovery (Fig. S4†) at various viewing angles have been investigated in detail. As shown in Fig. 2C, the deformation-recovery of the specimen and the resultant evolution of structural color between red (with a wavelength of ∼ 720 nm) and green (with a wavelength of ∼530 nm) can be repeated at least eight times, suggesting their excellent cycling stability.
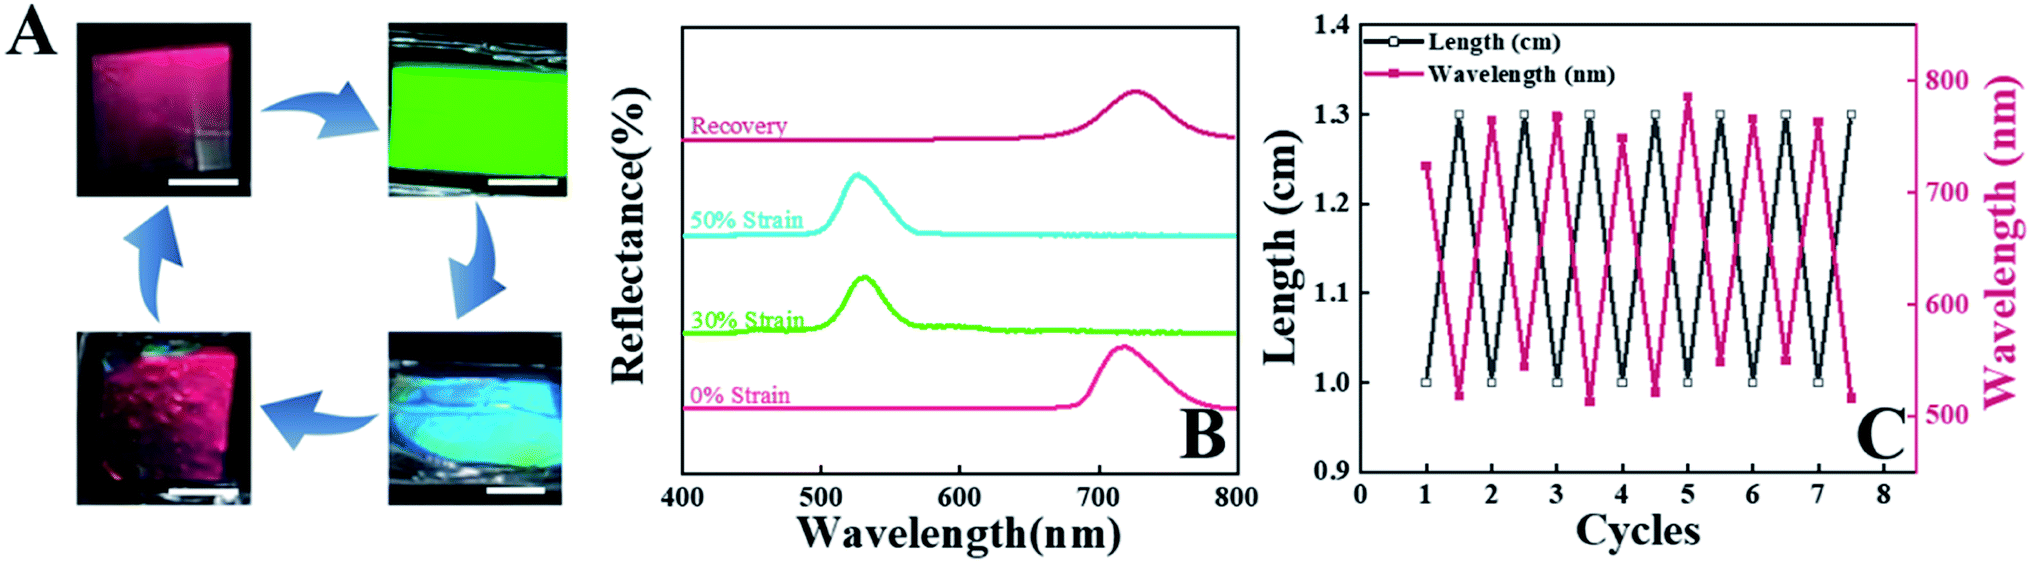 | ||
| Fig. 2 The evolution of structural colors at a viewing angle of 27° during uniaxial tension along direction A and recovery (A). (B) shows the corresponding reflection spectrum during deformation and recovery. (C) The cycling stability during deformation/recovery with a strain of 30%. The dimension of each color square is 0.5 cm. | ||
Fig. 3A–D show the SEM and AFM images of the specimen of strain-0 (before strain), strain-10, strain-30, and strain-50 respectively. In Fig. 3A, there are perfect 1D periodic surface structures containing several continuous concave-convex stripes. Their structural parameters agree well with those of the silicon template (Fig. S1†), indicating a perfect structure copy. To detect the grating constants of the stripes, atomic force microscopy (AFM) has been employed. In the resultant 3-D AFM images, we can read the height and periods directly. Our attention has been paid to the latter as shown in Scheme 1B. Before uniaxial tension, the period is 809 nm (Fig. 3E and F). It is easy to calculate the wavelength of the structural color according to eqn (1). In the case of 27°, for instance, the wavelength of primary diffraction (n = 1 in eqn (1)) is 734.6 nm. This value is in good agreement with the reflection peak in Fig. 1B (717.4 nm) and the color red (622 to 760 nm) shown in Fig. 1A. Based on this method, all colors in Fig. 1A and reflection peaks in Fig. 1B have been validated. When the light reaches the film surface along direction A, there are no periodic structures, leading to the absence of structural color as shown in Fig. 1A and C.
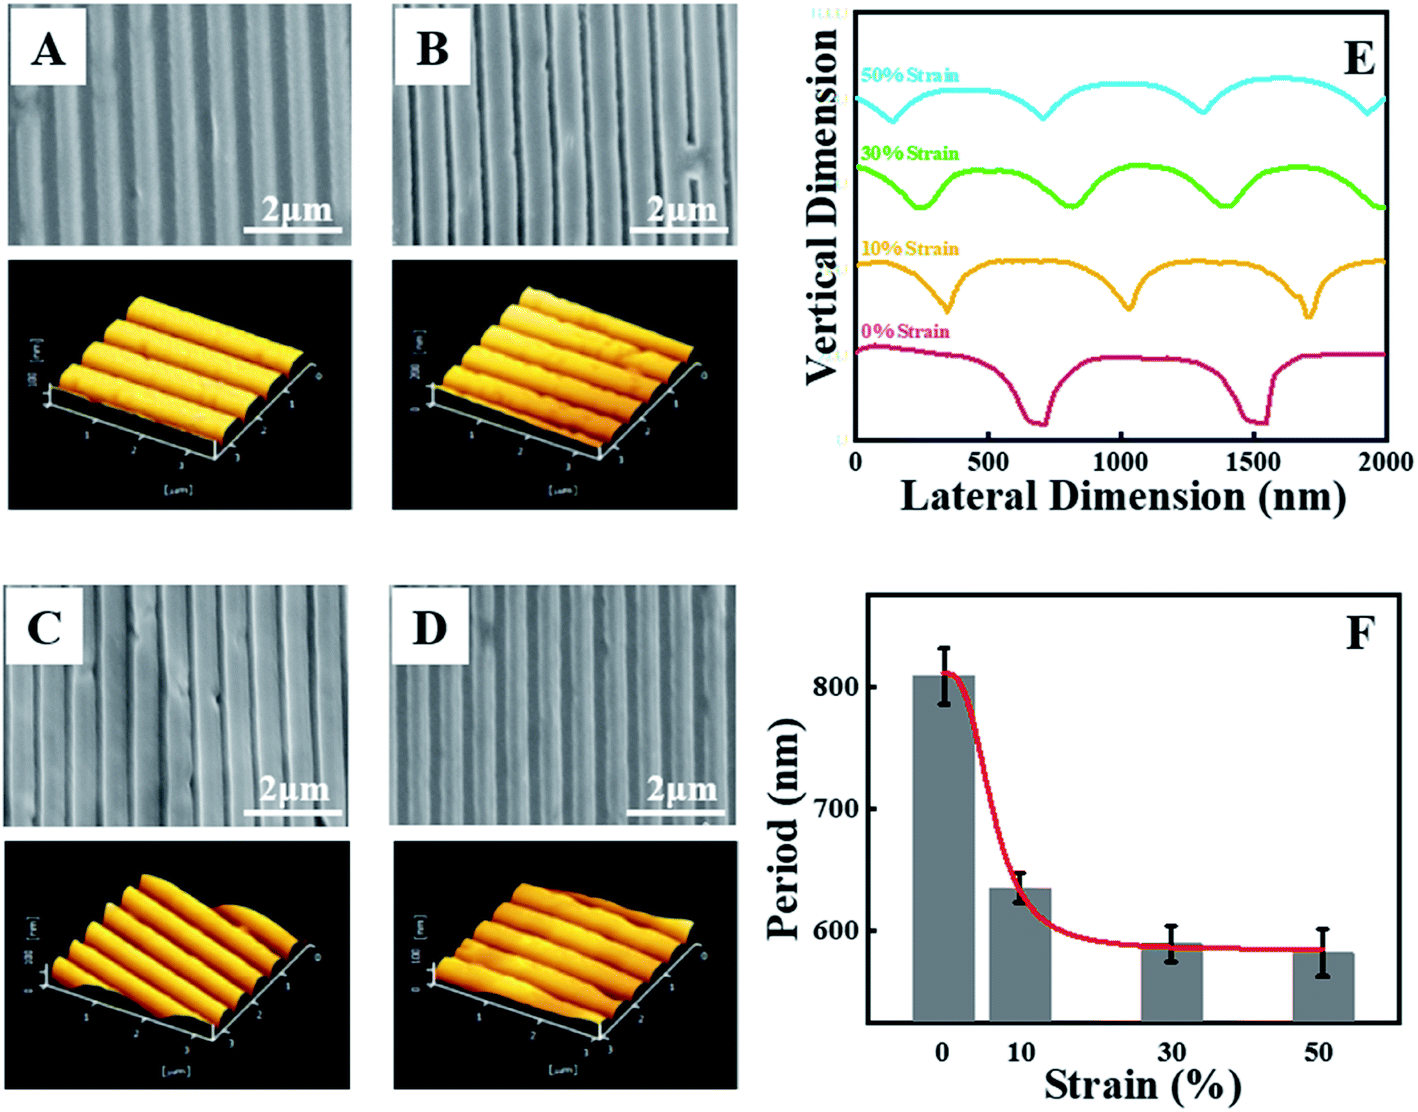 | ||
| Fig. 3 SEM (up) and 3-D AFM (down) images of PLLA membranes with various draw ratios. (A) Strain-0, (B) strain-10, (C) strain-30, and (D) strain-50. (E) Line-cut profiles in the AFM images obtained from various specimens. (F) The period of stripes on PLLA films. | ||
Upon uniaxial tension of our specimen at the macroscale, most of the nano-stripes are still highly ordered although a few defects can be found in the deformed films (SEM images in Fig. 3B). In this process, both the height and the period of the stripes decrease remarkably as shown in the line-cut profiles in AFM images (Fig. 3E). Their periods are 630 nm, 590 nm and 580 nm in the specimen strain-10, strain-30 and strain-50, respectively (Fig. 3B–F). At an incident/viewing angle of 27°, their corresponding wavelengths are 572 nm, 531 nm and 522 nm respectively, which is the reason for color evolution and the reflection peaks shown in Fig. 2A and B. In the process discussed above, the evolution of a nano-structure period plays a key role in the structural color of PLLA films. This scenario reproduces the color change during excitation and relaxation in chameleons. As shown in Fig. 3F, it has been found that the period of the film shows an exponential decay trend. The period of the film exhibits lower magnitudes with the increase of the draw ratio and tends to be steady at 50% strain. The exponential decay makes it possible for the specimen to be used as a continuously adjustable and stable structural color-based photoconductive sensor. During uniaxial tension, the concave and convex regions exhibit different deformation principles. The decrease of the former is more significant than that of the latter (Fig. 3E), which can be ascribed to the higher stress resulting from the lower magnitude of film thickness.
The wavelength of structural color (λ) corresponds to the reflection peak position in the optical spectrum (Fig. 1B and 2B) while the period of nano-structures can be measured in AFM images (Fig. 3E and F). To validate the relationship between them which can be described by using the Bragg equation, the product of the wavelength of structural color (λ) and its diffraction order (n) has been plotted as a function of structural parameters (2dsinθ). As shown in Fig. 4, there are many scattered points. They have been obtained in various processes including angle variation (black and red points) as shown in Fig. 1, and deformation (blue points) and recovery after deformation (green points) as shown in Fig. 2. Obviously, all points can be fitted well according to the red dashed line with a slope of 1, i.e., eqn (1). This result indicates that the relationship between structural color and the periods of the nano-structure is not sensitive to the processing history of the specimen. It is the period of nano-structures (d) that determines the structural color as well as its reflection peaks (λ). In other words, it is easy for us to tailor the color precisely and continuously according to the relationship shown in Fig. 4 and eqn (1). To validate the mechanism of structural color change on a patterned surface, an L-S silicon template (Fig. S5†) with different structures has been employed. There are obvious structural colors on the resultant PLLA film in both L and S directions (Fig. S6†), which can be tailored by means of angle variation and deformation of shape memory PLLA. In this process, it is also the period of nano-structures (Fig. S7†) that determines the color. The resultant color on the PLLA film from the L–S template exhibits much lower brightness and saturation compared with nano-stripes shown in Fig. S1,† which can be ascribed to the insufficient interference of reflected light due to the partial existence of nano-structures along the L or S directions. The comparison between them shows clearly the advantage of a 1-D grating made of nano-stripes. As a result of the 1-D grating and monodispersed size of nano-stripes (including height and period), the reflectance of the as-prepared specimen reaches ∼70% (from the UV-vis spectrum, data not shown here).
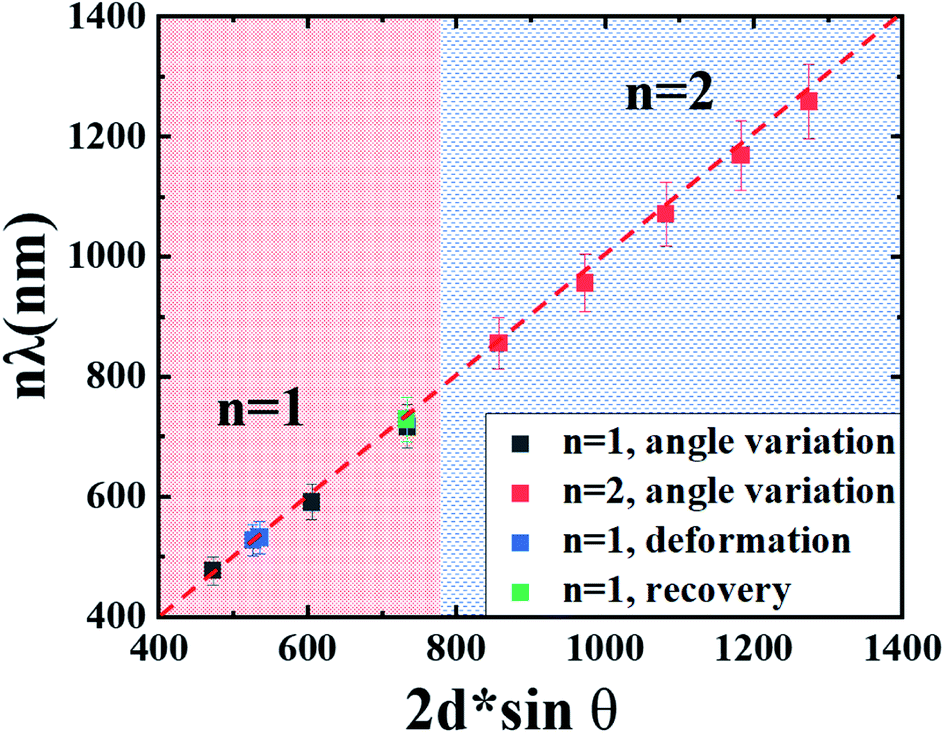 | ||
| Fig. 4 Linear fitting according to the Bragg equation of the wavelength in an optical spectrum of all structural colors and their corresponding periods obtained from AFM images. | ||
Because of the color-changing ability, various structural color materials have been fabricated and widely used in the area of anti-counterfeiting. The reflective grating on a nano-patterned PLLA surface in this work exhibits not only angle-dependent color (Fig. 1), but also stimuli-responsive behaviors (shape memory effect shown in Fig. 2 and 3). Their combination makes it possible to achieve programmable hidden/readable information, which is significant in anti-counterfeiting. For this purpose, we prepared a “product code”. Details can be found in Fig. S8.† On PLLA films with nano-structures on the surface, there are two blue belts with a width of several millimeters. The color of these belts will neither change upon varying the viewing angle nor on deformation/recovery of the PLLA films. On the contrary, the color of a PLLA film with nano-structures on its surface is sensitive to both of them. At the very beginning (Fig. 5A), a PLLA film after uniaxial tension along direction A (strain-30) exhibits the color blue (at a viewing angle of 20°), which closely resembles the blue belts. In this case, the information (two belts) has been hidden. When the specimen is heated above the switching temperature, the PLLA film recovers its permanent shape, resulting in a higher period which has been shown in Fig. 3. This is the reason for the appearance of a green PLLA film (at the same viewing angle of 20°). Then, the blue belts are readable because of the color difference between them (Fig. 5B). This process is in good agreement with the results shown in Fig. 2A, i.e., color change during shape recovery in SMPs. According to the color evolution shown in Fig. 1A, the color of a PLLA film can be turned to red by increasing the viewing angle (from 20° to 25°). In Fig. 5C, the “background color” has been tailored to the desired red (at a viewing angle of 25°). The information can be read clearly. The process from (A) to (B) and (C) is reversible. The red background can go back to green and blue with angle adjustment and subsequent deformation based on shape fixed ability of PLLA at high temperature. Of course, it is also easy to switch between (A) and (C) directly by means of further deformation and controlled recovery. The combination of angle- and strain-dependent color makes it possible to fabricate “colorful” product code, which has been schematically shown in the insets of Fig. 5. In certain scenarios, the information can be hidden while it changes to readable when required. Moreover, we can tailor the background color and the resultant color contrast by varying the viewing angle. Fig. S9† shows another method to hide/display information. A PLLA film with nano-structures on it can be deformed locally, yielding differently colored information on the same film. This resultant color depends also on the viewing angles. Upon heating, the local deformation disappears, contributing to a uniform color on the whole specimen surface. The structural color materials in this work, therefore, can act as an excellent candidate for anti-counterfeiting.
 | ||
| Fig. 5 The schematical product code in hidden (A)/readable (B) states with color evolution based on the combination of angle-dependent color (B to C) and the shape memory effect (A to B). | ||
Conclusions
Inspired by nature, nano-stripes have been fabricated on a PLLA film surface to simulate the active color change in panther chameleons based on the shape memory effect. There are various structural colors depending crucially on the viewing angle and deformation at the macroscale. On one hand, a structural color with higher saturation can be attributed to the periods in nanometers and a 1-D reflective grating. On the other hand, it is easy to tailor the color by means of uniaxial tension. By increasing the draw ratio, the color changes from red to green and blue. It can switch back to red after shape recovery upon heating. With the combination of the viewing angle and deformation, a “colorful” product code has been prepared. It exhibits enhanced ability to hide and display more complicated information, which can act as an excellent candidate for anti-counterfeiting. Our results open an avenue for the fabrication and continuous regulation of structural color.Conflicts of interest
The authors declare no conflict of interest.Acknowledgements
This work was financially supported by the National Natural Science Foundation of China (51973048).References
- D. Gur, B. A. Palmer, B. Leshem, D. Oron, P. Fratzl, S. Weiner and L. Addadi, Angew. Chem., Int. Ed., 2015, 54, 12426–12430 CrossRef CAS PubMed.
- J. Teyssier, S. V. Saenko, D. Van. Der. Marel and M. C. Milinkovitch, Nat. Commun., 2015, 6, 6368 CrossRef CAS PubMed.
- O. D. Onelli, T. Van. Der. Kamp, J. N. Skepper, J. Powell, T. d. S. Rolo, T. Baumbach and S. Vignolini, Sci. Rep., 2017, 7, 1373 CrossRef PubMed.
- B. J. Glover and H. M. Whitney, Ann. Bot., 2010, 105, 505–511 CrossRef PubMed.
- V. J. Lloyd and N. J. Nadeau, Curr. Opin. Genet. Dev., 2021, 69, 28–34 CrossRef CAS PubMed.
- A. E. Seago, P. Brady, J. P. Vigneron and T. D. Schultz, J. R. Soc., Interface, 2009, 6, S165–S184 CrossRef PubMed.
- A. G. Dumanli and T. Savin, Chem. Soc. Rev., 2016, 45, 6698–6724 RSC.
- S. Kinoshita, S. Yoshioka and J. Miyazaki, Rep. Prog. Phys., 2008, 71, 076401 CrossRef.
- R. Zhang, Q. Wang and X. Zheng, J. Mater. Chem. C, 2018, 6, 3182–3199 RSC.
- S. Sun, W. Yang, C. Zhang, J. Jing, Y. Gao, X. Yu, Q. Song and S. Xiao, ACS Nano, 2018, 12, 2151–2159 CrossRef CAS PubMed.
- J. Choi, M. Hua, S. Y. Lee, W. Jo, C.-Y. Lo, S.-H. Kim, H. T. Kim and X. He, Adv. Opt. Mater., 2020, 8, 1901259 CrossRef CAS.
- W. Fan, J. Zeng, Q. Gan, D. Ji, H. Song, W. Liu, L. Shi and L. Wu, Sci. Adv., 2019, 5, eaaw8755 CrossRef CAS PubMed.
- Y. Dong, Z. Ma, D.-P. Song, G. Ma and Y. Li, ACS Nano, 2021, 15, 8770–8779 CrossRef CAS PubMed.
- M. Rezaei, H. Jiang and B. Kaminska, Nanotechnology, 2016, 27, 085301 CrossRef CAS PubMed.
- M. A. Rahman, S. M. K. Vivek, S. H. Kim and J. Y. Byun, Appl. Surf. Sci., 2019, 505, 144428 CrossRef.
- X. Su, H. Xia, S. Zhang, B. Tang and S. Wu, Nanoscale, 2017, 9, 3002–3009 RSC.
- W. Yang, S. Xiao, Q. Song, Y. Liu, Y. Wu, S. Wang, J. Yu, J. Han and D.-P. Tsai, Nat. Commun., 2020, 11, 1864 CrossRef CAS PubMed.
- C. Zhang, J. Jing, Y. Wu, Y. Fan, W. Yang, S. Wang, Q. Song and S. Xiao, ACS Nano, 2020, 14, 1418–1426 CrossRef CAS PubMed.
- S. Sun, Z. Zhou, C. Zhang, Y. Gao, Z. Duan, S. Xiao and Q. Song, ACS Nano, 2017, 11, 4445–4452 CrossRef CAS PubMed.
- S. Wu, B. Liu, X. Su and S. Zhang, J. Phys. Chem. Lett., 2017, 8, 2835–2841 CrossRef CAS PubMed.
- Z. Ruff, P. Cloetens, T. O’ Neill, C. P. Grey and E. Eiser, Phys. Chem. Chem. Phys., 2018, 20, 467–477 RSC.
- Y. Ohtsuka, M. Sakai, T. Seki, R. Ohnuki, S. Yoshioka and Y. Takeoka, ACS Appl. Mater. Interfaces, 2020, 12, 54127–54137 CrossRef CAS PubMed.
- S. Schauer, J. J. Baumberg, H. Hölscher and S. K. Smoukov, Macromol. Rapid Commun., 2018, 39, 1800518 CrossRef PubMed.
- H. Kim, J. Ge, J. Kim, S.-e. Choi, H. Lee, H. Lee, W. Park, Y. Yin and S. Kwon, Nat. Photonics, 2009, 3, 534–540 CrossRef CAS.
- Y. Liu, Q. Liu, J. Long, F. Yi, Y. Li, X. Lei, P. Huang, B. Du, N. Hu and S. Fu, ACS Appl. Mater. Interfaces, 2020, 12, 49866–49875 CrossRef CAS PubMed.
- Y. Qi, C. Zhou, S. Zhang, Z. Zhang, W. Niu, S. Wu, W. Ma and B. Tang, Dyes Pigm., 2021, 189, 109264 CrossRef CAS.
- C. Zhu, L. Tian, J. Liao, X. Zhang and Z. Gu, Adv. Funct. Mater., 2018, 28, 1803194 CrossRef.
- Y. Chen, X. Duan, M. Matuschek, Y. Zhou, F. Neubrech, H. Duan and N. Liu, Nano Lett., 2017, 17, 5555–5560 CrossRef CAS PubMed.
- Y. Wu, W. Yang, Y. Fan, Q. Song and S. Xiao, Sci. Adv., 2019, 5, 0939 Search PubMed.
- J. Li, Y. Chen, Y. Hu, H. Duan and N. Liu, ACS Nano, 2020, 14, 7892–7898 CrossRef CAS PubMed.
- X. Duan and N. Liu, ACS Nano, 2018, 12, 8817–8823 CrossRef CAS PubMed.
- X. Duan, S. Kamin and N. Liu, Nat. Commun., 2017, 8, 14606 CrossRef CAS PubMed.
- C.-H. Hsieh, Y.-C. Lu and H. Yang, ACS Appl. Mater. Interfaces, 2020, 12, 36478–36484 CrossRef CAS PubMed.
- C. Ji, M. Chen and L. Wu, Adv. Opt. Mater., 2021, 2100739 CrossRef CAS.
- C. J. Leverant, S.-Y. Leo, M. A. Cordoba, Y. Zhang, N. Charpota, C. Taylor and P. Jiang, ACS Appl. Polym. Mater., 2019, 1, 36–46 CrossRef CAS.
- Y. Fang, Y. Ni, S.-Y. Leo, C. Taylor, V. Basile and P. Jiang, Nat. Commun., 2015, 6, 7416 CrossRef CAS PubMed.
- Y. Yue and P. J. Gong, J. Photochem. Photobiol., C, 2015, 23, 45–67 CrossRef CAS.
- C. Liu, L. Zhang, X. Zhang, Y. Jia, Y. Di and Z. Gan, ACS Appl. Mater. Interfaces, 2020, 12, 40979–40984 CrossRef CAS PubMed.
- X. Sun, W. Wang, X. Mei, A. Pan and Y. Zhang, Opt. Mater., 2020, 109, 110240 CrossRef CAS.
- S. A. Asher, J. Holtz, L. Liu and Z. Wu, J. Am. Chem. Soc., 1994, 116, 4997–4998 CrossRef CAS.
- L. Zhu, J. Kapraun, J. Ferrara and C. J. Chang-Hasnain, Optica, 2015, 2, 255–258 CrossRef CAS.
- G. M. Miyake, V. A. Piunova, R. A. Weitekamp and R. H. Grubbs, Angew. Chem., Int. Ed., 2012, 51, 11246–11248 CrossRef CAS PubMed.
- F. Lütolf, D. Casari and B. Gallinet, Adv. Opt. Mater., 2016, 4, 715–721 CrossRef.
- Y. Yang, H. Kim, J. Xu, M.-S. Hwang, D. Tian, K. Wang, L. Zhang, Y. Liao, H.-G. Park, G.-R. Yi, X. Xie and J. Zhu, Adv. Mater., 2018, 30, 1707344 CrossRef PubMed.
- Y. Liu, Q. Liu, J. Long, F. Yi, Y. Li, X. Lei, P. Huang, B. Du, N. Hu and S. Fu, ACS Appl. Mater. Interfaces, 2020, 12, 49866–49875 CrossRef CAS PubMed.
- T. Xie, X. Xiao, J. Li and R. Wang, Adv. Mater., 2010, 22, 4390–4394 CrossRef CAS PubMed.
- E. Lin, W. Hsu and Y. Chiang, ACS Nano, 2018, 12, 485–493 CrossRef CAS PubMed.
- E. Lin, W. Hsu and Y. Chiang, Macromol. Rapid Commun., 2012, 33, 1504–1509 CrossRef PubMed.
- J. Zhao, Q. Yang, T. Wang, L. Wang, J. You and Y. Li, ACS Appl. Mater. Interfaces, 2017, 9, 43415–43419 CrossRef CAS PubMed.
- L. Zhang, J. Zhao, J. Xu, J. Zhao, Y. Zhu, Y. Li and J. You, ACS Appl. Mater. Interfaces, 2020, 12, 42314–42320 CrossRef CAS PubMed.
- Q. Yang, T. Wang, L. Zhang, J. Zhang, F. Wang, Y. Ni, S. Pan, Y. Li and J. You, Appl. Surf. Sci., 2019, 480, 276–280 CrossRef CAS.
- J. Zhao, J. Li, Y. Li and J. You, Compos. Commun., 2019, 13, 52–56 CrossRef.
Footnote |
| † Electronic supplementary information (ESI) available. See https://doi.org/10.1039/d2na00075j |
| This journal is © The Royal Society of Chemistry 2022 |