 Open Access Article
Magnetic and near-infrared-II fluorescence Au–Gd nanoclusters for imaging-guided sensitization of tumor radiotherapy†
Hui
Zhao‡
a,
Hao
Wang‡
b,
Hairu
Li
c,
Tiecheng
Zhang
a,
Jing
Zhang
a,
Wenhui
Guo
a,
Kuang
Fu
*a and
Guoqing
Du
 *cd
*cd
aDepartment of MRI Diagnosis, The Second Affiliated Hospital of Harbin Medical University, Harbin 150086, Heilongjiang Province, P. R. China. E-mail: 3996@hrbmu.edu.cn
bDepartment of Respiratory and Critical Care Medicine, The Second Affiliated Hospital of Harbin Medical University, Harbin 150086, Heilongjiang Province, P. R. China
cDepartment of Ultrasound, The Second Affiliated Hospital of Harbin Medical University, Harbin 150086, Heilongjiang Province, P. R. China. E-mail: duguoqing@hrbmu.edu.cn
dDepartment of Ultrasound, Guangdong Provincial People's Hospital, Guangdong Academy of Medical Sciences, Guangzhou 510080, Guangdong Province, P. R. China
First published on 2nd March 2022
Abstract
The significant role of multifunctional nanoprobes with complementary advantages in magnetic and near-infrared-II (NIR-II, 1000–1700 nm) fluorescence properties has been documented in precision cancer theranostics. However, certain limitations, including the large size (>10 nm), low NIR-II fluorescence quantum yield (QY < 1.0%), and inefficient magnetic performance (relaxation rate < 5.0 s−1 mM−1) of nanoprobes, restrict their biomedical applications and clinical translation. Albumin-based biomineralization was adopted to prepare bright NIR-II Au NCs, which were further conjugated with DTPA and Gd ions to produce magnetic and NIR-II Au–Gd NCs. Albumin-based biomineralization helped to develop ultrasmall Au–Gd nanoclusters with ultrasmall size (∼2 nm), high NIR-II fluorescence QY (∼3.0%), and effective magnetic resonance imaging (MRI) performance (relaxation rate (r1) = 22.6 s−1 mM−1). On the one hand, Au–Gd NCs achieved NIR-II fluorescence and MRI dual-modal imaging of tumors with a high signal-to-background ratio (SBR = 8.2) in mice. On the other hand, their effective metabolism simultaneously through the kidney and liver minimized their toxicity in vivo. Moreover, compared to the control group, the survival time of tumor-bearing mice was extended by three times when Au–Gd NCs with high-Z elements were used to perform dual-modal imaging-guided sensitization of tumor radiotherapy. Thus, ultrasmall nanoprobes with complementary imaging modalities and therapeutic functions manifest great potential in cancer precision diagnosis and therapy.
Introduction
The unique advantages of ultrasmall nanoprobes in biomedical applications are attributed to their good tumor permeability, improved pharmacokinetics, and effective in vivo metabolizability.1–6 Gold nanoclusters (Au NCs), a kind of ultrasmall nanoprobe (size < 5.0 nm), have been exploited for near-infrared fluorescence imaging and sensitization of radiotherapy owing to their quantum confinement effect and high-Z elements.7–10 Recent studies substantiate the extension of the fluorescence emission of Au NCs from the first near-infrared window (NIR-I, 650–950 nm) to the second near-infrared window (NIR-II, 1000–1700 nm) by optimization of reaction conditions and surface ligands.11–15 High-sensitivity and high-resolution imaging of tumors, cerebrovascular lesions, lymphatic vessels, and lymph nodes at ∼1 centimeter of tissue thickness is achieved by the application of NIR-II fluorescence and bright NIR-II Au NCs.16–18 Nonetheless, visualization of deep lesions and precision guidance of tumor radiotherapy with Au NCs and single NIR-II fluorescence are a challenge.The accuracy of cancer diagnosis and therapy could be significantly ameliorated by employing dual-modal nanoprobes integrating two imaging elements into hybrid nanoplatforms.19–22 For example, several complementary advantages are demonstrated by nanoprobes with NIR-II fluorescence and MRI relative to a single imaging modality (Table 1).23–28 On the one hand, the drawbacks of low sensitivity and resolution of MRI are overcome by NIR-II fluorescence. On the other hand, MRI facilitates deep tissue penetration and three-dimensional (3D) structural and functional imaging. The significant role played by magnetic and NIR-II fluorescence nanoprobes is witnessed in preoperative diagnosis and intraoperative guided cancer therapy. Li et al. prepared Gd–Ag2S quantum dots for preoperative MRI detection for enhanced accuracy of brain tumor diagnosis and intraoperative NIR-II fluorescence imaging for tumor margin delineation.27 However, the large size of nanoprobes (>5 nm) restrains their renal metabolism. Owing to their ultrasmall size and good metabolizability, the adoption of ultrasmall Au NCs in the preparation of magnetic and NIR-II fluorescence dual-modal nanoprobes has advantages over conventional NIR-II nanoprobes, including quantum dots, carbon nanotubes, lanthanide-doped nanoparticles and polymer nanoparticles.29–32 As far as we know, no reports have yet been documented regarding ultrasmall magnetic and NIR-II fluorescence Au NCs for imaging-guided sensitization of tumor radiotherapy.
| Nanoprobes | Size (nm) | Accumulation of major organs | Imaging element | r1 value (mM−1 s−1) | Imaging modality | Treatment method | Animal models | Ref. |
|---|---|---|---|---|---|---|---|---|
| Gd–Ag2S nanoprobe | ∼7–9 | Liver, spleen, tumor | Gd | 4.9 | MRI/NIR-II | Precise surgery | Glioma in orthotopic (U87) | 27 |
| Ag2Se–Gd QDs | ∼3–5 | Liver, spleen | Gd | 2.9791 | MRI/NIR-II | 24 | ||
| PFTQ-PEG-Gd NPs | ∼105 | Liver, spleen, tumor | Gd | 10.95 | PAI/MRI/NIR-II | Photothermal therapy | Breast cancer in xenograft (4T1) | 23 |
| H-dots | ∼140 | Liver, spleen, kidney, tumor | Mn | 0.20 | Glioma in xenograft (U87) | 25 | ||
| FS-Gd NDs | ∼2–4 | Liver, tumor | Gd | 10.11 | MR/NIR-II | Photothermal therapy | Breast cancer in xenograft (4T1) | 26 |
| CH4T@MOF-PEG-AE | ∼60 | Liver, kidney, tumor | Fe | MR/NIR-II | Photothermal therapy and surgical resection | Glioma in xenograft (U87) | 28 | |
| NCs | ∼2 | Liver, kidney, tumor | Gd | 22.6 | MR/NIR-II | RT sensitivity | Glioma in xenograft (C6) | Our proposed method |
Herein, albumin-based biomineralization was adopted to prepare bright NIR-II Au NCs, which were further conjugated with DTPA and Gd ions to produce magnetic and NIR-II Au–Gd NCs. The hybrid Au–Gd NCs exhibited ultrasmall particle size (size = ∼2 nm), high NIR-II fluorescence quantum yield (QY = 3.0%), and excellent MRI contrast properties (the relaxation rate (r1) = 22.6 s−1 mM−1). In vivo, NIR-II fluorescence and MRI imaging demonstrated the excellent tumor-targeting abilities (SBR = 8.2) and effective metabolism of Au–Gd NCs in mouse models. Significant prolongation of the survival time of tumor-bearing mice by three times with the help of dual-modal imaging-guided sensitization of tumor radiotherapy using Au–Gd NCs proved their efficacious anti-tumor properties. The highly biocompatible and in vivo metabolizable multimodal nanoprobes contribute significant potential in improving the diagnosis and treatment of cancer (Scheme 1).
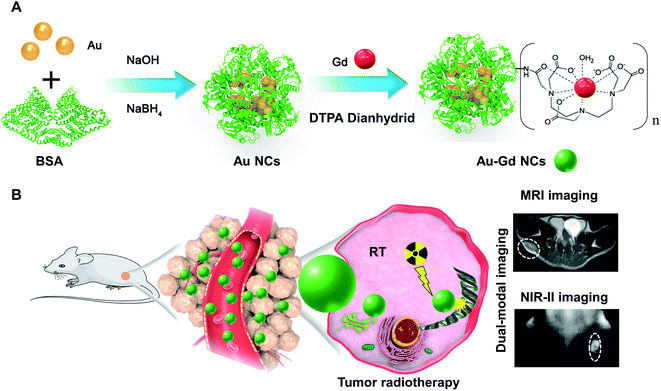 | ||
| Scheme 1 (A) The synthesis process of Au–Gd NCs. (B) Dual-modal imaging-guided sensitization of tumor radiotherapy mediated by Au–Gd NCs. | ||
Materials and methods
Materials
Gadolinium chloride hexahydrate (GdCl3·6H2O, 99.99%), HAuCl4·3H2O, diethylenetriaminepentaacetic dianhydride (98%), and bovine serum albumin (BSA) were all purchased from Sigma-Aldrich. All reagents were used without any further purification. All experiments were conducted with Milli-Q water (18.25 MΩ cm).Synthesis of NIR-II Au–Gd NCs
Au–Gd NCs were obtained following the modification of the method reported.11,33 In brief, HAuCl4 solution (10 mM, 12.5 mL), NaOH solution (1 M, 2.5 mL), and NaBH4 solution (0.1 M, 1 mL, 0 °C) were, respectively, added dropwise to the BSA solution (50 mg mL−1, 25 mL) with mechanical stirring. After vigorous stirring in the dark at 37 °C for 12 h, Au NCs were obtained, and then the as-prepared Au NCs were purified by dialysis for the next step.Using deionized water, 10 mL Au NC solution as-prepared was diluted to 40 mL. Thereafter, the pH of the solution was adjusted between 6 and 7 by adding HCl (1 M) dropwise into the 40 mL solution obtained above. Next, 171 mg of diethylenetriaminepentaacetic dianhydride powder was mixed with the solution, and the reaction was allowed to proceed for 2 h under vigorous stirring. Subsequently, after dissolving 183.32 mg GdCl3·6H2O in 1 mL deionized water, it was added dropwise to the solution under mechanical stirring. After 10 min, the pH of the solution was adjusted to 8–9. Au–Gd NCs were obtained after purification by dialysis (molecular weight cut off: 8–14 kD, Solarbio, China) against deionized water for 24 h. The solution was then filtered through a 0.22 μm membrane and subsequently concentrated by centrifugation at 4500 rpm at 4 °C through ultrafiltration centrifuge tubes (MWCO: 30 kD, Millipore, MA, USA) for the final product.
Characterization
UV-Vis absorption spectra were obtained on a UV-Vis spectrophotometer (PerkinElmer, USA). A transmission electron microscope (Jem-2100F, JEOL, Japan) was used to obtain the TEM images of the Au–Gd NCs. The hydrodynamic diameter and zeta potential of Au–Gd NCs were estimated using a Zetasizer (Nano-ZS90, Malvern, UK). With 808 nm laser excitation, fluorescence (FL) emission spectra of Au–Gd NCs were obtained on an FL spectrometer (FLS920, Edinburgh Instruments, UK). A NIR-II fluorescence imaging system (NIRvana 640, Teledyne Princeton Instruments) with an 808 nm laser (0.25 mW cm−2) and a 1000 nm long-pass filter was adopted for NIR-II fluorescence imaging. The elemental analysis of Au and Gd in the Au–Gd NCs was achieved using an inductively coupled plasma optical emission spectrometer system (OPTIMA 7000DV, PerkinElmer, USA). Circular dichroism spectra of BSA and Au–Gd NCs were obtained on a circular dichromatic spectrometer.MRI
A 3.0 Tesla (T) nuclear magnetic resonance (MR) analyzer (UNITED IMAGING uMR790, Shanghai United Imaging Healthcare, Shanghai, China) with a 12-channel Wrist coil (UNITED IMAGING 80500083) captured the T1-weighted images (T1WI).Au–Gd NCs and Gd-DTPA were diluted by doubling dilution, respectively, with PBS to six concentrations of gadolinium from 0.01 mM to 0.32 mM and thereafter placed in Eppendorf tubes for the MRI scanning. For the T1-weighted MRI of the prepared samples above, we used a fast spin-echo (FSE) sequence with the following parameters: slice number = 1, slice thickness = 2 mm, the field of view (FOV) = 93 × 120 mm2, TR = 600 ms, TE = 14.22 ms, flip angle = 90°/145°, average numbers = 5, and bandwidth = 260 Hz.
The longitudinal relaxivity (r1) of Au–Gd NCs and Gd-DTPA was also estimated on the 3.0T MR analyzer with the 12-channel Wrist coil at ambient temperature. The MR images were acquired using an FSE sequence with forty-two different inversion recovery times (TI) ranging from 50–3000 ms, and the other scanning parameters were as follows: slice number = 1; slice thickness = 5 mm; FOV = 96 × 130 mm2; TR = 5000 ms; TE = 17.14 ms; flip angle = 90°/145°, average numbers = 5, and bandwidth = 260 Hz.
Stability evaluation
The hydrodynamic diameter and zeta potential of the as-prepared sample were screened every week for seven weeks using the Zetasizer (Malvern, UK). The NIR-II fluorescence intensities and MR T1WI signal intensities of different solutions [0.1 M PBS (pH 7.4), fetal bovine serum (FBS), and DMEM (Dulbecco's Modified Eagle Medium)] with the same concentration of Au–Gd NCs were evaluated. The NIR-II fluorescence intensities and MR T1WI signal intensities of Au–Gd NCs were computed with different values of pH (2–12).Hemolysis test
The whole blood of BALB/c nude mice was collected in a tube containing heparin sodium. The whole blood (1 mL) was then carefully transferred into a 15 mL centrifuge tube with 5 mL PBS using the pipette and centrifuged (2000 rpm, 3 min). The RBCs were further washed with PBS 2–3 times until the supernatant was colorless and transparent. Next, 10% RBCs (v/v, in PBS) were incubated at 37 °C for 2 h with 7 different concentrations (24–1536 μg mL−1) of Au–Gd NCs, negative control group [10% RBCs (v/v, in PBS only)], and positive control group [10% RBCs (v/v, in deionized water only)]. After centrifugation (10![[thin space (1/6-em)]](https://www.rsc.org/images/entities/char_2009.gif) 000 rpm, 2 min), the supernatant was collected and analyzed with a multimode microplate reader (Multiskan GO, Thermo SCIENTIFIC, USA) at 540 nm.
000 rpm, 2 min), the supernatant was collected and analyzed with a multimode microplate reader (Multiskan GO, Thermo SCIENTIFIC, USA) at 540 nm.
Cell culture, cytotoxicity and cellular uptake test
C6, bEnd.3, and HUVECs were obtained from the Institute of Cell Biology, Chinese Academy of Science (Shanghai, China). The cells were cultured in DMEM with 10% (v/v) fetal bovine serum, 1% (v/v) penicillin, and 1% (v/v) streptomycin and were incubated in a humidified incubator at 37 °C with 5% CO2.The CCK-8 assay helped to analyze the cytotoxicity of Au–Gd NCs. bEnd.3 and HUVECs cells (5 × 10³ cells per well) were seeded in 96-well plates and cultured for 12 h. The culture medium was then removed, and 100 μL medium containing eight different concentrations (7–896 μg mL−1) of Au–Gd NCs was added. Incubation for another 24 h was followed by detection of cell viabilities using the CCK-8 method.
For in vitro studies, C6 glioma cells (5 × 10³ cells per well) were seeded on eight-well glass-bottomed culture dishes. After 24 h, the cells were incubated with Au–Gd NCs for different times, CAu–Gd NCs = 9 μg mL−1. A home-built NIR-II confocal fluorescence lifetime imaging microscope was used to image the cells.34
In vitro RT therapy
The C6 cells (5 × 10³ cells per well) were seeded in 96-well plates and cultured for 12 h. Then, the culture medium was discarded, and 100 μL medium containing eight different concentrations (7–896 μg mL−1) of Au–Gd NCs was added. After 8 h, the cells were rinsed with PBS 2–3 times and incubated with fresh DMEM. The plate was then taken for RT (6 Gy, 2 Gy min−1, 220 kV, 17.7 mA) (RS-2000-Pro225, Rad Source, USA). After incubation for another 12 h, cell viabilities were determined by the CCK-8 method.The sensitized radiotherapy performance of Au–Gd NCs was visualized by Calcein-AM/PI co-staining imaging. The cells were randomly divided into four groups as follows: (1) control (DMEM), (2) Au–Gd NCs, (3) DMEM + RT, and (4) Au–Gd NCs + RT. The C6 cells (2 × 10⁵ cells per well) were seeded in 6-well plates and incubated for 12 h with 2 mL medium per well. Thereafter, the culture medium was removed, and 2 mL medium containing 2 different concentrations (0 and 224 μg mL−1) of Au–Gd NCs was added per well. After 8 h, the cells were rinsed with PBS 3 times and incubated with fresh DMEM. The plate (groups 3 and 4) was then taken for RT (6 Gy, 2 Gy min−1, 220 kV, 17.7 mA) (RS-2000-Pro225, Rad Source, USA). After another 12 h incubation, the C6 cells were washed with 10x Assay buffer diluted with PBS (v/v = 1![[thin space (1/6-em)]](https://www.rsc.org/images/entities/char_2009.gif) :
:![[thin space (1/6-em)]](https://www.rsc.org/images/entities/char_2009.gif) 9) 3 times and then stained with calcein-AM and PI for 30 min following the manufacturer's protocol. Next, the cells were again washed with PBS and imaged via an inverted biological microscope (Olympus IX71, Olympus, Japan).
9) 3 times and then stained with calcein-AM and PI for 30 min following the manufacturer's protocol. Next, the cells were again washed with PBS and imaged via an inverted biological microscope (Olympus IX71, Olympus, Japan).
Then the γ-H2AX method was used following the manufacturer's instructions to show DNA damage of the C6 cells in the four groups mentioned above to further evaluate the radiotherapy sensitization performance of Au–Gd NCs. After being stained with DAPI, the γ-H2AX fluorescence signals of C6 cells in the four groups were obtained using confocal fluorescence microscopy.
Institutional animal care and use committee statement
Female BALB/c nude mice (6–8 weeks old, average weight 17–22 g), purchased from Beijing Vital River Laboratory Animal Technology Co., Ltd, (Beijing, China), were maintained in a controlled environment with a 12 h/12 h light/dark cycle and provided with food and water ad libitum.All animal procedures were conducted under protocols approved by the Institutional Animal Care and Use Committee (IACUC) of Shenzhen Institutes of Advanced Technology (SIAT), Chinese Academy of Sciences. SIAT follows the Guide for the Care and Use of Laboratory Animals, which is required by both China National Accreditation Service for Conformity Assessment (CNAS) and Association for Assessment and Accreditation of Laboratory Animal Care international (AAALAC) on humane care and use of laboratory animals.
In vivo imaging
The tumor models were developed by subcutaneously inoculating nude mice onto the right hind legs with 1 × 10⁶ C6 cells suspended in 100 μL of serum-free DMEM to generate glioma xenografts.To detect the tumor accumulation of Au–Gd NCs for optimal imaging and radiotherapy sensitization in vivo, MRI of different time points (pre-injection, 1 h, 4 h, 8 h, 10 h, 24 h) before and after intravenous injection of 4 different doses of Au–Gd NCs (doseAu = 0.685 mg kg−1, doseAu = 1.35 mg kg−1, doseAu = 2.7 mg kg−1, doseAu = 4.05 mg kg−1) was performed on the tumor-bearing mice. The mice were anesthetized with isoflurane as the positions were prone and feet-first while selecting the subcutaneous tumor as the center of the region of interest (ROI). The parameters of the FSE sequence were as follows: slice number = 1, slice thickness = 2 mm, the gap between slices = 0 mm, FOV = 74 × 70 mm2, TR = 600 ms, TE = 15.58 ms, flip angle = 90°/145°, average numbers = 4, bandwidth = 260 Hz.
NIR-II fluorescence live imaging was performed with an 808 nm laser (0.25 mW cm−2), a 1000 nm long-pass filter, and an exposure time of 500 ms. C6 tumor-bearing mice were anesthetized with isoflurane with the mice in the prone position. The mice were imaged before and after intravenous injection of Au–Gd NCs (doseAu = 2.7 mg kg−1) to obtain the signal of background and signal intensities of the subcutaneous tumor at the pre-determined time points (pre-injection, 1st h, 2nd h, 4th h, 6th h, 8th h, 10th h, and 24th h). The vital organs (brain, heart, liver, spleen, lung, and kidney) and tumors of the mice were then stripped out at the time points of 8 h and 24 h post-injection of Au–Gd NCs for NIR-II fluorescence live imaging mentioned. All the images captured above were processed with the software of Image J.
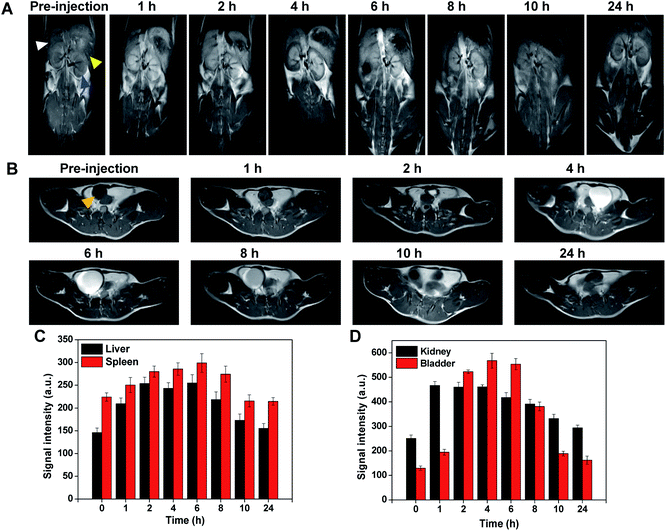
The mice were anesthetized with isoflurane, and MR scanning of C6 tumor-bearing mice was performed before and after intravenous administration of Au–Gd NCs (doseAu = 2.7 mg kg−1) as the mice positions were prone and feet-first while selecting the subcutaneous tumor as the center of the region of interest (ROI). The ROI also included the liver, spleen, kidney, and bladder of the mice. The parameters were the same as those mentioned above. The time points of MR scanning were chosen as pre-injection, 1st h, 2nd h, 4th h, 6th h, 8th h, 10th h, and 24th h after the injection of Au–Gd NCs as the NIR-II fluorescence live imaging mentioned above.
In vivo RT therapy
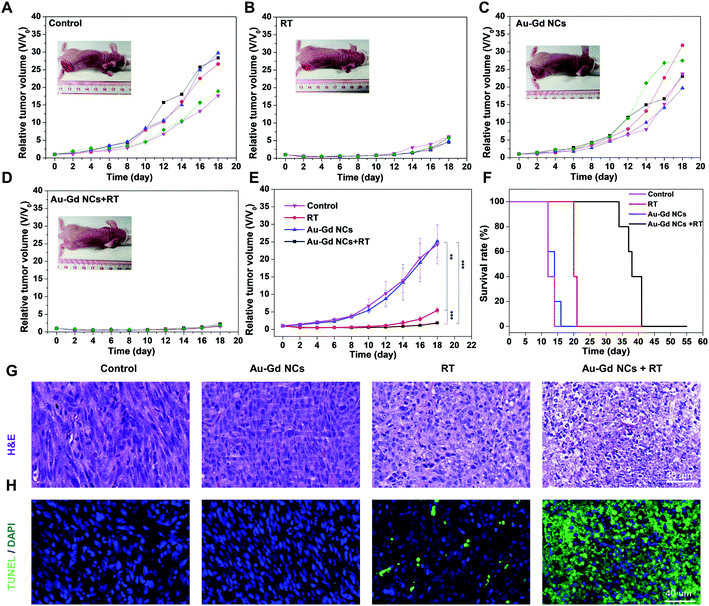
After establishing the tumor models, the tumor-bearing mice were randomly divided into four groups (n = 6): (1) control, (2) Au–Gd NCs, (3) RT, and (4) Au–Gd NCs + RT. Radiotherapy (8 Gy, 2 Gy min−1) was conducted 8 h after an IV injection of Au–Gd NCs (doseAu = 2.7 mg kg−1) or PBS when the tumor size of the mice grew to ∼50 mm2. The body weights and tumor volumes (length × width2/2) were recorded every other day. To evaluate histological and apoptotic levels of the tumors of all 4 groups post-treatment, one mouse randomly selected from each group was sacrificed, and tumors were excised for H&E and TUNEL staining at 24 h post-treatment.In vivo toxicology analysis
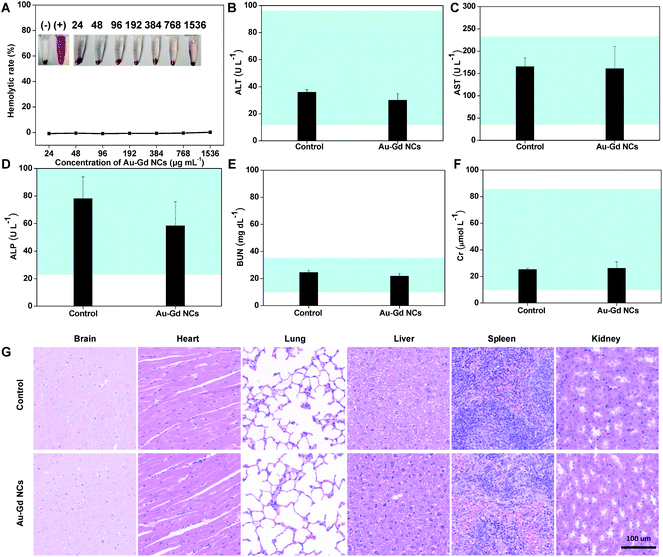
For the in vivo toxicity studies, PBS (200 μL, 0.1 M, pH 7.4) and Au–Gd NCs (200 μL, 9 mg mL−1) were administered intravenously to healthy mice, respectively. For the blood biochemistry assay, the blood serum of the mice was extracted ten days after injection. The vital organs (including the brain, heart, lung, liver, spleen, and kidney) were then extracted and fixed in 4% formaldehyde for 24 h. After being embedded by paraffin, sectioning, and H & E staining, histological sections of the organs were observed under an optical microscope.Results and discussion
Synthesis and characterization of NIR-II Au–Gd NCs
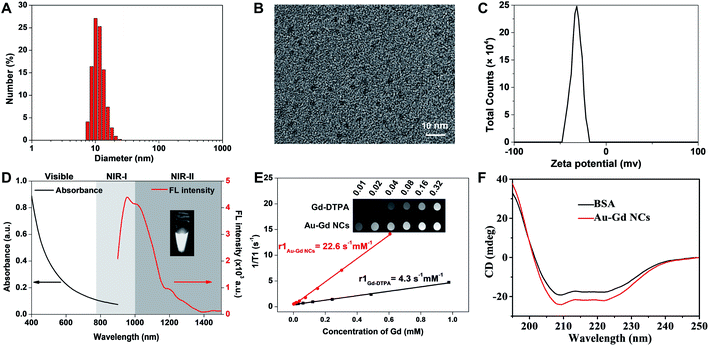
Based on previous reports, albumin-based biomineralization was employed to synthesize NIR-II Au NCs.11,33 Albumin, as an endogenous protein, could bind metal ions through various metal-binding sites, such as N-terminal amine and Cys residues.33,35,36 Under alkaline conditions, effective reduction of albumin-Au3+ to albumin-Au0 is attributed to the weak reduction performance of albumin. A large number of active groups of albumin-capped NIR-II Au NCs allowed modification of different molecules. Diethylenetriaminepentaacetic acid (DTPA) is used as a complexing agent, especially for Gd3+ ions for medical MRI. Next, through the reaction of anhydride and amino groups of albumin, DTPA was conjugated with Au NCs, and free Gd3+ ions were further chelated with DTPA to obtain Au–Gd NCs. Transmission electron microscopy (TEM) images revealed that the average size of Au–Gd NCs was ∼2.0 nm, whereas the average hydrophilic size of Au–Gd NCs was 11.5 ± 0.4 nm attributed to the presence of albumin encapsulation (Fig. 1A and B). The zeta potential of Au–Gd NCs was measured to be −31.9 ± 4.91 mV, indicating that the Au–Gd NCs have negative surface charges (Fig. 1C). Though optical measurements of Au–Gd NCs failed to demonstrate any surface plasma absorption peak, good near-infrared fluorescence emission at NIR-I and NIR-II windows was detected (Fig. 1D). Good potential for NIR-II bioimaging was substantiated by the higher NIR-II fluorescence QYs of Au–Gd NCs estimated to be ∼3.0%, as compared to that of other NIR-II fluorescent contrast agents.37–39 Furthermore, the relaxation rate (r1) of Au–Gd NCs was measured to be 22.6 s−1 mM−1 in a 3T MRI system, which was 5.3 times that of commercial DTPA-Gd (r1 = 4.3 s−1 mM−1), reflecting a good potential for in vitro MRI (Fig. 1E). The formation of Au NCs and loading of DTPA-Gd did not change the circular dichroism spectrum of BSA (Fig. 1F), revealing no apparent effects of biomineralization and chemical coupling process on the secondary and tertiary structures of BSA. Next, the colloidal stability of Au–Gd NCs was assessed by measuring their hydrophilic size and zeta potential over time (Fig. S1A, B†). Au–Gd NCs manifested superior stability within seven weeks of storage at 4 °C in the dark. Moreover, the NIR-II fluorescence and MRI signals of Au–Gd NCs dispersed in DMEM, FBS, and PBS solutions remained unaffected (Fig. S1C, D†). Meanwhile, the NIR-II fluorescence and MRI signals were explored by dispersing Au–Gd NCs in solutions with different pH values (pH = 2.0–12.0), and the results fail to show any change (Fig. S1E, F†). It can thus be concluded that the prepared Au–Gd NCs have good stability and NIR-II fluorescence and MRI dual-model imaging performance.In vitro biocompatibility, cellular uptake and sensitization of radiotherapy
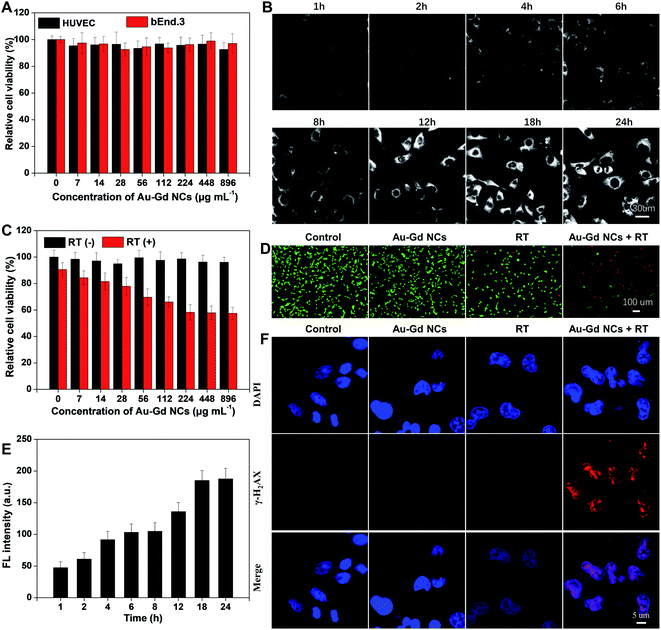
The cytotoxicity of Au–Gd NCs was initially explored by the CCK-8 assay prior to the in vivo studies. Normal HUVEC and bEnd.3 cells were incubated with different concentrations of Au–Gd NCs for 24 h. The cell viability results above 95% validated minimal cytotoxicity (Fig. 2A). Next, cellular uptake efficiency was investigated with the help of a custom-made NIR-II fluorescence microscope. As illustrated in Fig. 2B, Au–Gd NCs entered the cytoplasm of C6 glioma cells over time, revealing strong fluorescence. The NIR-II FL intensity reached a peak at approximately 18 h and then remained unchanged (Fig. 2E). The sensitization of tumor radiotherapy with regard to their high-Z element results from the high cellular uptake efficiency. The sensitized radiotherapy performance of Au–Gd NCs was visualized by the Calcein-AM/PI co-staining imaging. As evident in Fig. 2D, C6 glioma cells in the control group and the single Au–Gd NC-treated group demonstrated green fluorescence, while a small amount of red fluorescence was exhibited by the cells in the radiation group alone. Good sensitization of radiotherapy was obtained in the C6 glioma cells treated with combined Au–Gd NCs and radiotherapy, which highlighted a lot of red fluorescence. A DNA damage assay via immunofluorescence detection of γ-H2AX indicated that the Au–Gd NCs + RT group showed a higher level of DNA double-strand breaks than those of other groups, suggesting the effective radiosensitization of Au–Gd NCs (Fig. 2F, S2†). This sensitization effect was found to be dependent on the concentration of Au–Gd NCs. When the concentration of Au–Gd NCs increased to 224 μg mL−1, the cell survival rate was only ∼48% (Fig. 2C). These findings suggested the potential of Au–Gd NCs with good biocompatibility and high cellular uptake efficiency as promising radiosensitizers for image-guided tumor therapy.Optimum concentration of Au–Gd NCs for experiments in vivo
As shown in Fig. S3,† the signal intensity at 8 h post-injection reached a peak and in comparison to the initial signal intensity, the signal intensity at 8 h post-injection increased 1.3, 1.8, 2.5 and 1.9 times respectively for the 4 different doses of Au–Gd NCs (doseAu = 0.685 mg kg−1, doseAu = 1.35 mg kg−1, doseAu = 2.7 mg kg−1, doseAu = 4.05 mg kg−1). According to these tumor MR imaging results in vivo, we chose doseAu = 2.7 mg kg−1 (i.v. injection) as the optimal imaging and radiotherapy sensitization dose in vivo.In vivo NIR-II fluorescence imaging
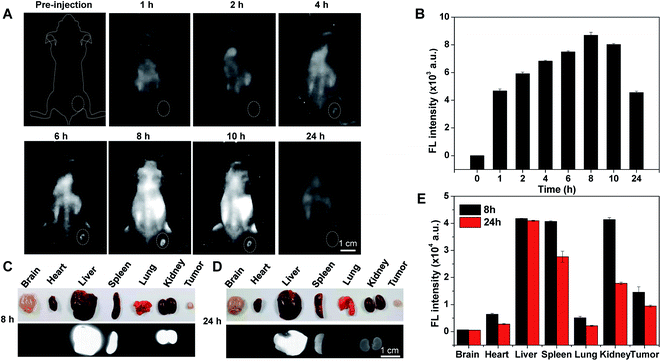
The significant biocompatibility and bright NIR-II fluorescence derived from the in vitro findings with Au–Gd NCs prompted us to explore their tumor imaging potential. C6 tumor-bearing mouse models (tumor volume = ∼50 mm3) were thus developed, and in vivo NIR-II fluorescence imaging was performed using a commercially available NIR-II fluorescent imaging system (excitation wavelength = 808 nm, 1000 nm long-pass filter). The whole body of the mice revealed strong fluorescence, 4 h after intravenous (IV) administration of Au–Gd NCs (doseAu = 2.7 mg kg−1). Subsequently, increased NIR-II fluorescence of the tumor region and reduced background fluorescence over time were attributed to the enhanced permeability and retention (EPR) effect and gradual metabolism of Au–Gd NCs. The peak of NIR-II fluorescence in tumors was obtained at 8 h post-injection and the SRB was estimated to be 8.2, highlighting their good tumor-targeting ability (Fig. 3A and B). Thereafter, tumor-bearing mice were euthanized at 8 h and 24 h post-injection, and their major organs, including the brain, heart, liver, spleen, lung, kidney, and tumor tissues, were extracted for ex vivo NIR-II fluorescence imaging. This study substantiated the distribution of NIR-II fluorescence of Au–Gd NCs in the liver, spleen, kidney, and tumor. A time-dependent renal clearance was evident by the decrease in the NIR-II fluorescence signal in the kidney from 8 h to 24 h. The characteristic of the simultaneous liver and kidney metabolism of Au–Gd NCs facilitated reduction in their side effects (Fig. 3C–E).In vivo MRI
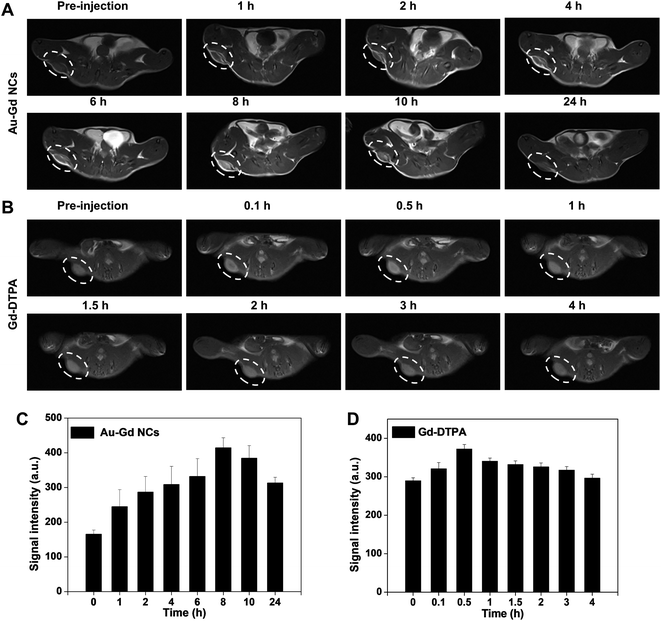
Next, MRI was further applied to evaluate the tumor-targeting ability and metabolic processes of Au–Gd NCs due to its complementarity to NIR-II fluorescence, allowing deep-tissue penetration and 3D imaging of tumor tissues.34,40,41 Gradual enhancement of T1-weighted MRI signals of tumor tissues was observed following IV injection of Au–Gd NCs (Fig. 4A). In comparison to the initial signal intensity, the signal intensity at 8 h post-injection increased 2.5 times, with a subsequent decrease over time (Fig. 4C). Due to their rapid metabolic processes, commercially available Gd-DTPA contrast agents, on the contrary, portrayed low tumor-targeting and short imaging windows (Fig. 4B and D). These findings proposed the contribution of Au–Gd NCs with a high relaxation rate to performing highly sensitive and tumor-targeting imaging in tumor-bearing mice models.Subsequently, alteration of the imaging region of MRI aided in the in vivo exploration of the metabolic processes of Au–Gd NCs. Time-dependent T1-weighted MRI signals were recorded in the liver, spleen, kidney, and bladder post-injection of Au–Gd NCs (Fig. 5A and B). MRI signals in these tissues reverted to their pre-injection state after 24 h. This suggested that clearance of Au–Gd NCs could be via both liver-spleen and kidney-bladder metabolic pathways (Fig. 5C and D). The multiple metabolic pathways facilitate reduced retention and in vivo toxicity of Au–Gd NCs, which is in agreement with the results of NIR-II fluorescence imaging. Good metabolizability of Au–Gd NCs indicated their potential for imaging-guided tumor therapy.
Sensitization of tumor radiotherapy
Twenty-four tumor-bearing nude mice (tumor volume = ∼50 mm3) were randomly divided into four groups (n = 6/group) as follows: (1) control group, (2) Au–Gd NCs group, (3) RT group, and (4) Au–Gd NCs + RT group. Tumor radiotherapy (dose = 8 Gy) was conducted at 8 h post-injection of Au–Gd NCs (doseAu = 2.7 mg kg−1). To assess tumor suppression efficiency, the tumor volume was recorded every other day following radiotherapy (Fig. S4†). The results claimed rapid tumor growth in (1) the control group and (2) the Au–Gd NCs group, signifying no treatment effect of Au–Gd NCs alone. Delay in tumor growth was evident in the (3) RT group 12 days post-treatment, however, the tumor recurrence observed at 14 days suggested their low anti-tumor effect. On the contrary, reduction in tumor volume in the (4) Au–Gd NCs + RT group was noted 14 days after treatment. A statistically significant difference was substantiated by the much higher anti-tumor efficiency of (4) the Au–Gd NCs + RT group at 18 days after treatment relative to that of the (1) control group, (2) Au–Gd NCs group, and (3) RT group (Fig. 6A–E). These findings implied good radiosensitizer potential of Au–Gd NCs for anti-tumor therapy attributed to their high tumor-targeting and high-Z elements.To further elucidate the sensitization effect of Au–Gd NCs, the cell apoptosis of tumor tissue was investigated by tunnel staining and HE staining analysis at 24 h post-treatment (Fig. 6G and H). Fig. 6H prominently indicated the apoptosis of tumor cells in the Au–Gd NCs + RT group, followed by the RT group, with no apoptosis in the control group and Au–Gd NCs group. This was authenticated by the HE staining analysis that revealed significant alteration in nuclear morphology, cell division, nucleolytic, and cytoplasmic reduction in the Au–Gd NCs + RT group. No significant changes in the nucleus and cytoplasm were witnessed in the control group and Au–Gd NCs group. A ∼3 fold increase in the survival period of tumor-bearing mice in the Au–Gd NCs + RT group was obtained compared with that in the control group and Au–Gd NCs group (Fig. 6F). The results further verified an excellent sensitization effect of Au–Gd NCs for cancer radiotherapy. During the treatment process, no significant change in the body weight of tumor-bearing mice indicated low serious side effects (Fig. S5†).
In vivo toxicity of Au–Gd NCs
Hematological and histological analysis assessed the toxicity of Au–Gd NCs in normal mice. Red blood cells derived from mouse blood were incubated with different concentrations of Au–Gd NCs ranging from 24 g mL−1 to 1534 μg mL−1 for 2 h. Good blood compatibility is designated by the hemolysis rate less than 10% (Fig. 7A). Moreover, after IV injection of PBS and Au–Gd NCs to healthy mice respectively for 10 days, the blood of mice was collected to estimate hematological and biochemical indicators. Consistency of the liver (Fig. 7B–D) and kidney (Fig. 7E and F) function indexes of mice was reported with those in the control group (Fig. 7B–F). Meanwhile, the mice were euthanized and the main organs, including the brain, heart, lung, liver, spleen, and kidney, were excised for HE staining analysis. The results confirmed that the vital organs of mice treated with PBS and Au–Gd NCs were normal without cell apoptosis and inflammation (Fig. 7G). This suggested good in vivo compatibility of Au–Gd NCs.Conclusions
We adopted albumin-based biomineralization to successfully prepare Au–Gd NCs with ultrasmall size (∼2 nm), excellent NIR-II fluorescence (QYs = 3.0%), and MRI performance (r1 = 22.6 s−1 mM−1). C6 brain tumor-bearing mice were exploited to demonstrate the NIR-II fluorescence and MRI dual-model imaging-guided sensitization of tumor radiotherapy. Effective inhibition of tumor growth and prolongation of the survival period of tumor-bearing mice were noted. Abundant surface functional groups, low cytotoxicity, and efficient liver and kidney metabolism of Au–Gd NCs provided great potential for tumor-targeting multimodal imaging, tumor combined therapy, and precision cancer theranostics.Author contributions
Hui Zhao: data curation, investigation, methodology, writing – original draft. Hao Wang: visualization, methodology, writing – review & editing. Hairu Li: investigation, methodology. Tiecheng Zhang: supervision, project administration. Jing Zhang: investigation, software. Wenhui Guo: validation, software. Kuang Fu: formal analysis, supervision, writing – review & editing. Guoqing Du: conceptualization, resources, supervision, writing – review & editing, project administration.Conflicts of interest
The authors declare no conflict of interest.Acknowledgements
This research did not receive any specific grant from funding agencies in the public, commercial, or not-for-profit sectors.References
- C. Lee, X. Liu, W. Zhang, M. A. Duncan, F. Jiang, C. Kim, X. Yan, Y. Teng, H. Wang, W. Jiang, Z. Li and J. Xie, Nanoscale, 2021, 13 Search PubMed.
- H. L. Chee, C. R. R. Gan, M. Ng, L. Low, D. G. Fernig, K. K. Bhakoo and D. Paramelle, ACS Nano, 2018, 12, 6480–6491 CrossRef CAS PubMed.
- C. Du, J. Wang, X. Liu, H. Li, D. Geng, L. Yu, Y. Chen and J. Zhang, Biomaterials, 2020, 230, 119581 CrossRef CAS PubMed.
- K. Y. Zheng and J. P. Xie, Trends Chem., 2020, 2, 665–679 CrossRef CAS.
- X. Meng, I. Zare, X. Yan and K. Fan, Wiley Interdiscip. Rev.: Nanomed. Nanobiotechnol., 2020, 12, e1602 Search PubMed.
- Z. Yang, Y. Zhao, Y. Hao, X. Li, A. V. Zvyagin, A. K. Whittaker, Y. Cui, B. Yang, Q. Lin and Y. Li, Part. Part. Syst. Charact., 2021, 38, 2100001 CrossRef CAS.
- Y. Li, Y. Cao, L. Wei, J. Wang, M. Zhang, X. Yang, W. Wang and G. Yang, Acta Biomater., 2020, 101, 436–443 CrossRef CAS PubMed.
- Y. G. Srinivasulu, Q. F. Yao, N. Goswami and J. P. Xie, Mater. Horiz., 2020, 7, 2596–2618 RSC.
- Z. Li, H. Peng, J. Liu, Y. Tian, W. Yang, J. Yao, Z. Shao and X. Chen, ACS Appl. Mater. Interfaces, 2018, 10, 83–90 CrossRef CAS PubMed.
- Q. Dan, D. Hu, Y. Ge, S. Zhang, S. Li, D. Gao, W. Luo, T. Ma, X. Liu, H. Zheng, Y. Li and Z. Sheng, Biomater. Sci., 2020, 8, 973–987 RSC.
- W. Wang, Y. Kong, J. Jiang, Q. Xie, Y. Huang, G. Li, D. Wu, H. Zheng, M. Gao, S. Xu, Y. Pan, W. Li, R. Ma, M. X. Wu, X. Li, H. Zuilhof, X. Cai and R. Li, Angew. Chem., Int. Ed., 2020, 59, 22431–22435 CrossRef CAS PubMed.
- Y. Yang, Y. Yu, H. Chen, X. Meng, W. Ma, M. Yu, Z. Li, C. Li, H. Liu, X. Zhang, H. Xiao and Z. Yu, ACS Nano, 2020, 14, 13536–13547 CrossRef CAS PubMed.
- C. N. Loynachan, A. P. Soleimany, J. S. Dudani, Y. Lin, A. Najer, A. Bekdemir, Q. Chen, S. N. Bhatia and M. M. Stevens, Nat. Nanotechnol., 2019, 14, 883–890 CrossRef CAS PubMed.
- L. Tang, X. Zeng, H. Zhou, C. Gui, Q. Luo, W. Zhou, J. Wu, Q. Li, Y. Li and Y. Xiao, Chem. Res., 2021, 37, 934–942 CAS.
- Z. Wu, Q. Yao, O. J. H. Chai, N. Ding, W. Xu, S. Zang and J. Xie, Angew. Chem., Int. Ed., 2020, 59, 9934–9939 CrossRef CAS PubMed.
- H. Liu, G. Hong, Z. Luo, J. Chen, J. Chang, M. Gong, H. He, J. Yang, X. Yuan, L. Li, X. Mu, J. Wang, W. Mi, J. Luo, J. Xie and X. D. Zhang, Adv. Mater., 2019, 31, e1901015 CrossRef PubMed.
- D. Li, Q. Liu, Q. Qi, H. Shi, E. C. Hsu, W. Chen, W. Yuan, Y. Wu, S. Lin, Y. Zeng, Z. Xiao, L. Xu, Y. Zhang, T. Stoyanova, W. Jia and Z. Cheng, Small, 2020, 16, e2003851 CrossRef PubMed.
- X. Song, W. Zhu, X. Ge, R. Li, S. Li, X. Chen, J. Song, J. Xie, X. Chen and H. Yang, Angew. Chem., Int. Ed., 2021, 60, 1306–1312 CrossRef CAS PubMed.
- M. Cui, S. Liu, B. Song, D. Guo, J. Wang, G. Hu, Y. Su and Y. He, Nanomicro Lett., 2019, 11 Search PubMed.
- R. Yan, Y. Hu, F. Liu, S. Wei, D. Fang, A. J. Shuhendler, H. Liu, H. Y. Chen and D. Ye, J. Am. Chem. Soc., 2019, 141, 10331–10341 CrossRef CAS PubMed.
- Z. Hu, C. Fang, B. Li, Z. Zhang, C. Cao, M. Cai, S. Su, X. Sun, X. Shi, C. Li, T. Zhou, Y. Zhang, C. Chi, P. He, X. Xia, Y. Chen, S. S. Gambhir, Z. Cheng and J. Tian, Nat. Biomed. Eng., 2020, 4, 259–271 CrossRef PubMed.
- W. Sun, L. Luo, Y. Feng, Y. Qiu, C. Shi, S. Meng, X. Chen and H. Chen, Adv. Mater., 2020, 32, e2000377 CrossRef PubMed.
- X. Hu, Y. Tang, Y. Hu, F. Lu, X. Lu, Y. Wang, J. Li, Y. Li, Y. Ji, W. Wang, D. Ye, Q. Fan and W. Huang, Theranostics, 2019, 9, 4168–4181 CrossRef CAS PubMed.
- J. J. Ma, M. X. Yu, Z. Zhang, W. G. Cai, Z. L. Zhang, H. L. Zhu, Q. Y. Cheng, Z. Q. Tian and D. W. Pang, Nanoscale, 2018, 10, 10699–10704 RSC.
- H. Zhou, H. Yang, L. Tang, Y. Wang, Y. Li, N. Liu, X. D. Zeng, Y. Yan, J. Z. Wu, S. Z. Chen, L. Xiao, Y. Yu, Z. X. Deng, H. Deng, X. C. Hong and Y. L. Xiao, J. Mater. Chem. C, 2019, 7, 9448–9454 RSC.
- F. Li, T. Li, D. Zhi, P. Xu, W. Wang, Y. Hu, Y. Zhang, S. Wang, J. Matula Thomas, J. Beauchamp Norman, W. Ding, L. Yan and B. Qiu, Biomaterials, 2020, 256, 120219 CrossRef CAS PubMed.
- C. Li, L. Cao, Y. Zhang, P. Yi, M. Wang, B. Tan, Z. Deng, D. Wu and Q. Wang, Small, 2015, 11, 4517–4525 CrossRef CAS PubMed.
- Z. Li, C. Wang, J. Chen, X. Lian, C. Xiong, R. Tian, L. Hu, X. Xiong and J. Tian, Mater. Des., 2021, 198 CAS.
- H. Gong, R. Peng and Z. Liu, Adv. Drug Delivery Rev., 2013, 65, 1951–1963 CrossRef CAS PubMed.
- P. Awasthi, X. An, J. Xiang, N. Kalva, Y. Shen and C. Li, Nanoscale, 2020, 12, 5678–5684 RSC.
- Y. Li, S. Zeng and J. Hao, ACS Nano, 2019, 13, 248–259 CrossRef CAS PubMed.
- X. Zhou, Q. Liu, W. Yuan, Z. Li, Y. Xu, W. Feng, C. Xu and F. Li, Ultrabright NIR-II Emissive Polymer Dots for Metastatic Ovarian Cancer Detection, Adv. Sci., 2021, 8, 2000441 CrossRef CAS PubMed.
- L. Tang, X. D. Zeng, H. Zhou, C. H. Gui, Q. L. Luo, W. Y. Zhou, J. Wu, Q. Q. Li, Y. Li and Y. L. Xiao, Chem. Res. Chin. Univ., 2021, 37, 9 Search PubMed.
- D. Ni, W. Bu, E. B. Ehlerding, W. Cai and J. Shi, Chem. Soc. Rev., 2017, 46, 7438–7468 RSC.
- B. B. Zhang, J. Wang, J. N. Yu, X. M. Fang, X. L. Wang and D. L. Shi, Bioconjugate Chem., 2017, 28, 330–335 CrossRef CAS PubMed.
- W. T. Yang, W. S. Guo, J. Chang and B. B. Zhang, J. Mater. Chem. B, 2017, 5, 401–417 RSC.
- A. L. Antaris, H. Chen, K. Cheng, Y. Sun, G. Hong, C. Qu, S. Diao, Z. Deng, X. Hu, B. Zhang, X. Zhang, O. K. Yaghi, Z. R. Alamparambil, X. Hong, Z. Cheng and H. Dai, Nat. Mater., 2016, 15, 235 CrossRef CAS PubMed.
- Y. Li, Y. Liu, Q. Li, X. Zeng, T. Tian, W. Zhou, Y. Cui, X. Wang, X. Cheng, Q. Ding, X. Wang, J. Wu, H. Deng, Y. Li, X. Meng, Z. Deng, X. Hong and Y. Xiao, Chem. Sci., 2020, 11, 2621 RSC.
- R. Tian, Q. Zeng, S. Zhu, J. Lau, S. Chandra, R. Ertsey, K. S. Hettie, T. Teraphongphom, Z. Hu, G. Niu, D. O. Kiesewetter, H. Sun, X. Zhang, A. L. Antaris, B. R. Brooks and X. Chen, Sci. Adv., 2019, 5, eaaw672J Search PubMed.
- R. Marasini, T. D. Thanh Nguyen and S. Aryal, Wiley Interdiscip. Rev.: Nanomed. Nanobiotechnol., 2020, 12, e1580 CAS.
- H. Li and T. J. Meade, J. Am. Chem. Soc., 2019, 141, 17025–17041 CrossRef CAS PubMed.
Footnotes |
| † Electronic supplementary information (ESI) available. See DOI: 10.1039/d2na00044j |
| ‡ Hui Zhao and Hao Wang contributed equally to this work. |
| This journal is © The Royal Society of Chemistry 2022 |

