 Open Access Article
Hollow carbon nanospheres embedded with stoichiometric γ-Fe2O3 and GdPO4: tuning the nanospheres for in vitro and in vivo size effect evaluation†
Hui
Zhang‡
a,
Jianping
Zhang‡
b,
Yi
Chen
a,
Tianze
Wu
a,
Mingzhu
Lu
a,
Zhenxia
Chen
 a,
Yu
Jia
a,
Yongtai
Yang
a,
Yun
Ling
a,
Yu
Jia
a,
Yongtai
Yang
a,
Yun
Ling
 *ac and
Yaming
Zhou
 *a
*a
aShanghai Key Laboratory of Molecular Catalysis and Innovative Materials, Department of Chemistry, Fudan University, Shanghai, 200433, China. E-mail: yunling@fudan.edu.cn; ymzhou@fudan.edu.cn
bDepartment of Nuclear Medicine, Fudan University Shanghai Cancer Center, Shanghai, 200032, China
cZhuhai Fudan Innovation Institute, Zhuhai, Guangdong 519000, China
First published on 20th January 2022
Abstract
The size modulation of hollow carbon nanospheres (HCSs) has attracted great interest in the contexts of cellular uptake, drug delivery and bioimaging. In this study, a facile fabrication method was specifically used to minimize all influencing factors except for the particle size. A series of nanoparticles of hollow carbon nanospheres embedded with magnetic resonance imaging (MRI) nanoagent γ-Fe2O3 and GdPO4 nanoparticles (Fe–Gd/HCS), were successfully prepared and applied to in vitro/vivo evaluation with well-defined sizes of ∼100 nm (Fe–Gd/HCS-S), ∼200 nm (Fe–Gd/HCS-M), and ∼300 nm (Fe–Gd/HCS-L), respectively. Then the in vitro size effect of Fe–Gd/HCS was systematically investigated by bio-TEM, CLSM, CCK-8 assay, and flow cytometry revealing that Fe–Gd/HCS could be internalized and the cellular uptake amounts increase with the decrease of size. Furthermore, the in vivo size-effect behavior of Fe–Gd/HCS (∼100 nm, ∼200 nm, ∼300 nm) was tracked by MRI technique, demonstrating that all Fe–Gd/HCS can distinguish the liver, in which Fe–Gd/HCS with the smallest particle size exhibited the best performance among these nanoparticles. By leveraging on these features, Fe–Gd/HCS-S (∼100 nm) was further chosen as a theranostic agent, preliminarily presenting its capability for multi-modal imaging and therapy.
Introduction
Hollow nanospheres have become increasingly attractive for application in micro-/nano-reactors,1–4 catalysis,5,6 energy storage,7–10 and biomedicine11–14 due to their unique hollow nanostructure, tunable size/thickness, large surface area, low density and high loading capacity. Currently, the composition of hollow spherical shells has also evolved from silica and polymers, resulting in much more functional materials such as metals, metal oxides, and complex compounds. Based on the hollow spherical shell, these materials have been applied in various fields, especially in biomedicine.15,16 Hollow carbon nanospheres (HCSs), one of the hollow nanospheres with shell composition of carbon, have been widely used as biosensors, drug carriers, and photothermal agents owing to the combination of a hollow nanostructure, intrinsic carbon properties and excellent biocompatibility.17–20 In these biomedical applications, the introduction of HCSs into biological fluids and tissues is required, which frequently depends on the internalization of these nanoparticles by cells.21–24 Therefore, it is imperative to investigate the biological behaviors of HCSs in order to explore and optimize the biomedical applications of HCSs.Generally, the extent and efficiency of the cellular uptake of nanoparticles strongly depend on the particle size, morphology, surface charge, and surface chemistry.24–29 In recent years, studies have found that the size plays a critical role in modulating interactions between nanoparticles and biological systems. Thus it is of significance to study the size effect to achieve high therapeutic efficiency.30–32 It has been reported that different-size nanoparticles may enter cells via different internalization pathways, or even multiple pathways. And nanoparticles with suitable size can directly contribute to faster adherence to cells and higher efficiency of cellular uptake. However, previous studies of HCS nanoparticles usually focused on the properties of drug delivery and imaging, but the investigation of the size effect on cellular uptake, cytotoxicity, and in vivo behavior has not been specifically explored and evaluated. On the other hand, the complexity of in vivo systems and inherent inertness of carbon also limit the assessment and understanding of the in vivo size effect. Therefore, using appropriate techniques to explore the in vivo size effect of HCSs is urgent, which could further optimize the diagnostic sensitivity and therapeutic efficacy. Magnetic resonance imaging (MRI), one of the best noninvasive and highly sensitive methodologies for clinical diagnostics, was chosen to be applied to test the performances of HCSs in vivo.33,34 Our groups previously developed a serial of functionalized magnetic carbon materials using post-synthetic modification with Wells–Dawson-like heterometallic clusters {Fe6Gd6P6}, which possessed T1 and T2 MRI enhanced capabilities.35,36 In this context, MRI nanoagents of γ-Fe2O3 and GdPO4 nanoparticles were embedded into HCSs making it feasible to evaluate the size effect in vivo by MRI tracking.
Herein, three hollow carbon nanospheres of different sizes (∼100 nm, ∼200 nm, and ∼300 nm) embedded with magnetic nanoparticles of γ-Fe2O3 and GdPO4 (denoted as Fe–Gd/HCS) (Scheme 1) were prepared to explore the size effect. Then systematic experiments were carried out to reveal the size effect of Fe–Gd/HCS nanoparticles on the interactions and cytotoxicity with cells in vitro by bio-TEM, CLSM, CCK-8 assay, and flow cytometry. The size-dependent increase of the number of internalized Fe–Gd/HCS was clearly observed. And the in vivo size effect of Fe–Gd/HCS was visualized by taking advantage of the embedded MRI nanoagents (γ-Fe2O3 and GdPO4). On the other hand, a decrease of signal intensity of the liver in T2-weighted images was observed with the smallest size of 100 nm, exhibiting the most significant decrease in negative contrast at 0.25 h. This result suggested that the smallest size of Fe–Gd/HCS (∼100 nm) can clearly distinguish the liver, overwhelming to the other sizes (∼200 nm, ∼300 nm). Our proof-of-principle studies using Fe–Gd/HCS-S as the theranostic agent preliminarily presented its capability for potential multi-modal imaging and therapy.
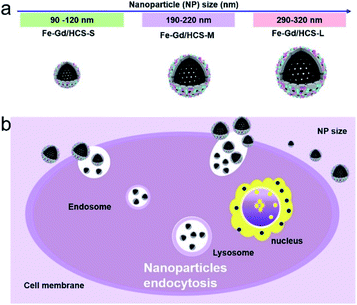 | ||
| Scheme 1 (a) The schematic diagram of Fe–Gd/HCS with size vary from 100 to 320 nm and (b) the size-effect endocytosis of Fe–Gd/HCS nanoparticles. | ||
Results and discussion
Preparing and tuning the size of Fe–Gd/HCS
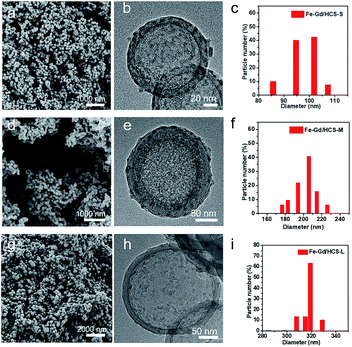
Resorcinol formaldehyde (RF) coated SiO2 (SiO2@RF) core–shell nanoparticles were prepared by a classic two-step Stöber method, which was then post-synthetically functionalized with Wells–Dawson-like heterometallic clusters {Fe6Gd6P6},37–39 giving SiO2@RF/{Fe6Gd6P6}. Carbonization and selective etching of the SiO2 core resulted in the isolation of hollow carbon nanospheres on which γ-Fe2O3 and GdPO4 stoichiometrically decomposed from {Fe6Gd6P6} were embedded (named Fe–Gd/HCS). Tuning the particle size was simply achieved by changing the EtOH volume from 25 to 35 and to 50 mL in the two-step Stöber process. As shown in Fig. 1, scanning electron microscopy (SEM) images confirmed their uniform spherical morphologies with the particle size varying from ∼300 nm to ∼200 nm and ∼100 nm. Although further increasing amount of EtOH could lead to a constant decrease of particle size down to ∼60 nm, large scale aggregation and adhesion of nanoparticles were observed. This phenomenon was not conducive to the application of nanoparticles for the following bio-evaluation (Fig. S1†). Hereafter, they were named Fe–Gd/HCS-L, Fe–Gd/HCS-M and Fe–Gd/HCS-S, respectively. Transmission electron microscopy (TEM) images confirmed their hollow structures with a cavity diameter/shell thickness of 180/70, 120/35 and 80/10 nm for Fe–Gd/HCS-L, Fe–Gd/HCS-M and Fe–Gd/HCS-S, respectively (Fig. 1 and S2†). The N2 sorption isotherms showed a gradually enlarged hysteresis loop with the decrease of nanoparticle size. And the BET surface area/pore diameter of Fe–Gd/HCS-S, Fe–Gd/HCS-M and Fe–Gd/HCS-L were 539/4.0, 432/4.0 and 413/4.0 (m2 g−1 nm−1), respectively (Fig. S3 and S4†). The enhanced hysteresis loop could be ascribed to the increased curvature of the hollow structure and the connectivity of mesopores. According to LaMer nucleation theory, increasing EtOH amount contributed to the burst nucleation of SiO2 and meanwhile limited its diffusion and growth, resulting in a small core for a large curvature of HCSs. Then coating RF on the core is governed by the Kelvin equation, in which the larger the curvature of SiO2, the more difficult it is to coat RF as it requires a higher concentration of RF in the liquid phase. In this context, the coating-available RF was insufficient, which finally resulted in a thin thickness and the opening of pores at both ends of carbon shell. Irrespective of the curvature and shell thickness, the evaporation-induced-sorption of an equal amount of {Fe6Gd6P6} promoted homogeneous dispersion of stoichiometric γ-Fe2O3 and GdPO4 as well as similar sizes and crystalline states, which were characterized by high-angle annular dark-field scanning transmission electron microscopy (HAADF-STEM), EDS line scanning, high-resolution TEM and powder X-ray diffraction analyses (Figure S5–S6†).In vitro and in vivo evaluation of the size effect
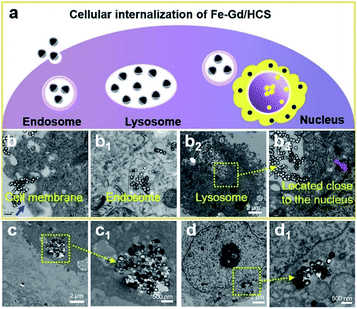
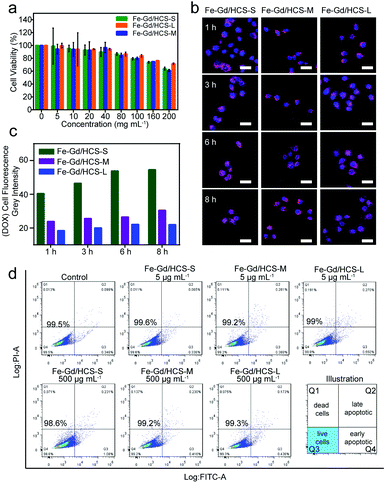
Hydrodynamic diameters and surface charges were firstly examined by dynamic light scattering (DLS) and electrophoretic mobility (EM) measurement at room temperature (Fig. S7†). Despite the increase of hydrated nanospherical size, their considerable dispersity and negative charge characteristics were verified. Size-dependent cellular uptake was then investigated using a HeLa cell line, which was incubated with Fe–Gd/HCS (100 μg mL−1) for 1 and 6 h respectively. As shown in Fig. 2 and S8,† bio-TEM images revealed an endo-lysosomal pathway, in which the Fe–Gd/HCS nanoparticles were internalized by endocytosis plausibly through a phagocytosis process. Then they are consequently delivered to endosomes, followed by final fusion with lysosomes. Size-dependent cellular uptake was clearly observed in the internalized nanoparticles following the order of Fe–Gd/HCS-S > Fe–Gd/HCS-M > Fe–Gd/HCS-L. In addition, as shown in the bright-field images, the cellular morphologies were retained well without obvious damage (Fig. S9†), indicating that Fe–Gd/HCS nanoparticles have no obvious cytotoxicity. Furthermore, the black nanoparticles slowly adhered to the cell membrane of HeLa cells after 1 h incubation. As the incubation time increased to 6 h, significant black nanoparticles were internalized into cytoplasm in accordance with the bio-TEM results.Nanoparticles could cause autophagy and/or lysosomal dysfunction through the endo-lysosomal pathway, thus inducing cell necrosis and/or apoptosis.40,41 The size-dependent cytotoxicity was therefore assessed by CCK-8 assay on HeLa, HepG2 and MCF-7 cell lines, respectively. For HeLa cells, as shown in Fig. 3a, the cell viability of HeLa cells incubated with Fe–Gd/HCS-S, Fe–Gd/HCS-M and Fe–Gd/HCS-L was above 80% even at concentrations up to 100 μg mL−1, respectively. These suggested little cytotoxicity for these three nanoparticles with different sizes. Quantitative analysis further exhibited no obvious apoptosis by flow cytometry after 24 hour incubation (Fig. 3d). These results indicated negligible cytotoxicity of Fe–Gd/HCS. Nevertheless, slight differences were observed between HeLa, MCF-7 and HepG2 cell lines (Fig. S10†), in which the Fe–Gd/HCS-L treated cells exhibited a slight increase in viability. This could be ascribed to the less internalized Fe–Gd/HCS-L nanoparticles as well as different sensitivities of cell lines.
Confocal laser scanning microscopy (CLSM) studies were further carried out to confirm the size-dependent cellular uptake (Fig. S11–S15 and Table S1†), in which blue-fluorescent DAPI was directly used for nuclear staining and red-fluorescent doxorubicin (DOX) loaded on Fe–Gd/HCS was used as a counterstaining probe. The cumulative DOX release behaviour of different Fe–Gd/HCS nanoparticles was firstly investigated in PBS solution (pH = 5.5), which revealed that the smaller size nanoparticles Fe–Gd/HCS-S could show higher values of DOX during the same time. Then, the CLSM experiments were performed with Fe–Gd/HCS at a safe concentration of 100 μg mL−1 based on the results of HeLa cells viability. After incubation for 1 h, blue fluorescence was readily observed in the nuclei of HeLa cells. And a weak signal of red fluorescence was observed in the cytoplasm. The analysis of the fluorescence intensity indicated gradual signal enhancement of red fluorescence as the incubation time increased from 1 to 8 h, revealing a cell-uptake process. At 1 h, the signal intensity in the case of Fe–Gd/HCS-S was approximately 1.69 and 2.20 times enhanced compared to that of Fe–Gd/HCS-M and Fe–Gd/HCS-L. Such observable enhancement remained steady with the increase of incubation time, demonstrating the size-dependent cellular uptake of Fe–Gd/HCS. This phenomenon matched well with previous studies on the effects of nanoparticle size on cellular uptake.42
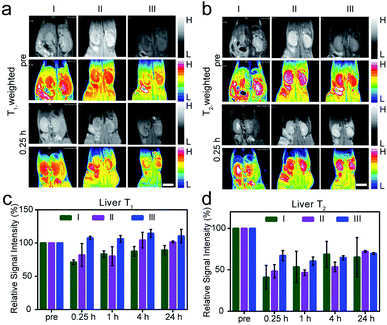
The in vivo size effect of Fe–Gd/HCS was assessed by magnetic resonance imaging (MRI), because of the intrinsic magnetic properties of embedded γ-Fe2O3 and GdPO4. M–H plots showed typical S-type curves without hysteresis loops but with a saturation magnetization (Ms) of 6.65, 7.21, and 4.31 emu g−1 at 2 T and 300 K for each Fe–Gd/HCS, indicating an overall superparamagnetic behavior (Fig. S16†). The r1 and r2 (1/T1 and 1/T2) relaxivity values were then measured to be 3.7 and 175.1, and 3.3 and 164.7 mM−1 S−1 at 3.0 T (r.t.) for Fe–Gd/HCS-M and Fe–Gd/HCS-L, respectively (Fig. S17 and S18†). The r1 and r2 relaxivity values of Fe–Gd/HCS-S have already been calculated and reported in our previous paper.36 It has been indicated that r2 relaxivity mainly depends on the size, crystallinity and water-dispersity of T2-contrast agents. The similarity of the particle size, crystallinity and amount of γ-Fe2O3 to each other can be expected due to the same post-synthesis process. Taking the size-dependent water-dispersity of nanoparticles into consideration, we tentatively ascribed the larger r2 value of Fe–Gd/HCS-S to its conceivable dispersion stability in water. The calculated r2/r1 ratio is over 10 for each Fe–Gd/HCS, indicating a primarily T2 contrast agent.43,44 Consequently, Fe–Gd/HCS was respectively administrated by intravenous injection to normal and healthy female Balb/c mice. Considering the clearance mechanism of hard-nanomaterials,45in vivo MRI of the liver was performed at different time intervals quantitatively. As indicated by the r2/r1 ratio, although the longitudinal (r1) relaxivity value is comparable to that of some Gd-based MR contrast agents, the T1-weighted images showed no obvious contrast enhancement though.46,47 In contrast, an enhancement in T2-weighted images was observed, in which Fe–Gd/HCS can clearly distinguish the liver from other tissues from darkening T2-weighted images (Fig. 4 and S19–S21†). To quantify the enhancement, the regions of interest (ROIs) were selected on the T1/T2-weighted MR images of the liver, in which the signal-to-noise ratio was calculated according to a previously reported method.48 Fe–Gd/HCS-S distinguished itself from the other two with a 59.0% decrease of the negative contrast at 0.25 h post-injection. The significant decrease could be ascribed to the active phagocytosis as well as the high r2 relaxivity. Then the decrease of the negative contrast returns to 46.4% (at 1 h), 31.2% (at 4 h) and 34.8% (at 24 h) (Fig. 4c and d). The return of the signal indicated an easier sequestration of Fe–Gd/HCS-S in vivo. In addition, after another week of normal feeding, hematoxylin and eosin (H & E) stained tissue studies were carried out on the liver, spleen, kidney, heart and lung, which showed no obvious organ damage (Fig. 5).
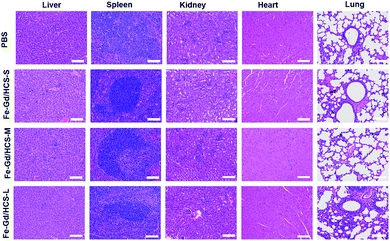 | ||
| Fig. 5 Hematoxylin and eosin (H & E) images of the major organs collected from mice treated with PBS, and Fe–Gd/HCS-S, Fe–Gd/HCS-M, and Fe–Gd/HCS-L, and scale bar: 100 μm. | ||
In vivo therapeutic evaluation
The above in vitro and in vivo evaluation screen out of Fe–Gd/HCS-S and so the antitumor drug DOX loaded Fe–Gd/HCS (denoted as DOX@Fe–Gd/HCS-S) was therapeutically evaluated based on a HeLa cell xenografted mouse model (Fig. S22†). The tumor-bearing nude mice were randomly divided into two groups and treated with the following: PBS (control) and DOX@Fe–Gd/HCS-S. During a 16 d treatment period, there is no noticeable bodyweight loss. However, it was observed that the tumor volumes in the PBS-treated group increased gradually and reached to be 3.98-fold on day 16 (Fig. S23†). In contrast, treatment with DOX@Fe–Gd/HCS-S not only inhibited the tumor growth but also reduced the volume by 30.12% as compared with the size before treatment, indicating the availability of Fe–Gd/HCS-S for drug delivery (Fig. S24†). In addition, besides the above verified MRI performance, we also performed photoacoustic imaging (PAI) on the xenografted tumor by taking advantage of the photothermal conversion properties of Fe–Gd/HCS (Fig. S25†).36 The PA signals in the tumor site were recorded at pre-injection, and 0.25, 1, 4, and 24 h post-injection. The PA signals showed an approximately 9.4-fold enhancement at 0.25 h post-injection compared to that of the tumor regions before the injection, suggesting the DOX@Fe–Gd/HCS-S was a novel candidate available for multi-modal imaging (Fig. S26†).Conclusions
We have successfully achieved the isolation of hollow carbon nanospheres embedded with stoichiometric γ-Fe2O3 and GdPO4 (Fe–Gd/HCS). Given its well-defined structure with tunable nanospherical size, our in vitro evaluation revealed that Fe–Gd/HCS could be internalized. And the cellular uptake amount is inversely proportional to the particle size. Despite the size-dependent endocytosis, there was no significant size-dependent cytotoxicity, revealing that the extracellular Fe–Gd/HCS could be intracellularly transported and degraded at the tested level. Furthermore, in vivo MRI studies demonstrated that Fe–Gd/HCS can distinguish the liver from other tissues, in which the smallest particle size was superior to Fe–Gd/HCS-M and Fe–Gd/HCS-L due to the size effect in our study. Our proof-of-principle studies using Fe–Gd/HCS as the theranostic agent preliminarily presented its capability for potential multi-modal imaging and therapy.Experimental section
Materials and characterization
Sample preparation
![[thin space (1/6-em)]](https://www.rsc.org/images/entities/char_2009.gif) :
:![[thin space (1/6-em)]](https://www.rsc.org/images/entities/char_2009.gif) 1 propylene oxide
1 propylene oxide![[thin space (1/6-em)]](https://www.rsc.org/images/entities/char_2009.gif) :
:![[thin space (1/6-em)]](https://www.rsc.org/images/entities/char_2009.gif) resin for 2 h. The cells were infiltrated in resin at 70 °C for 24 h and ultramicrotomy was conducted. Then, the samples were observed with a TEM at 80 kV.
resin for 2 h. The cells were infiltrated in resin at 70 °C for 24 h and ultramicrotomy was conducted. Then, the samples were observed with a TEM at 80 kV.
| Viability (%) = [Abs(sample) − Abs(blank)]/[Abs(control) − Abs(blank)] × 100% | (1) |
Following the same procedure, the cell viability of Fe–Gd/HCS on HepG2 cells and MCF-7 cells was also evaluated. Herein, the two cells were co-cultured with 5, 10, 20, 40, and 80 μg mL−1 of Fe–Gd/HCS (Fe–Gd/HCS-S, Fe–Gd/HCS-M and Fe–Gd/HCS-L), respectively.
| LCDOX (%) = (WDOX/Wsample) × 100% | (2) |
| RP = Wrelease DOX/WDOX × 100% | (3) |
![[thin space (1/6-em)]](https://www.rsc.org/images/entities/char_2009.gif) 000 ms and TI = 20, 40, 80, 160, 320, 640, 1280, and 2560 ms. T2-weighted MR images were acquired using a Car–Purcell–Meiboom–Gill sequence (CPMG) with the following parameters: TR/TE = 10
000 ms and TI = 20, 40, 80, 160, 320, 640, 1280, and 2560 ms. T2-weighted MR images were acquired using a Car–Purcell–Meiboom–Gill sequence (CPMG) with the following parameters: TR/TE = 10![[thin space (1/6-em)]](https://www.rsc.org/images/entities/char_2009.gif) 000, TE = 12, 24, 48, 96, 192, 382 ms. The specific relaxivity values of r1 and r2 were calculated through the curve fitting of 1/T1 and 1/T2 (s−1) versus the concentration of the composite (mmol L−1).
000, TE = 12, 24, 48, 96, 192, 382 ms. The specific relaxivity values of r1 and r2 were calculated through the curve fitting of 1/T1 and 1/T2 (s−1) versus the concentration of the composite (mmol L−1).
The signal-to-noise ratio (SNR) was calculated according to the equation: liver signal-to-noise ratio SNRliver = SIliver/SDnoise (where SI stands for signal intensity and SD stands for standard deviation) and the average relative liver signal intensities of mice (SNRpost/SNRpre) are plotted at different time points (pre, 0.25, 1, 4 and 24 h).
All mice were euthanized after performing MRI. Then the major organs were sectioned into slices and then subjected to standard hematoxylin and eosin (H & E) staining for histological analysis.
When the tumor volume reached 100 mm3, tumor-bearing nude mice were randomly divided into two groups and treated with the following: PBS (control) and DOX@Fe–Gd/HCS-S. Body weights and tumor sizes were recorded every two days for 16 days after the corresponding treatments. The tumor volume was calculated by using eqn (4):
| Volume = (width2 × length)/2 | (4) |
The tumor growth inhibition rate was determined according to formula (5):
| Inhibition (%) = (C − T)/C × 100 | (5) |
The in vitro and in vivo PA imaging ability of Fe–Gd/HCS was measured using a commercial Vevo LAZR PA imaging system with an excitation of 808 nm. A series of PA images at varying time points (pre, 0.25 h, 1 h, 4 h, and 24 h) were acquired.
Ethical approval
All animal procedures were performed in accordance with the Guidelines for Care and Use of Laboratory Animals of Fudan University and approved by the Animal Ethics Committee of Fudan University.Conflicts of interest
There are no conflicts to declare.Acknowledgements
We gratefully acknowledge the financial support from the National Natural Science Foundation of China (No. 21971045) and National Key Technologies R&D Program of China (2017YFA0205103).Notes and references
- J. Zhang and C. M. Li, Chem. Soc. Rev., 2012, 41, 7016–7031 RSC.
- S. M. Kim, M. Jeon, K. W. Kim, J. Park and I. S. Lee, J. Am. Chem. Soc., 2013, 135, 15714–15717 CrossRef CAS PubMed.
- H. Tian, J. H. Zhao, X. Y. Wang, L. Z. Wang, H. Liu, G. X. Wang, J. Huang, J. Liu and G. Q. Lu, Natl. Sci. Rev., 2020, 7, 1647–1655 CrossRef CAS PubMed.
- Z. H. Yu, N. Ji, J. Xiong, X. Y. Li, R. Zhang, L. D. Zhang and X. B. Lu, Angew. Chem., Int. Ed. Engl., 2021, 60, 2–10 CrossRef.
- X. B. Xu, Z. C. Zhang and X. Wang, Adv. Mater., 2015, 27, 5365–5371 CrossRef CAS PubMed.
- W. Zhu, Z. Chen, Y. Pan, R. Y. Dai, Y. Wu, Z. B. Zhuang, D. S. Wang, Q. Peng, C. Chen and Y. D. Li, Adv. Mater., 2019, 31, 1800426 CrossRef PubMed.
- G. D. Moon, J. B. Joo, M. Dahl, H. Jung and Y. Yin, Adv. Funct. Mater., 2014, 24, 848–856 CrossRef CAS.
- S. N. Tiruneh, B. K. Kang, H. W. Choi, S. B. Kwon, M. S. Kim and D. H. Yoon, Small, 2018, 14, 1802933 CrossRef PubMed.
- J. Y. Wang, Y. Cui and D. Wang, Adv. Mater., 2019, 31, 1801993 CrossRef PubMed.
- Y. J. Fang, D. Y. Luan, S. Y. Gao and X. W. D. Lou, Angew. Chem., Int. Ed. Engl., 2021, 60, 2–19 CrossRef.
- K. An and T. Hyeon, Nano Today, 2009, 4, 359–373 CrossRef CAS.
- Y. Chen, P. F. Xu, M. Y. Wu, Q. S. Meng, H. R. Chen, Z. Shu, J. Wang, L. X. Zhang, Y. P. Li and J. L. Shi, Adv. Mater., 2014, 26, 4294–4301 CrossRef CAS PubMed.
- L. S. Lin, J. Song, H. H. Yang and X. Y. Chen, Adv. Mater., 2018, 30, 1704639 CrossRef PubMed.
- J. M. Park, H. E. Choi, D. Kudaibergen, J. H. Kim and K. S. Kim, Front. Chem., 2021, 9, 699284 CrossRef CAS PubMed.
- X. J. Wang, J. Feng, Y. Bai, Q. Zhang and Y. D. Yin, Chem. Rev., 2016, 116, 10983–11060 CrossRef CAS PubMed.
- D. Wang, A. Eychmüller and Y. Sun, ChemNanoMat, 2020, 6, 1419–1420 CrossRef CAS.
- L. M. Wang, Q. Sun, X. Wang, T. Wen, J. J. Yin, P. Y. Wang, R. Bai, X. Q. Zhang, L. H. Zhang, A. H. Lu and C. Y. Chen, J. Am. Chem. Soc., 2015, 137, 1947–1955 CrossRef CAS PubMed.
- P. F. Zhang, Z. A. Qiao and S. Dai, Chem. Commun., 2015, 51, 9246–9256 RSC.
- Y. W. Qiu, D. D. Ding, W. J. Sun, Y. S. Feng, D. D. Huang, S. C. Li, S. S. Meng, Q. L. Zhao, L. J. Xue and H. M. Chen, Nanoscale, 2019, 11, 16351–16361 RSC.
- Y. Z. W. Weng, S. Y. Guan, L. Wang, X. Z. Qu and S. Y. Zhou, J. Mater. Chem. B, 2019, 7, 1920–1925 RSC.
- B. Janic, M. P. Bhuiyan, J. R. Ewing and M. M. Ali, ACS Sens., 2016, 1, 975–978 CrossRef CAS PubMed.
- X. J. Cui, S. X. Xu, X. Y. Wang and C. Y. Chen, Carbon, 2018, 138, 436–450 CrossRef CAS.
- J. B. Strachan, B. P. Dyett, Z. Nasa, C. Valery and C. E. Conn, J. Colloid Interface Sci., 2020, 576, 241–251 CrossRef CAS PubMed.
- D. Chauhan, S. Sri, R. Kumar, A. K. Panda and P. R. Solanki, Nanotechnology, 2021, 32, 355101 CrossRef CAS PubMed.
- N. Hao, L. Li and F. Tang, Int. Mater. Rev., 2016, 62, 57–77 CrossRef.
- Y. N. Yang, M. Jambhrunkar, P. L. Abbaraju, M. H. Yu, M. Zhang and C. Z. Yu, Adv. Healthcare Mater., 2017, 6, 1700466 CrossRef PubMed.
- D. V. Kladko, A. S. Falchevskaya, N. S. Serov and A. Y. Prilepskii, Int. J. Mol. Sci., 2021, 22, 5266 CrossRef PubMed.
- Y. Liu, B. Workalemahu and X. Y. Jiang, Small, 2017, 13, 1701815 CrossRef PubMed.
- T. Lunnoo, J. Assawakhajornsak and T. Puangmali, J. Phys. Chem. C, 2019, 123, 3801–3810 CrossRef CAS.
- C. He, Y. Hu, L. Yin, C. Tang and C. Yin, Biomaterials, 2010, 31, 3657–3666 CrossRef CAS PubMed.
- T. Mizuhara, K. Saha, D. F. Moyano, C. S. Kim, B. Yan, Y. K. Kim and V. M. Rotello, Angew. Chem., Int. Ed. Engl., 2015, 54, 6567–6570 CrossRef CAS PubMed.
- L. Li, W. S. Xi, Q. Su, Y. Li, G. H. Yan, Y. Liu, H. Wang and A. Cao, Small, 2019, 15, 1901687 CrossRef PubMed.
- H. B. Na, I. C. Song and T. Hyeon, Adv. Mater., 2009, 21, 2133–2148 CrossRef CAS.
- D. Ni, W. Bu, E. B. Ehlerding, W. Cai and J. Shi, Chem. Soc. Rev., 2017, 46, 7438–7468 RSC.
- Q. Q. Zhang, P. Y. Wang, Y. Ling, X. M. Li, L. X. Xia, Y. T. Yang, X. F. Liu, F. Zhang and Y. M. Zhou, Adv. Funct. Mater., 2017, 27, 1605313 CrossRef.
- H. Zhang, T. Z. Wu, Y. Chen, Q. Q. Zhang, Z. X. Chen, Y. Ling, Y. Jia, Y. T. Yang, X. F. Liu and Y. M. Zhou, Nanoscale, 2021, 13, 10943–10952 RSC.
- T. A. Zoan, N. P. Kuzmina, S. N. Frolovskaya, A. N. Rykov, N. D. Mitrofanova, S. I. Troyanov, A. P. Pisarevsky, L. I. Martynenko and Y. M. Korenev, J. Alloys Compd., 1995, 225, 396–399 CrossRef CAS.
- E. I. Tolis, M. Helliwell, S. Langley, J. Raftery and R. E. P. Winpenny, Angew. Chem., Int. Ed., 2003, 42, 3804–3808 CrossRef CAS PubMed.
- E. M. Pineda, F. Tuna, Y. Z. Zheng, S. J. Teat, R. E. Winpenny, J. Schnack and E. J. McInnes, Inorg. Chem., 2014, 53, 3032–3038 CrossRef CAS PubMed.
- J. Wang, Y. Yu, K. Lu, M. Yang, Y. Li, X. Zhou and Z. Sun, Int. J. Nanomed., 2017, 12, 809–825 CrossRef CAS PubMed.
- H. L. Zhou, X. Q. Gong, H. Y. Lin, H. M. Chen, D. T. Huang, D. Li, H. Shan and J. H. Gao, J. Mater. Chem. B, 2018, 6, 8127–8136 RSC.
- A. C. Wong and D. W. Wright, Small, 2016, 12, 5592–5600 CrossRef CAS PubMed.
- F. Q. Hu, Q. J. Jia, Y. L. Li and M. Y. Gao, Nanotechnology, 2011, 22, 245604 CrossRef PubMed.
- M. Pernia Leal, S. Rivera-Fernandez, J. M. Franco, D. Pozo, J. M. de la Fuente and M. L. Garcia-Martin, Nanoscale, 2015, 7, 2050–2059 RSC.
- K. M. Tsoi, S. A. MacParland, X. Z. Ma, V. N. Spetzler, J. Echeverri, B. Ouyang, S. M. Fadel, E. A. Sykes, N. Goldaracena, J. M. Kaths, J. B. Conneely, B. A. Alman, M. Selzner, M. A. Ostrowski, O. A. Adeyi, A. Zilman, I. D. McGilvray and W. C. Chan, Nat. Mater., 2016, 15, 1212–1221 CrossRef CAS PubMed.
- T. Guo, Y. Lin, Z. Li, S. Chen, G. M. Huang, H. R. Lin, J. Wang, G. Liu and H. H. Yang, Nanoscale, 2017, 9, 56–61 RSC.
- G. M. Huang, K. L. Zhang, S. Chen, S. H. Li, L. L. Wang, L. P. Wang, R. Liu, J. Gao and H. H. Yang, J. Mater. Chem. B, 2017, 5, 3629–3633 RSC.
- J. Huang, L. H. Bu, K. Chen, Z. Cheng, X. G. Li and X. Y. Chen, ACS Nano, 2010, 4, 7151–7170 CrossRef CAS PubMed.
- Q. Q. Zhang, P. Y. Wang, X. M. Li, Y. T. Yang, X. F. Liu, F. Zhang, Y. Ling and Y. M. Zhou, J. Mater. Chem. B, 2017, 5, 3765–3770 RSC.
Footnotes |
| † Electronic supplementary information (ESI) available. See DOI: 10.1039/d1na00771h |
| ‡ These two authors contributed equally to this work. |
| This journal is © The Royal Society of Chemistry 2022 |

