 Open Access Article
Interface engineering of heterogeneous transition metal chalcogenides for electrocatalytic hydrogen evolution
Ruru
Song
a,
Deyu
Li
a,
Yafeng
Xu
a,
Junfeng
Gao
 b,
Lu
Wang
 *a and
Youyong
Li
 *ac
*ac
aInstitute of Functional Nano & Soft Materials (FUNSOM), Jiangsu Key Laboratory for Carbon-Based Functional Materials & Devices, Soochow University, Suzhou, Jiangsu 215123, China. E-mail: lwang22@suda.edu.cn; yyli@suda.edu.cn
bKey laboratory of Material Modification by Laser, Ion and Electron Beams (Dalian University of Technology), Ministry of Education, Dalian, 116024, China
cMacao Institute of Materials Science and Engineering, Macau University of Science and Technology, Taipa, 999078, Macau SAR, China
First published on 15th December 2021
Abstract
MoS2 and MoSe2 are recognized as promising electrocatalysts for the hydrogen evolution reaction (HER), but the active sites are mainly located on the edge, limiting their electrochemical efficiency. Here we have introduced the 2H-1T′ interface structures in MoSSe and MoS2–MoSe2 heterostructures to enhance the HER activity in the basal planes by using the density functional theory (DFT) calculations. The structural stability and electronic properties of different 2H-1T′ interface structures are investigated and the HER activities are evaluated by using the H adsorption free energy (ΔGH). The H adsorption free energy along the interface boundaries is very close to zero, and the optimal sites for the HER are the S or Se atoms, which are bonded with three Mo atoms and located in the center of a hexagonal ring composed of three Mo atoms and three halogen atoms. Our study provides a different approach to activate the basal planes and efficiently improve the electrochemical HER performance of transition metal dichalcogenide materials.
Introduction
As an alternative energy source for fossil fuels, hydrogen energy has some advantages, i.e., cleanliness, high combustion calorific value, diverse storage and transportation methods, and earth-abundant raw materials for preparation. Among the common industrial production methods of hydrogen, electrocatalytic splitting of water to produce hydrogen is considered as the safest and greenest way.1–3 Noble metals (such as platinum) are usually used as high-efficiency catalysts in the hydrogen evolution reaction (HER),4,5 but their high-cost limits their large-scale application in industry. Therefore, searching for low-cost and high-efficiency electrocatalysts has become an emerging target in the field of hydrogen production.Two-dimensional (2D) nanomaterials have attracted the attention of researchers due to their unique structures and electronic properties.6–8 As a representative of two-dimensional materials, MoS2 has important applications in different fields due to its unique nature. As an electrocatalyst, MoS2 is proved to exhibit advanced catalytic performance for the hydrogen evolution reaction.9–13 However, many studies have shown that the active center of MoS2 for the HER is mainly located at the edge, and its basal plane with a large area is inert,14,15 which greatly limits its application in the field of electrochemical hydrogen production.16 Thus, activating the sites in the basal plane is necessary for MoS2 to improve the HER performance. Some achievements have been successfully made to improve the catalytic activity for the HER, such as defect modulation17–19 and chemical doping.20–22 Introducing phase transition boundaries is also an efficient way to activate the active sites in the basal plane of MoS2. The most stable structure of MoS2 is the 2H phase, while the 1T (1T′) phase of MoS2 is metastable but with more active sites.23 In experiments, the 2H phase could transform into the metallic 1T′ phase through various methods, such as lithium intercalation,24,25 covalent functionalization,26,27 and direct electron injection.28 Our previous theoretical study has shown that the basal plane of MoS2 for the HER could be successfully activated by introducing 2H/1T′structural interfaces.29
2D transition metal dichalcogenide (TMD) materials can be assembled into heterostructures, and many distinctive properties of these heterostructures have been discovered.30,31 Heterostructure materials could be divided into vertical heterostructures and planar heterostructures. Janus MoSSe is a kind of vertical heterostructure, which is successfully synthesized by different methods in the literature.32,33 Theoretical studies have also shown that the introduction of vacancies and grain boundaries could enhance the active sites in the basal plane of the Janus MoSSe surface.34 The planar heterostructures are also reported between MoS2 and MoSe2, which are synthesized by the chemical vapor deposition (CVD) growth method,35 and exhibit distinguished properties with the high surface area, the improved synergistic effect and a narrow bandgap.36 Therefore, in our work, we have systematically investigated the active sites and the underlying catalytic mechanism for the HER in the TMD heterostructures from the first-principles calculations, and we found that the phase interface could activate the active sites in the basal plane and efficiently improve the HER performance of the TMD heterostructures.
Computational details
All the calculations were performed with density functional theory (DFT) using the projector-augmented wave method37 and carried out in the Vienna Ab initio Simulation Package (VASP).38,39 The Perdew–Burke–Ernzerhof (PBE)40 functional of the generalized gradient approximation (GGA)41 was adopted to describe the electron exchange–correlation interactions, and the Grimme's scheme of D3 was used to describe the van der Waals interaction and to account for London dispersion interactions.42,43 The kinetic cutoff energy is set to 450 eV. A vacuum of 15 Å was used to avoid the interactions between layers. The supercell combining 4 × 4 2H-MoSSe and 4 × 4 1T′-MoSSe is constructed as the interface model for vertical heterostructures, while the supercell combining 4 × 4 MoS2 and 4 × 4 MoSe2 is used to represent the interface model for planar heterostructures. The Monkhorst–Pack method was used for sampling the Brillouin zone with sufficiently accurate k-points for different sizes of supercells.44 The lattice constants and atomic positions for all the interface structures were fully relaxed until the force on each atom was under 0.03 eV Å−1.The Gibbs free energy (ΔGH) for H adsorption is obtained by:
| ΔGH = ΔEH + ΔEZPE − TΔS | (1) |
We have considered two structural phases in the heterostructure interface, and the formation energy depends on the chemical potential of the S atom, which is defined as:
| Gf = E2H−1T′ + Δm × μs − E2H | (2) |
The formation energy is contributed by two parts: (i) the formation energy of two different boundaries (γb1,γb2) formed in heterostructures, and (ii) energy difference between 2H and inserted 1T′ phases. Therefore, Gf can also be written as:
| Gf = γb1 + γb2 + ΔE1T′-2H × n | (3) |
Results and discussion
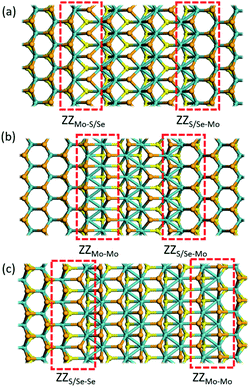
2H-1T′ interface structures of MoSSe
According to the previous study,29 the 2H/1T′ interface structures of TMD materials along the zigzag (ZZ) direction are more stable than those along the armchair direction. So here we only considered the zigzag interface structures formed between 2H and 1T′ phases of MoSSe. It should be noted that there are three typical models that we have considered, and each heterostructure contains two different interface structures, as shown in Fig. 1. The name of our interface structures is defined by the different atomic species (S, Se or Mo) terminated at the ZZ edge from the 2H or 1T′ phase. For example, the ZZMo-S/Se interface is formed by the Mo atoms from the 2H phase bonded to the S/Se atoms from the 1T′ phase, and the ZZMo-Mo interface is formed between the Mo-terminated 2H phase and the Mo-terminated 1T′ phase. To balance the computational expenses and the necessary separation of 2H and 1T′ phases, we choose the widths of the 1T′ phase in ZZMo-S/Se–ZZS/Se-Mo, ZZMo-Mo–ZZS/Se-Mo and ZZS/Se-Se–ZZMo-Mo interface structures as 17.4 Å, 16.3 Å and 21.8 Å, respectively, which are large enough to provide the remarkable interface boundaries. To compare the relative structural stability, we define the formation energy for these heterostructures, which is described in detail in the computational method. The definition of formation energies has the limitation that we could only obtain the stability of each heterostructure instead of each interface boundary, because each heterostructure contains two different interface boundaries. The formation energies of three MoSSe heterostructures are 2.554 eV, 3.032 eV and 6.675 eV, respectively. Among them, the ZZMo-Mo–ZZS/Se-Mo interface structure containing two boundaries of ZZMo-Mo and ZZS/Se-Mo is the most stable. The ZZS/Se-Se–ZZMo-Mo interface structure exhibits the highest formation energy with the same species bonded with each other at the interface boundaries.It is also critical to understand the electronic properties of 2H-1T′ MoSSe structures for their further applications. The band structures and density of states (DOS) of 2H-1T′ MoSSe heterostructures are plotted in Fig. 2, together with the 2H-MoSSe structure. 2H-MoSSe is a direct semiconductor with a band gap of 1.64 eV. By introducing the interface boundaries, all the three 2H/1T′ MoSSe structures become metallic with the new states emerging around the Fermi level. The DOS further proves this and the new states are mostly contributed from Mo atoms. The conductivity of 2H/1T′ MoSSe structures is greatly enhanced, which facilitates the further electrochemical application.
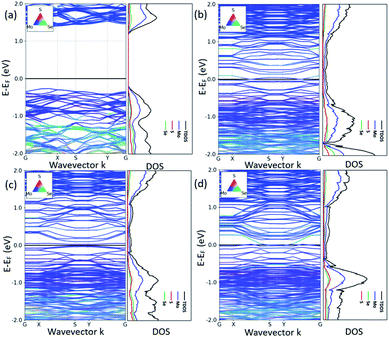 | ||
| Fig. 2 Band structures and density of states of 2H-1T′ MoSSe heterostructures, together with the 2H-MoSSe structure. The black line indicates the Fermi level. | ||
2H-1T′ interface structures between MoS2 and MoSe2
Besides the 2H-1T′ interface existing in MoSSe, we also considered the 2H-1T′ interface structures for planar heterostructures between MoS2 and MoSe2. We have constructed six different interface structures, as shown in Fig. 3. The interface structures formed by 2H-MoS2 and 1T′-MoSe2 are shown in Fig. 3a–c, while those formed between 1T′-MoS2 and 2H-MoSe2 are shown in Fig. 3d–f. The definition of their names is the same as that of 2H-1T′ MoSSe interfaces.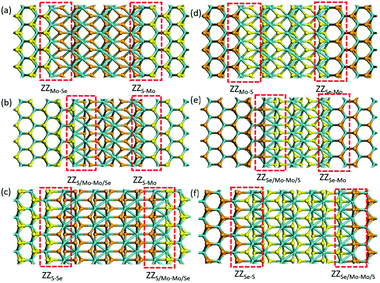 | ||
| Fig. 3 Optimized structures of 2H-1T′ interfaces between MoS2 and MoSe2. The cyan, yellow and orange balls represent Mo, S and Se atoms, respectively. | ||
We have also compared the formation energies for these 2H-1T′ interface structures between MoS2 and MoSe2. With the same geometrical structure, the interface boundaries formed between 2H-MoS2 and 1T′-MoSe2 are all more energetically favorable than those formed between 2H-MoSe2 and 1T′-MoS2. Among them, the ZZMo-Se–ZZS-Mo interface structure containing two boundaries of ZZMo-Se and ZZS-Mo is the most stable with the lowest formation energy of 2.571 eV. The formation energies for the structures shown in Fig. 3b and c are 3.301 and 6.897 eV, respectively. The interface structures formed between 2H-MoSe2 and 1T′-MoS2 are relatively less stable with the formation energies of 5.235, 7.759 and 8.132 eV, respectively, corresponding to the structures shown in Fig. 3d–f. Similar to the electronic properties of 2H-1T′ MoSSe structures, the interface structures of planar heterostructures formed between MoS2 and MoSe2 also exhibit metallic properties, and the plot of density of states is displayed in Fig. 4. The density of states has shown that the Mo atoms are directly bonded with both S and Se atoms, and some electron states emerge around the Fermi level, which are dominated by the Mo atoms.
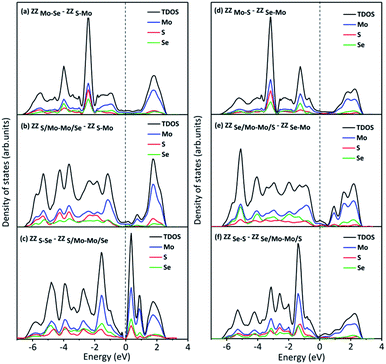 | ||
| Fig. 4 Density of states of 2H-1T′ interface structures formed between MoS2 and MoSe2, which corresponds to the structures shown in Fig. 3. The dashed line indicates the Fermi level. | ||
HER activity
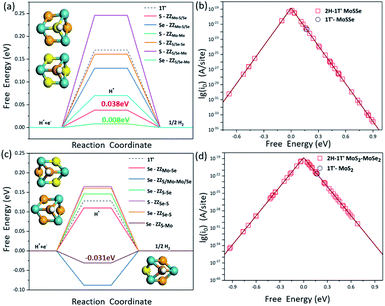
It is known that the HER is an electrochemical process involving multiple steps. In order to obtain the maximum reaction rate, the Gibbs free energy of H* adsorption (ΔGH) on the catalyst surface should be close to zero, so here we employ the ΔGH to evaluate the HER activity on these interface structures. The more negative the ΔGH value is, the stronger the H atom adsorption on the catalyst, making it difficult to separate out, while the more positive ΔGH values indicate that the H atom is difficult to adsorb. We have systematically screened all the possible adsorption sites of H atoms on the 2H-1T′ interface structures that we have considered here. The H adsorption on the pristine 2H-MoSSe, 2H-MoS2 and 2H-MoSe2 is very weak with the ΔGH values of 1.754 eV, 1.873 eV and 1.990 eV, respectively, indicating a very poor HER performance on the basal plane. By introducing the interface boundaries, the ΔGH values for the adsorption sites along the interface boundaries are very close to zero, which is shown in Fig. 5a and c.Different from the previous studies on pristine MoSSe and MoS2, whose active sites are the Mo sites at the edge, H prefers to bind to the S or Se atoms located at the 2H-1T′ interfaces. For the 2H-1T′ MoSSe interface, there are optimal sites for H adsorption on ZZMo-Mo, ZZMo-S/Se, ZZS/Se-Mo and ZZS/Se-Se boundaries, which are comparable or even better than those of the vacancies and grain boundaries of the 2H-MoSSe surface. It is worth noting that the ΔGH values for H adsorbed on S sites of ZZMo-Mo and ZZMo-S/Se, and Se sites of ZZS/Se-Mo are 0.008 eV, 0.038 eV and 0.07 eV, respectively, which are very close to zero, indicating the high HER performance of the basal plane. For the 2H-1T′ MoS2–MoSe2 interfaces, there are also some optimal sites with the similar configurations. For example, the ΔGH on Se sites of ZZS-Mo and ZZS/Mo-Mo/Se can reach −0.031 eV and −0.088 eV, respectively, which are the superior active sites in the basal plane for the HER. The optimal active sites exhibit similar geometries, as shown in Fig. 5. The optimal S or Se sites are mostly bonded with three Mo atoms and located in the center of a hexagonal ring composed of three Mo atoms and three S or Se atoms, providing the guideline to design the promising HER electrocatalysts in the future.
The volcano curve is also plotted to further describe the HER performance, and the theoretical exchange current densities (i0) are calculated by using the obtained ΔGH results. According to Norskov's assumption,45i0 can be expressed as:
when ΔGH ≤0,
| i0 = −ek0{1/[1 + exp(ΔGH/kT)]} | (4) |
| i0 = −ek0{1/[1 + exp(−ΔGH/kT)]} | (5) |
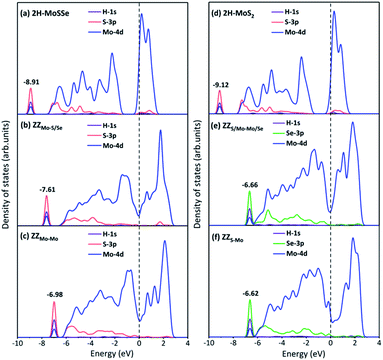
To explore the underneath reaction mechanism, we have investigated electronic properties of active sites on interface structures with H adsorption. Fig. 6 depicts the projected density of states (PDOS) of the adsorbed H atom, the S or Se atoms bonded with the adsorbed H atom, and three Mo atoms adjacent to the S or Se atoms on pristine 2H-MoSSe and 2H-MoS2, ZZMo-S/Se and ZZMo-Mo boundaries in the 2H-1T′ MoSSe interface, and ZZS/Mo-Mo/Se and ZZS-Mo boundaries in the 2H-1T′ MoS2-MoSe2 interface. When H is adsorbed on 2H-MoSSe, the hybridization peak between 1s H and 3p S is located at an energy level of −8.910 eV with a larger positive adsorption free energy of 1.750 eV, which is a very weak interaction between the H atom and substrate. By introducing the 2H-1T′ interface boundaries, the H adsorption is greatly enhanced, and the hybridization between 1s H and 3p S moves close to the Fermi level. For example, the hybridization peak is located at −7.610 eV and −6.980 eV for ZZMo-S/Se and ZZMo-Mo in 2H-1T′ MoSSe interfaces, which correspond to the enhanced H adsorption free energies of 0.038 eV and 0.008 eV, respectively. Similar electronic properties are observed in 2H-1T′ MoS2–MoSe2 interfaces, as shown in Fig. 6d–f. For 2H-MoS2, the hybridization peak is located at −9.120 eV with a H adsorption free energy of 1.872 eV. By introducing the 2H-1T′ MoS2–MoSe2 interface, the hybridization peaks also shift to the high energy levels of −6.660 eV and −6.620 eV for ZZS/Mo-Mo/Se and ZZS-Mo boundaries, respectively, corresponding to the H adsorption free energies of 0.088 eV and 0.040 eV. Therefore, our results have demonstrated that the interface structures could efficiently activate the basal plane of TMD materials and provide abundant active sites in the basal plane for electrocatalytic hydrogen evolution.
Conclusions
In summary, we have investigated the structural and electrocatalytic properties of 2H-1T′ interface boundaries in MoSSe and MoS2–MoSe2 heterostructures by using the DFT calculations. The structural stability is compared by using the formation energies, and the ZZMo-Mo–ZZS/Se-Mo interface structure containing two boundaries of ZZMo-Mo and ZZS/Se-Mo is the most stable. All the interface structures are metallic with high electronic conductivity. To evaluate the HER activity, we have calculated the H adsorption free energies on all the possible sites of these interface structures. The optimal sites with the H adsorption free energies very close to zero are the S or Se sites instead of Mo sites, which are bonded with three Mo atoms and located in the center of a hexagonal ring composed of three Mo atoms and three halogen atoms. The 2H-1T′ interfaces provide more active sites in the basal plane for electrocatalytic hydrogen evolution and exhibit relatively high exchange current density.Conflicts of interest
There are no conflicts to declare.Acknowledgements
This work was supported by the National Key Research and Development Program of China (Grant nos 2018YFB0703900), the National Natural Science Foundation of China (Grant no 21973067), and Science and Technology Project of Jiangsu Province (Grant no BZ2020011). The calculations were carried out at National Supercomputer Center in Tianjin, and the calculations were performed on TianHe-1 (A). This project was also supported by Collaborative Innovation Center of Suzhou Nano Science & Technology, the 111 Project, Joint International Research Laboratory of Carbon-Based Functional Materials and Devices, and Jiangsu Key Laboratory for Carbon-Based Functional Materials & Devices.References
- J. A. Turner, Science, 2004, 305, 972–974 CrossRef CAS PubMed.
- X. Cheng, Z. Shi, N. Glass, L. Zhang, J. Zhang, D. Song, Z.-S. Liu, H. Wang and J. Shen, J. Power Sources, 2007, 165, 739–756 CrossRef CAS.
- I. Dincer, Int. J. Energy Res., 2007, 31, 29–55 CrossRef CAS.
- S. Trasatti, J. Electroanal. Chem. Interfacial Electrochem., 1972, 39, 163–184 CrossRef CAS.
- S. Ye, F. Luo, Q. Zhang, P. Zhang, T. Xu, Q. Wang, D. He, L. Guo, Y. Zhang and C. He, Energy Environ. Sci., 2019, 12, 1000–1007 RSC.
- D. Voiry, M. Salehi, R. Silva, T. Fujita, M. Chen, T. Asefa, V. B. Shenoy, G. Eda and M. Chhowalla, Nano Lett., 2013, 13, 6222–6227 CrossRef CAS PubMed.
- C. J. Rupp, S. Chakraborty, J. Anversa, R. J. Baierle and R. Ahuja, ACS Appl. Mater. Interfaces, 2016, 8, 1536–1544 CrossRef CAS PubMed.
- J. Mei, T. Liao, L. Kou and Z. Sun, Adv. Mater., 2017, 29, 1700176 CrossRef PubMed.
- Y. Li, H. Wang, L. Xie, Y. Liang, G. Hong and H. Dai, J. Am. Chem. Soc., 2011, 133, 7296–7299 CrossRef CAS PubMed.
- B. Hinnemann, P. G. Moses, J. Bonde, K. P. Jørgensen, J. H. Nielsen, S. Horch, I. Chorkendorff and J. K. Nørskov, J. Am. Chem. Soc., 2005, 127, 5308–5309 CrossRef CAS PubMed.
- H. I. Karunadasa, E. Montalvo, Y. Sun, M. Majda, J. R. Long and C. J. Chang, Science, 2012, 335, 698–702 CrossRef CAS PubMed.
- Q. Ding, B. Song, P. Xu and S. Jin, Chem, 2016, 1, 699–726 CAS.
- T. F. Jaramillo, K. P. Jørgensen, J. Bonde, J. H. Nielsen, S. Horch and I. Chorkendorff, Science, 2007, 317, 100–102 CrossRef CAS PubMed.
- J. Kibsgaard, Z. Chen, B. N. Reinecke and T. F. Jaramillo, Nat. Mater., 2012, 11, 963–969 CrossRef CAS PubMed.
- G. Ye, Y. Gong, J. Lin, B. Li, Y. He, S. T. Pantelides, W. Zhou, R. Vajtai and P. M. Ajayan, Nano Lett., 2016, 16, 1097–1103 CrossRef CAS PubMed.
- M. Bollinger, J. Lauritsen, K. W. Jacobsen, J. K. Nørskov, S. Helveg and F. Besenbacher, Phys. Rev. Lett., 2001, 87, 196803 CrossRef CAS PubMed.
- J. Xie, H. Zhang, S. Li, R. Wang, X. Sun, M. Zhou, J. Zhou, X. W. Lou and Y. Xie, Adv. Mater., 2013, 25, 5807–5813 CrossRef CAS PubMed.
- H. Shu, D. Zhou, F. Li, D. Cao and X. Chen, ACS Appl. Mater. Interfaces, 2017, 9, 42688–42698 CrossRef CAS PubMed.
- Y. Ouyang, C. Ling, Q. Chen, Z. Wang, L. Shi and J. Wang, Chem. Mater., 2016, 28, 4390–4396 CrossRef CAS.
- J. V. Lauritsen, J. Kibsgaard, G. H. Olesen, P. G. Moses, B. Hinnemann, S. Helveg, J. K. Nørskov, B. S. Clausen, H. Topsøe and E. Lægsgaard, J. Catal., 2007, 249, 220–233 CrossRef CAS.
- J. Deng, H. Li, J. Xiao, Y. Tu, D. Deng, H. Yang, H. Tian, J. Li, P. Ren and X. Bao, Energy Environ. Sci., 2015, 8, 1594–1601 RSC.
- P. Liu, J. Zhu, J. Zhang, P. Xi, K. Tao, D. Gao and D. Xue, ACS Energy Lett., 2017, 2, 745–752 CrossRef CAS.
- L. Cai, W. Cheng, T. Yao, Y. Huang, F. Tang, Q. Liu, W. Liu, Z. Sun, F. Hu and Y. Jiang, J. Phys. Chem. C, 2017, 121, 15071–15077 CrossRef CAS.
- G. Eda, H. Yamaguchi, D. Voiry, T. Fujita, M. Chen and M. Chhowalla, Nano Lett., 2011, 11, 5111–5116 CrossRef CAS PubMed.
- L. Wang, Z. Xu, W. Wang and X. Bai, J. Am. Chem. Soc., 2014, 136, 6693–6697 CrossRef CAS PubMed.
- D. Voiry, A. Goswami, R. Kappera, C. d. C. C. e Silva, D. Kaplan, T. Fujita, M. Chen, T. Asefa and M. Chhowalla, Nat. Chem., 2015, 7, 45–49 CrossRef CAS PubMed.
- Q. Tang and D.-e. Jiang, Chem. Mater., 2015, 27, 3743–3748 CrossRef CAS.
- Y. Kang, S. Najmaei, Z. Liu, Y. Bao, Y. Wang, X. Zhu, N. J. Halas, P. Nordlander, P. M. Ajayan and J. Lou, Adv. Mater., 2014, 26, 6467–6471 CrossRef CAS PubMed.
- N. Zhao, L. Wang, Z. Zhang and Y. Li, ACS Appl. Mater. Interfaces, 2019, 11, 42014–42020 CrossRef CAS PubMed.
- D. Er, H. Ye, N. C. Frey, H. Kumar, J. Lou and V. B. Shenoy, Nano Lett., 2018, 18, 3943–3949 CrossRef CAS PubMed.
- H. Cai, Y. Guo, H. Gao and W. Guo, Nano Energy, 2019, 56, 33–39 CrossRef CAS.
- A.-Y. Lu, H. Zhu, J. Xiao, C.-P. Chuu, Y. Han, M.-H. Chiu, C.-C. Cheng, C.-W. Yang, K.-H. Wei and Y. Yang, Nat. Nanotechnol., 2017, 12, 744–749 CrossRef CAS PubMed.
- J. Zhang, S. Jia, I. Kholmanov, L. Dong, D. Er, W. Chen, H. Guo, Z. Jin, V. B. Shenoy and L. Shi, ACS Nano, 2017, 11, 8192–8198 CrossRef CAS PubMed.
- W. Shi, G. Li and Z. Wang, J. Phys. Chem. C, 2019, 123, 12261–12267 CrossRef CAS.
- A. Arora, P. K. Nayak, S. Bhattacharyya, N. Maity, A. K. Singh, A. Krishnan and M. R. Rao, Phys. Rev. B, 2021, 103, 205406 CrossRef CAS.
- D. Monga and S. Basu, RSC Adv., 2021, 11, 22585–22597 RSC.
- P. E. Blöchl, Phys. Rev. B, 1994, 50, 17953 CrossRef PubMed.
- G. Kresse and J. Furthmüller, Comput. Mater. Sci., 1996, 6, 15–50 CrossRef CAS.
- G. Kresse and J. Furthmüller, Phys. Rev. B, 1996, 54, 11169 CrossRef CAS PubMed.
- J. P. Perdew, M. Ernzerhof and K. Burke, J. Chem. Phys., 1996, 105, 9982–9985 CrossRef CAS.
- J. P. Perdew, K. Burke and M. Ernzerhof, Phys. Rev. Lett., 1996, 77, 3865 CrossRef CAS PubMed.
- S. Grimme, J. Antony, S. Ehrlich and H. Krieg, J. Chem. Phys., 2010, 132, 154104 CrossRef PubMed.
- S. Grimme, S. Ehrlich and L. Goerigk, J. Comput. Chem., 2011, 32, 1456–1465 CrossRef CAS PubMed.
- D. Chadi, Phys. Rev. B, 1977, 16, 1746 CrossRef.
- J. K. Nørskov, T. Bligaard, A. Logadottir, J. Kitchin, J. G. Chen, S. Pandelov and U. Stimming, J. Electrochem. Soc., 2005, 152, J23 CrossRef.
| This journal is © The Royal Society of Chemistry 2022 |

