DOI:
10.1039/D2MH00462C
(Communication)
Mater. Horiz., 2022,
9, 2384-2392
The impacts of molecular adsorption on antiferromagnetic MnPS3 monolayers: enhanced magnetic anisotropy and intralayer Dzyaloshinskii–Moriya interaction†
Received
14th April 2022
, Accepted 17th June 2022
First published on 22nd June 2022
Abstract
In two-dimensional (2D) magnetic systems, significant magnetic anisotropy is required to protect magnetic ordering against thermal fluctuation. In this paper, we explored the effect of molecular adsorption on the magnetic anisotropy and intralayer Dzyaloshinskii–Moriya interaction (DMI) of monolayer MnPS3, combining the first-principles calculation and theoretical analysis. We find that molecular adsorption can break the spatial inversion symmetry in a 2D magnet, and results in a significant DMI, which is rare in pristine 2D magnets. For example, in an MPS–NO system, the magnitude of the asymmetric DMI vector increases 9 times, and the magnetocrystalline anisotropy increases 600 times compared with the pristine MPS monolayer. It is found the DMI mainly comes from the structural deformation after adsorption, whereas the increase of magnetocrystalline anisotropy mainly originates from a new ‘bridge’ super-exchange interaction between Mn ions and NO gas molecules. The calculated Mn–NO–Mn ‘bridge’ super-exchange coupling strength is much higher than the Mn–S–Mn coupling strength. Our findings offer a new strategy to increase the magnetic anisotropy and induce chiral magnetic structures in 2D magnets.
New concepts
In two-dimensional (2D) magnetic materials, the sizable magnetic anisotropy is a key factor in resisting thermal fluctuations and protecting long-range magnetic ordering, while the antisymmetric exchange interaction, Dzyaloshinskii–Moriya interaction (DMI), is a prerequisite to generate chiral magnetic structures, such as chiral domain walls, helical spins, and skyrmions. However, significant DMI is rare in pristine 2D magnetic materials. In this paper, molecular adsorption is employed to enhance the magnetic anisotropy and induce DMI in antiferromagnetic MnPS3 monolayers. In the MnPS3–NO system, the magnitude of the asymmetric DMI vector increases 9 times, and the magnetocrystalline anisotropy increases 600 times as compared with the pristine MnPS3 monolayer. Combining the first-principles calculations and theoretical analysis, we find that the induced DMI mainly comes from the structural deformation after adsorption, whereas the increase of magnetocrystalline anisotropy mainly originates from a new ‘bridge’ super-exchange interaction between Mn ions and NO gas molecules. This study not only demonstrates the effect of molecular adsorption on inducing the intralayer DMI in centrosymmetric structures, but also provides an insightful understanding of the mechanism of super-exchange interaction between gas molecules and 2D magnets.
|
1. Introduction
In the past decades, magnetic materials have received substantial attention for their wide application in data storage,1,2 energy harvesting,3,4 biomedicine5 and water purification.6 In 1966, the Mermin–Wagner theorem suggested that long-range ferromagnetic or antiferromagnetic ordering is extremely rare in two-dimensional (2D) materials at non-zero temperature because of thermal fluctuations.7 In magnetic materials, thermal fluctuation may destroy the ordered arrangement of spins (ferromagnetism or antiferromagnetism), resulting in a paramagnetic state. The discovery of long-range ferromagnetic ordering in few-layer CrGeTe38 and CrI39 in 2017 has stimulated a large number of theoretical and experimental efforts in studying the properties and applications of a diverse library of 2D magnets. Now it is widely accepted that the magnetic anisotropy energy (MAE) is one possibility to resist thermal fluctuation. The existence of magnetic anisotropy can reduce the total energy of the system and result in the presence of a spin-wave excitation gap. Overall, the magnetic anisotropy can make the spin orientation more stable, which improves the stability of magnetic ordering to withstand thermal fluctuations.8,10 Thus, the magnetic anisotropy is a key factor in protecting the long-range magnetic ordering in 2D materials.11,12 Furthermore, the successful synthesis of 2D magnets provides a promising platform to study the Dzyaloshinskii–Moriya interaction (DMI).13–15 DMI, an antisymmetric exchange interaction between two magnetic atoms within one surface layer,16,17 originates from spin–orbit coupling (SOC) and competes with the perpendicular magnetic anisotropy and the Heisenberg exchange coupling to generate chiral magnetic structures like chiral domain walls, helical spins, and skyrmions.18–20 These chiral magnetic structures possess great application potential in next-generation memory devices.21
Unfortunately, the Curie/Néel temperature of 2D magnets is always much lower than room temperature, such as ∼60 K for CrGeTe3,8 ∼45 K for CrI3,9 and ∼130 K for Fe3GeTe2.22 Consequently, the effects of thickness,23 strain,24,25 charge doping,26–29 atomic doping,30,31 intercalation,32–34 and surface functionalization35–39 on the Curie/Néel temperature of 2D magnetic materials were widely explored. For instance, the Curie temperature of Fe3GeTe2 can be increased from 180 K to 210 K under 0.65% stretch strain.40 Meanwhile, non-magnetic hexagonal boron nitride was functionalized with fluorine atoms, accounting for room-temperature ferromagnetism.36 He et al.41 found that the Curie temperature of CrGeTe3 can be enhanced from ∼61 K to 81 K via NO2 molecular adsorption. Besides, Wang et al.42 found that molecular adsorption could also strengthen the magnon–phonon scattering significantly. However, the influence of these strategies on magnetic anisotropy and DMI, indispensable prerequisites for long-range magnetic ordering11,12 and chiral spin texture in 2D magnets,43–46 has been rarely studied. Although Ni et al.47 detected a strain-dependent magnetic anisotropy in the in-plane direction of few-layer MnPSe3 using the second-harmonic generation, while several studies reported the generation and manipulation of intralayer DMI in 2D magnets by strain48,49 and defects,50 and the effect of molecular adsorption is still unclear.
In this paper, density functional theory (DFT) calculations are used to investigate the magnetic anisotropy and DMI of an antiferromagnet MnPS3 (MPS) monolayer, and the impacts of molecular adsorption are explored. 2D MPS has been synthesized in experiments, and also been demonstrated as an excellent adsorbent for NO2 gas.51,52 We find a new magnetic coupling induced by magnetic molecule adsorption according to the covalency, which has impressive impacts on the isotropic magnetic exchange coupling and the magnetocrystalline anisotropy of the MPS monolayer. Besides, we also observe significant intralayer DMI in the MPS monolayer with molecular adsorption. These findings offer a new insight to understand the influence of molecular adsorption on the magnetic properties of 2D materials.
2. Computational methods
For all DFT calculations, we employed the Vienna ab initio Simulation Package (VASP)53,54 with the projected augmented wave (PAW) method and a cut-off energy of 550 eV. Meantime, the Perdew–Burke–Ernzerhof (PBE) of general gradient approximation (GGA)55,56 with the Hubbard ‘U’57 was chosen as the exchange-correlation functional. It has been proved that when the effective ‘U’ value is 5 eV, the electronic bandgap of MPS is predicted as 2.40 eV,58 which is close to the experimental result (2.96 eV).59 The same ‘U’ value is also adopted in previous theoretical calculations by other authors.60,61 So in this work, the ‘U’ value is set as 5 eV. To suppress the non-physical interaction between the MPS monolayer and its adjacent imaging layer, a 20 Å vacuum space was imposed along the c-axis in all models, and the adsorption models were built based on a 2 × 2 × 1 supercell. The MPS monolayer was relaxed until the energy and the Hellmann–Feynman force converged to 10−8 eV and 0.001 eV Å−1, while adsorption models were optimized until the energy converged to 10−6 eV. Monkhorst–Pack (MP) grids of 9 × 9 × 1 and 13 × 13 × 1 were used to sample the Brillouin zone in structure optimization and the self-consistent calculation, respectively. SOC is considered for the non-collinear calculation of the MPS monolayer with and without molecular adsorption. For the adsorption models, the van der Waals (vdW) interaction between the MPS monolayer and gas molecules was calculated at the DFT+D3 level.62
3. Results and discussion
3.1 Geometric structure and energy of the MPS-molecule system
MPS monolayers are exfoliated from the bulk, and the top view of the 2 × 2 × 1 supercell is shown in Fig. 1a. The lattice parameters of the optimized MPS are a = b = 6.05 Å, slightly larger than the experimental result (5.88 Å)63 but consistent with previous theoretical results.64,65 In each unit cell, there are two Mn atoms, six S atoms, and two P atoms. Obviously, every Mn atom is surrounded by six S atoms centrosymmetrically, while these S atoms connect to two P atoms forming five sublayers as shown in Fig. 1b. For clear illustration, the top and side views of MPS after deleting the repeated atoms are presented in Fig. 1c and d. In Fig. 1c, the smallest bridge between Mn pairs is up to 3.493 Å, while that between S and P pairs is 3.529 Å and 6.050 Å, respectively. These distances are so large that the bridge sites can be neglected in molecular adsorption. Therefore, we choose three adsorption sites including the top sites on Mn, S and P atoms as initial sites for gas molecular adsorption, which are remarked by square, triangle, and rhombus in Fig. 1c. It is noted that the gas molecules would move in a small range during geometry relaxation, resulting in a slight deviation from the initial adsorption site. To identify the most stable adsorption site, adsorption energy is defined as the energy difference between the MPS-molecule system, the isolated MPS and gas molecule, as shown in eqn (1).66,67| | | EAd = EMPS–Gas − (EMPS + EGas) | (1) |
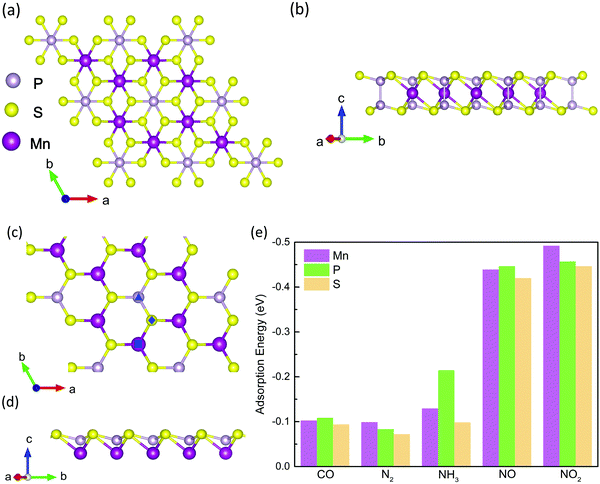 |
| | Fig. 1 Top (a) and side (b) views of the MnPS3 (MPS). (c and d) are the top and side views of MPS after removing the P and S atoms in the bottom layers for clean view. (e) The adsorption energy of the MPS-molecule system. In (c), the square, triangle, and rhombus represent the possible initial adsorption site for the top Mn, top P and top S sites, respectively. | |
The calculated results are shown in Fig. 1e and Table S1 (ESI†). As is well-known, the lowest adsorption energy corresponds to the most stable adsorption configuration. Thus, it can be concluded that the most stable adsorption site for CO, NH3, and NO is around the P atom, while that for N2 and NO2 is near the Mn atom, based on the obtained EAd results. Besides, the perpendicular orientation of CO, NH3, NO and NO2 molecules is also tested, as shown in Fig. S1 (see the ESI†). We find that the MPS–CO, MPS–NH3, and MPS–NO systems with C/N atom pointing to the surface of the MPS substrate are more stable, while the O atom pointing toward the top surface of MPS is preferred for the MPS–NO2 system. The adsorption energies for NO and NO2 are up to −0.446 meV and −0.492 meV indicating strong binding, comparable to the values of NO and NO2 absorbed on black phosphorus.68 The different views of the stable adsorption system are presented in Fig. 2, where the vertical distance from the bottom of the molecule to the top surface of the MPS monolayer (black dotted line) is represented by ‘d’. The smallest ‘d’ of 2.578 Å occurs in the MPS–NH3 system, while the largest ‘d’ is 3.145 Å in the MPS–N2 system. In the following section, we would explore the magnetic properties of these adsorption systems based on the stable structure presented in Fig. 2, especially the magnetic anisotropy and DMI.
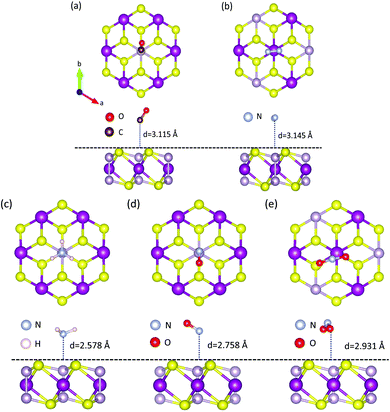 |
| | Fig. 2 Geometric structure of MPS–CO (a), MPS–N2 (b), MPS–NH3 (c), MPS–NO (d) and MPS–NO2 (e). The distance between the bottom of the molecule and the top surface of MPS is defined as ‘d’. | |
3.2 Magnetic properties of the MPS-molecule system
First, the magnetic ground state of the MPS monolayer is determined by its energies with four possible magnetic configurations including ferromagnetic (FM), Néel-antiferromagnetic (Néel-AFM), zigzag-AFM, and stripy-AFM. The diagram of these four magnetic configurations are shown in Fig. S2 (ESI†) where the red and blue balls represent Mn atoms with spin-up and spin-down states, respectively. Based on the DFT calculations, we find that the Néel-AFM phase with the lowest energy thus is the magnetic ground state of the MPS monolayer. To identify the magnetic ground state, the spin density distribution of MPS is presented in Fig. 3a where the spin up and spin down states are represented by the orange and cyan isosurface, respectively. It can be observed that the magnetism of MPS mainly arises from Mn and S atoms, not the P atom. Furthermore, the magnetic moments on two Mn atoms in each unit cell ally in anti-parallel, agreeing well with the magnetic ground state determined by energy.
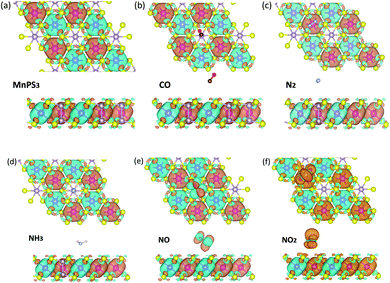 |
| | Fig. 3 Spin density distribution of MPS (a), MPS–CO (b), MPS–N2 (c), MPS–NH3 (d), MPS–NO (e), and MPS–NO2 (f) systems. The orange and cyan isosurfaces represent the spin up and spin down states which are separated by ±0.001 e Å3, respectively. | |
According to local spin density approximation calculations, the magnetic moment on Mn is ∼4.2 μB, which is smaller than the ideal value of 5 μB. Here, the altitude of spin vector S (S) is gained using eqn (2) based on the magnetic moment:
| |  | (2) |
where
g is the Landau factor and
μB is the Bohr magnetic moment. We obtained
S of 1.66 when
g of 2 is used. It has been proved that the value of next-nearest-neighboring exchange constant
J2 in the MPS monolayer is one order of magnitude lower than the nearest-neighboring exchange constant
J1.
60,63,65 Therefore, we would focus on the nearest-neighboring magnetic exchange coupling for the MPS monolayer with and without molecular adsorption.
For a magnetic system, its Hamiltonian can be written as:14,69
| | 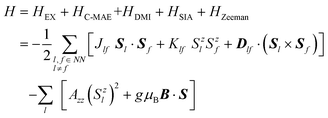 | (3) |
where
HEX,
HC–MAE,
HDMI,
HSIA and
HZeeman represent the energies from isotropic magnetic exchange coupling, magnetocrystalline anisotropic energy (C-MAE), DMI, single ion anisotropy (SIA) and Zeeman effect, respectively. In this paper, the external magnetic field is not considered, so that the Zeeman term is absent.
Jlf is the isotropic exchange coupling parameter between the nearest-neighboring (NN) Mn pairs, which can be calculated by the energy difference between FM and Néel-AFM states (see Fig. S2 in the ESI
†). Here, we calculated three exchange coupling parameters (
Jxxlf,
Jyylf, and
Jzzlf) of the pristine MPS monolayer when spins point along
x-,
y-, and
z-axes, respectively. We found the difference (
Klf =
Jzzlf − (
Jyylf +
Jxxlf)/2) between these exchange coupling parameters is only −4.37 μeV, three orders of magnitude lower than (
Jyylf +
Jxxlf)/2, indicating an ignorable magnetocrystalline anisotropy along the
z-axis in the pristine MPS monolayer. In this paper, (
Jyylf +
Jxxlf)/2 is employed as the isotropic exchange coupling parameter
Jlf.
Dlf is the antisymmetric DMI parameter between the
l-th and
f-th Mn ions, including three elements (
Dxlf,
Dylf, and
Dzlf). The
HDMI can be written as
| | 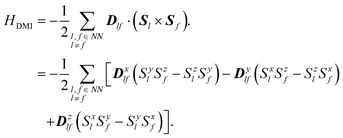 | (4) |
The calculation of the three components of vector Dlf can be referred to Fig. S3 in the ESI.† The three components of vector Dlf are 0.096 meV, 0.036 meV, and −0.466 meV in MPS without gas molecules, much smaller than the absolute value of Jlf, which reveals very little asymmetry in the pristine MPS monolayer. Besides, if the magnetic system has an anisotropy along its easy-axis or easy-plane, the SIA coefficient Azz can be estimated from the four magnetic states where the spins on the l-th Mn ion arrange along the ±z- and ±x-directions with spins on the f-th Mn ions along the y-axis.70 Hence, it can be found that AZZ = (E1 + E2 − E1 − E4)/8S2. The calculated Jlf, Klf, Dlf and Azz of the MPS monolayer with and without molecular adsorption are presented in Table 1. We find that all of the parameters Jlf are negative, demonstrating antiferromagnetic interaction in the MPS substrate, which is consistent with the spin density distribution as shown in Fig. 3. To describe the strengthening of magnetic exchange coupling and antisymmetric DMI quantitatively, the increase ratio of Jlf and the magnitude of Dlf (|Dlf|) are defined as follows and are shown in Fig. 4.
| |  | (5) |
Table 1 The effective magnetic exchange constant (Jlf), the magnetocrystalline anisotropic constant (Klf), the antisymmetric Dzyaloshinski–Moriya interaction (DMI) parameters (Dxlf, Dylf, and Dzlf), the single ion anisotropic coefficient (Azz) and the charge transfer of the MPS monolayer with and without molecule adsorption. A positive charge transfer means the molecule donates the charge to the MPS substrate
| SYSTEM |
J
lf
(meV) |
K
lf
(μeV) |
D
x
lf
(meV) |
D
y
lf
(meV) |
D
z
lf
(meV) |
A
zz (meV per atom) |
Charge Transfer (e) |
| MPS |
−5.958 |
−4.37 |
0.096 |
0.036 |
−0.466 |
−0.042 |
— |
| MPS–CO |
−6.013 |
−3.92 |
1.507 |
0.198 |
2.658 |
−0.046 |
0.024 |
| MPS–N2 |
−6.026 |
−4.13 |
−0.788 |
1.157 |
−1.153 |
−0.046 |
0.033 |
| MPS–NH3 |
−6.014 |
−4.22 |
−0.163 |
−0.794 |
1.903 |
−0.047 |
0.043 |
| MPS–NO |
−8.294 |
−2703.62 |
4.732 |
−1.126 |
−0.211 |
−4.602 |
0.030 |
| MPS–NO2 |
−5.935 |
−5.05 |
1.644 |
0.030 |
1.864 |
−0.040 |
0.019 |
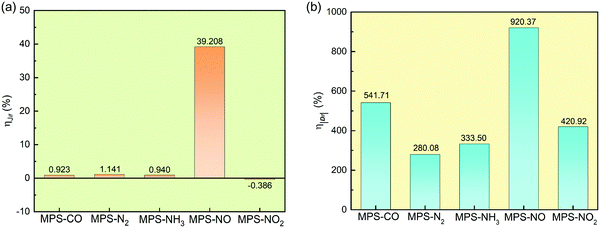 |
| | Fig. 4 Enhanced ratios of effective magnetic exchange constant Jlf (a), and the magnitude of the asymmetric DMI vector Dlf (b). | |
The enhanced ratios of Jlf and |Dlf| are shown in Fig. 4a and b, respectively. We can find that the impact of molecular adsorption on the antisymmetric DMI is much more impressive than on the isotropic magnetic exchange interaction. In the MPS–N2 system, although Jlf only increases with 1.141%, |Dlf| is enhanced by 280.08%. In the MPS–NO system, both Jlf and |Dlf| increase noticeably, and the enhanced ratios are up to 39.208% (Jlf) and 920.37% (|Dlf|), respectively. This phenomenon is distinct from the results in previous studies.37,41 Besides, we also investigate the effect of molecular adsorption on the C-MAE (Klf) and the SIA (Azz) through their ratios to Jlf, as shown in Fig. 5. It is worth emphasizing that both Klf and Azz are critical parts in the overall magnetic anisotropy, and play important roles in resisting thermal fluctuations in 2D magnetic materials.71 There is little increase on Klf and Azz after molecular adsorption except for NO, and the corresponding ratios of Klf and Azz to Jlf are much smaller than 10% revealing very weak magnetic anisotropy. Surprisingly, the Klf and Azz in the MPS–NO system are increased from 0.073% and 0.705% to 32.597% and 55.468% of Jlf, respectively, suggesting the significant effect of NO adsorption on magnetic anisotropy.
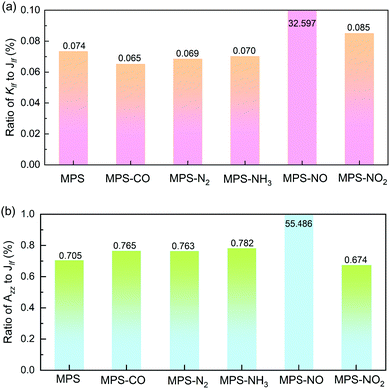 |
| | Fig. 5 Ratios of Klf (a) and Azz (b) to Jlf for the MPS with and without molecular adsorption. | |
3.3 Origin of the enhanced asymmetric DMI and magnetic anisotropy with molecular adsorption
To analyze the origin of the enhanced antisymmetric DMI and magnetic anisotropy, we present the total density of states (DOS) in Fig. 6. It is difficult to observe spin splitting in total DOS, revealing antiferromagnetism whose total magnetic moment is close to zero. The partial DOS of Mn, S, and P atoms is shown in Fig. 6b–d, where the Mn–d orbital splits into dxy, dyz, dz2, dxz, and dx2−y2 five orbitals while the S–p orbital and P–p orbital have px, py and pz components. Obviously, the values of partial DOS of Mn and S atoms are much larger than that of the P atom, indicating their main contribution to the magnetic properties of the MPS monolayer. Besides, the nearest distances of Mn–S and Mn–Mn pairs are 2.04 Å and 3.493 Å in pristine MPS, respectively. Obviously, the distance between the nearest Mn–Mn pairs is much longer than the bond length of Mn–S bonds. Based on the partial DOS in Fig. 6 and the spin density distribution in Fig. 3, we can conclude that the Mn–S–Mn super-exchange coupling is the dominating mechanism of the antiferromagnetic interaction in MPS, which obeys the Goodenough–Kanamori–Anderson rules.72,73 The schematic representation of the Mn–S–Mn super-exchange coupling is presented in Fig. S5, (ESI†) where t2g represents three-fold degenerate orbitals (dxy, dxz, and dyz orbitals) and eg represents two-fold degenerate orbitals (dz2 and dx2−y2 orbitals). The half-filled t2g and eg orbitals result in a Néel-type AFM spin arrangement, as shown in Fig. 3.
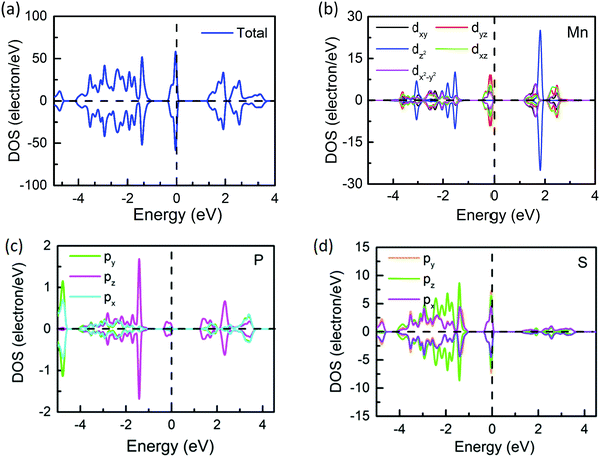 |
| | Fig. 6 The density of state of the MPS monolayer (a). The partial DOS of Mn–d (b), P–p (c) and S–p orbitals (d). | |
To study the influence of molecular adsorption on the super-exchange coupling, we define the difference between orbital band centers BDnAlA,nBlB as the covalency, as follows:74
| | | BDnAlA, nBlB = −|BCA(nA, lA) − BCB(nB, lB)| | (6) |
where
BCA(
nA,
lA) is the short form of
BCA(
nA,
lA,
ml,
ms) representing the band centre of atomic orbital |
nA,
lA,
ml,
ms〉. Here, the dependence of the principle quantum number
n on the notation referring to
BDnAlA,
nBlB is omitted for simplicity.
BCA(
n,
l, ml, ms) is defined as:
| |  | (7) |
where

is the contribution from the atomic orbital |
nA,
lA,
ml,
ms〉 of atom
A to the total DOS (
g(
ε)). According to this definition, a larger covalency corresponds to a higher overlap between two orbitals, revealing a stronger coupling. To calculate the covalency between Mn–d and S–p orbitals (
BDMn–d,S–p), the partial DOSs in the MPS monolayer with and without molecular adsorption are shown in
Fig. 7a and b, and the values are presented in
Fig. 7c. We find that systems with the molecular adsorption around the Mn atom exhibit slightly larger
BDMn–d,S–p than pristine MPS, corresponding to a little enhancement in the parameter
Jlf, such as the phenomenon observed in MPS–N
2. Unexpectedly, the adsorption of CO, and NH
3 around the P atom also increases
BDMn–d,S–p and leads to a weak increase in the
Jlf parameter, which is a combined effect of the charge transfer between the molecule and MPS and the structural distortion induced by molecular adsorption. The charge transfer is shown in
Table 1 where the positive value reveals a charge transfer from the gas molecule to the substrate. This charge transfer is obtained by the Bader charge method, and can be validated by the results of charge density difference as presented in Fig. S4 (ESI
†). The structural distortion can be found through the change of bond length as shown in
Table 2.
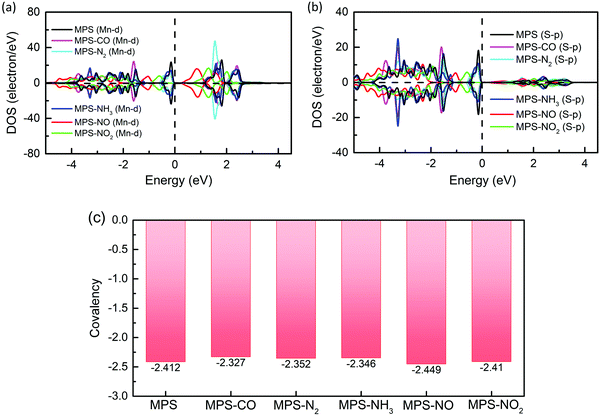 |
| | Fig. 7 The partial DOSs of the Mn–d orbital (a) and S–p orbital (b), and the covalency (c) between Mn–d and S–p orbitals for the MPS monolayer before and after molecular adsorption. | |
Table 2 The magnetic moment on Mn and S atoms, the bond lengths of Mn–S, and Mn–Mn bonds in the MPS monolayer with and without molecular adsorption
| System |
Mn0 (μB) |
Mn1 (μB) |
Mn2 (μB) |
Mn3 (μB) |
Mn0–Mn1 (Å) |
Mn0–Mn2 (Å) |
Mn0–Mn3 (Å) |
Mn–S (Å) |
S (μB) |
| MPS |
4.210 |
−4.210 |
−4.210 |
−4.210 |
3.493 |
3.493 |
3.493 |
2.601 |
±0.001 |
| MPS–CO |
4.206 |
−4.205 |
−4.207 |
−4.206 |
3.494 |
3.488 |
3.496 |
2.597 |
±0.001 |
| MPS–N2 |
4.206 |
−4.206 |
−4.205 |
−4.206 |
3.495 |
3.493 |
3.493 |
2.598 |
±0.001 |
| MPS–NH3 |
4.202 |
−4.202 |
−4.208 |
−4.202 |
3.500 |
3.495 |
3.476 |
2.576 |
±0.001 |
| MPS–NO |
4.201 |
−4.205 |
−4.202 |
−4.206 |
3.495 |
3.493 |
3.490 |
2.590 |
±0.003 |
| MPS–NO2 |
4.200 |
−4.193 |
−4.205 |
−4.207 |
3.493 |
3.496 |
3.491 |
2.599 |
±0.010 |
It can be found that the molecular adsorption has a different effect on Mn–Mn distances (including Mn0–Mn1, Mn0–Mn2, and Mn0–Mn3, as presented in Fig. S3, ESI†), but shortens the Mn–S bond length. With the bond length changing, the magnetic moments on Mn and S atoms also vary, and the spatial inversion symmetry in pristine MPS is broken. The compression of the Mn–S bond and the increase of the magnetic moment on S atom are helpful in strengthening the Mn–S–Mn super-exchange interaction, while the generation and remarkable enhancement of antisymmetric DMI can be attributed to the difference of the magnetic moment between these four Mn atoms and the variety on distances of three Mn–Mn pairs. Surprisingly, the adsorption of NO results in the most obvious increase of Jlf, Klf, |Dlf| and Azz among all adsorption systems, although its BDMn–d,S–p is the smallest and its asymmetric distortion is also not the largest.
Next, we consider the NO–MPS system as an example to investigate separately the influence of structural distortion and charge transfer quantitatively. The pristine MPS doped with 0.030 e is used to investigate the effect of charger transfer on magnetic properties. It is found that the enhanced ratios of Jlf and |Dlf| with such charge transfer are −2.74% and 95.18%, while Azz and Klf are up to −2.178 meV per atom and 708.52 μeV, respectively. To explore the impact of structural distortion, we removed the NO molecule from the NO–MPS system, and then keep the distorted lattice of the MPS monolayer. The calculated enhanced ratios are −0.20% (Jlf) and 503.56% (|Dlf|), as shown in Table 3. Meanwhile, the absolute values of Azz and Klf induced by structural distortion are 0.284 meV per atom and 124.61 μeV, respectively. It is obvious that the structure distortion has larger influence on the antisymmetric DMI than charge transfer, while the charge transfer affects the isotropic magnetic exchange coupling, C-MAE and SIA more significantly.
Table 3 Parameters Jlf, Klf, Dxlf, Dylf, Dzlf, |Dlf|, and Azz of pristine MPS, MPS only with charge doping (MPS-Charge), MPS only with structural distortion (MPS-Distortion), and MPS with NO adsorption (with both doping and structural distortion, MPS–NO)
| SYSTEM |
J
lf
(meV) |
K
lf
(μeV) |
D
x
lf
(meV) |
D
y
lf
(meV) |
D
z
lf
(meV) |
|Dlf| (meV) |
A
zz (meV per atom) |
| MPS |
−5.958 |
−4.37 |
0.096 |
0.036 |
−0.466 |
0.477 |
−0.042 |
| MPS–Charge |
−5.795 |
708.52 |
0.428 |
−0.262 |
−0.784 |
0.931 |
−2.178 |
| MPS–Distortion |
−5.946 |
−124.61 |
−1.488 |
−0.838 |
2.318 |
2.879 |
−0.284 |
| MPS–NO |
−8.294 |
−2703.62 |
4.732 |
−1.126 |
−0.211 |
4.869 |
−4.602 |
However, the total enhancement caused by the distortion and charger transfer is still much lower than that of the MPS–NO system. For instance, both the charge transfer and structural distortion result in a decrease in Jlf, which is contrary to the 39.208% increase induced by the NO adsorption. From the first-principles calculations, we find that the magnetic moment of NO is up to −0.421μB, much larger than that of the S atom (±0.003μB) in the MPS–NO system, providing possible super-exchange coupling with Mn atoms. In order to explore the super-exchange coupling between the Mn atom and NO molecule, we calculated the covalency between the Mn atom and NO molecule (BDMn,NO) based on the partial DOSs as shown in Fig. S6 (ESI†). The calculated BDMn,NO is up to −2.329 higher than BDMn–d,S–p of the NO–MPS system (−2.449), indicating the stronger Mn–NO–Mn super-exchange coupling with respect to the Mn–S–Mn super-exchange coupling. Moreover, we also calculate the covalency between Mn ions and NO2 molecules (BDMn,NO2). The calculated BDMn–NO2 is −9.82, which is much lower than BDMn–NO (−2.329) and BDMn–S in the MPS–NO2 system (−2.41), suggesting weak super-exchange interaction between Mn ions and NO2 molecules. This highlights the important effect of magnetic moment on the adsorbed molecule. Therefore, in addition to structural distortion and charge transfer, the newly generated Mn–NO–Mn super-exchange coupling also contributes to the enhancements of magnetic exchange interaction, C-MAE, DMI and SIA.
4. Conclusions
In summary, the influence of molecular adsorption on the magnetic properties of the MPS monolayer is investigated by the first-principles calculation. Based on the stable configuration, we find that although the molecular adsorption enhances the isotropic magnetic exchange coupling constant slightly, it increases magnetic anisotropy and induces DMI in the MPS monolayer significantly. Among all the studied systems, the enhancements of the isotropic magnetic exchange coupling constant (Jlf), DMI (|Dlf|), C-MAE (Klf), and SIA (Azz) caused by NO molecular adsorption are the largest, with the enhanced ratios being 39.208%, 920.37%, 32.524% and 54.763% (of Jlf), respectively. It is found that the enhancement of DMI is mainly attributed to the structural deformation, while the super-exchange interaction between Mn atoms and magnetic molecules accounts for the remarkable enhancements of Jlf and Klf. Our finding not only demonstrates the effect of molecular adsorption on inducing the intralayer DMI in centrosymmetric structures, but also provides an insightful understanding of the mechanism of super-exchange interaction between gas molecules and 2D magnets.
Author contributions
G. Z. conceived the idea. K. W. did the DFT calculation. K. W., and G. Z. did data analysis. All the authors discussed the results and participated in writing the manuscript.
Conflicts of interest
The authors declare no competing financial interest.
Acknowledgements
Ke Wang acknowledges the support from the Shaanxi Provincial Science and Technology Department (2022JQ-015).
References
- Y. Khan, S. M. Obaidulla, M. R. Habib, A. Gayen, T. Liang, X. Wang and M. Xu, Nano Today, 2020, 34, 100902 CrossRef CAS.
- C. Liu, H. Chen, S. Wang, Q. Liu, Y.-G. Jiang, D. W. Zhang, M. Liu and P. Zhou, Nat. Nanotechnol., 2020, 15, 545–557 CrossRef CAS PubMed.
- S. Hajra, V. Vivekananthan, M. Sahu, G. Khandelwal, N. P. M. J. Raj and S.-J. Kim, Nano Energy, 2021, 85, 105964 CrossRef CAS.
- N. Sethulakshmi, A. Mishra, P. M. Ajayan, Y. Kawazoe, A. K. Roy, A. K. Singh and C. S. Tiwary, Mater. Today, 2019, 27, 107–122 CrossRef CAS.
- C. Du, X. Hu, G. Zhang and Y. Cheng, Acta Phys.-Chim. Sin., 2019, 35, 1078–1089 CAS.
- J. You, L. Wang, Y. Zhao and W. Bao, J. Cleaner Prod., 2020, 124668 Search PubMed.
- N. D. Mermin and H. Wagner, Phys. Rev. Lett., 1966, 17, 1133 CrossRef CAS.
- C. Gong, L. Li, Z. Li, H. Ji, A. Stern, Y. Xia, T. Cao, W. Bao, C. Wang and Y. Wang,
et al.
, Nature, 2017, 546, 265–269 CrossRef CAS PubMed.
- B. Huang, G. Clark, E. Navarro-Moratalla, D. R. Klein, R. Cheng, K. L. Seyler, D. Zhong, E. Schmidgall, M. A. McGuire and D. H. Cobden,
et al.
, Nature, 2017, 546, 270–273 CrossRef CAS PubMed.
- M. Gibertini, M. Koperski, A. F. Morpurgo and K. S. Novoselov, Nat. Nanotechnol., 2019, 14, 408–419 CrossRef CAS PubMed.
- C. Xu, J. Feng, H. Xiang and L. Bellaiche, npj Comput. Mater., 2018, 4, 1–6 CrossRef CAS.
- F. Donati, S. Rusponi, S. Stepanow, L. Persichetti, A. Singha, D. M. Juraschek, C. Wäckerlin, R. Baltic, M. Pivetta and K. Diller,
et al.
, Phys. Rev. Lett., 2020, 124, 077204 CrossRef CAS PubMed.
- N. C. Frey, H. Kumar, B. Anasori, Y. Gogotsi and V. B. Shenoy, ACS Nano, 2018, 12, 6319–6325 CrossRef CAS PubMed.
- J. Liang, W. Wang, H. Du, A. Hallal, K. Garcia, M. Chshiev, A. Fert and H. Yang, Phys. Rev. B, 2020, 101, 184401 CrossRef CAS.
- S. Qi, J. Jiang and W. Mi, Phys. Chem. Chem. Phys., 2020, 22, 23597–23608 RSC.
- P. M. Levy and A. Fert, Phys. Rev. B: Condens. Matter Mater. Phys., 1981, 23, 4667–4690 CrossRef CAS.
- A. Fert and P. M. Levy, Phys. Rev. Lett., 1980, 44, 1538–1541 CrossRef CAS.
- H. Yang, A. Thiaville, S. Rohart, A. Fert and M. Chshiev, Phys. Rev. Lett., 2015, 115, 267210 CrossRef PubMed.
- F. Mahfouzi and N. Kioussis, Phys. Rev. B, 2021, 103, 094410 CrossRef CAS.
- J. Yang, C. Abert, D. Suess and S.-K. Kim, Sci. Rep., 2021, 11, 3886 CrossRef CAS PubMed.
- A. Hrabec, Z. Luo, L. J. Heyderman and P. Gambardella, Appl. Phys. Lett., 2020, 117, 130503 CrossRef CAS.
- Z. Fei, B. Huang, P. Malinowski, W. Wang, T. Song, J. Sanchez, W. Yao, D. Xiao, X. Zhu and A. F. May,
et al.
, Nat. Mater., 2018, 17, 778–782 CrossRef CAS PubMed.
- Y. Wen, Z. Liu, Y. Zhang, C. Xia, B. Zhai, X. Zhang, G. Zhai, C. Shen, P. He and R. Cheng,
et al.
, Nano Lett., 2020, 20, 3130–3139 CrossRef CAS PubMed.
- B. You, M. T. Tang, C. Tsai, F. Abild-Pedersen, X. Zheng and H. Li, Adv. Mater., 2019, 31, 1807001 CrossRef PubMed.
- Q. Gao and H. Zhang, Nanoscale, 2020, 12, 5995–6001 RSC.
- S. Jiang, J. Shan and K. F. Mak, Nat. Mater., 2018, 17, 406–410 CrossRef CAS PubMed.
- S. W. Jiang, L. Z. Li, Z. F. Wang, K. F. Mak and J. Shan, Nat. Nanotechnol., 2018, 13, 549–554 CrossRef CAS PubMed.
- B. Huang, G. Clark, D. R. Klein, D. MacNeill, E. Navarro-Moratalla, K. L. Seyler, N. Wilson, M. A. McGuire, D. H. Cobden and D. Xiao,
et al.
, Nat. Nanotechnol., 2018, 13, 544–549 CrossRef CAS PubMed.
- C. Tang, L. Zhang, S. Sanvito and A. Du, J. Mater. Chem. C, 2020, 8, 7034–7040 RSC.
- C. Tang, K. Ostrikov, S. Sanvito and A. Du, Nanoscale Horiz., 2021, 6, 43–48 RSC.
- S. Zhang, X. Liang, H. Zhao, Y. Chen, Q. He, J. Liu, L. Lv, J. Yang, H. Wu and L. Chen, Phys. Lett. A, 2021, 396, 127219 CrossRef CAS.
- L. Zhang, C. Tang, S. Sanvito, Y. Gu and A. Du, ACS Appl. Mater. Interfaces, 2022, 14, 1800–1806 CrossRef CAS PubMed.
- Y. Guo, N. Liu, Y. Zhao, X. Jiang, S. Zhou and J. Zhao, Chin. Phys. Lett., 2020, 37, 107506 CrossRef CAS.
- Z. I. Popov, E. V. Sukhanova and D. G. Kvashnin, Carbon, 2021, 184, 714–720 CrossRef CAS.
- B. Zhang, G. Song, J. Sun, J. Leng, C. Zhang and J. Wang, Nanoscale, 2020, 12, 12490–12496 RSC.
- S. Radhakrishnan, D. Das, A. Samanta, C. A. D. L. Reyes, L. Deng, L. B. Alemany, T. K. Weldeghiorghis, V. N. Khabashesku, V. Kochat and Z. Jin,
et al.
, Sci. Adv., 2017, 3, e1700842 CrossRef PubMed.
- M. Rassekh, J. He, S. Farjami Shayesteh and J. J. Palacios, Comp. Mater. Sci., 2020, 183, 109820 CrossRef CAS.
- Z. Zheng, K. Ren, Z. Huang, Z. Zhu, K. Wang, Z. Shen and J. Yu, Semicond. Sci. Technol., 2021, 36, 075015 CrossRef CAS.
- C. Tang, L. Zhang and A. Du, J. Mater. Chem. C, 2020, 8, 14948–14953 RSC.
- Y. Wang, C. Wang, S.-J. Liang, Z. Ma, K. Xu, X. Liu, L. Zhang, A. S. Admasu, S.-W. Cheong and L. Wang,
et al.
, Adv. Mater., 2020, 32, 2004533 CrossRef CAS PubMed.
- J. He, G. Ding, C. Zhong, S. Li, D. Li and G. Zhang, J. Mater. Chem. C, 2019, 7, 5084–5093 RSC.
- K. Wang, K. Ren, Y. Cheng, M. Zhang, H. Wang and G. Zhang, Phys. Chem. Chem. Phys., 2020, 22, 22047–22054 RSC.
- S. Mühlbauer, B. Binz, F. Jonietz, C. Pfleiderer, A. Rosch, A. Neubauer, R. Georgii and P. Böni, Science, 2009, 323, 915–919 CrossRef PubMed.
- F. Jonietz, S. Mühlbauer, C. Pfleiderer, A. Neubauer, W. Münzer, A. Bauer, T. Adams, R. Georgii, P. Böni and R. A. Duine,
et al.
, Science, 2010, 330, 1648–1651 CrossRef CAS PubMed.
- Y. Fujishiro, N. Kanazawa, T. Shimojima, A. Nakamura, K. Ishizaka, T. Koretsune, R. Arita, A. Miyake, H. Mitamura and K. Akiba,
et al.
, Nat. Commun., 2018, 9, 408 CrossRef CAS PubMed.
- K. Shibata, J. Iwasaki, N. Kanazawa, S. Aizawa, T. Tanigaki, M. Shirai, T. Nakajima, M. Kubota, M. Kawasaki and H. S. Park,
et al.
, Nat. Nanotechnol., 2015, 10, 589–592 CrossRef CAS PubMed.
- Z. Ni, A. V. Haglund, H. Wang, B. Xu, C. Bernhard, D. G. Mandrus, X. Qian, E. J. Mele, C. L. Kane and L. Wu, Nat. Nanotechnol., 2021, 16, 782–787 CrossRef CAS PubMed.
-
Z. Shen, C. Song, Y. Xue, Z. Wu, J. Wang and Z. Zhong, arXiv preprint arXiv:2109.00723, 2021.
- Y. Zhang, J. Liu, Y. Dong, S. Wu, J. Zhang, J. Wang, J. Lu, A. Rückriegel, H. Wang and R. Duine,
et al.
, Phys. Rev. Lett., 2021, 127, 117204 CrossRef CAS PubMed.
- A. Chakraborty, A. K. Srivastava, A. K. Sharma, A. K. Gopi, K. Mohseni, A. Ernst, H. Deniz, B. K. Hazra, S. Das and P. Sessi,
et al.
, Adv. Mater., 2022, 34, 2108637 CrossRef CAS PubMed.
- G. Long, H. Henck, M. Gibertini, D. Dumcenco, Z. Wang, T. Taniguchi, K. Watanabe, E. Giannini and A. F. Morpurgo, Nano Lett., 2020, 20, 2452–2459 CrossRef CAS PubMed.
- R. Kumar, R. N. Jenjeti and S. Sampath, ACS Sens., 2020, 5, 404–411 CrossRef CAS PubMed.
- G. Kresse and J. Furthmüller, Phys. Rev. B: Condens. Matter Mater. Phys., 1996, 54, 11169 CrossRef CAS PubMed.
- G. Kresse and J. Furthmüller, Comp. Mater. Sci., 1996, 6, 15–50 CrossRef CAS.
- J. P. Perdew, K. Burke and M. Ernzerhof, Phys. Rev. Lett., 1996, 77, 3865 CrossRef CAS PubMed.
- G. Kresse and J. Hafner, Phys. Rev. B: Condens. Matter Mater. Phys., 1997, 55, 7539 CrossRef CAS.
- A. Georges and G. Kotliar, Phys. Rev. B: Condens. Matter Mater. Phys., 1992, 45, 6479–6483 CrossRef PubMed.
- X. Li, T. Cao, Q. Niu, J. Shi and J. Feng, Proc. Natl. Acad. Sci. U. S. A., 2013, 110, 3738–3742 CrossRef CAS PubMed.
- S. L. Gnatchenko, I. S. Kachur, V. G. Piryatinskaya, Y. M. Vysochanskii and M. I. Gurzan, Low Temp. Phys., 2011, 37, 144–148 CrossRef CAS.
- D. Vaclavkova, A. Delhomme, C. Faugeras, M. Potemski, A. Bogucki, J. Suffczyński, P. Kossacki, A. R. Wildes, B. Grémaud and A. Saúl, 2D Mater., 2020, 7, 035030 CrossRef CAS.
- N. Sivadas, M. W. Daniels, R. H. Swendsen, S. Okamoto and D. Xiao, Phys. Rev. B: Condens. Matter Mater. Phys., 2015, 91, 235425 CrossRef.
- S. Grimme, J. Antony, S. Ehrlich and H. Krieg, J. Chem. Phys., 2010, 132, 154104 CrossRef PubMed.
- A. R. Wildes, B. Roessli, B. Lebech and K. W. Godfrey, J. Phys.: Condens. Matter, 1998, 10, 6417–6428 CrossRef CAS.
- L. Zhang, X. Guo and S. Huang, Int. J. Hydrogen Energy, 2021, 46, 26950–26960 CrossRef CAS.
- T. Olsen, J. Phys. D: Appl. Phys., 2021, 54, 314001 CrossRef CAS.
- W. An, X. Wu and X. C. Zeng, J. Phys. Chem. C, 2008, 112, 5747–5755 CrossRef CAS.
- X. H. Wang, D. W. Wang, A. J. Yang, N. Koratkar, J. F. Chu, P. L. Lv and M. Z. Rong, Phys. Chem. Chem. Phys., 2018, 20, 4058–4066 RSC.
- Y. Cai, Q. Ke, G. Zhang and Y.-W. Zhang, J. Phys. Chem. C, 2015, 119, 3102–3110 CrossRef CAS.
- H. Xiang, C. Lee, H.-J. Koo, X. Gong and M.-H. Whangbo, Dalton Trans., 2013, 42, 823–853 RSC.
- H. J. Xiang, E. J. Kan, S.-H. Wei, M. H. Whangbo and X. G. Gong, Phys. Rev. B: Condens. Matter Mater. Phys., 2011, 84, 224429 CrossRef.
- C. Xu, J. Feng, H. Xiang and L. Bellaiche, npj Comput. Mater., 2018, 4, 57 CrossRef.
- J. B. Goodenough, Phys. Rev., 1955, 100, 564–573 CrossRef CAS.
- J. Kanamori, J. Phys. Chem. Solids, 1959, 10, 87–98 CrossRef CAS.
- A. Cammarata and J. M. Rondinelli, J. Chem. Phys., 2014, 141, 114704 CrossRef PubMed.
Footnote |
| † Electronic supplementary information (ESI) available: Adsorption energy with different molecular orientations, four possible magnetic configurations, calculating methods for Jlf and Dlf, diagram of the asymmetric exchange interaction, difference charge density of adsorption system, diagram of Mn–S–Mn super–exchange coupling and the partial DOSs of adsorption systems. See DOI: https://doi.org/10.1039/d2mh00462c |
|
| This journal is © The Royal Society of Chemistry 2022 |
Click here to see how this site uses Cookies. View our privacy policy here.  Open Access Article
 c,
Yuan
Cheng
bd,
Shuai
Chen
 e and
Gang
Zhang
 *e
*e


 is the contribution from the atomic orbital |nA, lA, ml, ms〉 of atom A to the total DOS (g(ε)). According to this definition, a larger covalency corresponds to a higher overlap between two orbitals, revealing a stronger coupling. To calculate the covalency between Mn–d and S–p orbitals (BDMn–d,S–p), the partial DOSs in the MPS monolayer with and without molecular adsorption are shown in Fig. 7a and b, and the values are presented in Fig. 7c. We find that systems with the molecular adsorption around the Mn atom exhibit slightly larger BDMn–d,S–p than pristine MPS, corresponding to a little enhancement in the parameter Jlf, such as the phenomenon observed in MPS–N2. Unexpectedly, the adsorption of CO, and NH3 around the P atom also increases BDMn–d,S–p and leads to a weak increase in the Jlf parameter, which is a combined effect of the charge transfer between the molecule and MPS and the structural distortion induced by molecular adsorption. The charge transfer is shown in Table 1 where the positive value reveals a charge transfer from the gas molecule to the substrate. This charge transfer is obtained by the Bader charge method, and can be validated by the results of charge density difference as presented in Fig. S4 (ESI†). The structural distortion can be found through the change of bond length as shown in Table 2.


