
Insights into the modular design of kinase inhibitors and application to Abl and Axl†
Sameer
Phadke
 a,
Lluis
Lopez-Barcons
b,
Nathalie
Vandecan
a,
Zhifen
Wu
b,
Taylor K.
Johnson
a,
Eric J.
Lachacz
a,
Sofia D.
Merajver
b and
Matthew B.
Soellner
*a
a,
Lluis
Lopez-Barcons
b,
Nathalie
Vandecan
a,
Zhifen
Wu
b,
Taylor K.
Johnson
a,
Eric J.
Lachacz
a,
Sofia D.
Merajver
b and
Matthew B.
Soellner
*a
aDepartment of Chemistry, University of Michigan, 930 N. University Ave., Ann Arbor, MI 48109, USA. E-mail: soellner@umich.edu
bDepartment of Internal Medicine, University of Michigan, 1500 Medical Center Dr, Ann Arbor, MI 48109, USA
First published on 5th November 2021
Abstract
Scaffold hopping is a common strategy for generating kinase inhibitors that bind to the DFG-out inactive conformation. Small structural differences in inhibitor scaffolds can have significant effects on potency and selectivity across the kinome, however, these effects are often not studied in detail. Herein, we outline a design strategy to generate an array of DFG-out conformation inhibitors with three different hinge-binders and two DFG-pocket groups. We studied inhibitor selectivity across a large segment of the kinome and elucidated binding preferences that can be used in scaffold hopping campaigns. Using these analyses, we identified two selective inhibitors that display low nanomolar potency against Axl or wild-type and clinically relevant mutants of Abl.
Introduction
Kinome-wide selectivity profiling of inhibitors has identified a wide variety of scaffolds that bind to different kinase subsets.1,2 Numerous structure–activity relationships (SARs) have been established against individual kinases, or small groups of kinases. However, the effect of small structural differences across a series of compounds on their broader selectivity profiles is typically not studied in detail. Previous work in our lab elucidated the changes in selectivity that occur when the core of a ‘DFG-in’ active conformation inhibitor is converted to a ‘DFG-out’ inactive conformation inhibitor, or to a ‘C-helix-out’ inactive conformation inhibitor.3 We observed that, contrary to a long-held belief in the kinase-field, a compound that binds to the DFG-out inactive conformation was not more selective than the corresponding DFG-in active conformation inhibitor. However, DFG-out inactive conformation inhibitors (also called type II inhibitors) have some advantages, including longer residence times with their target kinase(s). Furthermore, certain kinases with bulky gatekeeper residues are more effectively targeted by DFG-out inhibitors. These inhibitors typically have 3 modular parts – a hinge-binding ‘head’ group, a middle ‘linker’, and a hydrogen-bond donor/acceptor pair connected to a small hydrophobic motif that together forms the ‘tail’ region and binds in the DFG-pocket of the target kinase(s).4 The head group is typically comprised of a heterocyclic ring, which can form at least one H-bond with the backbone of the kinase hinge. The tail group generally possesses an amide or urea group that forms an H-bond with a conserved glutamic acid residue on the C-helix. A trifluoromethyl or t-butyl group in the tail fits in the pocket created by the outward flip of the phenylalanine (F) residue in the DFG-out conformation leading to a substantial increase in potency. A common strategy in the development of kinase inhibitors is a ‘mix-and-match’ scaffold-hopping approach where the hinge-binding group of one inhibitor is hybridized with a tail group of another inhibitor. The compounds that result often yield interesting and surprising effects in potency and selectivity, however, the underlying reasons for the potency and selectivity changes have not been studied systematically. In this work, we: i) systematically evaluate parts of DFG-out inactive conformation inhibitors that affect kinome-wide selectivity, ii) study how small changes in the position of N-atoms within the hinge-binding fragment affect selectivity and potency, and iii) study the selectivity and potency differences between two commonly used tail groups. From our analysis, we identify elements that can be used as the starting point for targeting 36 distinct kinases. We apply the design strategy to two highly relevant kinases in cancer (ABL and AXL), yielding a highly selective kinase inhibitor for each target.Results and discussion
Inhibitor design and synthesis
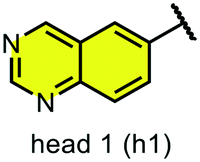
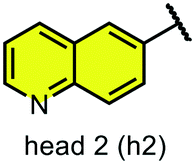
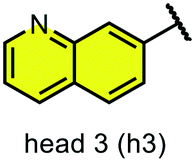
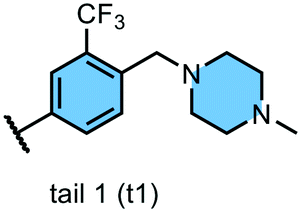
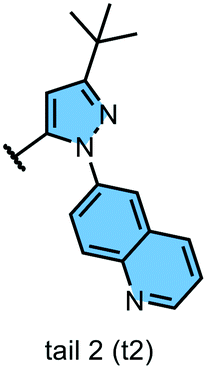
We examined 6-quinazoline (head 1 or h1) and 6-quinoline (head 2 or h2) as hinge-binding groups for our inhibitor set (Fig. 1). The additional N-3 atom in the 6-quinazoline ring is not expected to form a H-bond with the kinase hinge. To study the effect of removing a hydrogen bonding acceptor atom from the head group while maintaining the overall lipophilicity, we included a third head group, 7-quinoline (head 3 or h3). The position of the N-atom in the 7-quinoline ring ensured that a H-bond with the hinge would not be energetically favorable. We used a para-substituted phenyl group as present in AST-487 and sorafenib to form the linker region of all our compounds since it provides a synthetically efficient method to bypass bulky ‘gatekeeper’ residues. For the DFG-pocket binding group, we chose two commonly used scaffolds that were connected to the linker by a urea group: a 4-((4-methylpiperazin-1-yl)methyl)-3-(trifluoromethyl)aniline scaffold (tail 1 or t1) as present in ponatinib,5 and a 3-(tert-butyl)-1-(quinolin-6-yl)-1H-pyrazol-5-amine scaffold (tail 2 or t2) as present in rebastinib.6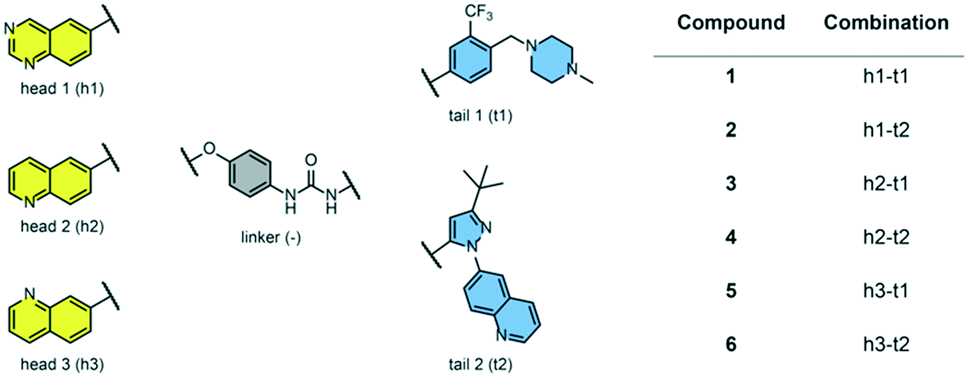 | ||
| Fig. 1 Head, linker, and tail groups used in inhibitor design. | ||
The synthetic route for the preparation of our set of compounds 1–6 is shown in the ESI.† A nucleophilic aromatic substitution (SNAr) reaction of 1-fluoro-4-nitrobenzene with 6-hydroxyquinazoline, 6-hydroxyquinoline, or 7-hydroxyquinoline followed by nitro reduction in the presence of iron and catalytic HCl afforded intermediates 4-(quinazolin-6-yloxy)aniline (S13), 4-(quinolin-6-yloxy)aniline (S15), or 4-(quinolin-7-yloxy)aniline (S17), respectively. These anilines were reacted with activated carbamates of tail 1 or 2 (S7, S10, S11) and DIPEA in DMSO to give the urea-containing compounds 1–6 with overall yields of 16–35% (over 3 steps).
Kinome-wide selectivity
To assess the selectivity scores of the 6 compounds, we screened them against a representative panel of 249 kinases at two concentrations (100 nM and 1 μM) using the Nanosyn mobility shift assay-based kinase profiling platform. At a screening concentration of 100 nM, compounds with tail 2 are more selective than compounds with tail 1 at all levels of inhibition and across all head groups (Table 1). Interestingly, this trend does not hold uniformly true when screened at a concentration of 1 μM (Table S1†). At this concentration, essentially no difference is observed between the two tails for the h1 and h3 compounds. Thus, the selectivity profile appears to be biphasic – t1 compounds are likely more potent across the board and at a low screening concentration appear to be less selective than t2 compounds. At saturating levels of inhibitor, the potency differences no longer drive selectivity. However, compound 4 (h2–t2) retains its higher selectivity as compared to the compound 3 (h2–t1). This has important implications in a scaffold-hopping strategy because selectivity does not seem to be modular or additive. Instead, a cooperative effect between head group and tail group affects selectivity across the kinome.| Inhibition levels | 1 (h1–t1) | 2 (h1–t2) | 3 (h2–t1) | 4 (h2–t2) | 5 (h3–t1) | 6 (h3–t2) |
|---|---|---|---|---|---|---|
| Percentage of kinases inhibited at a concentration of 100 nM at the corresponding level | ||||||
| >95% | 7.2% | 1.6% | 5.2% | 0% | 1.2% | 0% |
| >75% | 14.5% | 8% | 14.9% | 3.6% | 4.4% | 1.6% |
| >50% | 21.3% | 13.3% | 21.3% | 6% | 5.6% | 6% |
The h3-containing compounds 5 and 6 are significantly more selective than the other head groups. This is likely because they are not expected to form a H-bond with the hinge region and are weak inhibitors across the kinome. It is possible that h3 compounds form a H-bond with the hinge of at least some kinases. However, this would require a 180° rotation of the head group and would position the linker and tail group in a manner that is not optimal for binding. In most cases, the fold difference in selectivity between any two compounds is consistent at all three inhibition levels (>50%, >75%, and >95%), though the absolute percentage of kinases inhibited differs.
Differences in binding preferences among kinases
For each head group, we calculated the difference between inhibition by t1 compounds and inhibition by t2 compounds for each kinase at a screening concentration of 100 nM (Table 1). The mean difference in inhibition values was 5.5% for the h1 pair, 12% for the h2 pair, and −0.8% for the h3 pair. This indicates that most kinases were inhibited equally by compounds with either tail group regardless of the head group associated with it, though h2 increased potency for t1 over t2 across the kinome.As h3 compounds are the most selective compounds in the set due to their unusual binding mode, we focused our analysis of the tail groups using only compounds with h1 and h2 groups. These compounds bind to a greater segment of the kinome in a conformation that is more typical of kinase inhibitors.
First, we searched for kinases for which inhibition by t1 and t2 compounds was the same: for example, kinases whose inhibition is within 1 standard deviation from the mean (the area within the dotted lines in Fig. 2). Nine kinases (ABL1, ABL2, TEK, LYNA, LYNB, NTRK1, LCK, FLT3, PDFGRA) were inhibited by >50% by each of the compounds 1–4. Notably, each of these kinases lies within the tyrosine kinase (TK) group. Next, we searched for kinases where the difference in inhibition within each head group pair was at least 1 standard deviation away from the mean (dashed black line in Fig. 2). By this measure, compound 1 (h1–t1) inhibited 37 kinases to a greater extent than compound 2 (h1–t2) and compound 3 (h2–t1) inhibited 43 kinases to a greater extent than compound 4 (h2–t2). 26 kinases were common to both lists and were inhibited by >50%. Specific subfamilies within the TK group (EPH kinases, FLT kinases) show a clear preference for compounds with the tail 1 group. Strikingly, tail 1 compounds expand the set of kinases groups inhibited and a preference for this motif is observed in closely related members or subfamilies in the CMGC group (p38 α/B [MAPK14/11]), AGC group (MKNK1/2), STE, and TKL groups. We then identified kinases that were preferentially inhibited by compounds with tail 2 groups. Compound 2 (h1–t2) inhibited 17 kinases to a greater extent than compound 1 (h1–t1) and compound 4 (h2–t2) inhibited 11 kinases to a greater extent than compound 3 (h2–t1). 2 kinases (FGFR3 and AXL), both belonging to the TK group, were common to both lists and displayed >50% inhibition.
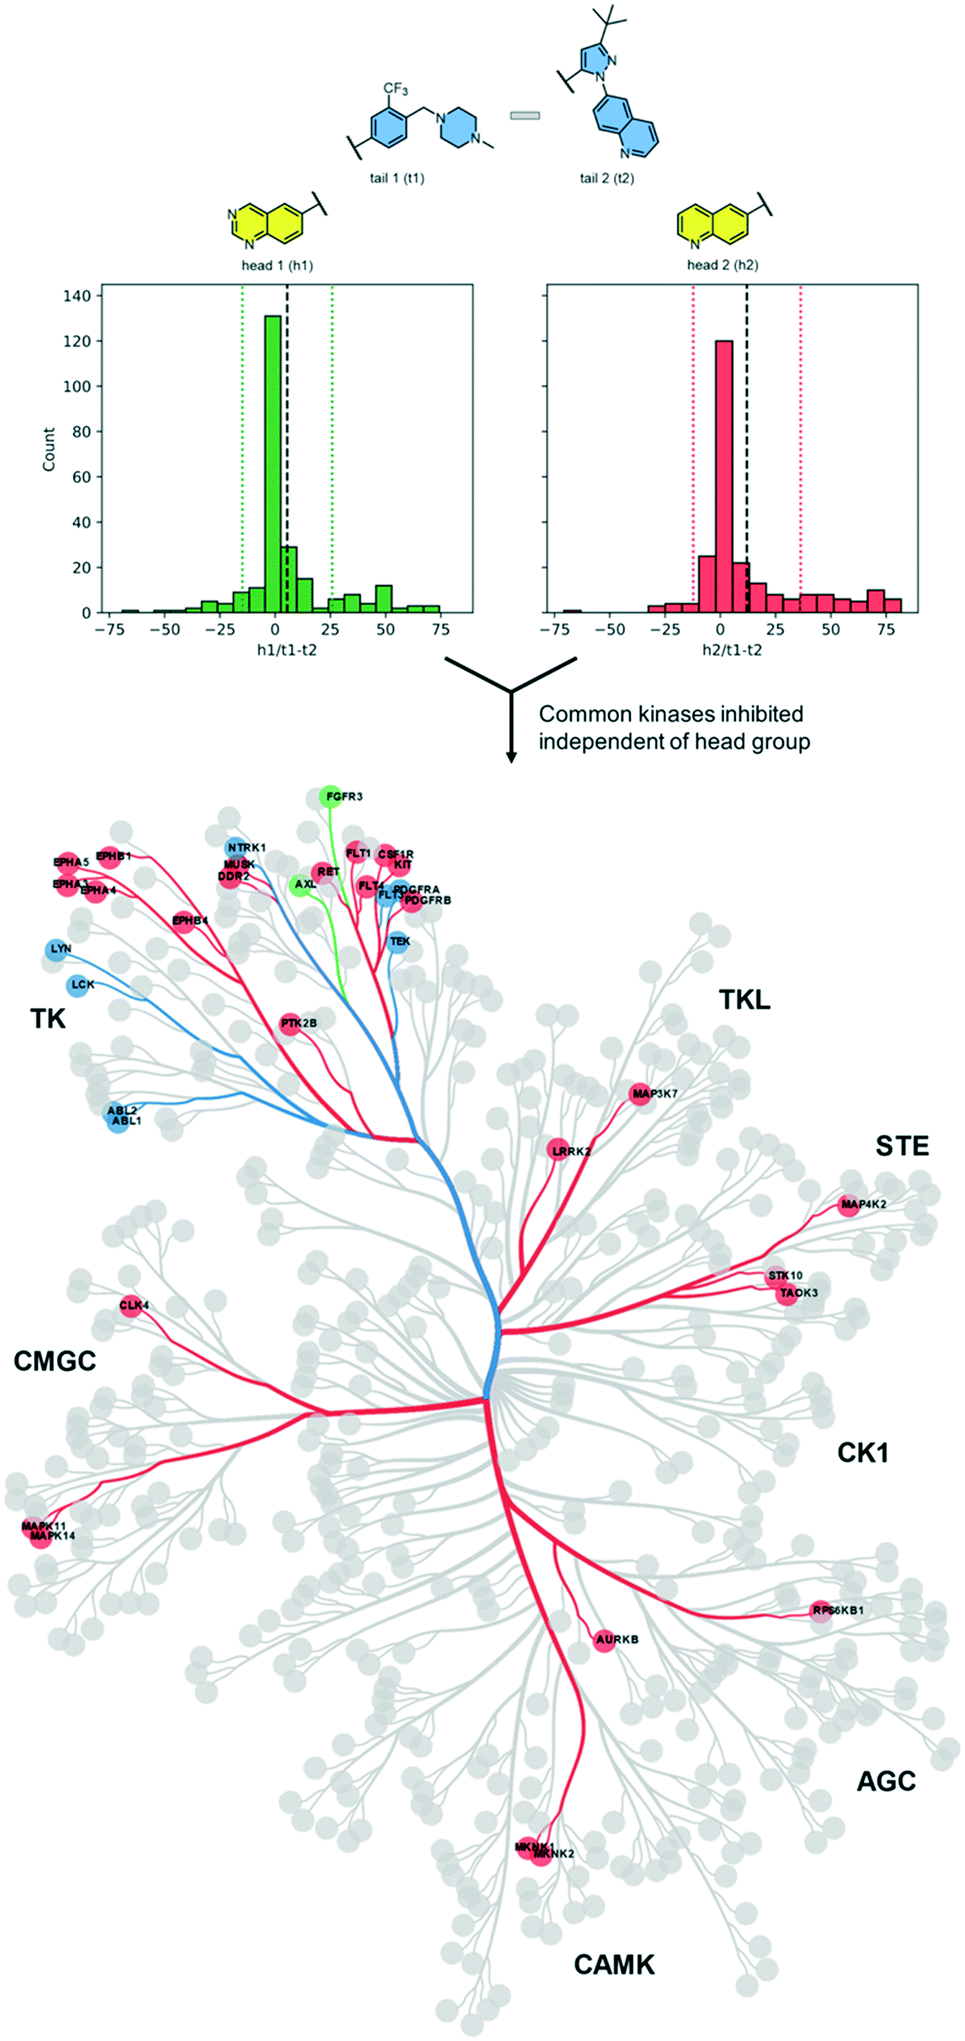 | ||
| Fig. 2 Differences in kinase inhibition values between t1 compounds and t2 compounds for two head groups (h3 not shown above). The dotted lines mark 1 standard deviation from the mean (dashed black line). 8 kinases (9 isoforms) are common in the area between the dotted lines for the two head groups and are shown in blue on the dendrogram. Compounds with a t1 group (beyond the dotted lines in the positive direction) preferentially inhibit 26 additional kinases shown in red. Compounds with a t2 group (beyond the dotted lines in the negative direction) preferentially inhibit 2 kinases shown in green. | ||
We then carried out a similar analysis to evaluate the effect of an extra N-atom in the hinge-binding (head) group. Six kinases (ABL1, ABL2, TEK, LCK, FLT3, PDFGRA) are equally inhibited at a level of >50% by compounds with the h1 and h2 head groups (Fig. S1† and 3A). The extra N-3 atom in the quinazoline ring of h1 increases potency for 4 additional kinases (FGR, FGFR1, EPH-A2, NTRK1) over the quinoline ring of h2 while no kinases are preferentially inhibited by compounds containing the h2 group. Thus, the presence of a single non-H-bonding N atom in the head group can reduce selectivity.
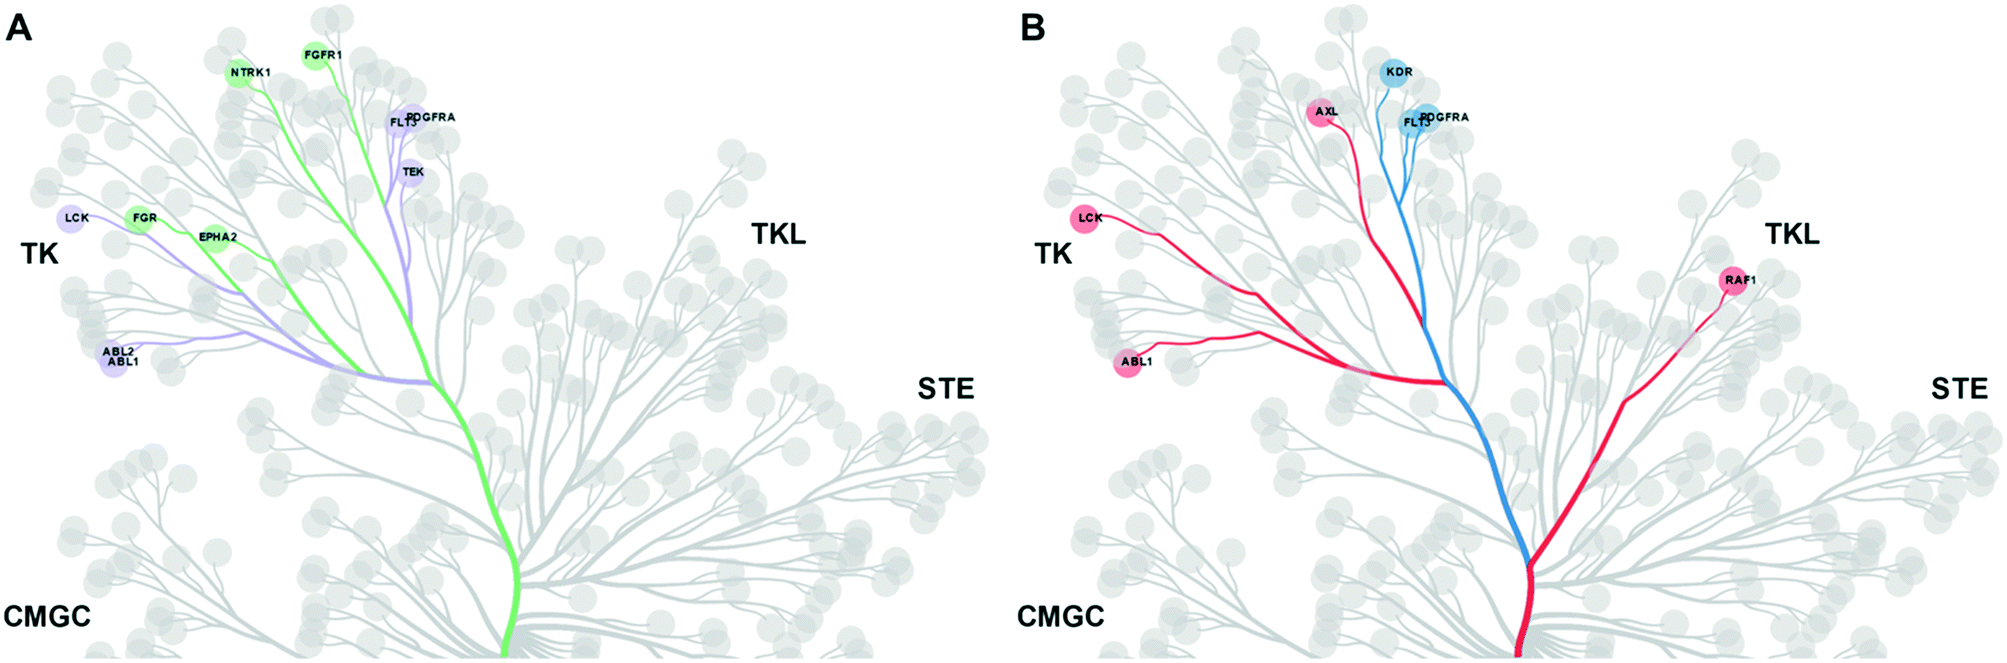 | ||
| Fig. 3 A. Kinases inhibited equally by h1 and h2 compounds are shown in purple. Kinases preferentially inhibited by h1 compounds over h2 compounds are shown in green. B. Kinases inhibited equally by h2 and h3 compounds are shown in blue. Kinases preferentially inhibited by h2 compounds over h3 compounds are shown in red. | ||
Swapping the 6-quinoline (head 2) group with a 7-quinoline (head 3) group that likely does not form any H-bonds with the hinge region retains high potency for 3 kinases (KDR, FLT3, PDGFRA) (Fig. S2† and 3B). Binding to these kinases seems to be dictated primarily by the tail group in the inhibitor. The ability to form an H-bond restores potent inhibition of 6 additional kinases (ABL1, CRAF, AXL, LYNA, LYNB, LCK), while, as expected, no kinases are preferentially inhibited by a head group without an N-atom positioned to form a H-bond. Together, these data afford important clues for inhibitor design when certain groups of kinases need to be targeted or spared. The matched set of compounds provide starting points toward the generation of selective kinase inhibitors for 36 distinct kinases.
Application to Abl kinase
Chronic myelogenous leukemia (CML) is driven by the fusion protein Bcr–Abl, which leads to a constitutively-activated Abl kinase domain. From the selectivity profile in Fig. 3A, it is apparent that head 2 inhibits fewer kinases compared to head 1 and could serve as the basis for a selective inhibitor of Abl kinase. To explore the role of head 2 in Abl binding, we docked the set of matched compounds in the Abl kinase domain ATP pocket to evaluate whether they bind in the expected conformation. The crystal structures of Abl bound to ponatinib (PDB ID 3OXZ)7 and to rebastinib (3QRI)6 were used as the receptor and docking using the Molecular Operating Environment (MOE) perfectly recapitulated the poses of the cognate ligands. 3OXZ was used to dock the t1 compounds (1, 3, and 5) and 3QRI was used to dock the t2 compounds (2, 4, and 6). The docked poses of t2 compounds are shown in Fig. 4 and t1 compounds showed similar poses. Compounds with h1 (1 and 2) and h2 (3 and 4) bound in a conformation such that the N-1 atom of the head group formed a H-bond with the NH of Met-318 in the hinge region of the kinase. This critical H-bond is also observed in cognate ligands of the crystal structures as well as most ATP-competitive tyrosine kinase inhibitors. The N-3 atom of the quinazoline ring (h1) in compounds 1 and 2 was not involved in any H-bonds. Thus, differences in the predicted potency and selectivity for h2 over h1 can be attributed to the difference in the lipophilicity. Compounds 5 and 6 docked in a conformation such that their h3 group perfectly overlapped the h2 poses and the N-atom in the 7-quinoline ring was facing away from the hinge region without forming any H-bonds. The poses observed through docking validated our design strategy and enabled studying the effects of subtle structural changes on potency and selectivity.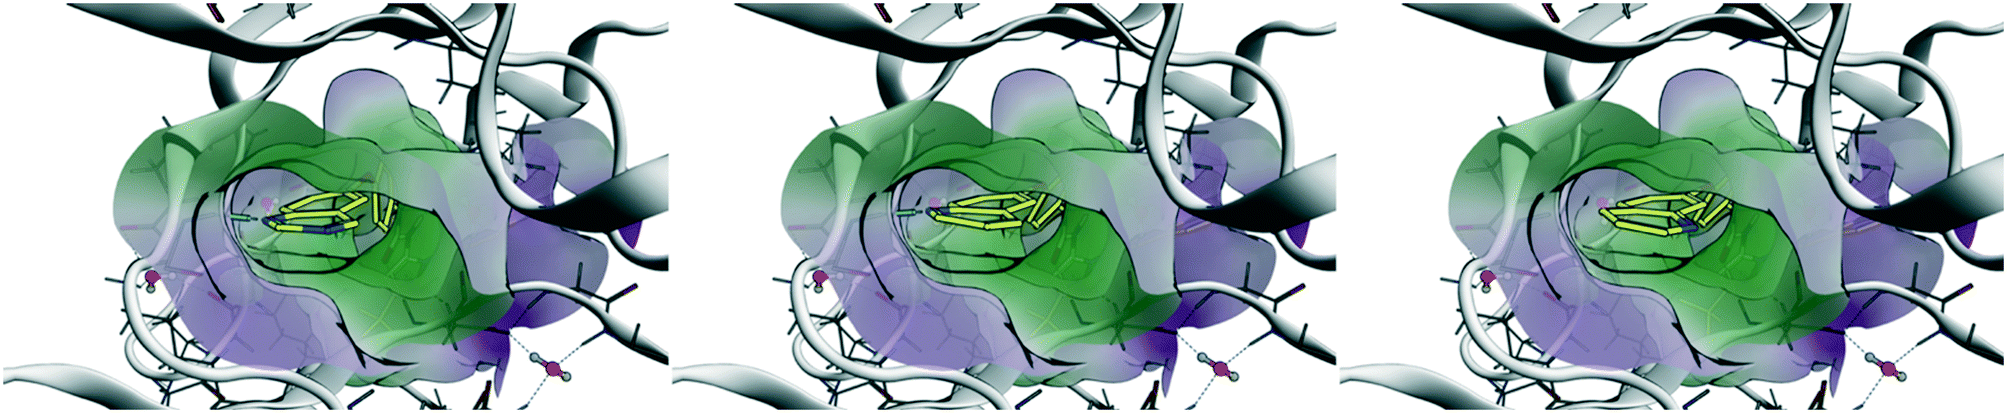 | ||
| Fig. 4 Results of docking t2 compounds into the ATP-binding pocket of 3QRI. Left – Compound 2 (h1), middle – compound 4 (h2), right – compound 6 (h3). The N-1 atom of h1 and h2 form a H-bond with Met-318. | ||
Evaluating target engagement in intact cells provides a method to measure potency under ‘real-world’ conditions and could prevent the often-encountered discrepancies between biochemical and cell efficacy. Toward this goal, we used the NanoBRET intracellular target engagement platform (Promega) to measure binding of the matched inhibitor set to ABL1 protein in cells (Table 2).
|
|
|
|||||||||
|---|---|---|---|---|---|---|---|---|---|---|
| Cmpd. | ABL1 WT | Ba/F3 ABL | Ba/F3 AblT315I | K562 | Cmpd. | ABL1 WT | Ba/F3 ABL | Ba/F3 ABLT315I | K562 | |
| IC50 ± SD (nM) | GI50 ± SD (nM) | GI50 ± SD (nM) | GI50 ± SD (nM) | IC50 ± SD (nM) | GI50 ± SD (nM) | GI50 ± SD (nM) | GI50 ± SD (nM) | |||
|
1 (h1–t1) | 15.7 ± 0.3 | 83 ± 63 | 117 ± 64 | 2.3 ± 1.6 | 2 (h1–t2) | 64.7 ± 4.2 | 66 ± 34 | 269 ± 112 | 4 ± 2.5 |
|
3 (h2–t1) | 38.3 ± 11.5 | 36 ± 15 | 162 ± 79 | 6.9 ± 1.5 | 4 (h2–t2) | 345 ± 109 | 164 ± 138 | 801 ± 419 | 13 ± 3 |
|
5 (h3–t1) | 637 ± 72 | >10![[thin space (1/6-em)]](https://www.rsc.org/images/entities/char_2009.gif) 000 000 |
>10000 |
451 ± 6 | 6 (h3–t2) | 719 ± 43 | >5000 | >10000 |
239 ± 53 |
Replacing one tail group with another across a series of compounds would give the same fold-change in potency for each pair of compounds (1vs.2, 3vs.4, 5vs.6) if binding to the hinge-region and hydrophobic back pocket of the kinase occurred in a non-cooperative manner. Our data reveal that this is not the case. While tail 1 is consistently more potent than tail 2 across all head groups (Table 2), the fold-differences in potencies are not the same across compound pairs. Compound 5 with a NanoBRET IC50 of 637 nM is equipotent with compound 6 (719 nM). In contrast, compound 1 (16 nM) is 4-fold more potent than 2 (65 nM), and 3 (38 nM) is close to 10-fold more potent than 4 (345 nM).
The quinazoline (h1) group is consistently more potent than the 6-quinoline (h2) group. These data are particularly interesting given that docking suggested that the extra N-3 atom of h1 does not form an additional H-bond with the hinge (Fig. 4, left). Compounds with the 7-quinoline (h3) group were substantially less potent than compounds with an h1 or h2 group. This is consistent with the docking results, where h3 compounds are not expected to form any H-bonds with the hinge region (Fig. 4, right). While the general trends remain the same in the other tail group, it is notable that the fold-differences in potencies are not maintained. For example, compound 3 is 17-fold more potent than compound 5. However, for the other tail group (t2), the difference in the two quinoline head groups (compound 4vs.6) shrinks to 2-fold.
Thus, our data reveal that binding to the hinge-region and the hydrophobic back pocket occurs in a cooperative manner. Three compounds in our set – 1, 2, and 3 – exploit this cooperativity to provide potent double-digit nanomolar inhibitors.
Next, we evaluated inhibitor potency in the murine cell line Ba/F3 transformed with the wild-type or T315I variant of the Bcr–Abl fusion protein and the K562 cell line, which is driven by the Bcr–Abl fusion protein and was derived from a chronic myelogenous leukemia (CML) patient in blast crisis (Table 2). As with the target engagement assay, compounds 1, 2, and 3 were consistently the most potent compounds across all cell lines tested. While the 7-quinoline-containing (head 3) compounds showed inhibition at their top doses, a GI50 value could not be calculated for some cell lines.
Compounds with tail 1 were generally more potent than compounds with tail 2 for both Ba/F3 cells, though potency against Ba/F3 T315I Abl cells was 2- to 5-fold lower than against Ba/F3 Abl cells. However, in the K562 cell line, t1 and t2 compounds appeared equipotent. Furthermore, while the NanoBRET IC50 value for each compound was in the same range as the Ba/F3 GI50 values, the K562 GI50 value was significantly lower. In the most extreme case, compound 4 with a target engagement IC50 of 345 nM shows a Ba/F3 Abl GI50 value of 164 nM but a K562 GI50 value of only 13 nM. Ba/F3 cells are entirely dependent on the Bcr-fusion protein, which is the sole driver of transformation. In contrast, the CML patient-derived K562 cell line exhibits a higher degree of complexity in its growth and could depend on other kinases in addition to Bcr–Abl due to multiple pathways being activated by its unstable genome.
Overall, we demonstrated that compounds 1–3 are novel and potent inhibitors of Abl kinase. Compound 2 is the most selective of the three compounds, however, compounds 1 and 3 are more potent in our cellular assays. Notably, all of these compounds are significantly more selective than ponatinib (Table S2†), which is the only FDA-approved drug that is effective against the T315I mutant. Compound 3 potently inhibits 13 other kinases (DDR2, EPHA8, FLT1,3,4, KDR, MUSK, PDGFRA,B, RET, MAP3K67, TEK), while compound 1 and ponatinib potently inhibit 18 and 42 other kinases, respectively. In addition to superior selectivity for Abl compared to ponatinib, compound 3 is active across multiple cell line models and against the gatekeeper mutated (T315I) Abl.
Application to Axl kinase
Axl kinase is a member of the TAM family of receptor tyrosine kinases (RTKs). The expression of Axl is increased in several cancers, including lung and triple-negative breast cancer. Recent studies have identified multiple and diverse roles for Axl signaling in cancer progression. Thus, Axl is an attractive, yet relatively novel target for cancer therapy. In our analysis of our matched inhibitor set, we identified head 2 and tail 2 being optimal and selective for binding to AXL. Thus, we hypothesized that compound 4 could be a selective and potent Axl inhibitor.While there have been several reported Axl inhibitors, most reported compounds are pan-RTK inhibitors. Thus, a selective inhibitor of Axl kinase is of great interest. The IC50 for compound 4 with Axl kinase was determined to be 12 nM (Reaction Biology Corp, Malvern, PA) (Fig. 5). The kinome-wide selectivity profile of compound 4 demonstrates that it is a highly selective inhibitor with limited off-targets, none of which are outside the TK and TK-like groups. Thus, compound 4 would be an excellent starting point for a lead optimization campaign for developing a selective and potent Axl inhibitor.
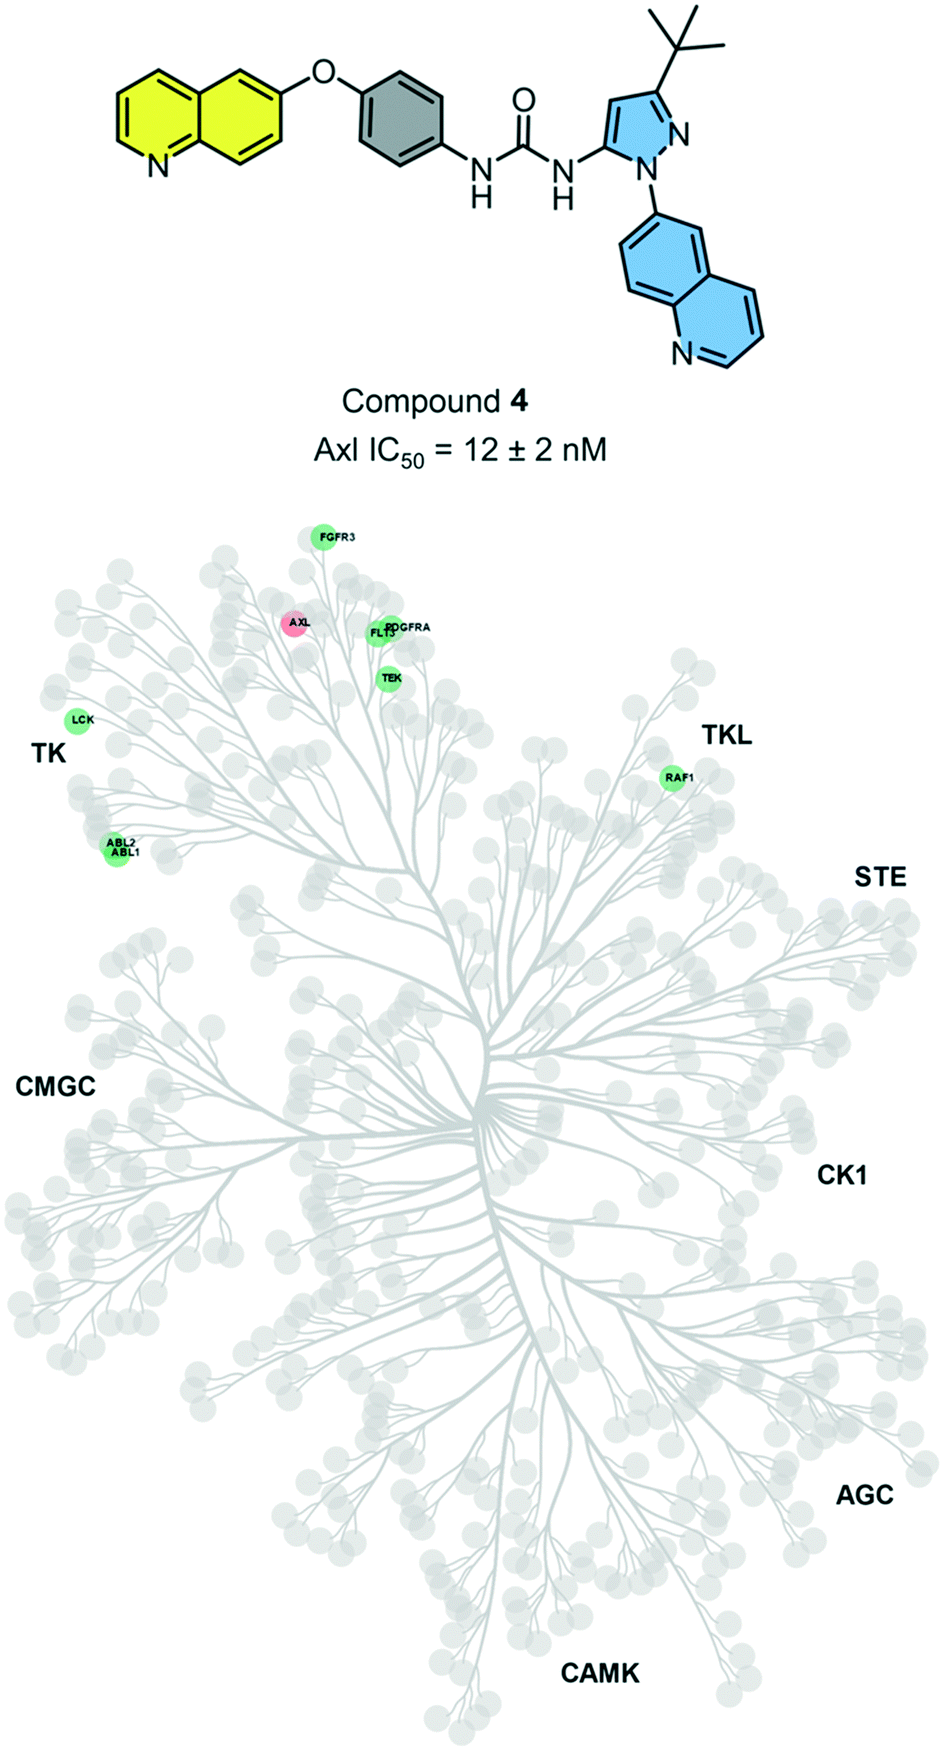 | ||
| Fig. 5 Kinases that are >75% inhibited by compound 4 are shown. Axl, shown in orange, has an IC50 of 12 ± 2 nM (error reported is the standard error of measurement). Axl IC50 was determined by Reaction Biology (Malvern, PA). | ||
Materials and methods
Inhibitors
Compounds 1–6 were synthesized as described in the ESI.†Docking
Protein preparation and docking was carried out using the Molecular Operating Environment (MOE) from the Chemical Computing Group (CCG). The X-ray crystal structures 3OXZ and 3QRI were loaded into MOE from the protein data bank (PDB). Chain B of 3QRI was deleted and the two structures were aligned and superimposed. The proteins were prepared using the Quickprep wizard in MOE where the sequence was preserved and neutralized, protonate3D was used for protonation, Asn/Gln/His “flips” were permitted, water molecules farther than 4.5 Å from the ligand or receptor were deleted, receptor atoms were tethered (strength 10, buffer 0.25), atoms farther than 8 Å from the ligand were fixed, and the model was refined to a rms gradient of 0.1 kcal mol−1 Å. Compound structures drawn in ChemDraw were saved as a SD file and opened in MOE as a database. The database was washed by keeping only the largest molecular fragment, explicit H were added, and 3D coordinates were rebuilt. The washed database was docked against the prepared protein structure receptor and solvent atoms with a site defined by the cognate ligand using ‘triangle matcher’ as the placement method. 30 poses were refined using a rigid receptor model and the top 5 scored poses were evaluated.NanoBRET target engagement intracellular kinase assay
The NanoBRET TE assay kit was purchased from Promega and carried out as described in the assay kit. HEK293 cells (ATCC) were used for transfection and intracellular compound binding to Abl was studied using the NanoLuc-Abl1 fusion expression vector (Promega). The K-4 tracer reagent (Promega) was used at a concentration of 100 nM. Compounds were tested in duplicate starting at a top concentration of 10 μM with 4-fold (compounds 2–4) or 3-fold (compounds 1, 5, 6) serial dilutions. A BRET ratio was calculated from the donor signal (415 nm) and acceptor signal (610 nm). Background BRET from a no-tracer control was subtracted and the resultant ratio was normalized and plotted in GraphPad Prism and fitted according to the equation Y = bottom + (top-bottom)/(1 + 10((X−LogIC50))) with no constraints. See ESI† for representative dose–response curves.Cell lines and cell culture
Human chronic myelogenous leukemia K562 cell line, and murine B-cell myeloma BaF3 wt Abl and BaF3 T315I Abl Luc+ cell lines were cultured in suspension in rpmi-1640 medium (Gibco), supplemented with 10% FBS “qualified” (Gibco), 1× L-glutamine (Gibco), and 1× pen–strep (Gibco) at 37 °C, and 5% CO2. Cells were assayed free of mycoplasma using MycoAlert™ (Lonza). Cell lines were obtained from ATCC and their identities were confirmed at time of experimentation using cell line authentication from ATCC.Cytotoxicity assays
All cell lines were plated in 96-well microtiter plates (Falcon white/clear flat bottom with lid) at 2500 cells per well in 100 μl volume and allowed to recover overnight. As a control we used vehicle (DMSO at 0.1% in wells). Also, drugs tested were at 0.1% DMSO in wells. Cells were treated for 72 h and cytotoxicity was determined using CellTiter-Glo® luminescent cell viability assay (Promega) based on quantitation of the ATP present in metabolically actives cells and following manufacturer recommendations. Luminescence was quantified using a Synergy H1 microplate reader (Biotek, Agilent). Integration time was set to 1 s. Data analysis and curve fitting was performed using GraphPad Prism software. See ESI† for dose–response curves.Axl kinase assay
Compound 4 inhibition of Axl kinase activity was measured using the radiometric HotSpot™ service provided by Reaction Biology Corp (Malvern, PA). A 10-dose series with 3-fold dilution starting at a compound concentration of 10 μM was used in the presence of ATP (10 μM) and peptide substrate (20 μM). Staurosporine was used as a positive control.Selectivity profiling
Inhibitors were prepared as 10 mM stocks in DMSO and supplied to Nanosyn Inc (Santa Clara, CA). Each inhibitor was screened at two concentrations – 100 nM and 1 μM.Data analysis
Analysis of the differences in selectivity profiles of compounds was carried out using Python. Kinome dendrograms were prepared using the web application Coral.8Conclusions
Using a matched set of inhibitors, we systematically explored the effects of structural changes on the potency and selectivity of kinase inhibitors. We have identified kinases that show no preference for two commonly used tail groups and have identified others that display a clear preference for the 4-((4-methylpiperazin-1-yl)methyl)-3-(trifluoromethyl)aniline tail or the 3-(tert-butyl)-1-(quinolin-6-yl)-1H-pyrazol-5-amine tail. We used our selectivity analysis to identify potent inhibitors of Axl and wild-type/T315I mutant Abl.Conflicts of interest
There are no conflicts to declare.Acknowledgements
This work was funded by the National Institutes of Health Grant R01 GM125881 to M. B. S. S. D. M. is supported, in part, by the Breast Cancer Research Foundation. T. K. J. was funded, in part, by a National Institutes of Health Cellular Biotechnology Training Grant (GM008353).References
- M. I. Davis, J. P. Hunt, S. Herrgard, P. Ciceri, L. M. Wodicka, G. Pallares, M. Hocker, D. K. Treiber and P. P. Zarrinkar, Comprehensive analysis of kinase inhibitor selectivity, Nat. Biotechnol., 2011, 29, 1046–1051 CrossRef CAS.
- J. M. Elkins, V. Fedele, M. Szklarz, K. R. Abdul Azeez, E. Salah, J. Mikolajczyk, S. Romanov, N. Sepetov, X. P. Huang, B. L. Roth, A. Al Haj Zen, D. Fourches, E. Muratov, A. Tropsha, J. Morris, B. A. Teicher, M. Kunkel, E. Polley, K. E. Lackey, F. L. Atkinson, J. P. Overington, P. Bamborough, S. Muller, D. J. Price, T. M. Willson, D. H. Drewry, S. Knapp and W. J. Zuercher, Comprehensive characterization of the Published Kinase Inhibitor Set, Nat. Biotechnol., 2016, 34, 95–103 CrossRef CAS PubMed.
- F. E. Kwarcinski, K. R. Brandvold, S. Phadke, O. M. Beleh, T. K. Johnson, J. L. Meagher, M. A. Seeliger, J. A. Stuckey and M. B. Soellner, Conformation-Selective Analogues of Dasatinib Reveal Insight into Kinase Inhibitor Binding and Selectivity, ACS Chem. Biol., 2016, 11, 1296–1304 CrossRef CAS PubMed.
- Z. Zhao, H. Wu, L. Wang, Y. Liu, S. Knapp, Q. Liu and N. S. Gray, Exploration of type II binding mode: A privileged approach for kinase inhibitor focused drug discovery?, ACS Chem. Biol., 2014, 9, 1230–1241 CrossRef CAS PubMed.
- W. S. Huang, C. A. Metcalf, R. Sundaramoorthi, Y. Wang, D. Zou, R. M. Thomas, X. Zhu, L. Cai, D. Wen, S. Liu, J. Romero, J. Qi, I. Chen, G. Banda, S. P. Lentini, S. Das, Q. Xu, J. Keats, F. Wang, S. Wardwell, Y. Ning, J. T. Snodgrass, M. I. Broudy, K. Russian, T. Zhou, L. Commodore, N. I. Narasimhan, Q. K. Mohemmad, J. Iuliucci, V. M. Rivera, D. C. Dalgarno, T. K. Sawyer, T. Clackson and W. C. Shakespeare, Discovery of 3-[2-(imidazo[1,2-b]pyridazin-3-yl)ethynyl]-4-methyl-N-{4-[(4-methylpiperazin-1-y l)methyl]-3-(trifluoromethyl)phenyl}benzamide (AP24534), a potent, orally active pan-inhibitor of breakpoint cluster region-abelson (BCR-ABL) kinase including the T315I gatekeeper mutant, J. Med. Chem., 2010, 53, 4701–4719 CrossRef CAS PubMed.
- W. W. Chan, S. C. Wise, M. D. Kaufman, Y. M. Ahn, C. L. Ensinger, T. Haack, M. M. Hood, J. Jones, J. W. Lord, W. P. Lu, D. Miller, W. C. Patt, B. D. Smith, P. A. Petillo, T. J. Rutkoski, H. Telikepalli, L. Vogeti, T. Yao, L. Chun, R. Clark, P. Evangelista, L. C. Gavrilescu, K. Lazarides, V. M. Zaleskas, L. J. Stewart, R. A. Van Etten and D. L. Flynn, Conformational control inhibition of the BCR-ABL1 tyrosine kinase, including the gatekeeper T315I mutant, by the switch-control inhibitor DCC-2036, Cancer Cell, 2011, 19, 556–568 CrossRef CAS.
- T. Zhou, L. Commodore, W. S. Huang, Y. Wang, M. Thomas, J. Keats, Q. Xu, V. M. Rivera, W. C. Shakespeare, T. Clackson, D. C. Dalgarno and X. Zhu, Structural mechanism of the Pan-BCR-ABL inhibitor ponatinib (AP24534): lessons for overcoming kinase inhibitor resistance, Chem. Biol. Drug Des., 2011, 77, 1–11 CrossRef CAS PubMed.
- K. S. Metz, E. M. Deoudes, M. E. Berginski, I. Jimenez-Ruiz, B. A. Aksoy, J. Hammerbacher, S. M. Gomez and D. H. Phanstiel, Coral: Clear and Customizable Visualization of Human Kinome Data, Cell Syst., 2018, 7, 347–350 e1 CrossRef CAS PubMed.
Footnote |
| † Electronic supplementary information (ESI) available: ESI tables, figures, synthesis scheme and methods, spectra, representative IC50 curves and cell GI50 curves are available in the ESI. See DOI: 10.1039/d1md00296a |
| This journal is © The Royal Society of Chemistry 2022 |