
 Open Access Article
 This Open Access Article is licensed under a Creative Commons Attribution-Non Commercial 3.0 Unported Licence
Process optimisation for NASICON-type solid electrolyte synthesis using a combination of experiments and bayesian optimisation†
Hayami
Takeda
 *a,
Hiroko
Fukuda
a,
Koki
Nakano
a,
Syogo
Hashimura
a,
Naoto
Tanibata
a,
Masanobu
Nakayama
a,
Yasuharu
Ono
b and
Takaaki
Natori
b
*a,
Hiroko
Fukuda
a,
Koki
Nakano
a,
Syogo
Hashimura
a,
Naoto
Tanibata
a,
Masanobu
Nakayama
a,
Yasuharu
Ono
b and
Takaaki
Natori
b
aDepartment of Advanced Ceramics, Nagoya Institute of Technology, Gokiso, Showa, Nagoya, Aichi 466-8555, Japan. E-mail: takeda.hayami@nitech.ac.jp
bTOAGOSEI CO., LTD., General Center of R&D, 8, Showa-cho, Minato-ku, Nagoya, 455-0026, Japan
First published on 11th October 2022
Abstract
Na superionic conductor (NASICON)-type LiZr2(PO4)3 (LZP) is an oxide-based solid electrolyte candidate for use in all-solid-state Li-ion batteries. However, as the ionic conductivity is insufficient, doping with aliovalent cations has been carried out to improve the Li-ion conductivity by controlling the composition and crystal structure. Li-ion conductivity is also affected by the microstructural properties of a sintered body, such as density, morphology, and elemental distribution, and thus, controlling process parameters, such as heating conditions during the solid-state reaction, improves conductivity. Using an exhaustive experimental approach, Ca and Si co-doped Li-rich NASICON-type LZP was synthesised via solid-state reactions under various two-step heating conditions to yield the highest Li-ion conductivity by optimising the conditions. The highest total Li-ion conductivity of 3.3 × 10⁻⁵ S cm−1 was obtained when the sample was first heated at 1050 °C and then heated at 1250 °C. The crystal structures, relative densities, micromorphologies, and Li-ion conductivities of the materials were characterised, and their relationships were investigated. These relationships were complex, and intuitively determining the optimal conditions was challenging with only a few experiments. Instead, as a proof-of-concept study, the collected data were used to demonstrate that Bayesian optimisation (BO) efficiently improved the experimental determination of the optimal heating conditions. The BO-guided experimental investigation determined the optimal conditions more rapidly compared to conventional trial-and-error approaches employed in the materials industry. The efficiency factor was approximately double that of the exhaustive search.
Introduction
Research and development of large-scale rechargeable Li-ion batteries are critical, as they are essential for use in electric vehicles and aircraft1 and the realisation of new social infrastructure, such as smart grids. However, safety concerns due to the usage of flammable organic electrolytes in current Li-ion batteries should be addressed. Replacement of the liquid electrolyte with a non-flammable inorganic solid electrolyte in fabricating an all-solid-state Li-ion battery is an attractive option, and thus, several Li-ion conductors have been intensively studied.2,3 Typical inorganic solid electrolytes include sulfides and oxides.4–7 Sulfide electrolytes, such as Li10GeP2S12, exhibit high Li-ion conductivities,8–11 but sulfides are unstable in the atmosphere and generally react with water, forming toxic H2S.12 Conversely, oxide-based solid electrolytes should display excellent chemical stabilities, although their Li-ion conductivities are generally lower than those of sulfides, partly due to strong interactions between Li+ and O2−.13 Oxide-based solid electrolytes with Na superionic conductor (NASICON),14,15 garnet,16,17 or perovskite structures18,19 are representative fast Li-ion conductors. Among these, NASICON-type LiZr2(PO4)3 (LZP) gained particular interest, as stable charge/discharge cycles were reported using Li metal/LZP/LiFePO4 all-solid-state Li metal batteries.20 LZP exhibits four crystalline phases (polymorphs), denoted as α-, α′-, β-, and β′-phases,21–23 which depend on the sintering conditions.15,24 The Li-ion conductivity, including bulk and grain-boundary contributions, of the α-phase is the highest at ∼10−6 S cm−1 at room temperature.25,26 However, as the ionic conductivity is insufficient for use in all-solid-state Li-ion (metal) batteries, substitution with aliovalent cations was attempted to improve the Li-ion conductivity,21,27–31e.g. the replacement of the Zr4+ ions in LZP with lower-valence cations, such as Ca2+, led to the formation of interstitial Li ions, which enhanced the Li push-out mechanism due to double-Li occupancies close to the 6b sites.14 However, further replacement with dopant cations reduced the ionic conductivity due to the trapping effect between the dopant and Li ions.32 Thus, carefully controlling the dopant ions, e.g. via co-doping, is necessary to optimise the Li-ion conductivity.24,33 Besides compositional control, Li-ion conductivity is also affected by density, morphology, and elemental distribution,21 and thus, controlling process parameters, such as heating conditions during the solid-state reaction, is effective in improving conduction performance.34Optimising the composition and production process is critical for use in the materials industry, but the traditional trial-and-error approach often requires economic cost and time. Previously, machine learning was successful in improving materials,35 and we successfully demonstrated the efficient compositional optimisation of experimental Li-ion conductivity using Bayesian optimisation (BO) of Li(1+2x+y)CaxYyZr(2−x−y)(PO4)3 and (LiyLa(1−y)/3)(1−x)Sr0.5xNbO3.24,36 Additionally, BO should be a suitable approach in analysing production processes for which the optimal parameters are challenging to determine manually or heuristically.37 BO is applied to establish parameters in polymer fibre synthesis,38 TiO2 film deposition,39 gas atomisation of alloy powders,40 and permanent magnet synthesis.41 However, reports of process optimisation in terms of Li-ion conductors are limited.
Thus, in this study, we focused on double-doped LZP Li1.45Ca0.15Zr1.85Si0.15P2.85O12 (LZP-CS), because the compound shows improved Li-ion conductivity. Ca and Si ions partially occupy octahedral Zr and tetrahedral P sites in LZP-CS.15,24 The sintered bodies of LZP-CS samples were synthesised via conventional solid-state reactions with 54 different two-step heating conditions, and the resultant 54 sintered bodies were investigated exhaustively in terms of phase stability, sintered structure, and ionic conductivity. Furthermore, BO was adopted for these 54 datasets to reveal efficient processing parameter optimisations. This study mainly focused on the optimisation of the experimental process.
Experimental
Li1.45Ca0.15Zr1.85Si0.15P2.85O12 was synthesised via conventional solid-state reactions at 54 different heating conditions. Li2CO3 (99.9%; Kojundo Chemical Laboratory, Sakado, Japan), ZrO2 (99.9%; Kishida Chemicals, Osaka, Japan), CaCO3 (99.5%; Kishida Chemicals), SiO2 (99.9%; Kojundo Chemical Laboratory), and Zr(HPO4)·1.5H2O (Toagosei, Tokyo, Japan) were used as raw materials. Stoichiometric amounts of these raw materials were mixed in alumina mortars with distilled water in a 1![[thin space (1/6-em)]](https://www.rsc.org/images/entities/char_2009.gif) :2 mass ratio. The mixed powders were dried at 100 °C and pelletised under uniaxial pressing at 127 MPa. The pellets were calcined for 4 h at nine different temperatures (1st heating): 900, 950, 1000, 1050, 1100, 1150, 1200, 1250, or 1300 °C. After the 1st heating, samples were ball-milled using a ZrO2 pot and balls (diameters of 10 mm) at 400 rpm for 30 min using a planetary ball mill (Pulverisette 7, Fritsch, Idar-Oberstein, Germany). Thereafter, samples were re-pelletised and sintered for 4 h at six different temperatures (2nd heating): 1100, 1150, 1200, 1250, 1300, or 1350 °C. Hereafter, heating conditions are denoted as ‘HC-X–Y’, where X and Y correspond to the 1st and 2nd heating temperatures (°C). The sample size was approximately 9 mm in diameter and 1.5 mm in thickness. The crystal phase of the sample was determined by X-ray diffraction (XRD) using a MiniFlex 600 diffractometer (Rigaku, Tokyo, Japan) with CuKα radiation. The micromorphology of the sample was evaluated using scanning electron microscopy (SEM, JSM-6360LV, JEOL, Tokyo, Japan), and elemental analysis was performed using energy-dispersive X-ray spectroscopy (EDS, JSM-6010LA, JEOL). The ionic conductivities of the bulk structures of the pellets after the 2nd heating were measured via AC impedance. Both faces were polished with 2000-grit abrasive papers and Au was sputtered to produce the electrodes. The complex impedance was measured using an impedance analyser (VMP-300, BioLogic, Seyssinet-Pariset, France) at 30, 60, and 90 °C in the frequency range 1–106 Hz with a potential of 1 V. The activation energy of the Li conductivity was estimated using Arrhenius plots of the measured Li-ion conductivity. The experimentally determined bulk densities, ionic conductivities, and activation energies are presented in Table S1 (ESI†).
:2 mass ratio. The mixed powders were dried at 100 °C and pelletised under uniaxial pressing at 127 MPa. The pellets were calcined for 4 h at nine different temperatures (1st heating): 900, 950, 1000, 1050, 1100, 1150, 1200, 1250, or 1300 °C. After the 1st heating, samples were ball-milled using a ZrO2 pot and balls (diameters of 10 mm) at 400 rpm for 30 min using a planetary ball mill (Pulverisette 7, Fritsch, Idar-Oberstein, Germany). Thereafter, samples were re-pelletised and sintered for 4 h at six different temperatures (2nd heating): 1100, 1150, 1200, 1250, 1300, or 1350 °C. Hereafter, heating conditions are denoted as ‘HC-X–Y’, where X and Y correspond to the 1st and 2nd heating temperatures (°C). The sample size was approximately 9 mm in diameter and 1.5 mm in thickness. The crystal phase of the sample was determined by X-ray diffraction (XRD) using a MiniFlex 600 diffractometer (Rigaku, Tokyo, Japan) with CuKα radiation. The micromorphology of the sample was evaluated using scanning electron microscopy (SEM, JSM-6360LV, JEOL, Tokyo, Japan), and elemental analysis was performed using energy-dispersive X-ray spectroscopy (EDS, JSM-6010LA, JEOL). The ionic conductivities of the bulk structures of the pellets after the 2nd heating were measured via AC impedance. Both faces were polished with 2000-grit abrasive papers and Au was sputtered to produce the electrodes. The complex impedance was measured using an impedance analyser (VMP-300, BioLogic, Seyssinet-Pariset, France) at 30, 60, and 90 °C in the frequency range 1–106 Hz with a potential of 1 V. The activation energy of the Li conductivity was estimated using Arrhenius plots of the measured Li-ion conductivity. The experimentally determined bulk densities, ionic conductivities, and activation energies are presented in Table S1 (ESI†).
BO was performed using the COMmon BO library (COMBO)42 to evaluate the efficiency of the optimised heating condition to obtain the highest ion conductivity or minimum activation energy among the experimentally evaluated samples. The conductivities at 30 °C and activation energies were used as the objective variables, and the calcination and sintering temperatures were used as descriptors in BO. Gaussian kernels were used and hyperparameters were automatically optimised at every step by maximising the type II likelihood, as implemented in the COMBO library.42 The random and BO searches were performed 1000 times each, and the average numbers of observations required to reach the optimal solution were compared. The expected improvement strategy was used to obtain the acquisition function.36
Results and discussion
Crystal phase identification
Fig. 1(a) shows the XRD patterns of the samples after the 1st heating and simulated patterns based on inorganic crystal structure database (ICSD)-derived structure inputs of α-LiZr2(PO4)3 (#201935) and β-LiZr2(PO4)3 (#91113). The primary products after the 1st heating at 900–1050 °C and 1100–1300 °C are β- and α-type, respectively. The α- and β-phases coexist in the samples heated at >1100 °C but <1250 °C, as indicated by the diffraction peaks at 2θ ≈ 15.8°, 25.8°, and 26.5°, which are characteristic of the β-phase. Fig. 1(b) shows the XRD patterns of HC-1050–Y (1100 ≤ Y ≤ 1350) and the ICSD-derived simulated pattern of monoclinic ZrO2 (#68782), in addition to the simulated patterns of α- and β-LiZr2(PO4)3 shown in Fig. 1(a). When the 1st heating temperature is <1200 °C, the β-phase is the main phase. However, when the 2nd heating temperature is >1250 °C, the characteristic peaks of the β-phase are not observed, indicating that the sample exhibits a single α-phase. Ca-doped LZP requires heating at 1200 °C to yield the single α-phase,15 whereas LZP co-doped with Ca and Si requires a higher temperature to yield the single α-phase. Temperatures of 2nd heating of >1300 °C yield samples with higher intensities at 2θ ≈ 28.4° and 31.5° compared to those of the α-phase simulated pattern (#201935). These peaks are consistent with the characteristic peaks of monoclinic ZrO2 (#68782), suggesting the formation of ZrO2. Similar results are observed when the temperature of the 1st heating is 900, 950, 1000, 1100, 1150, 1200, 1250, or 1300 °C.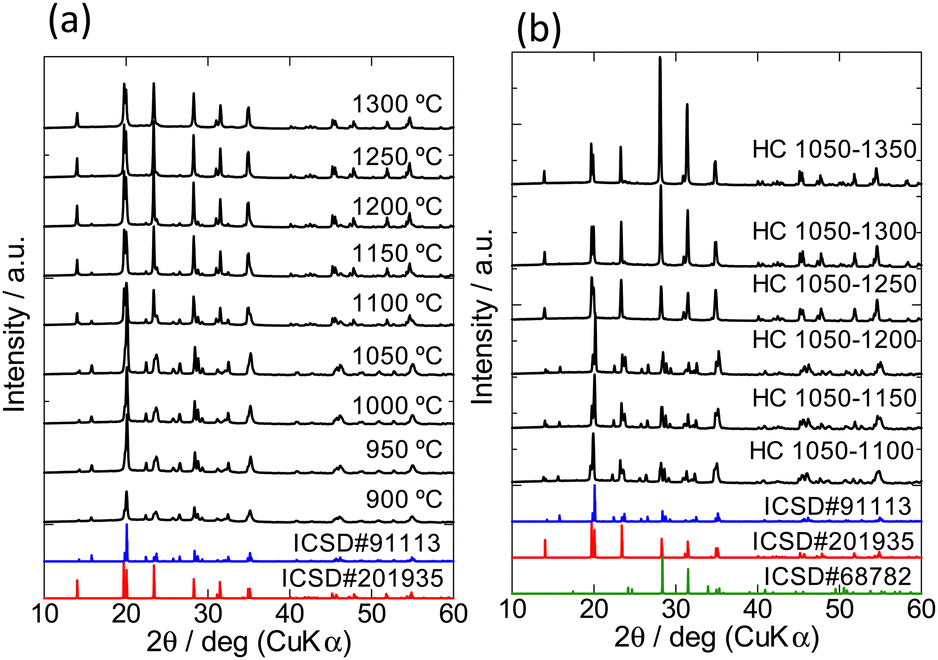 | ||
| Fig. 1 X-Ray diffraction (XRD) patterns of the samples. (a) Samples after the 1st heating at temperatures ranging from 900 to 1300 °C and simulated patterns of α- and β-LiZr2(PO4)3, which are #201935 and #91113, respectively, in the inorganic crystal structure database (ICSD) (b) XRD patterns of HC-1050–Y (1100 ≤ Y ≤ 1350) samples, the same simulated patterns shown in (a), and the ICSD-derived simulated pattern of monoclinic ZrO2 (#68782). | ||
Relative density and micromorphology
The bulk densities of all samples are shown as a heatmap in Fig. 2(a). The black dots in the mesh correspond to the sample treatments. When the 1st heating temperature is higher and the 2nd heating temperature is lower, the bulk density generally increases. Conversely, the opposite trend is observed when the 2nd heating temperature increases, e.g., Fig. 2(b) shows the mass losses of the samples as a function of the 2nd heating temperature after the samples are preheated at 900 °C (1st heating temperature). A gradual decrease in the bulk density is observed upon increasing the 2nd heating temperature. A particularly large mass loss is observed when the heating temperature is increased from 1300 to 1350 °C. Therefore, the mass loss is ascribed to the evaporation of oxides with high vapor pressures, such as Li2O and P2O5.24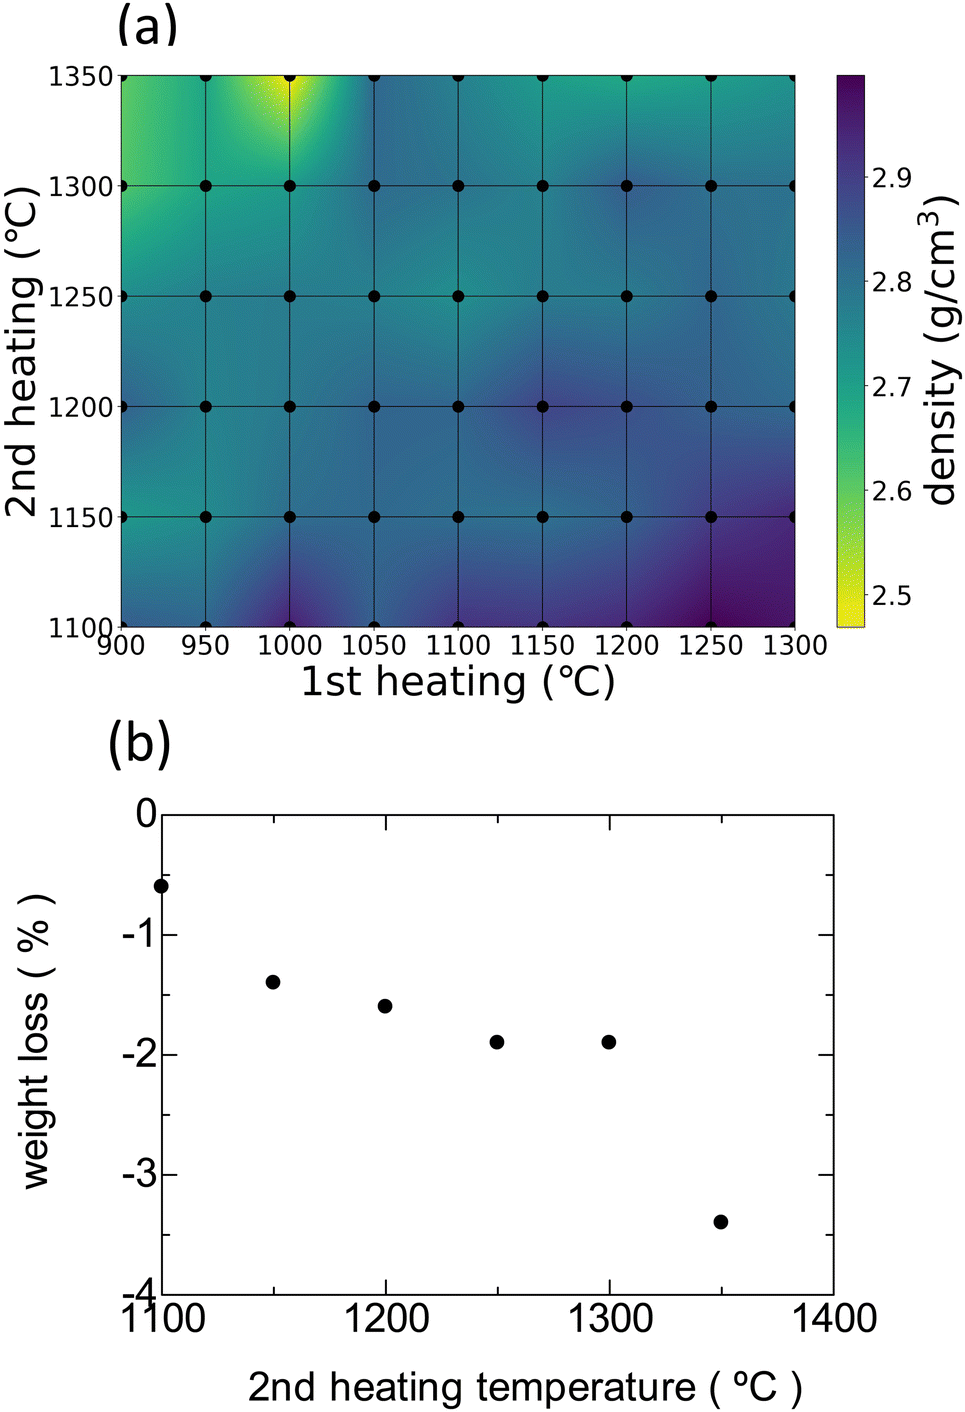 | ||
| Fig. 2 (a) Bulk densities of the HC-X–Y (900 ≤ X ≤ 1300, 1100 ≤ Y ≤ 1350) samples. (b) Mass losses of the HC-900–Y (1100 ≤ Y ≤ 1350) samples. | ||
SEM images of the sample surfaces are shown in Fig. 3. The HC-X-1100 samples (Fig. 3(a–c)) form entangled structures with micrometre-sized needle-like crystals. These crystal morphologies are mainly due to the crystal structures, as the main phases of these samples consist of the β-type polymorphs. EDS of these samples reveals homogeneous distributions of constituent elements, except Li, in the sintered bodies (Fig. S1, ESI†). Fig. 3(d, h, and i) show the SEM images of samples after 2nd heating at ≥1250 °C, wherein the main phases are α-type polymorphs. Unlike the needle-like crystals observed in the β-type polymorph phase, the particles in the sintered bodies do not display specific crystal habits, and their aspect ratios are small. EDS mapping indicates the segregation of Ca-containing phases in the grain-boundary regions of the samples, HC-900–1250 and HC-1050–1250, as shown in Fig. S2 (ESI†). A Ca-rich boundary phase was observed in Ca-doped LZP by Xie et al.15 In HC-1300–1250, several angular particles and voids are observed, which may be due to thermal evaporation of volatile components. In the HC-X–1350 samples (Fig. 3(g–i)), particle growth is observed, and the particle size gradually decreases with an increase in the 1st heating temperature. HC-1300–1350 displays larger voids than those of HC-1300–1250 in their sintered bodies, indicating further evaporation of volatile components. This should be the evaporation-derived loss of sintering aids via the high-temperature 1st heating, as shown in Fig. 2(b), i.e. suppression of the 1st heating temperature prevents the evaporation of volatile components. Conversely, an increase in the 2nd heating temperature leads to particle growth, which reduces the density of the sintered body.
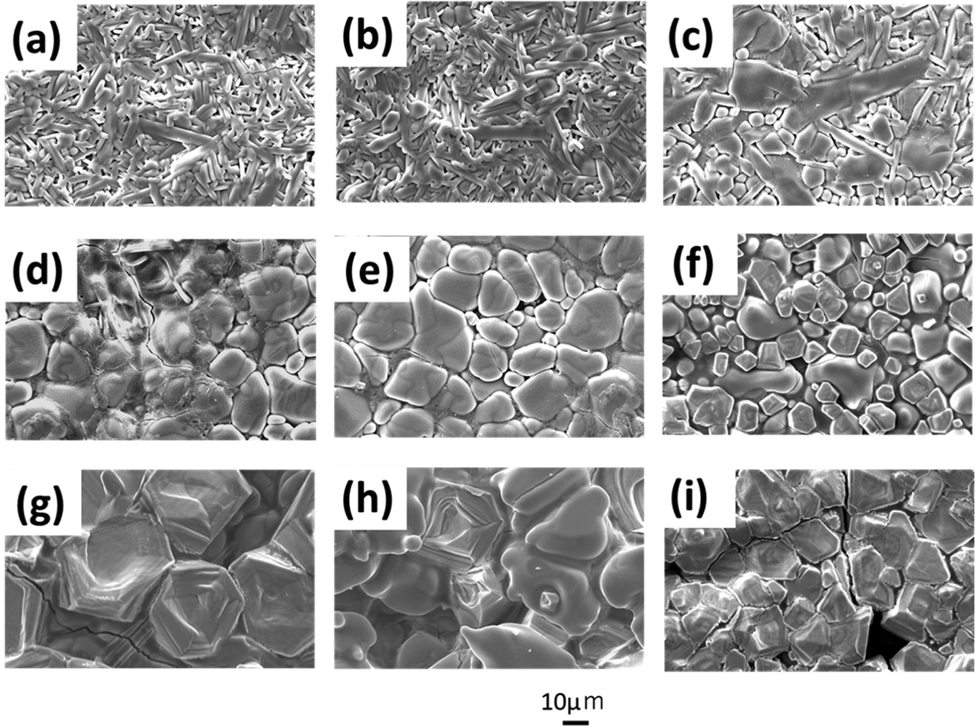 | ||
| Fig. 3 Scanning electron microscopy images of the sample surfaces. (a) HC-900–1100, (b) HC-1050–1100, (c) HC-1300–1100, (d) HC-900–1250, (e) HC-1050–1250, (f) HC-1300–1250, (g) HC-900–1350, (h) HC-1050–1350, and (i) HC-1300–1350. | ||
Li-ion conductivity
Fig. 4 shows the typical AC impedance plots at 30 °C of the (a) HC-1050–1200 and (b) HC-1050–1250 sintered bodies. The AC impedance plots consist of semicircles and spikes in the high- and low-frequency regions, respectively. The low-frequency spike corresponds to the capacitance at the interface between the LZP and Au electrode. A single distorted semicircle and two semicircles are observed for (a) HC-1050–1200 and (b) HC-1050–1250, respectively, and thus, the semicircles contain bulk and grain-boundary resistance contributions.43 In HC-1050–1250, the ionic conductivities of the bulk and grain boundary are 7.0 × 10⁻⁵ and 5.6 × 10⁻⁵ S cm−1 (at 30 °C), respectively, with a total ionic conductivity of 3.3 × 10⁻⁵ S cm−1 based on fitting using an equivalent circuit model. However, the separation of the two resistance components is technically challenging in the case of a single distorted semicircle, e.g., HC-1050–1200. Thus, hereafter, the Li-ion conductivity reported in this study contains both resistance components (total ionic conductivity).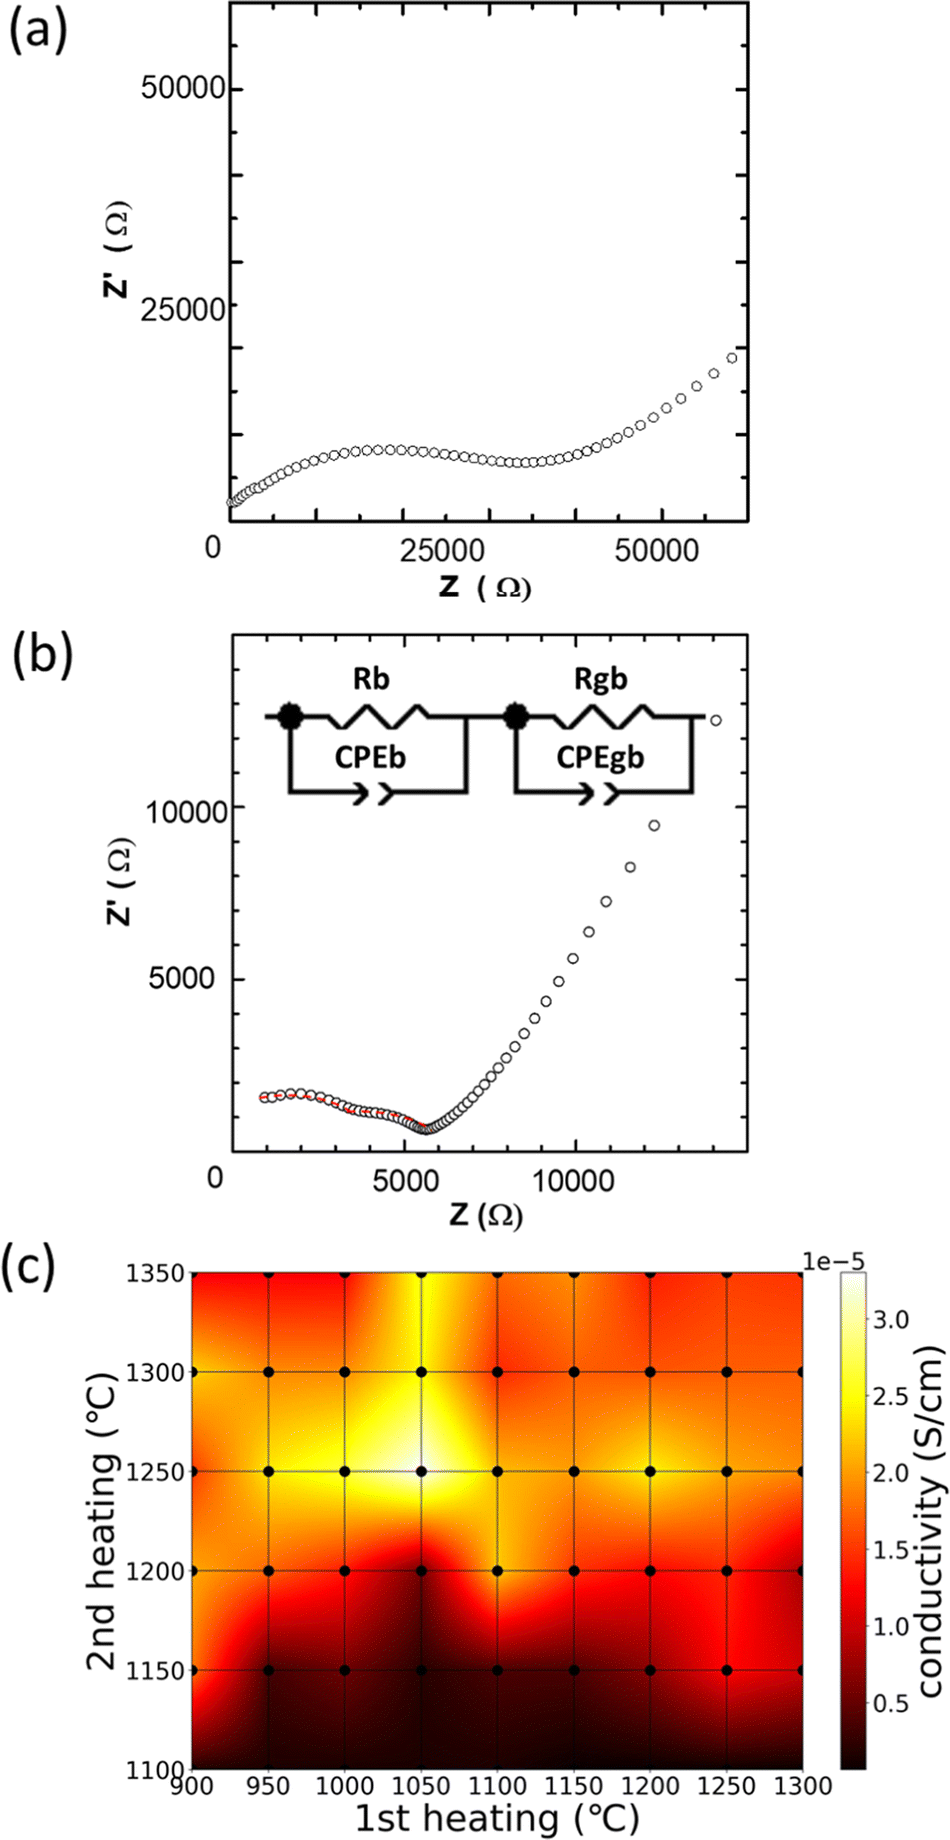 | ||
| Fig. 4 (a) AC impedance plot of HC-1050–1200 at 30 °C, (b) AC impedance plot of HC-1050–1250 at 30 °C with a fitted curve (red solid line), and (c) heatmap of the ion conductivities of all samples at 30 °C. | ||
Fig. 4(c) shows the distribution of the total ionic conductivity at 30 °C as a heatmap, as functions of 1st and 2nd heating conditions (dots in the mesh correspond to the preparation conditions). Compared to Fig. 2(a), no clear correlation between conductivity and bulk density is observed. The samples with lower sintering temperatures during the 2nd heating exhibit lower conductivities due to the formation of the low-conducting β-phase.23,24 The conductivities of the samples with 1st heating temperatures of >1100 °C are lower than those of the samples with 1st heating temperatures of <1050 °C. Similarly, decreased ionic conductivities are observed after the 2nd heating at temperatures of >1250 °C. This may be due to the vaporisation of volatile compounds, such as Li2O and P2O5, as indicated in Fig. 2(b), and segregation of Ca-containing compounds at the grain boundary. Therefore, control of the 1st and 2nd heating conditions is required to optimise Li-ion conductivity. HC-1050–1250 exhibits the highest total conductivity of 3.3 × 10⁻⁵ S cm−1 at 30 °C, which may be attributed to less segregation of Ca components at the grain boundary and little component loss via evaporation.
Fig. 5(a) shows the Arrhenius plots of the total ionic conductivities of all samples. The minimum activation energy is 0.31 eV for HC-1250–1250 (orange line in Fig. 5(a)). The heating condition dependences of the activation energies calculated using the Arrhenius plots are shown in Fig. 5(b). The grey, orange, and blue dots in Fig. 5(a) are the calculated points. Generally, a decrease in activation energy leads to an increase in ionic conductivity, and this trend is roughly observed in the heatmap of activation energies, as shown in Fig. 5(b), in comparison with that of ionic conductivity, as shown in Fig. 4(c). However, the optimised heating condition differs slightly in terms of the activation energy (HC-1250–1250) and Li-ion conductivity (HC-1050–1250). Therefore, the ionic conductivity also depends on parameters such as carrier concentration and grain-boundary structures. Hence, the relatively low ionic conductivity of HC-1250–1250, despite the lowest activation energy, is due to the vaporisation of Li during the 1st high-temperature heating. To summarise the results shown in Fig. 2–5, the heating conditions affect various parameters, such as the crystal phase, density, microstructure, elemental distribution, and composition deviation via vaporisation, and thus, the ionic conductivity–related properties. The relationship among these observations is quite complex, and therefore, intuitive determination of the optimised heating conditions is challenging with only a few experiments.
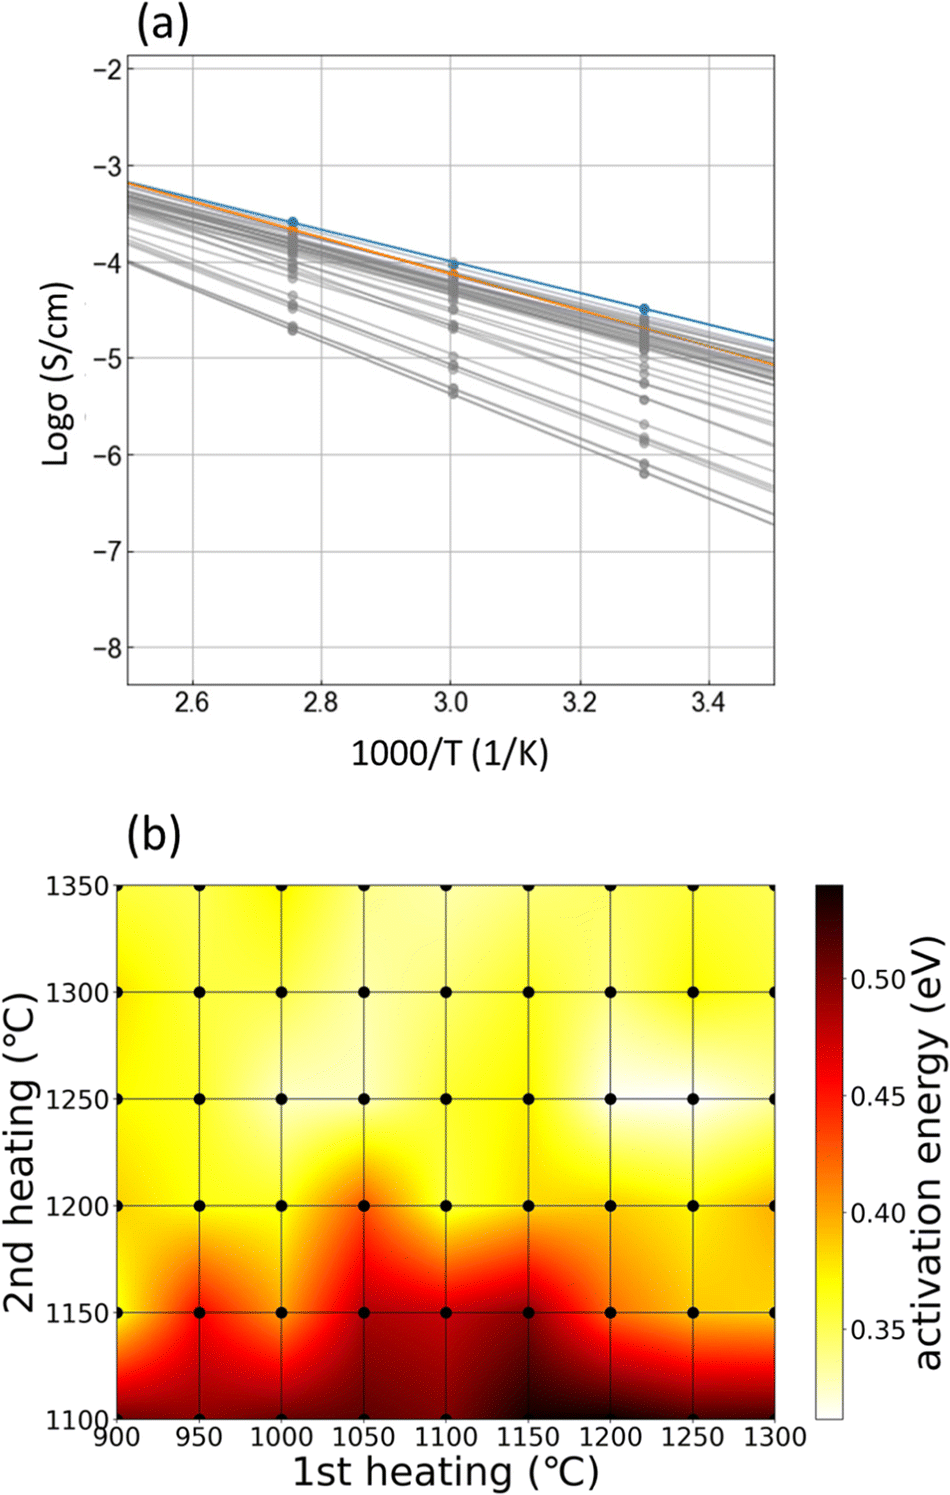 | ||
| Fig. 5 (a) Arrhenius plots of all samples. The orange line indicates HC-1250–1250, which exhibits the minimum activation energy, and the blue line indicates HC-1050–1250, which exhibits the maximum Li-ion conductivity at 30 °C. (b) Heatmap of the activation energies of all samples. | ||
Determining the optimal conditions using BO
BO is performed to reduce the optimisation cost. As this study was a demonstration, i.e., proof-of-concept, all our experimental datasets containing various 1st and 2nd heating conditions were used. These datasets were invisible to the Bayesian optimiser prior to optimisation, and the hidden experimental data were opened in line with the instructions by the Bayesian optimiser, except at the first random selection step. Similarly, random sample selection was also applied for comparison. One thousand independent search cycles were performed using each selection scheme. Fig. 6 shows changes in the probability of establishing the highest ionic conductivity and the lowest activation energy as functions of the number of experiments (observations). Fig. S3 and S4 (ESI†) show the histograms of the number of observations required to determine the heating conditions affording the highest ionic conductivity and the lowest activation energy, respectively. In both cases, a mountainous distribution is observed. As shown in Fig. 6(a and b), during the initial 10–15 steps, the probability of discovery ratio of the BO search is slightly lower than or almost equal to that of the random search. This may indicate that exploration is prioritised to form a reliable prediction function. After the initial 10–15 steps, the probability of discovery ratio of the BO search increases rapidly, which corresponds to an exploitation search because of less uncertainty for the prediction function in the search space.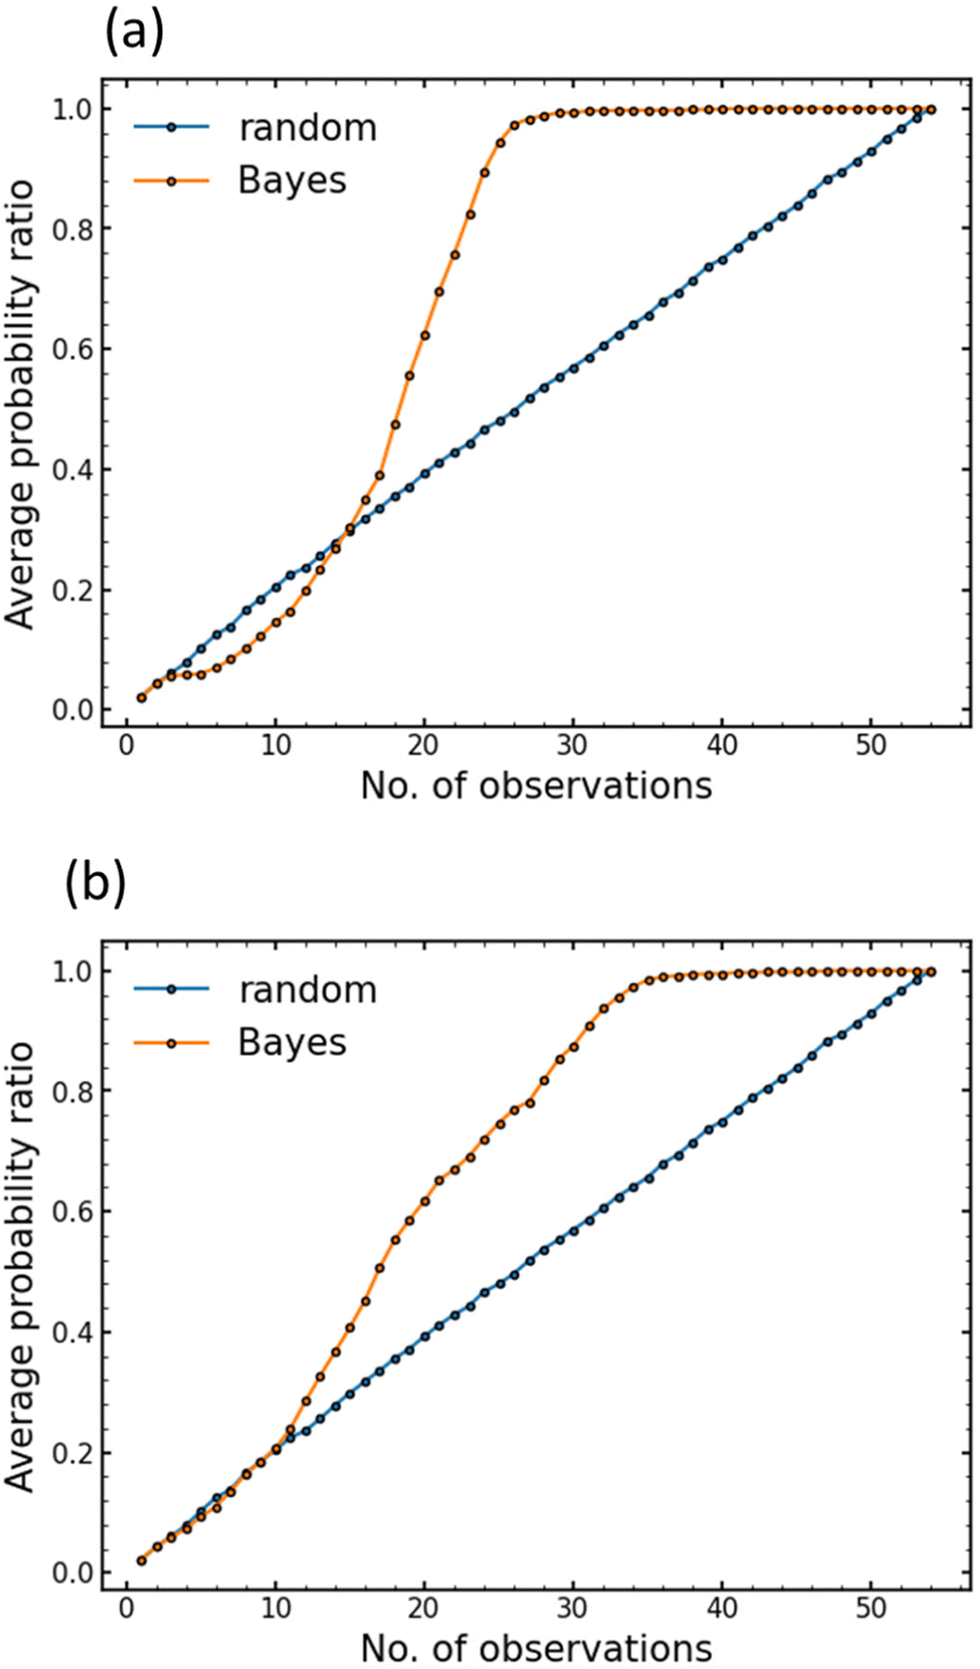 | ||
| Fig. 6 Performance comparison between Bayesian optimisation (red line) and random search (blue line). (a) Target is the highest ion conductivity at 30 °C. (b) Target is the lowest activation energy. | ||
As shown in Fig. 6(a), BO may determine the optimal heating condition for ionic conductivity with a 90% probability in 25 experiments, with an efficiency factor of approximately double that of the exhaustive search (54 conditions). Similarly, 31 experiments were conducted to optimise the activation energy with a probability of 90%, as shown in Fig. 6(b). Accordingly, BO is significantly efficient in optimising the heating condition, in addition to the optimisation of chemical composition, as reported in our previous studies.24,36
Conclusions
In this study, we synthesised LZP-CS under 54 different two-step heating conditions. At 30 °C, the HC-1050–1250 sample exhibited the highest Li-ion conductivity of 3.3 × 10⁻⁵ S cm−1, including bulk and grain-boundary contributions. Investigation of the sintered samples revealed that the heating conditions affected the crystalline phase, density, microstructure, and elemental distribution. Depending on the 1st and 2nd heating temperatures, the main phase was the α- and/or β-phase polymorph of LZP, accompanied by changes in particle morphology. Furthermore, the sintering conditions affected the necking between particles, pore size, and elemental distribution. The relationships between ionic conductivity and these observations were quite complex, and thus, intuitively determining the optimal heating conditions with a few experiments was challenging.To reduce the number of experiments required to comprehensively evaluate 54 different two-step heating conditions, BO, which was suitable for the optimal condition search, was used. We used the temperatures of the 1st and 2nd heating as descriptors. BO could establish the optimum heating conditions for the highest Li-ion conductivity with a 90% probability in 25 experiments, which was approximately double the efficiency of the exhaustive search. Thus, BO is effective in efficiently optimising synthetic conditions that affect material properties, such as heating conditions. Note that when process parameters do not affect material properties, this trend is clarified using a smaller number of samples.
Author contributions
H. T., M. N., and Y. O. conceived and directed the project. H. T., H. F., N. T., and T. N. conducted the experimental work and analysed the results. H. T., K. N., and S. H. conducted the computational studies and analysed the results. All authors approved the final version of the manuscript.Conflicts of interest
There are no conflicts to declare.Acknowledgements
This work was partially supported by Grants-in-Aid for Scientific Research (grant numbers 19H05815, 19K15657, 20H02436, and 21K14715) from the Japanese Ministry of Education Culture, Sports, Science, and Technology (MEXT), the Elements Strategy Initiative to Form Core Research Center of MEXT (grant number JPMXP0112101003), and a CREST grant from the Japan Science and Technology Agency (grant number JPMJCR21O6). English language editing was performed by Editage (http://www.editage.com).References
- V. Viswanathan, A. H. Epstein, Y.-M. Chiang, E. Takeuchi, M. Bradley, J. Langford and M. Winter, The Challenges and Opportunities of Battery-Powered Flight, Nature, 2022, 601, 519–525, DOI:10.1038/s41586-021-04139-1.
- R. van Noorden, The Rechargeable Revolution: A Better Battery, Nature, 2014, 507, 26–28, DOI:10.1038/507026a.
- Y. Zheng, Y. Yao, J. Ou, M. Li, D. Luo, H. Dou, Z. Li, K. Amine, A. Yu and Z. Chen, A Review of Composite Solid-State Electrolytes for Lithium Batteries: Fundamentals, Key Materials and Advanced Structures, Chem. Soc. Rev., 2020, 49, 8790–8839, 10.1039/D0CS00305K.
- C. Cao, Z. Li, X. L. Wang, X. B. Zhao and W. Q. Han, Recent Advances in Inorganic Solid Electrolytes for Lithium Batteries, Front. Energy Res., 2014, 2(JUN), 25, DOI:10.3389/FENRG.2014.00025/BIBTEX.
- P. Knauth, Inorganic Solid Li Ion Conductors: An Overview, Solid State Ionics, 2009, 180, 911–916, DOI:10.1016/J.SSI.2009.03.022.
- J. C. Bachman, S. Muy, A. Grimaud, H. H. Chang, N. Pour, S. F. Lux, O. Paschos, F. Maglia, S. Lupart, P. Lamp, L. Giordano and Y. Shao-Horn, Inorganic Solid-State Electrolytes for Lithium Batteries: Mechanisms and Properties Governing Ion Conduction, Chem. Rev., 2016, 116, 140–162, DOI:10.1021/acs.chemrev.5b00563.
- R. Iwasaki, K. Ishida, R. Yasuda, K. Nakano, N. Tanibata, H. Takeda, M. Nakayama and N. Watanabe, Density Functional Theory Studies on Li Metal Electrode/Garnet-Type Li7La3Zr2O12 Solid Electrolyte Interfaces for Application in All-Solid-State Batteries, Phys. Status Solidi B, 2022, 259, 2100546, DOI:10.1002/PSSB.202100546.
- N. Kamaya, K. Homma, Y. Yamakawa, M. Hirayama, R. Kanno, M. Yonemura, T. Kamiyama, Y. Kato, S. Hama, K. Kawamoto and A. Mitsui, A Lithium Superionic Conductor, Nat. Mater., 2011, 10, 682–686, DOI:10.1038/nmat3066.
- Y. Kato, S. Hori, T. Saito, K. Suzuki, M. Hirayama, A. Mitsui, M. Yonemura, H. Iba and R. Kanno, High-Power All-Solid-State Batteries Using Sulfide Superionic Conductors, Nat. Energy, 2016, 1, 1–7, DOI:10.1038/nenergy.2016.30.
- M. Tatsumisago, M. Nagao and A. Hayashi, Recent Development of Sulfide Solid Electrolytes and Interfacial Modification for All-Solid-State Rechargeable Lithium Batteries, J. Asian Ceram. Soc., 2013, 1, 17–25, DOI:10.1016/j.jascer.2013.03.005.
- N. Tanibata, M. Kato, S. Takimoto, H. Takeda, M. Nakayama and H. Sumi, High Formability and Fast Lithium Diffusivity in Metastable Spinel Chloride for Rechargeable All-Solid-State Lithium-Ion Batteries, Adv. Energy Sustainable Res., 2020, 1, 2000025, DOI:10.1002/AESR.202000025.
- Y. Zhu and Y. Mo, Materials Design Principles for Air-Stable Lithium/Sodium Solid Electrolytes, Angew. Chem., Int. Ed., 2020, 59, 17472–17476, DOI:10.1002/ANIE.202007621.
- M. V. Reddy, C. M. Julien, A. Mauger and K. Zaghib, Sulfide and Oxide Inorganic Solid Electrolytes for All-Solid-State Li Batteries: A Review, Nanomaterials, 2020, 10, 1606, DOI:10.3390/NANO10081606.
- Y. Noda, K. Nakano, H. Takeda, M. Kotobuki, L. Lu and M. Nakayama, Computational and Experimental Investigation of the Electrochemical Stability and Li-Ion Conduction Mechanism of LiZr2(PO4)3, Chem. Mater., 2017, 29, 8983–8991, DOI:10.1021/acs.chemmater.7b01703.
- H. Xie, Y. Li and J. B. Goodenough, NASICON-Type Li1+2xZr2−xCax(PO4)3 with High Ionic Conductivity at Room Temperature, RSC Adv., 2011, 1, 1728–1731, 10.1039/c1ra00383f.
- R. Murugan, V. Thangadurai and W. Weppner, Fast Lithium Ion Conduction in Garnet-Type Li7La3Zr2O12, Angew. Chem., Int. Ed., 2007, 46, 7778–7781, DOI:10.1002/anie.200701144.
- X. Xiang, F. Chen, Q. Shen, L. Zhang and C. Chen, Effect of the Lithium Ion Concentration on the Lithium Ion Conductivity of Ga-Doped LLZO, Mater. Res. Express, 2019, 6, 085546, DOI:10.1088/2053-1591/ab2799.
- Y. Inaguma, L. Chen, M. Itoh and T. Nakamura, Candidate Compounds with Perovskite Structure for High Lithium Ionic Conductivity, Solid State Ionics, 1994, 70–71, 196–202, DOI:10.1016/0167-2738(94)90309-3.
- O. Bohnke, C. Bohnke and J. L. Fourquet, Mechanism of Ionic Conduction and Electrochemical Intercalation of Lithium into the Perovskite Lanthanum Lithium Titanate, Solid State Ionics, 1996, 91, 21–31, DOI:10.1016/S0167-2738(96)00434-1.
- Y. Li, W. Zhou, X. Chen, X. Lü, Z. Cui, S. Xin, L. Xue, Q. Jia and J. B. Goodenough, Mastering the Interface for Advanced All-Solid-State Lithium Rechargeable Batteries, Proc. Natl. Acad. Sci. U. S. A., 2016, 113, 13313–13317, DOI:10.1073/pnas.1615912113.
- H. Xu, S. Wang, H. Wilson, F. Zhao and A. Manthiram, Y-Doped NASICON-Type LiZr2(PO4)3 Solid Electrolytes for Lithium-Metal Batteries, Chem. Mater., 2017, 29, 7206–7212, DOI:10.1021/acs.chemmater.7b01463.
- M. Catti, A. Comotti and S. Di Blas, High-Temperature Lithium Mobility in α-LiZr2(PO4)3 NASICON by Neutron Diffraction, Chem. Mater., 2003, 15, 1628–1632, DOI:10.1021/cm021374p.
- M. Catti, N. Morgante and R. M. Ibberson, Order–Disorder and Mobility of Li+ in the B’- and β-LiZr2(PO4)3 Ionic Conductors: A Neutron Diffraction Study, J. Solid State Chem., 2000, 152, 340–347, DOI:10.1006/JSSC.2000.8658.
- M. Harada, H. Takeda, S. Suzuki, K. Nakano, N. Tanibata, M. Nakayama, M. Karasuyama and I. Takeuchi, Bayesian-Optimization-Guided Experimental Search of NASICON-Type Solid Electrolytes for All-Solid-State Li-Ion Batteries, J. Mater. Chem. A, 2020, 8, 15103–15109, 10.1039/D0TA04441E.
- Y. Lai, Z. Sun, L. Jiang, X. Hao, M. Jia, L. Wang and F. Liu, Rapid Sintering of Ceramic Solid Electrolytes LiZr2(PO4)3 and Li1.2Ca0.1Zr1.9(PO4)3 using a Microwave Sintering Process at Low Temperatures, Ceram. Int., 2019, 45, 11068–11072, DOI:10.1016/J.CERAMINT.2019.02.193.
- H. El-Shinawi, C. Greaves and J. Janek, Sol–Gel Synthesis and Room-Temperature Properties of α-LiZr2(PO4)3, RSC Adv., 2015, 5, 17054–17059, 10.1039/C4RA16804F.
- Y. Zhang, K. Chen, Y. Shen, Y. Lin and C. W. Nan, Enhanced Lithium-Ion Conductivity in a LiZr2(PO4)3 Solid Electrolyte by Al Doping, Ceram. Int., 2017, 43, S598–S602, DOI:10.1016/J.CERAMINT.2017.05.198.
- Q. Li, C. Xu, B. Huang and X. Yin, Rhombohedral Li1+xYxZr2-x(PO4)3 Solid Electrolyte Prepared by Hot-Pressing for All-Solid-State Li-Metal Batteries, Materials, 2020, 13, 1719, DOI:10.3390/ma13071719.
- S. Smith, T. Thompson, J. Sakamoto, J. L. Allen, D. R. Baker and J. Wolfenstine, Electrical, Mechanical and Chemical Behavior of Li1.2Zr1.9Sr0.1(PO4)3, Solid State Ionics, 2017, 300, 38–45, DOI:10.1016/j.ssi.2016.11.032.
- S. Kumar and P. Balaya, Improved Ionic Conductivity in NASICON-Type Sr2+ Doped LiZr2(PO4)3, Solid State Ionics, 2016, 296, 1–6, DOI:10.1016/j.ssi.2016.08.012.
- V. I. Pet’kov, M. V. Sukhanov, A. S. Shipilov, V. S. Kurazhkovskaya, E. Y. Borovikova, I. Y. Pinus and A. B. Yaroslavtsev, Synthesis and Properties of LiZr2(AsO4)3 and LiZr2(AsO4)x (PO4)3–x, Inorg. Mater., 2014, 50, 263–272, DOI:10.1134/S0020168514030091.
- Y. Noda, K. Nakano, M. Otake, R. Kobayashi, M. Kotobuki, L. Lu and M. Nakayama, Research Update: Ca Doping Effect on the Li-Ion Conductivity in NASICON-Type Solid Electrolyte LiZr2(PO4)3: A First-Principles Molecular Dynamics Study, APL Mater., 2018, 6, 060702, DOI:10.1063/1.5033460.
- L. Buannic, B. Orayech, J. M. López Del Amo, J. Carrasco, N. A. Katcho, F. Aguesse, W. Manalastas, W. Zhang, J. Kilner and A. Llordés, Dual Substitution Strategy to Enhance Li+ Ionic Conductivity in Li7La3Zr2O12 Solid Electrolyte, Chem. Mater., 2017, 29, 1769–1778, DOI:10.1021/acs.chemmater.6b05369.
- H. Rusdi, R. Rusdi, S. B. Aziz, A. S. Alsubaie, K. H. Mahmoud and M. F. Z. Kadir, The Role of Sintering Temperature and Dual Metal Substitutions (Al3+, Ti4+) in the Development of NASICON-Structured Electrolyte, Materials, 2021, 14, 7342, DOI:10.3390/MA14237342.
- Z. Yang, S. Suzuki, N. Tanibata, H. Takeda, M. Nakayama, M. Karasuyama and I. Takeuchi, Efficient Experimental Search for Discovering a Fast Li-Ion Conductor from a Perovskite-Type Li XLa(1–x)/3NbO3 (LLNO) Solid-State Electrolyte Using Bayesian Optimization, J. Phys. Chem. C, 2021, 125, 152–160, DOI:10.1021/acs.jpcc.0c08887.
- C. Ling, A Review of the Recent Progress in Battery Informatics, npj Comput. Mater., 2022, 8, 33, DOI:10.1038/s41524-022-00713-x.
- K. Nagai, T. Osa, G. Inoue, T. Tsujiguchi, T. Araki, Y. Kuroda, M. Tomizawa and K. Nagato, Sample-Efficient Parameter Exploration of the Powder Film Drying Process Using Experiment-Based Bayesian Optimization, Sci. Rep., 2022, 12, 1–11, DOI:10.1038/s41598-022-05784-w.
- C. Li, D. Rubín de Celis Leal, S. Rana, S. Gupta, A. Sutti, S. Greenhill, T. Slezak, M. Height and S. Venkatesh, Rapid Bayesian Optimisation for Synthesis of Short Polymer Fiber Materials, Mater. Sci. Rep., 2017, 71, 1–10, DOI:10.1038/s41598-017-05723-0.
- R. Shimizu, S. Kobayashi, Y. Watanabe, Y. Ando and T. Hitosugi, Autonomous Materials Synthesis by Machine Learning and Robotics, APL Mater., 2020, 8, 111110, DOI:10.1063/5.0020370.
- R. Tamura, T. Osada, K. Minagawa, T. Kohata, M. Hirosawa, K. Tsuda and K. Kawagishi, Machine Learning-Driven Optimization in Powder Manufacturing of Ni-Co Based Superalloy, Mater. Des., 2021, 198, 109290, DOI:10.1016/J.MATDES.2020.109290.
- G. Lambard, T. T. Sasaki, K. Sodeyama, T. Ohkubo and K. Hono, Optimization of Direct Extrusion Process for Nd-Fe-B Magnets Using Active Learning Assisted by Machine Learning and Bayesian Optimization, Scr. Mater., 2022, 209, 114341, DOI:10.1016/J.SCRIPTAMAT.2021.114341.
- T. Ueno, T. D. Rhone, Z. Hou, T. Mizoguchi and K. Tsuda, COMBO: An Efficient Bayesian Optimization Library for Materials Science, Mater. Discovery, 2016, 4, 18–21, DOI:10.1016/j.md.2016.04.001.
- H. Xie, J. B. Goodenough and Y. Li, Li1.2Zr1.9Ca0.1(PO4)3, a Room-Temperature Li-ion Solid Electrolyte, J. Power Sources, 2011, 196, 7760–7762, DOI:10.1016/J.JPOWSOUR.2011.05.002.
Footnote |
| † Electronic supplementary information (ESI) available: EDS images of the sintered body, histograms of the number of observations required to determine the heating conditions affording the highest ionic conductivity and the lowest activation energy, and selected properties experimentally determined for all 54 samples (PDF). See DOI: https://doi.org/10.1039/d2ma00731b |
| This journal is © The Royal Society of Chemistry 2022 |