
 Open Access Article
 This Open Access Article is licensed under a Creative Commons Attribution-Non Commercial 3.0 Unported Licence
Modular synthesis of zwitterionic, xanthene bridged, low twist angle chromophores with high hyperpolarizability†
Gavin S.
Mohammad-Pour
 ab,
Yovan
de Coene
c,
Meryl
Wiratmo
ab,
Aditya
Maan
ab,
Koen
Clays
c,
Artëm E.
Masunov
defgh and
Kaitlyn E.
Crawford
*abde
ab,
Yovan
de Coene
c,
Meryl
Wiratmo
ab,
Aditya
Maan
ab,
Koen
Clays
c,
Artëm E.
Masunov
defgh and
Kaitlyn E.
Crawford
*abde
aDepartment of Materials Science and Engineering, University of Central Florida, Orlando, Florida 32826, USA. E-mail: kcrawford@ucf.edu
bBiionix Cluster, University of Central Florida, Orlando, Florida 32827, USA
cDepartment of Chemistry, KU Leuven, Celestijnenlaan 200D, 3001 Leuven, Belgium
dDepartment of Chemistry, University of Central Florida, Orlando, Florida 32816, USA
eNanoScience Technology Center, University of Central Florida, Orlando, Florida 32826, USA
fSchool of Modeling, Simulation & Training, University of Central Florida, Orlando, Florida, 32826, USA
gSouth Ural State University, Lenin pr. 76, Chelyabinsk 454080, Russia
hNational Research Nuclear University MEPhI (Moscow Engineering Physics Institute), Kashirskoye shosse 31, Moscow, 115409, Russia
First published on 10th August 2022
Abstract
Push–pull chromophores exhibit useful electro-optic (EO) properties that have the potential to significantly improve non-linear EO applications ranging from telecommunications to quantum informatics. Compounds with large hyperpolarizability values (β) that are stable and have easily modifiable functional groups are needed to advance organic-based EO systems. In this report, theoretical and experimental methods were used to investigate the design, synthesis, and application of a new class of push–pull chromophores for their use as a guest in guest–host EO polymer composites intended for non-linear EO applications. The chromophores combine the known intramolecular charge transfer benefits of increasing electron localization among π-conjugated zwitterionic structures with the aim of enhancing their β without the necessity of large dihedral angles. The class of chromophores reported here include a xanthene unit between a dicyanomethanide donor and pyridinium accepter. This arrangement increases charge separation due to the central sp3 hybridization and enables modular aliphatic substitutions while maintaining concise, high yielding synthetic steps. Chromophore design selection was guided by high-throughput quantum chemical Density Functional Theory calculations to predict β and dipole moment (μ) a priori. Out of 230 molecular candidates considered, we present the results for three chromophores: dicyano(9,9-dibutyl-7-(1-(2-ethylhexyl)pyridin-1-ium-4-yl)-9H-xanthen-2-yl)methanide (E1), dicyano(4-(9,9-dibutyl-7-(1-2-ethylhexyl)pyridine-1-ium-4-yl)-9H-xanthen-2-yl)methanide (E2a), and (4-(9,9-bis(2-ethylhexyl)-7-(1-(2-ethylhexyl)pyridine-1-ium-4-yl)-9H-xanthen-2-yl)phenyl)dicyanomethanide (E2b). While bulk EO coefficients were low (<2 pm V−1), perhaps due to strong aggregation, the results demonstrate exceptional experimental Hyper Raleigh Scattering (HRS) β values. Eb2, for example has an HRS β value of 1650 ± 150 × 10−30 esu at 900 nm in acetonitrile, which corresponds to μβ of 86![[thin space (1/6-em)]](https://www.rsc.org/images/entities/char_2009.gif) 000 × 10−48 esu and a μβ/Mw figure of merit (FOM) of 121 × 10−48 esu, where μ is the calculated dipole moment and Mw is the chromophore's molecular weight. The chromophores are moderately stable in ambient conditions, their size and shape are easily modifiable, and they exhibit strong negative solvatochromism with solvent polarity.
000 × 10−48 esu and a μβ/Mw figure of merit (FOM) of 121 × 10−48 esu, where μ is the calculated dipole moment and Mw is the chromophore's molecular weight. The chromophores are moderately stable in ambient conditions, their size and shape are easily modifiable, and they exhibit strong negative solvatochromism with solvent polarity.
Introduction
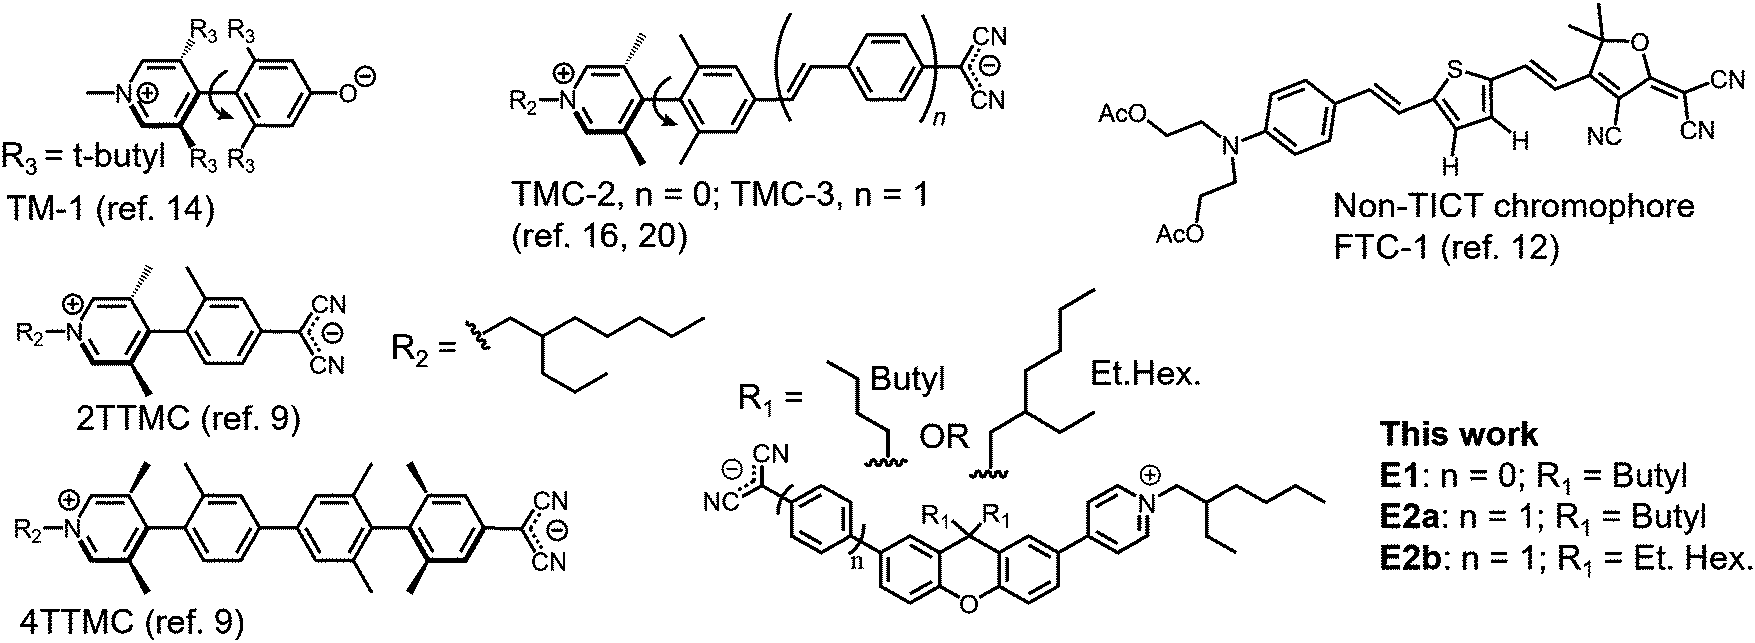
Organic electro-optic (EO) materials have the potential to greatly improve our ability to modulate optical signals in comparison to traditional inorganic EO materials (e.g., LiNbO3).1–3 Precise, on-demand manipulation of optical signals is critical for advancing technologies such as imaging,4 spectroscopy,5 photovoltaics,6 telecommunication,7 and quantum computing.8 Researchers are thus dedicating significant effort to the design and realization of organic EO materials that are stable, programmable and exhibit exceedingly large EO responses.Push–pull molecules such as chromophores have been the focus of extensive study over the past few decades to identify structures capable of achieving large first hyperpolarizability, β. Recently, π-conjugated zwitterions encompassing twist structures have emerged with unprecedented μβ, a scalar product wherein β is vectorial hyperpolarizability and μ is the structure's dipole moment. Within these structures, strong intramolecular charge transfer occurs when transitioning from the ground state to the first excited state, while maintaining a large polarity along the π-conjugated axis – a driving force of traditional planar push–pull molecules. The structure's composition and the extent of its out-of-plane character facilitates twisted intramolecular charge transfer, TICT. By harnessing TICT chromophores, experimental μβ values up to −488000 ± 48000 × 10−48 esu by Electric Field-Induced Second Harmonic Generation (EFISH) at 1907 nm in dichloromethane (CH2Cl2) has so far been reported.9 A caveat with EFISH is that μ and β cannot be measured independently, which leaves some ambiguity in their precise, individual values. For μβ comparison using the same experimental conditions for common planar, donor-acceptor chromophores, disperse red 1 (DR1) is 480 × 10−48 esu; and FTC-1 is 17600 × 10−48 esu, Chart 1.10–12 In the latter case, β was also measured independently to be 635 × 10−30 esu by Hyper Rayleigh Scattering (HRS).12 When the FTC-1's β from HRS is paired with its computed μ, then the combined μβ is 8550 × 10−48 esu. In considering other common planar, donor-acceptor chromophores, JRD1 and HLD1, their β from HRS at 1300 nm are 3300 ± 50 × 10−30 esu and 2120 ± 50 × 10−30 esu, respectively.13 Although the examples provide a relative comparison, caution is to be exercised because reported values are often collected under different experimental conditions (e.g., measurement wavelength and solvent choice).
 | ||
| Chart 1 Example TICT chromophore structures and non-TICT: FTC-1. | ||
Despite large μβ reported by EFISH, TICT π-conjugated zwitterions tend to exhibit lower than expected EO response (measured as the EO coefficient r33) in EO polymer composites, likely because of their propensity to aggregate. Their synthesis can also be laborious. However, there remains much to discover in developing zwitterionic TICT chromophores as they are a relatively new class of push–pull structures.9 The first theoretical prediction that TICT chromophores could potentially exhibit unprecedented hyperpolarizabilities was published in 1997 and based on tetraalkyl-substituted 4-quinopyran, abbreviated TICTOID (and TM-1), Chart 1. In this example, the interplanar dihedral angle was 104° and μβ was ∼70000 × 10−48 esu at an excitation energy of 0.10 eV.14,15 In comparison, the unsubstituted, planar counterpart yielded theoretical μβ of 27.9 × 10−48 esu.15 The first experimental TICT example followed in 2005 based on two zwitterionic compounds with tetra-ortho-alkylbiaryl cores, a dicyanomethanide electron donor, and a pyridinium electron acceptor, abbreviated as TMC-2 and TMC-3. The composites feature μβ values up to −488000 × 10−48 ± 48000 × 10−48 esu, characterized by EFISH, Chart 1.16 In this example, the Teng Man method was additionally used to demonstrate experimental r33 EO coefficients at 1310 nm with 10% TMC-2 and 5% TMC-3 in poly(vinyl phenol) as individual electro optic polymer (EOP) composites. These combinations resulted in 48 pm V−1 and 320 pm V−1 only while poling, respectively (compare with ∼31 pm V−1 for inorganic counterpart, LiNbO3). Poly(vinyl phenol) was used instead of other traditional polymer hosts such as polycarbonate or polymethyl methacrylate, because of the significantly attenuated r33 in those polymers. Further, typical concentrations for freely mixed chromophores in an EO polymer matrix range from 20% to 30%.17 However, doping levels for π-conjugated zwitterionic chromophores can be limited due to strong intermolecular interactions18 and likely explains the use of lower concentrations. Since the first TICT experimental debut, several other reports of π-conjugated zwitterionic TICT chromophores have emerged.19–27 Although they were generally tedious to synthesize, these chromophores hold the theoretical μβ record of 820000 × 10−48 esu, according to INDO/SCI calculations for 4TTMC, a TMC derivative with 4 aryl linkages. In this example, 4TTMC features three twist angle locations ranging from 40.3° to 88.42°, Chart 1.9,11 Experimental characterization of μβ was not possible11 and the r33 was not reported. Instead, 2TTMC, a TMC derivative with 2 aryl linkages and a twist angle of 67°, exhibits μβ of −6000 × 10−48 esu measured by EFISH in CH2Cl2 at 1907 nm, as compared to ∼12000 × 10−48 esu computed using INDO/SCI.9 Collectively, these and similar critical, foundational studies19–27 demonstrate that π-conjugated zwitterionic TICT chromophores have potential to significantly increase experimental μβ, which could eventually translate to exceptionally large EO coefficients well beyond values observed in traditional, non-TICT, donor-acceptor chromophores (see Liu et al. for a review on traditional chromophores).8 First however, there is a need to develop π-conjugated zwitterionic TICT chromophores with sites available for modular side-group functionalization to mitigate aggregation and achieve high product yields. μβ and β values are tabulated for different TICT and non-TICT chromophores in Table S1 (ESI†).
In this study, we use a combination of computation and experiment to identify a class of zwitterionic TICT chromophores with large μβ. The chromophores consist of a xanthene bridge with dicyanomethanide donor and pyridinium accepter moieties. While each of the individual components (i.e., bridge, donor, acceptor) are well known,28–30 the unique combination of the donor/acceptor with the xanthene bridge has never been reported. Our selection of xanthene as a bridge to synthesize new TICT chromophores was intentional because it (1) would likely enhance charge separation between the donor/acceptor and promote their out of plane rotation due to xanthene's size and planar structure, and (2) is easily modifiable toward the formation chromophores with variable size and shape for future use in non-linear optic applications. We show that these chromophores are capable of modular side-group functionalization through straightforward synthetic techniques. We demonstrate synthetic feasibility of the new chromophores and their side group interchangeability; compare their calculated vs. experimental μβ; then evaluate and discuss their structural, chemical, and optical properties. We use Density Functional Theory (DFT) to calculate μ and β of the new chromophores. Spectroscopy techniques, NMR, ATR-FTIR and LC-MS, confirm the intermediate and final product structures. DSC and TGA provide information on their thermal properties. HRS, UV-vis, cyclic voltammetry, and the Teng Man method enable visualization of their optical and electronic properties. The results demonstrate exceptional experimental HRS β values as high as 1650 ± 150 × 10−30 esu at 900 nm in MeCN. This β value corresponds to μβ of 86000 × 10−48 esu when combined with calculated μ, and μβ/Mw figure of merit (FOM) of 121 × 10−48 esu, where Mw is the molecular weight of the chromophore. The following includes a discussion on the similarity and differences of the structures and experimental parameters leading to the observed μβ values.
Experimental
Materials and methods
Results and discussion
Synthesis
Synthetic paths to chromophores E1, E2a, & E2b is in Scheme 1. Mediated by an in situ formed base resulting from the reaction between DMSO and sodium hydride, the synthesis of compound 1 was achieved via a nucleophilic substitution of 1-iodobutane at the 9-position of xanthene. Attempts to use alternative methods of xanthene deprotonation were unsuccessful or resulted in the formation of a mono-9H-substituted xanthene. While butyl and 2-ehtylhexyl aliphatic groups were used for the compounds illustrated here, this substitution step is important as it highlights one of the first places that the xanthene-class chromophores can be variably customized. Exchanging the aliphatic substituents for one of many different isolation groups requires only the addition of a sufficiently reactive electrophile.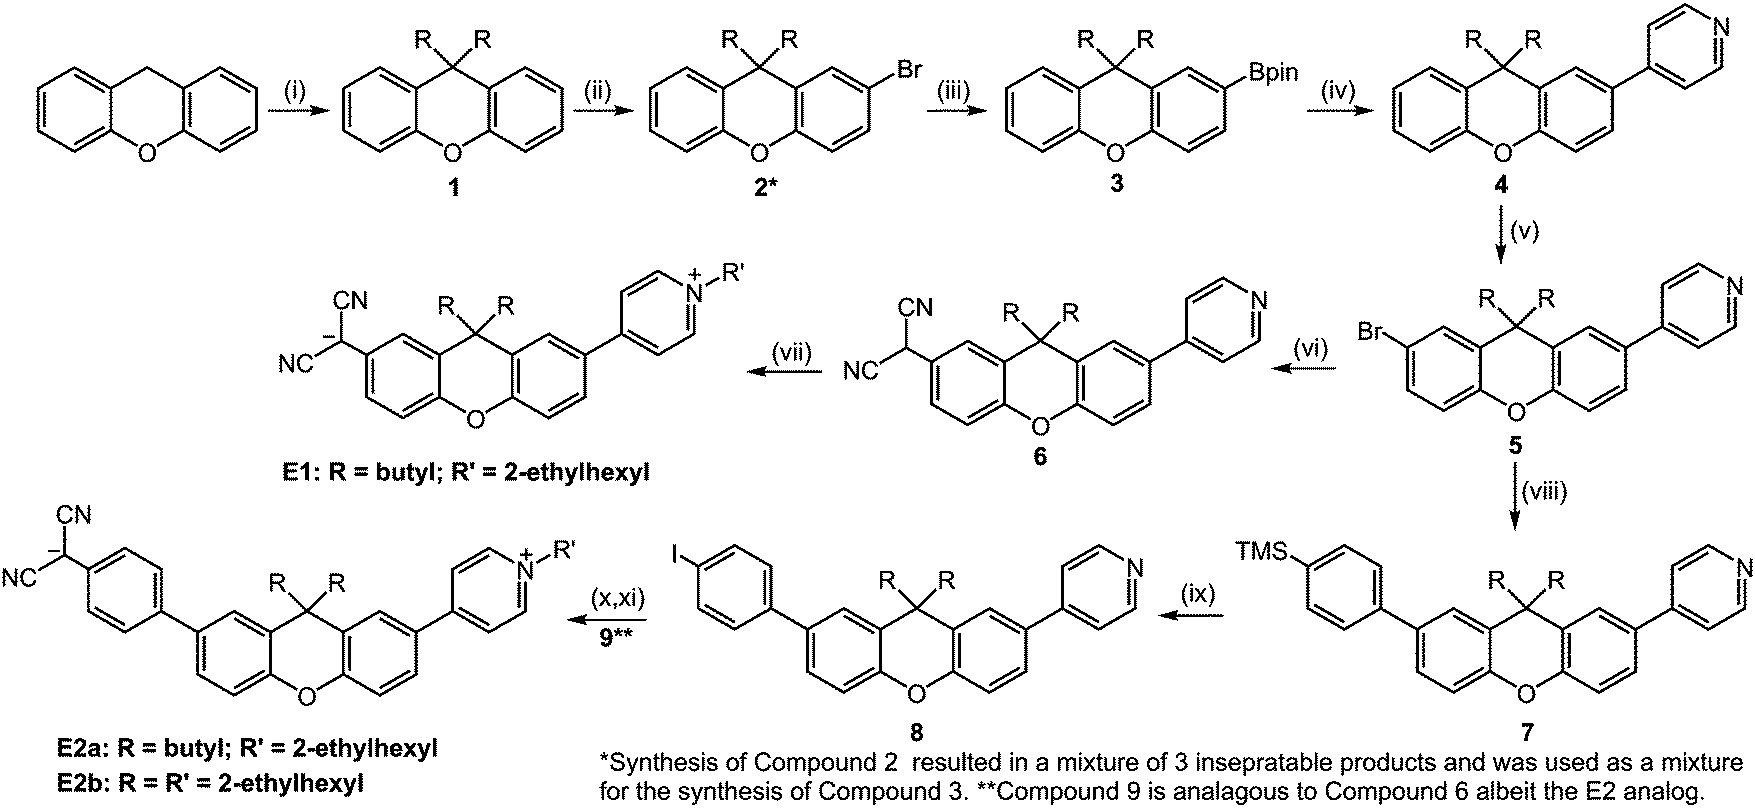 | ||
| Scheme 1 Synthetic pathway for E1 and E2a-b. | ||
To progress to compound 2, sequential bromination of the xanthene core must be achieved. As it was not possible to substitute only one side without the formation some di-brominated xanthene, nor was it possible to separate the products via column chromatography, this product was used as a mixture in the following step. The formation of the boronate ester, compound 3, is achieved by a standard n-butyl lithium borylation of the compound 2 mixture and 2-isopropoxy-4,4,5,5-tetramethyl-1,3,3-dioxaborolane, with a slight excess of both reagents used to account for the amount of di substituted product present. It is at this step where the mixture was purified via column chromatography using 2.5% ethyl acetate (EtOAc) in hexanes, with extra care given to minimizing the contact time between the boronate product and silica to avoid boronate deprotection.
The central xanthene moiety was to be first coupled with a p-halogenated pyridine compound, beginning the formation of what would eventually become the electron accepter of our chromophores. First, it should be noted by those who are not familiar with p-halogenated pyridines, that they are highly unstable, even when stored at low temperatures. This instability increases moving up the halogen column of the periodic table resulting in 4-iodopyridine being the easiest to work with. Freshly prepared iodopyridine that appears white, or at the very least yellow, will perform adequately as a Suzuki coupling partner, however if the iodopyridine has been stored for some time (e.g., a week or longer), the formation of dark spots signifies the formation of a problematic degradation product. This product, if not removed via physical separation (i.e. manually separating the dark spots with a spatula) or sublimation, will poison the Pd-catalyst upon heating via an unknown mechanism. It is worth noting that the low steric hindrances between aromatic groups of this system affords a synthetic advantage in that it does not require the application of specialty Pd-ligands and can be performed with the generic Pd(PPh3)4 with moderately high yields (87%).
Starting with compound 4 and ending with compounds 5 and 9 (for E1 and E2a-b, respectively), is where some initial difficulties in the overall synthetic scheme arose. The chemical modifications between these intermediates have such similar polarities that they cannot be easily distinguished or separated by common chromatographic techniques, specifically thin-layer and column chromatography. Column separations were run with automated columns for which the solvent ratios are provided in the ESI.† They yield differences in apparent fluorescence, which can indicate that the reaction is progressing, but the nearly identical retention factors between these intermediates cannot yield an understanding of the degree to which the reactions have progressed. This fact was certainly limiting during the optimization process as many times the reactions were either not heated to high enough temperatures, taken off heat too early, or without sufficient reagent equivalents. There are alternative routes that do not have this limitation, and indeed the works that inspired our research, understandably, follow this approach.9 However, post-optimization, we found that the higher yields, ease of setup/workup, and decreased synthetic steps justified our method.
The bromination of the second xanthene position, used to attach what would be the donor portion of the chromophore, is surprisingly dissimilar in reactivity from the first bromination step. For the bromination to progress at a moderate pace the amount of NBS needed to be increased to two equivalents and then heated to 80 °C for at least 12 hours, yielding compound 5 (75% yield). Next, the synthetic path is divergent between performing a Pd-catalyzed malononitrile coupling leading to compound 6 (65% yield) and subsequently E1 (55%), and progressing via Suzuki coupling to compound 7, and eventually leading to chromophore E2a. The Suzuki coupling to form compound 7 was carried out in a DME/EtOH solvent system with K2CO3 and Pd(PPh3)4. We found that a solvent system excluding water resulted in an elimination of the desilylation process with a yield of 79% for compound 7. The subsequent formation of the aromatic iodide, compound 8, was easily achieved using a simple ICl and CH2Cl2 iodination reaction (89% yield).
The next steps involve the Pd-catalyzed aryl-malononitrile coupling, which yield compounds 6 (65% yield) and 9 (59% yield) for chromophores E1 and E2a respectively. In both cases when the reaction is quenched the pH of the aqueous phase must be neutralized to avoid yield losses from either the basic or acidic forms of these compounds. Finally, the synthesis concludes in a two-step, one-pot nucleophilic substitution of the pyridine on a aliphatic 2-ethylhexyl triflate, followed by deprotonation of the dicyanomethine group with sodium ethoxide. Given the high solubilities of E1 and E2b, both were purified via column chromatography in 5% MeOH:CH2Cl2, resulting in yields of 55% and 78%, respectively. Pure E2a was obtained by washing with solvents resulting in a 73% yield.
Molecular structure
NMR, IR, and LC-MS characterization confirm the molecular structures for each synthesized compound, including the resulting chromophores E1 and E2a-b (see ESI†). The incorporation of three racemic 2-ethylhexyl groups, as found in E2b, causes a complex array of signals in the aromatic region because it is a diastereomeric mixture (Fig. S21, ESI†). Regardless, the total integration values of the aromatic region correspond to a total of 14 aromatic protons, with the combined pyridinium aromatic signals at 8.62 and 9.04 ppm, manifesting as signals that are discrete enough to act as the integration point of reference for the remaining resonances. The aliphatic regions for both E1 and E2a are nearly identical and represent the overlapping signals of the two central butyl groups and the 2-ethylhexyl chain on the pyridinium with an expected combined integration of 35 protons. The aliphatic region for E2b has greater signal overlap accounting for the two central 2-ethylhexyl groups and the third 2-ethylhexyl chain on the pyridinium with an expected combined integration of ca. 51 protons. 13C NMR spectra in Fig. S18 and S20 (ESI†) depict the appropriate number of signals expected for both compounds. E2b, however, is a diastereomeric mixture resulting from the 3 chiral centers, which yields too many peaks for accurate determination. The chemical structure for E1 is further articulated by HMBC NMR, which confirms the donor–acceptor substitution pattern relative to the 2 and 7 positions on the xanthene (Fig. S23, ESI†). Each chromophore, as synthesized, contains a counterion for the pyridinium functional group in the form of a triflate, which is verified via19F NMR showing a chemical shift of −80.1 ppm for each of the chromophores. (Fig. S24–S26, ESI†) The 19F NMR were collected post-column chromatography suggesting that some anion moved through the silica, likely as a close ion pair. Zwitterions can form counter ions coordination with the introduction of ionic liquids.53Structural stability
1H NMR analysis provide details of the moisture, air, and thermal stability. Fig. 1 provides 1H NMR spectra for E1 and E2a-b upon exposure to air with ambient moisture over 72 h. The spectra indicate that while E2a-b are largely stable, E1 shows significant degradation over 72 h. E2a-b eventually degrade over a much longer period (>1 week, not shown). This behavior is notably different from previous TICT chromophores where chemical stability decreases with increasing molecular length resulting from a stronger charge localization on the hygroscopic, nucleophilic dicyanomethanide.1E1's lower stability likely stems from proximity of the dicyanomethanide carbanion to the electron donating properties of xanthene's central ethereal oxygen, which is a structural feature that is unique to this TICT class. That is, the electron donating properties of the xanthene bridge and its proximity to the dicyanomethanide makes it more basic and thus more likely to degrade compared to E2a-b in which the xanthene and dicyanomethanide are separated by a phenyl ring. When performing degradation studies under light and dark conditions we observed no discernible differences between the two conditions (not shown).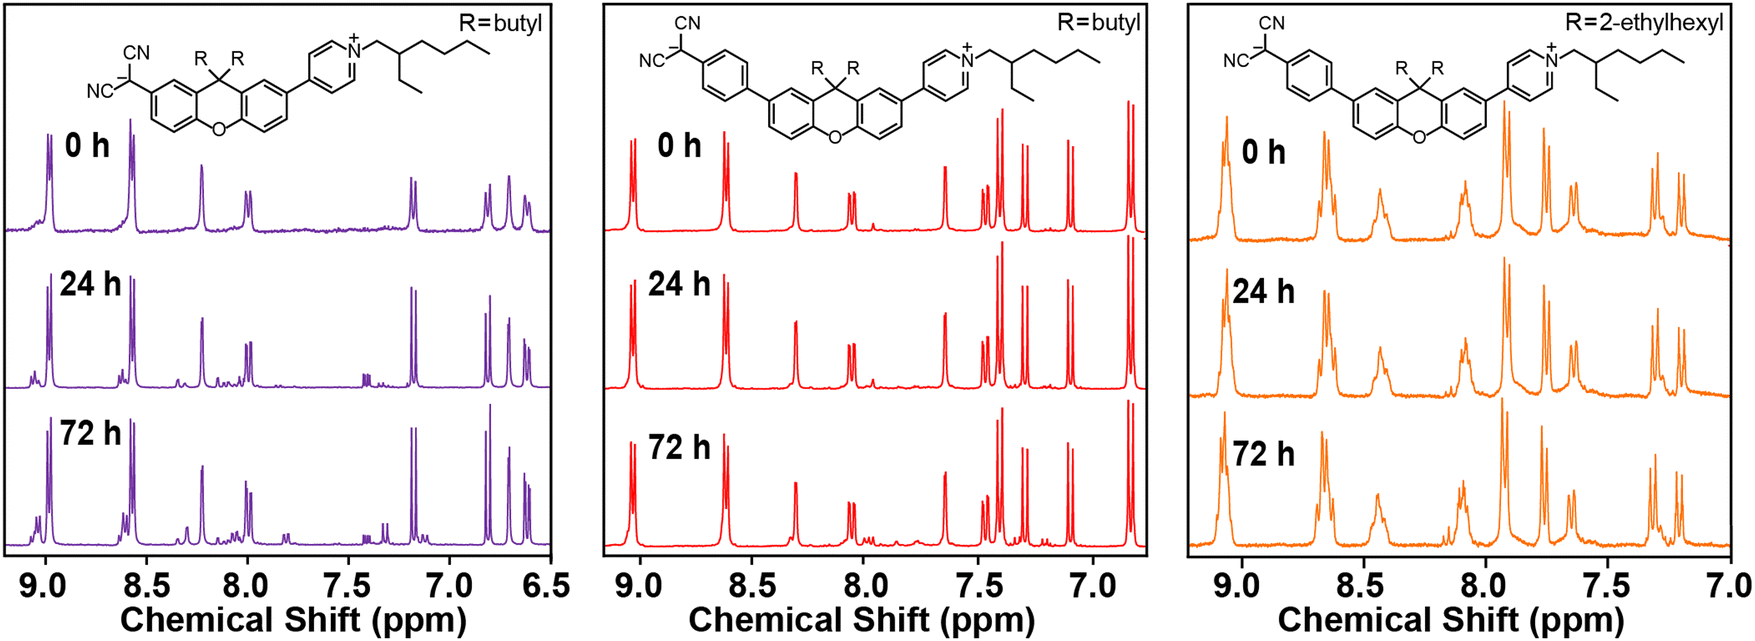 | ||
| Fig. 1 Stability tests of chromophores dissolved in DMSO-d6 under ambient conditions and measured at 0, 24, and 72 h. | ||
UV-vis analysis
Evaluating the optical properties of E1 and E2a-b provides information about the electronic properties of these conjugated structures. Table 1 presents the λmax and an estimation of the indirect bandgap for E1 and E2a-b by determining the X-intercept from the peak shoulder of the longer wavelength. Fig. 2a depicts a hypsochromic shift in the visible spectrum with increasing solvent polarity for E1. Of the solvents investigated, CH2Cl2 exhibits the highest intramolecular charge transfer wavelength λICT for E1 at 593 nm, followed by DCE at 583 nm, THF (569 nm), PhCl (559 nm), CHCl3 (526 nm), acetone (517 nm), DMF (486 nm), and MeCN (476 nm) such that CH2Cl2 > DCE > THF > PhCl > CHCl3 > acetone > DMF > MeCN from 593 nm to 476 nm. The general negative solvatochromism trend suggests stabilization of the chromophore's ground state energy resulting in an increased HOMO–LUMO gap. Fig. 2b depicts the molar absorptivity values for the full UV-vis spectrum of E1 in the same solvents except for CH2Cl2, which was excluded because of the nonlinear correlation between absorbance and concentration over the range analyzed (1.0 × 10⁻⁴ M to 1.2 × 10⁻⁵ M); a difference we attribute to the breaking up of an aggregate structure. The λmax values for E1 emerge in the UV region between 374 nm and 341 nm. For the same chromophore, DCE exhibits the highest λmax at 374 nm, followed by THF (369 nm), PhCl (367 nm), CH2Cl2 (365 nm), CHCl3 (363 nm), acetone (350 nm), MeCN (344 nm), and DMF (341 nm) such that DCE > THF > PhCl > CH2Cl2 > CHCl3 > acetone > MeCN > DMF. The small differences in peak trends between λICT and λmax as a function of solvent polarity are likely attributed to the complex nature of multiple overlapping peaks corresponding to the high energy electronic transitions of molecular subfragments.| Structure | Computed twist angle (degrees) | Band gap, ΔE (eV) | Absorption | TGA | ||||
|---|---|---|---|---|---|---|---|---|
| Bridge-accepter | Bridge-donor | Optical | E-Chem. | Computed | λ max (nm) | ε (M−1 cm−1) | 10% Wt Loss (°C) | |
| E1 | 11.6 | N/A | 2.05 | 1.99 | 2.40 | 344 | 31600 ± 1600 |
293 |
| E2a | 16.8 | 25.6 | 2.37 | 2.06 | 2.96 | 360 | 58200 ± 3400 |
274 |
| E2b | 17.4 | 35.0 | 2.33 | 2.03 | 2.96 | 365 | 30600 ± 800 |
360 |
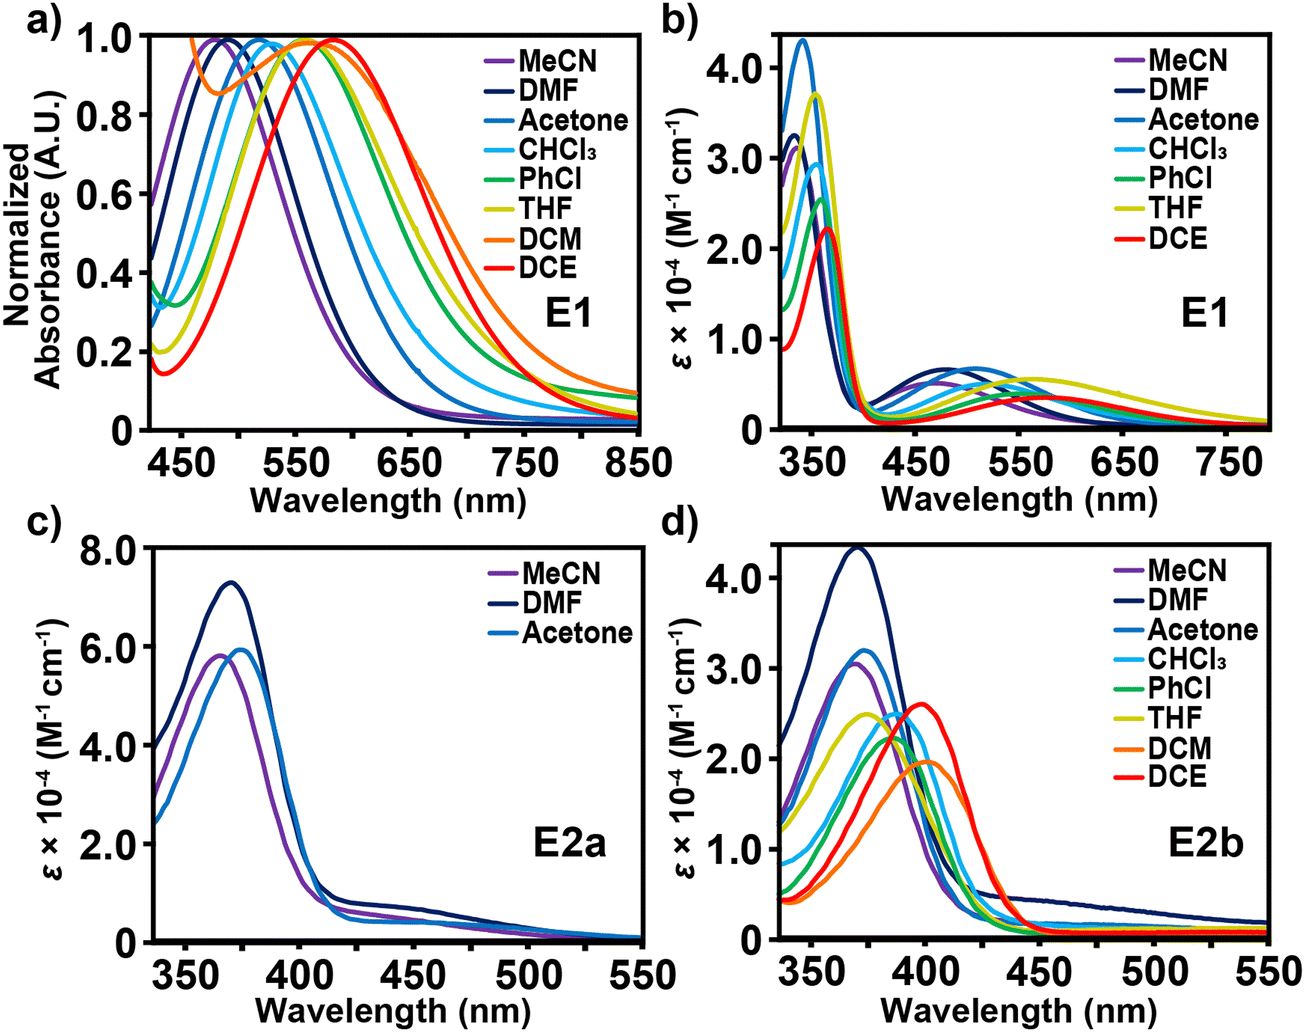 | ||
| Fig. 2 (a) Normalized visible spectrum of chromophore E1 in various solvents. (b–d) UV-vis molar absorptivity values in various solvents, averaged from 3–5 data sets within the linear range: (b) E1 wherein CH2Cl2 is excluded due to the nonlinear ICT absorbance loss related to concentration; (c) E2a in only MeCN, DMF and acetone due to lack of solubility in the remaining solvents; (d) E2a. | ||
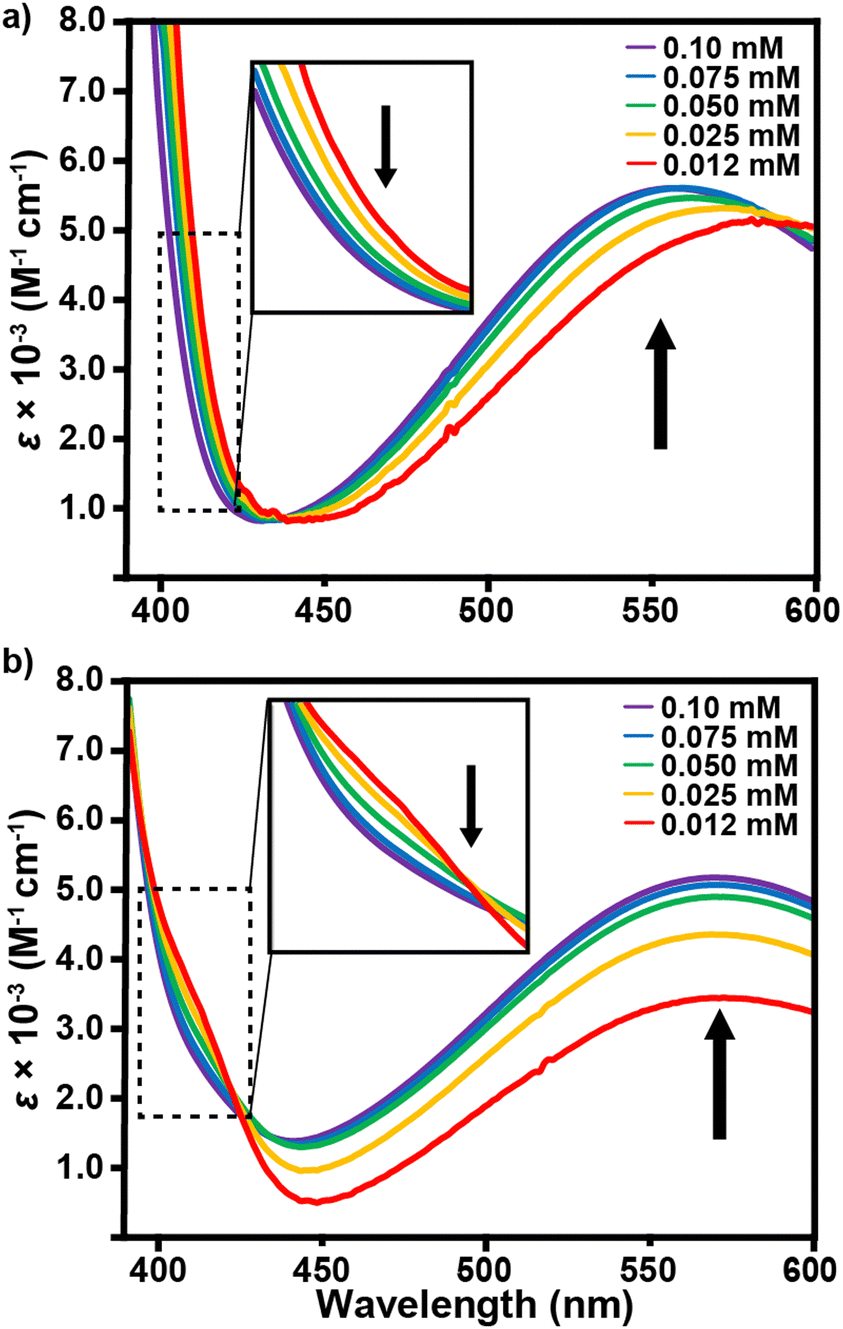
In comparison to E1, chromophores E2a and E2b exhibit almost no spectral response in the visible region regardless of solvent or concentration choice and high levels of optical transparency in the near-IR (Fig. S27, ESI†). This observation manifests visually in solvent solutions that range in color from pale red to yellow. Fig. 2c and d show that any discernible visible absorbance bands are broad and are largely overshadowed by the peaks in the UV region, which are likely the λICT for these compounds. Comparison between E2a and E2b is limited by the solubility of E2a in only MeCN, DMF, and acetone. Based on these 3 solvent comparisons E2a clearly has a much larger extinction coefficient in the UV region than E2b as well as λICT bands that extend further into the visible region. The larger extinction coefficient is likely due to the effect of solvation from the highly branched and racemic combinations of the three chiral aliphatic chains on E2b. Interestingly, for E2a and E2b there is negligible shift in absorbance values as a function of concentration, which is an uncommon characteristic of zwitterionic dyes. On the other hand, E1 exhibits a shift in wavelength and absorptivity as a function of concentration for THF, CHCl3, PhCl, and CH2Cl2. The observable wavelength shifts are most prominent for THF and CHCl3, Fig. 3. When analyzed in concentrations ranging from 1.0 × 10⁻⁴ M to 1.2 × 10⁻⁵ M, THF exhibits the largest λICT absorbance shift of 556–577 nm accompanied by a slight decrease in molar absorptivity as well as an expansion of the UV bands’ right shoulder. CHCl3 shows no shift in wavelength with decreasing concentration but does exhibit a greater decrease in absorptivity and a more prominent expansion of the right side of the UV band. Concentration-based spectral shifts for PhCl and CH2Cl2 may stem from in-solution aggregation as a function of concentration, Fig. S31 (ESI†).
 | ||
| Fig. 3 Shifts in UV-vis molar absorptivities with as a function of concentration for chromophore E1 in (a) THF and (b) CHCl3. Arrows denote directional correlation between absorptivity and concentration. | ||
Hyper rayleigh scattering (HRS)
The best fit experimental βZZZ values at 900 nm in MeCN for the present chromophores are E1 = (370 ± 10) × 10−30 esu, E2a = (1520 ± 80) × 10−30 esu, and E2b = (1650 ± 150) × 10−30 esu, Table 2. These values stem from the following guidelines: first, the HRS signal is taken as the total peak area in the nonlinear scattering spectrum corresponding to the narrow hyper-Raleigh scattering at the second-harmonic wavelength of 450 nm. The peak signal results from the constant contribution from the solvent and a solute-concentration dependent contribution from the chromophores. Second, a Beer–Lambert correction factor is used for each chromophore because of the self-absorption of their generated photons at 450 nm. Third, with static β0,ZZZ = 0.578 × 10⁻³⁰ esu as a reference for dry solvent34 and by using an undamped two-level model,37 the dynamic value at 900 nm is 0.643 × 10⁻³⁰ esu. And fourth, the HRS signal (squared), β2HRS, is interpreted as coming from a single dipolar tensor component βZZZ as eqn (1) because the chromophores exhibit strong charge-transfer type electronic transitions, which is supported by theoretical computation, vide infra. | (1) |
| Structure | Computed (M06-2x/D95 + * level) | HRS | |||
|---|---|---|---|---|---|
| μ (Debye) | |βzzz| (10−30 esu) | |μβzzz| (10−48 esu) | |βzzz| (10−30 esu) | |μβzzz| (10−48 esu) | |
| E1 | 31.1 | 945 | 29400 |
370 ± 10 | 11500 |
| E2a | 52.1 | 2300 | 121000 |
1520 ± 80 | 79900 |
| E2b | 52.1 | 2860 | 148000 |
1650 ± 150 | 86000 |
Computations
Quantum chemical calculations play an important role in predicting hyperpolarizability and dipole moment when designing new push–pull chromophores. DFT affords relatively high theory level for the large molecules studied in this work in comparison to semiempirical methods used in the past.38 M06-2X exchange-correlation functional calculations predicts the static |β| to be as high as 2860 × 10−30 esu for E2b with corresponding μβ of 148000 × 10−48 esu followed by |β| of 2300 × 10−30 esu and μβ 121000 × 10−48 esu for E2a, and |β| of 945 × 10−30 esu and μβ 29400 × 10−48 esu for E1, Table 2. DFT calculations often overestimate β in comparison to experimental determination by as much as 2–3 times. Such is the case in the current study wherein the computed static absolute |β| values in vacuum are a factor of 1.5 to 2.5 greater than the experimental HRS measurements at 900 nm in MeCN. A contributing factor to this difference is self-interaction error. Kohn–Sham DFT description of the electronic structure tends to overdelocalize the electrons (and hence overestimate both μ and |β|). This issue is partially mitigated by using hybrid exchange-correlation functionals with a larger fraction of exact Hartree–Fock (HF) exchange. In this case, M06-2X is a global hybrid functional with 54% HF exchange.
Computed HOMO and LUMO spatial distributions for E1 and E2a-b demonstrate that the HOMO primarily localizes on the dicyanomethanide substituent while the LUMO localizes on the pyridinium cation, Fig. 4. One can observe a greater level of electron localization for compound E2a-b than compound E1 due to the increase in π-system length. Addition of the phenylene ring adjacent to the dicyanomethanide in E2a-b causes a significant increase in optical excitation energy, ΔE, from 2.40 eV for E1 to 2.96 eV for both E2a and E2b, Table 2. The predictions of absorption wavelength (and corresponding optical excitation energy values) are made possible via TD-DFT calculations using the M05-QX exchange-correlation functional derived by interpolation between M05 and M05-2X functionals.40,41 The values of dipole moment, μ, also increase with the length of the molecule from 31.1 Debye for E1 to 52.5 Debye and 52.1 Debye for E2a and E2b, respectively, Table 1. The computed dihedral twist angle between the pyridinium ring and the xanthene bridge is 11.6° for E1 and increases to 16.8° and 17.4°, respectively for E2a and E2b. The phenylene ring positioned between the electron donating dicyanomethanide and the planar xanthene bridge in E2a-b results in an additional twist angle which, when computed, increases from 25.6° for E2a to 35° for E2b. The nearly 10° increase in computed, out-of-plane rotation is likely due to the increase in sterics stemming from the bulkier ethyl-hexyl substituents in comparison to the less bulky butyl substituents on E2a, Table 1. A significant observation is that the dihedral angles for E1 and E2a-b are low in comparison to other TICT chromophores with similar |μβ|, which exhibit angles exceeding 65°. Thus, future derivatives of structurally modular E1 and E2a-b with larger dihedral angles originating from bulkier substituents are likely to yield much higher |β|.
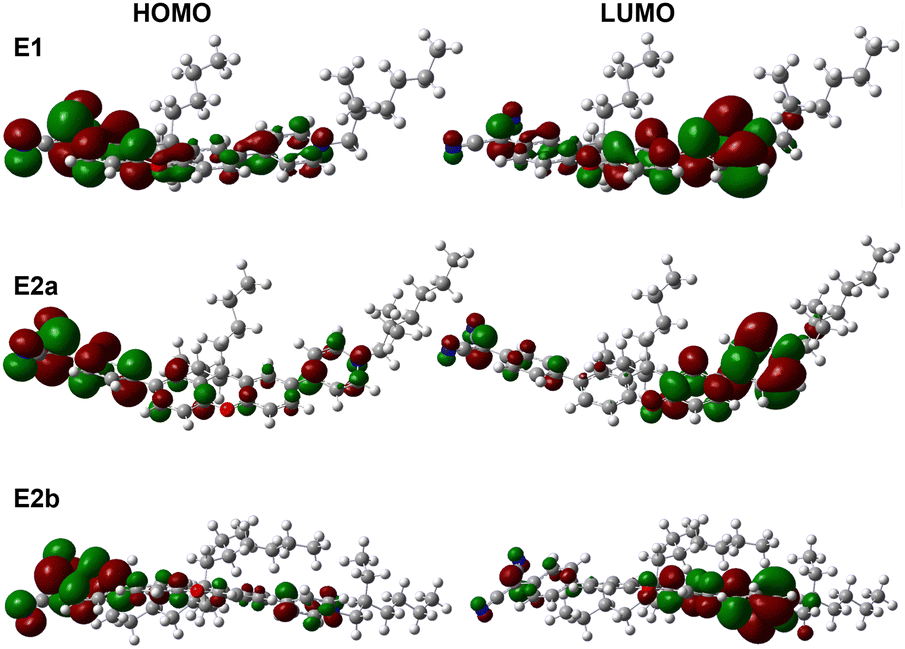 | ||
| Fig. 4 Computed HOMO-LUMO for E1 and E2a-b chromophores. | ||
Electrochemical analysis
Fig. S34–S36 (ESI†) provide representative cyclic voltammograms (CV) for E1 and E2a-b. The CVs have similar shape for each chromophore with a reductive peak near −1.75 V and a pair of oxidative peaks just above and below 0.5 V (vs. FeCp2+/FeCp2 taken at 0 V). An additional unidentified peak exists near 0 V for each chromophore. Changing the concentration and the scan rate does not alter the magnitude of the peak current relative to the other signals ruling out contribution from aggregation. The CV features are reoccurring and remain constant over multiple scans. Alternative solvents, THF and DMF, were evaluated; however, the results were inconclusive possibly because the peaks were outside the electrochemical signal range of the solvents. There is an additional small wave at ca. −1.5 V, which is unidentified but may originate from the electrolyte. Further, when comparing the HOMO–LUMO gaps to the distances between the reductive wave and the unidentified peaks, the calculated result corresponds to wavelengths of light in the near IR regions. However, the calculations do not correspond to experimental or computational observations and are thus unsuitable to consider. Instead, calculation of the electrochemical band gaps using the designated reductive peak and the first oxidative peak, yields respective E1, E2a, and E2b values of 1.99 eV, 2.06 eV, 2.03 eV. These values are somewhat consistent with the estimated optical band gaps in MeCN, 2.05 eV, 2.37 eV, 2.33 eV, but differ greatly with the computed band gaps, 2.40 eV, 2.96 eV, and 2.96 eV for E1, E2a, and E2b, respectively, Table 1. The value disparity between methods is likely due to the complicated nature of the compounds being analyzed, where solvatochromatic and aggregation effects often cause deviations from predictive behavior.Electro optic (EO) coefficient
Despite the large hyperpolarizability values observed both experimentally with HRS and computationally with DFT, the average r33 EO coefficient for ITO-EOP-Au device stacks is 0.93 pm V−1 and 1.3 pm V−1 for E1 and E2a, respectively. E2b was not evaluated due to facility access limitations but is likely to yield similar r33 to E1 and E2a. The chromophores were first poled using thermally assisted electric poling at 25 V μm−1 at 110 °C. Larger voltages lead to dielectric breakdown, likely due to the thin nature of the EOP films (≤1 μm). The 110 °C poling temperature was selected based on the glass transition temperature of 5 wt% chromophore in poly(vinyl phenol) (PVP), Fig. S32–S33 (ESI†). The negligible EO coefficients may stem from low chromophore wt.% concentration, in situ degradation, or weak interactions between the chromophore and the polymer host. Low wt% concentrations were used due to aggregation concerns, as has been observed with other TICT chromophores.16 Difficulties encountered during filtration (0.2 μm PTFE syringe filter) may have further reduced the final wt% concentration thereby further thwarting the EO effect. The possibility of degradation was minimized by avoiding light and using low moisture nitrogen atmospheres during poling and r33 measurements; however, due to the limited air stability particularly for E1, some degradation could have occurred during the multi-step characterization process. Poor intermolecular interaction between chromophores and polymer hosts is a common challenge in producing EO polymer composites. The zwitterionic nature of the chromophores under investigation in the present work likely exacerbates the limited chromophore-polymer compatibility. To facilitate chromophore dispersion we used PVP as the polymer host in place of traditional polycarbonate (PC) or poly(methyl methacrylate) based on previous success with observing an increased EO effect with PVP, instead of PC, as a host for TICT chromophores.16 In the present work, however, the strength of aggregation likely exceeds the external electric field forces that would otherwise induce angular rotation about the chromophore's long, Z-axis enabling non-centrosymmetric head-to-head alignment during poling. The strong aggregation may be attributed to the narrow chromophore shape and large dipole moments in addition to their zwitterionic structure.Conclusions
We report here a new class of π-conjugated, zwitterionic chromophores that, despite having low out-of-plane dihedral angles determined by simulation, exhibit large |β| values ranging from 370 ± 10 × 10−30 esu to 1650 ± 150 × 10−30 esu, observed by HRS in MeCN at 900 nm. A further unique attribute of the push–pull chromophores is the xanthene bridge connecting the dicyanomethanide electron donor and alkyl pyridinium electron acceptor moieties, which simultaneously allows for the easy exchange of aliphatic substituents and increases β by way of greater charge localization. The compounds show positive correlations with π-system length, extent of aliphatic character, and out-of-plane dihedral twist angles. Chromophore design was facilitated by computational efforts in predicting large absolute |β| values prior to experimental synthesis. The chromophores were prepared using straightforward synthetic techniques and characterized using a battery of methods. While our computational model predicted higher absolute |β| values (from 945 × 10−30 esu to 2860 × 10−30 esu) in comparison to experimental HRS characterization, the difference is expected due to the tendency of the overdelocalization of electrons in self-interacting DFT. The use of hybrid exchange-correlation functionals with a larger fraction of HF exchange partially mitigates this overdelocalization. Chromophore stability is greatest for E2b, which features relative stability for up to a week, followed by E2a which shows only slight degradation at 72 h, with E1 showing moderate degradation over the same period. The r33 for E1 and E2a were ≤1.3 pm V−1 (not measured for E2b) likely due to strong aggregation of their π-conjugated, zwitterionic structures. However, we believe this difficulty to be surmountable given the wide synthetic latitude available in the form of incorporating aliphatic groups, increasing dihedral angles, as well as methods to increase productive guest–host interactions via covalent or intermolecular interactions. These research avenues are under development in our lab and will be disseminated in due course.Author contributions
G. S. P.: chromophore design, synthesis, characterization, and manuscript write-up; Y. d. C. and K. C.: HRS measurements; A. E. M.: chromophore characterization; M. W. and A. E. M.: DFT calculations; K. E. C.: chromophore design, project management, manuscript write-up. The manuscript was written through contributions of all authors. All authors have given approval to the final version of the manuscript.Conflicts of interest
There are no conflicts to declare.Acknowledgements
G. S. P. acknowledges the P3 Postdoctoral Fellowship support through the University of Central Florida (UCF). Y. d. C. acknowledges a postdoctoral fellowship from FWO-V (Fonds Wetenschappelijk Onderzoek; number 1234222N), the Flemish Fund for Scientific Research. K. E. C. and G. S. P. acknowledge funding provided by the University of Central Florida and the kind collaboration with Prof. Fernando Uribe-Romo for enabling use of his research facilities. A. E. M. acknowledges support by the “improving of the competitiveness” program of the National Research Nuclear University MEPhI. This work used the Extreme Science and Engineering Discovery Environment (XSEDE), which is supported by National Science Foundation grant number ACI-1548562. The authors acknowledge the use of the following resources that have contributed to the research results reported within this paper: Stampede2 facility of the Texas Advanced Computing Center (TACC) at The University of Texas at Austin (https://www.tacc.utexas.edu), the Stokes facility at the University of Central Florida Advanced Research Computing Center (https://www.arcc.ist.ucf.edu) and TORNADO facility at South Ural State University (https://www.supercomputer.susu.ru).References
- L. Beverina and G. A. Pagani, Acc. Chem. Res., 2014, 47, 319–329 CrossRef CAS PubMed.
- T. Sakamoto, T. Kawanishi and M. Tsuchiya, Opt. Lett., 2008, 33, 890–892 CrossRef CAS PubMed.
- L. Bai, Z. Lin, Z. Wang, C. Chen and M.-H. Lee, J. Chem. Phys., 2004, 120, 8772–8778 CrossRef CAS PubMed.
- W. Denk, H. Strickler James and W. Webb Watt, Science, 1990, 248, 73–76 CrossRef CAS PubMed.
- J.-X. Cheng and X. S. Xie, Science, 2015, 350, aaa8870 CrossRef PubMed.
- A. Guillén-López, C. Delesma, C. Amador-Bedolla, M. Robles and J. Muñiz, Theor. Chem. Acc., 2018, 137, 85 Search PubMed.
- I.-C. Benea-Chelmus, M. L. Meretska, D. L. Elder, M. Tamagnone, L. R. Dalton and F. Capasso, Nat. Commun., 2021, 12, 5928 Search PubMed.
- J. Liu, C. Ouyang, F. Huo, W. He and A. Cao, Dyes Pigm., 2020, 181, 108509 CrossRef CAS.
- Y. Shi, D. Frattarelli, N. Watanabe, A. Facchetti, E. Cariati, S. Righetto, E. Tordin, C. Zuccaccia, A. Macchioni, S. L. Wegener, C. L. Stern, M. A. Ratner and T. J. Marks, J. Am. Chem. Soc., 2015, 137, 12521–12538 CrossRef CAS PubMed.
- R. Andreu, E. Galán, J. Garín, V. Herrero, E. Lacarra, J. Orduna, R. Alicante and B. Villacampa, J. Org. Chem., 2010, 75, 1684–1692 CrossRef CAS PubMed.
- A. J.-T. Lou and T. J. Marks, Acc. Chem. Res., 2019, 52, 1428–1438 CrossRef CAS PubMed.
- L. Dalton, A. Harper, A. Ren, F. Wang, G. Todorova, J. Chen, C. Zhang and M. Lee, Ind. Eng. Chem. Res., 1999, 38, 8–33 CrossRef CAS.
- H. Xu, F. Liu, D. L. Elder, L. E. Johnson, Y. De Coene, K. Clays, B. H. Robinson and L. R. Dalton, Chem. Mater., 2020, 32, 1408–1421 CrossRef CAS.
- I. D. L. Albert, T. J. Marks and M. A. Ratner, J. Am. Chem. Soc., 1998, 120, 11174–11181 CrossRef CAS.
- I. D. L. Albert, T. J. Marks and M. A. Ratner, J. Am. Chem. Soc., 1997, 119, 3155–3156 CrossRef CAS.
- H. Kang, A. Facchetti, P. Zhu, H. Jiang, Y. Yang, E. Cariati, S. Righetto, R. Ugo, C. Zuccaccia, A. Macchioni, C. L. Stern, Z. Liu, S.-T. Ho and T. J. Marks, Angew. Chem., Int. Ed., 2005, 44, 7922–7925 CrossRef CAS PubMed.
- M. R. Leahy-Hoppa, P. D. Cunningham, J. A. French and L. M. Hayden, J. Phys. Chem. A, 2006, 110, 5792–5797 CrossRef CAS PubMed.
- A. M. R. Beaudin, N. Song, Y. Bai, L. Men, J. P. Gao, Z. Y. Wang, M. Szablewski, G. Cross, W. Wenseleers, J. Campo and E. Goovaerts, Chem. Mater., 2006, 18, 1079–1084 CrossRef CAS.
- Y. Wang, D. L. Frattarelli, A. Facchetti, E. Cariati, E. Tordin, R. Ugo, C. Zuccaccia, A. Macchioni, S. L. Wegener, C. L. Stern, M. A. Ratner and T. J. Marks, J. Phys. Chem. C, 2008, 112, 8005–8015 CrossRef CAS.
- H. Kang, A. Facchetti, H. Jiang, E. Cariati, S. Righetto, R. Ugo, C. Zuccaccia, A. Macchioni, C. L. Stern, Z. Liu, S.-T. Ho, E. C. Brown, M. A. Ratner and T. J. Marks, J. Am. Chem. Soc., 2007, 129, 3267–3286 CrossRef CAS PubMed.
- G. S. He, J. Zhu, A. Baev, M. Samoć, D. L. Frattarelli, N. Watanabe, A. Facchetti, H. Ågren, T. J. Marks and P. N. Prasad, J. Am. Chem. Soc., 2011, 133, 6675–6680 CrossRef CAS PubMed.
- D. J. Clarke, A. Middleton, A. Teshome, M. D. H. Bhuiyan, M. Ashraf, G. J. Gainsford, I. Asselberghs, K. Clays, G. J. Smith and A. J. Kay, AIP Conf. Proc., 2009, 1151, 90 CrossRef CAS.
- S. Ito, S. Hiroto, S. Lee, M. Son, I. Hisaki, T. Yoshida, D. Kim, N. Kobayashi and H. Shinokubo, J. Am. Chem. Soc., 2015, 137, 142–145 CrossRef CAS PubMed.
- N. B. Teran, G. S. He, A. Baev, Y. Shi, M. T. Swihart, P. N. Prasad, T. J. Marks and J. R. Reynolds, J. Am. Chem. Soc., 2016, 138, 6975–6984 CrossRef CAS PubMed.
- A. J.-T. Lou, S. Righetto, C. Barger, C. Zuccaccia, E. Cariati, A. Macchioni and T. J. Marks, J. Am. Chem. Soc., 2018, 140, 8746–8755 CrossRef CAS PubMed.
- J. Xu, A. Takai, A. Bannaron, T. Nakagawa, Y. Matsuo, M. Sugimoto, Y. Matsushita and M. Takeuchi, Mater. Chem. Front., 2018, 2, 780–784 RSC.
- J. Jia, X. Wu, Y. Fang, J. Yang, Y. Han, J. Xiao, X. Zhang, Y. Wang and Y. Song, J. Phys. Chem. C, 2020, 124, 4701–4708 CrossRef CAS.
- X. Chen, T. Pradhan, F. Wang, J. S. Kim and J. Yoon, Chem. Rev., 2012, 112, 1910–1956 CrossRef CAS PubMed.
- A. Abbotto, Gazz. Chim. Ital., 1997, 127, 165–166 CAS.
- F. Meyers, S. R. Marder, B. M. Pierce and J. L. Bredas, J. Am. Chem. Soc., 1994, 116, 10703–10714 CrossRef CAS.
- A. C. Spivey, L. Shukla and J. F. Hayler, Org. Lett., 2007, 9, 891–894 CrossRef CAS PubMed.
- Y. Ashikari, T. Kawaguchi, K. Mandai, Y. Aizawa and A. Nagaki, J. Am. Chem. Soc., 2020, 142, 17039–17047 CrossRef CAS PubMed.
- Y. Morisaki, T. Nakano and Y. Chujo, J. Polym. Sci., Part A: Polym. Chem., 2014, 52, 2815–2821 CrossRef CAS.
- J. Campo, F. Desmet, W. Wenseleers and E. Goovaerts, Opt. Express, 2009, 17, 4587–4604 CrossRef CAS PubMed.
- Y. De Coene, O. Deschaume, S. Jooken, S. Seré, S. Van Cleuvenbergen, C. Bartic, T. Verbiest and K. Clays, Chem. Mater., 2020, 32, 7327–7337 CrossRef CAS.
- M. J. Frisch, G. W. Trucks, H. B. Schlegel, G. E. Scuseria, M. A. Robb, J. R. Cheeseman, G. Scalmani, V. Barone, B. Mennucci, G. A. Petersson, H. Nakatsuji, M. Caricato, X. Li, H. P. Hratchian, A. F. Izmaylov, J. Bloino, G. Zheng, J. L. Sonnenberg, M. Hada, M. Ehara, K. Toyota, R. Fukuda, J. Hasegawa, M. Ishida, T. Nakajima, Y. Honda, O. Kitao, H. Nakai, T. Vreven, J. J. A. Montgomery, J. E. Peralta, F. Ogliaro, M. Bearpark, J. J. Heyd, E. Brothers, K. N. Kudin, V. N. Staroverov, R. Kobayashi, J. Normand, K. Raghavachari, A. Rendell, J. C. Burant, S. S. Iyengar, J. Tomasi, M. Cossi, N. Rega, N. J. Millam, M. Klene, J. E. Knox, J. B. Cross, V. Bakken, C. Adamo, J. Jaramillo, R. Gomperts, R. E. Stratmann, O. Yazyev, A. J. Austin, R. Cammi, C. Pomelli, J. W. Ochterski, R. L. Martin, K. Morokuma, V. G. Zakrzewski, G. A. Voth, P. Salvador, J. J. Dannenberg, S. Dapprich, A. D. Daniels, Ö. Farkas, J. B. Foresman, J. V. Ortiz, J. Cioslowski and D. J. Fox, Gaussian 09, Revision D.01, 2009, 1639769047 Search PubMed.
- T. H. Dunning Jr. and P. J. Hay, in Methods of Electronic Structure Theory, ed., H. F. Schaefer III, Springer, New York, 1977, vol. 3, pp. 1–27 Search PubMed.
- L. E. Johnson, L. R. Dalton and B. H. Robinson, Acc. Chem. Res., 2014, 47, 3258–3265 CrossRef CAS PubMed.
- A. V. Marenich, C. J. Cramer and D. G. Truhlar, J. Phys. Chem. B, 2009, 113, 6378–6396 CrossRef CAS PubMed.
- I. A. Mikhailov, M. V. Bondar, K. D. Belfield and A. E. Masunov, J. Phys. Chem. C, 2009, 113, 20719–20724 CrossRef CAS.
- Y. Zhao, N. E. Schultz and D. G. Truhlar, J. Chem. Theory Comput., 2006, 2, 364–382 CrossRef PubMed.
- K. Y. Suponitsky, S. Tafur and A. E. Masunov, J. Chem. Phys., 2008, 129, 044109 CrossRef PubMed.
- K. Y. Suponitsky, A. E. Masunov and M. Y. Antipin, Mendeleev Commun., 2008, 18, 265–267 CrossRef CAS.
- K. Y. Suponitsky, Y. Liao and A. E. Masunov, J. Phys. Chem. A, 2009, 113, 10994–11001 CrossRef CAS PubMed.
- K. Y. Suponitsky, A. E. Masunov and M. Y. Antipin, Mendeleev Commun., 2009, 19, 311–313 CrossRef CAS.
- K. Y. Suponitsky and A. E. Masunov, J. Chem. Phys., 2013, 139, 094310 CrossRef PubMed.
- L. Croitor, E. B. Coropceanu, A. V. Siminel, A. E. Masunov and M. S. Fonari, Polyhedron, 2013, 60, 140–150 CrossRef CAS.
- Y. O. Shaydyuk, S. M. Levchenko, S. A. Kurhuzenkau, D. Anderson, A. E. Masunov, O. D. Kachkovsky, Y. L. Slominsky, J. L. Bricks, K. D. Belfield and M. V. Bondar, J. Lumin., 2017, 183, 360–367 CrossRef CAS.
- W. V. Moreshead, O. V. Przhonska, M. V. Bondar, A. D. Kachkovski, I. H. Nayyar, A. E. Masunov, A. W. Woodward and K. D. Belfield, J. Phys. Chem. C, 2013, 117, 23133–23147 CrossRef CAS.
- B. Sui, M. V. Bondar, D. Anderson, H. J. Rivera-Jacquez, A. E. Masunov and K. D. Belfield, J. Phys. Chem. C, 2016, 120, 14317–14329 CrossRef CAS.
- I. H. Nayyar, A. E. Masunov and S. Tretiak, J. Phys. Chem. C, 2013, 117, 18170–18189 CrossRef CAS.
- I. A. Mikhailov, M. Musiał and A. E. Masunov, Comput. Theor. Chem., 2013, 1019, 23–32 CrossRef CAS.
- A. J.-T. Lou and T. J. Marks, Acc. Chem. Res., 2019, 52, 1428–1438 CrossRef CAS PubMed.
- Y. de Coene, S. Van Cleuvenbergen, N. Van Steerteghem, V. Baekelandt, T. Verbiest, C. Bartic and K. Clays, J. Phys. Chem. C, 2017, 121, 6909–6915 CrossRef CAS.
Footnote |
| † Electronic supplementary information (ESI) available: The following files are available free of charge: Synthetic details, NMR, TGA, UV-vis, DSC, CV, FTIR-ATR (PDF). See DOI: https://doi.org/10.1039/d2ma00721e |
| This journal is © The Royal Society of Chemistry 2022 |