 Open Access Article
Creative Commons Attribution 3.0 Unported Licence
Interfacial engineering of Cu–Fe2O3 nanotube arrays with built-in electric field and oxygen vacancies for boosting the electrocatalytic reduction of nitrates†
Yihong
Gao‡
a,
Kun
Huang‡
a,
Chen
Yan
a,
Shikuo
Li
*b,
Hui
Zhang
 *b,
Longjiu
Cheng
 a and
Fangzhi
Huang
 *a
*a
aLaboratory of Clean Energy & Environmental Catalysis, AnHui Province Key Laboratory of Chemistry for Inorganic/Organic Hybrid Functionalized Materials, School of Chemistry and Chemical Engineering, Anhui University, Hefei 230601, P. R. China. E-mail: huangfangzhi@163.com
bSchool of Materials Science and Engineering, Anhui University, Hefei 230601, P. R. China. E-mail: lishikuo@ahu.edu.cn; zhhui@ahu.edu.cn; Tel: +86-551-63861328
First published on 21st July 2022
Abstract
The key to enhancing electrocatalytic nitrate reduction to ammonium (ENRA) is to improve the slow mass transfer of nitrates and the effective electron transfer on the catalyst surface. Based on the thermal diffusion theory and electroreduction mechanism, a Cu–Fe2O3 nanotube electrocatalyst with enriched oxygen vacancies and a built-in electric field was designed by controlling the heating and electroreduction time. Because of its unique structure, it could induce the generation of a built-in electric field and promote the enrichment of nitrate ions and electron transfer on the catalyst surface. Combined with the oxygen vacancy (OV)-anchoring mechanism, Cu–Fe2O3-60 showed remarkable Faraday efficiency (80.1%) and selectivity (88.47%). In addition, even when the reactor was scaled up to a pilot capacity of 180 L, the conversion rate was close to 85%. This work demonstrates that controlling the staggered interface distribution and oxygen vacancy number in metal–semiconductor is an effective way to design high-efficiency electrocatalysts.
1. Introduction
Nitrate pollution is one of the most urgent environmental problems in the world, especially due to its accumulation in surface water and groundwater, seriously threatening human health.1–4 The eight-electron transfer reaction of NO3− conversion to NH4+ is employed not to partially reduce NO3− into N2 for purification but to provide an opportunity to convert polluting NO3− into NH4+, which is an economically competitive product.5,6 Compared with the traditional commercial technologies,7–11 the electrocatalytic technology is considered one of the most effective strategies for mitigating nitrate pollution due to its pollution-free process, low energy consumption and high energy efficiency.12–14However, as an active but challenging field in current research, electrocatalysis also faces some inevitable difficulties. First, in the eight-electron transfer electrocatalytic nitrate reduction to ammonium, the main competitive side reaction is the hydrogen evolution reaction, which is accompanied by a five-electron transfer reaction that partially reduces NO3− to N2.15,16 Moreover, the yield of ammonium also depends on solutions to key problems, such as the slow mass transfer of nitrate in solution, small concentration gradient near the electrode and weak anchoring on the catalyst surface.17,18 In this scenario, the core of the technology lies in designing an integrated catalytic system to fully improve the catalytic performance.
As with any typical heterogeneous catalytic reaction, constructing heterogeneous interfaces between the constituent active components to achieve effective electron transfer is crucial in ENRA systems.19–22 In metal-semiconductor electrocatalysts, the heterogeneous interface connects metals and a semiconductor; this structure, on the one hand, promotes efficient electron transport at the metal–semiconductor interface, and on the other hand, induces charge redistribution to affect the reactive activity.23–26 Based on these advantages, we believe that this structure will achieve great ENRA performance. Metal–semiconductor electrocatalysts have indeed shown great potential in the ENRA field.27–29 For example, Yu et al. prepared Co/CoO nanosheet arrays by a thermal reduction method, which utilized the rectification effect of Schottky contact between the metal and semiconductor to construct electron-deficient Co, thereby realizing selective electroreduction of nitrate to ammonium and turning waste into treasure.30 Li et al. utilized the sulfur-diffusion method to construct high-density Ni nanoparticles on nitrogen-rich carbon supports (Ni/NC), which promoted the enrichment and immobilization of all NOx− ions on the electrode surface, thereby ensuring the ultimate selectivity toward ammonia.31 In addition, OVs, the most basic form of defects, have been widely used in the ENRA field.32–35 For example, OVs in TiO2 can not only capture nitrate and weaken the N–O bond energy but also inhibit the generation of by-products, thus significantly improving the efficiency of electrocatalytic ammonia production.36 OVs in the amorphous RuO2 phase effectively regulate the d-band center and hydrogen affinity, thereby reducing the energy of the potential-determining step.37 As we know, the electrochemical reduction of nitrates begins with its initial adsorption on the electrode surface (NO3−(aq) ⇄ NO3−(ads)).38 Thus, OVs can reasonably be considered as “grippers” that can effectively anchor nitrate ions to the metal–semiconductor catalyst. Based on the above description, the design and synthesis of metal–semiconductor electrocatalysts with OVs are expected to promote the electroreduction of nitrates to ammonium.
Herein, Cu–Fe2O3-x nanotubes with OVs (labeled as Cu–Fe2O3-x) were designed and prepared on three-dimensional Cu foams (CF) and adopted as efficient electrocatalysts for ENRA as these materials exhibit promising advantages with respect to cost, efficiency, stability, and scalability (Fig. S1, S2 and Tables S1, S2, ESI†). The built-in electric field generated by electron transfer at the interface between the metal and semiconductor, as well as the oxygen vacancies on the surface of the semiconductor, promoted ENRA. The OVs in Cu–Fe2O3-60 exhibited high adsorption energy for NO3− and high H2 generation energy, which inhibited the generation of H2. This work verifies the effect of built-in electric field and OVs in enhancing nitrate electroreduction both theoretically and experimentally and provides ideas for the development of low-cost, efficient and stable electrocatalysts for full-scale application to achieving energy efficiency, emission reduction and environmental protection.
2. Experimental section
2.1 Chemicals and materials
Sodium hydroxide (NaOH, ≥96.0%), ammonium persulphate ((NH4)2S2O8, ≥98.0%), iron nitrate nonahydrate (Fe(NO3)3·9H2O, ≥98.0%), ammonium sulfate-14N ((14NH4)2SO4, 98.5%), ammonium sulfate-15N ((15NH4)2SO4, ≥99 at%, 98.5%), sodium nitrate-14N (Na14NO3, 98.5%), sodium nitrate-15N (Na15NO3, 15N ≥ 99 at%, 98.5%), maleic acid (C4H4O4, ≥99.0%), deuterium oxide (D2O, 99 at% D) were bought from commercial sources. Milli-Q water (18.25 MΩ cm−1) was used across all the experiments. Before use, Cu foam (CF, pore density 120 PPI) was ultrasonically rinsed in acetone, ethanol, and deionized water for 15 minutes to completely remove surface impurities and natural oxides.392.2 Synthesis of the Cu–Fe2O3 nanostructure
The Cu–Fe2O3 nanostructure on CF was synthesized via three steps. Based on the method reported previously by our group, Cu(OH)2 nanowires (NWs) were successfully grown on the surface of CF by in situ oxidation.40 The color of the Cu foams changed from orange–red to blue (see Fig. S3, ESI†). The as-prepared Cu(OH)2 NWs were immersed in a 10 mM Fe3+ solution for some time, and a unique Cu(OH)2–Fe(OH)3 nanostructure was obtained at room temperature. The color of the sample changed to brown–yellow after washing and drying. The prepared samples were denoted as Cu(OH)2–Fe(OH)3-x (x is the immersion time). Then, a heat treatment was carried out under the air for 2 h at 300 °C at a heating rate of 2 °C min−1, after which CuO-Fe2O3-x was obtained. The color changed from brown–yellow to dark-red during this step. The Cu–Fe2O3-x with OVs were obtained by chronopotentiometric electroreduction performed at the current density of 20 mA cm−1. The color of Cu–Fe2O3-x was black (see Fig. S3, ESI†). The details of the samples are listed in Table S3 (ESI†).3. Results and discussion
3.1 Materials characterization
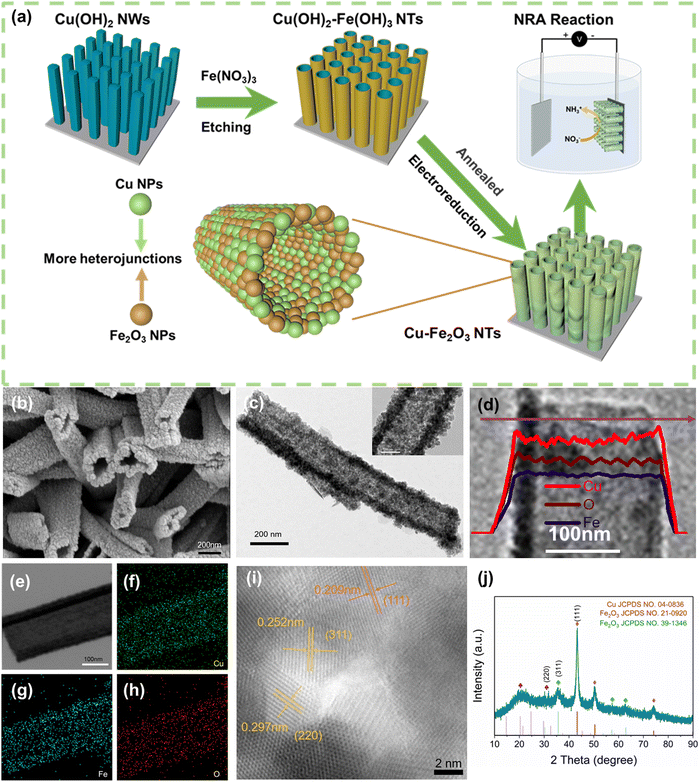
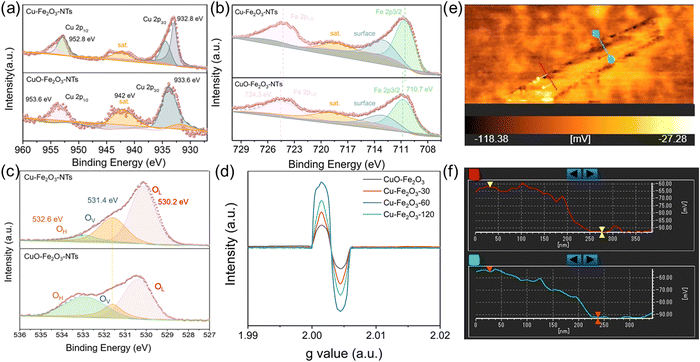
The Cu–Fe2O3-x NTs were prepared by a three-step process (For details, see Fig. 1a and the Experimental section). First, uniform Cu(OH)2 nanowire arrays were directly grown on the skeleton of the copper foam by a surface oxidation process. The foam was then immersed into a 10 mM Fe3+ solution to obtain a unique Cu(OH)2–Fe(OH)3-x (x is the immersion time) (Fig. S4, ESI†). Interestingly, the wall thickness of the nanotubes could be regulated by controlling the immersion time (Fig. S4, ESI†). After air heating and electroreduction, Cu–Fe2O3-x (with an average length and mass loading of ≈1.3 μm and 0.89 mg cm−2, respectively) were successively obtained (Fig. 1b and Fig. S5, ESI†). At the same time, by comparing the scanning electron microscopic (SEM) images of Cu–Fe2O3-30, 60, and 120, we found that when the immersion time was increased to 120s, the nanotube structure broke and was unfavorable for the catalytic reaction. Therefore, we chose Cu–Fe2O3-60 as the experimental material for specific research. As shown in Fig. 1c, the transmission electron microscopic (TEM) images of Cu–Fe2O3-60 at different magnifications showed that the inner diameter of the nanotubes, which were composed of nanoparticles, remained at about 190 nm. In addition, the hybridization distribution of the elements in Cu–Fe2O3-60 was further confirmed by the corresponding crossing-sectional composition line profiles. As shown in Fig. 1d, in Cu–Fe2O3-60, Cu, Fe, and O were evenly distributed in the measured area, which proves that molecular thermal diffusion promoted the hybrid distribution of elements. The elemental hybrid distribution in Cu–Fe2O3-60 was additionally confirmed by the element mappings (Fig. 1e–h). As shown in Fig. 1i, the HR-TEM image of Cu–Fe2O3-60 clearly showed the 0.208, 0.295, and 0.252 nm lattice spacings corresponding to the plane of Cu(111), Fe2O3(220), Fe2O3(311), respectively.41,42 The crystalline phase of the as-prepared sample was characterized using the XRD patterns (Fig. 1j). Except for the diffraction peaks assigned to the Cu (JCPDS No. 04-0836) phase,43 the other diffraction peaks were consistent with those of the standard Fe2O3 (JCPDS No. 21-0920) (JCPDS No. 39-1346) phase.44 The above results show that Cu–Fe2O3-60 nanotubes composed of nano-Cu and nano-Fe2O3 were successfully synthesized by the proposed method.As an electrocatalyst, its surface chemical composition and interface properties would directly affect its catalytic performance; therefore, these characteristics were further analyzed by XPS and EPR. As shown in Fig. 2a and b, charge transfer at the interface of Cu–Fe2O3-60 was investigated. First, the typical Cu, Fe 2p XPS spectra of CuO-Fe2O3 and Cu–Fe2O3-60 were obtained to further clarify the electron redistribution.30 Compared with CuO-Fe2O3, Cu–Fe2O3-60 had additional main peaks at 932.8 eV and 952.8 eV, which were attributed as the characteristic peaks of Cu 2p3/2 and Cu 2p1/2 of Cu0, respectively (Fig. 2a).45 Compared with Cu (932.4 eV and 952.2 eV for Cu0),46 the binding energy of Cu0 in Cu–Fe2O3-60 appeared to have shifted slightly in the positive direction, indicating the decreased electron density of metal Cu in Cu–Fe2O3-60 due to electron loss.47 Simultaneously, the slight negative shifts (ca. 0.3 eV for Fe 2p3/2 and 0.4 eV for Fe 2p1/2) in the binding energy of Fe3+ in Cu–Fe2O3-60 compared with CuO-Fe2O3 (710.7 and 724.3 eV) suggested that Cu–Fe2O3-60 had gained electrons and become an electron-rich body on the Fe2O3 side (Fig. 2b).48,49 The O 1s XPS and EPR were examined to confirm the presence of more OVs in Cu–Fe2O3-x. The O 1s XPS spectra (Fig. 2c) showed three peaks centered at 530.2, 531.4 and 532.6 eV, corresponding to lattice oxygen (OL), oxygen vacancies (OV) and hydroxyl groups (OH), respectively.50 The area ratios of the OV peak relative to the total area of the OL, OV and OH peaks [SOV/(SOL + SOV + SOH)] were 11.12% and 34.99% for CuO-Fe2O3 and Cu–Fe2O3-60, respectively. The larger area percentage at ∼531.4 eV in the Cu–Fe2O3-60 spectrum indicates that the concentration of OVs in Cu–Fe2O3-60 was much higher than that in CuO-Fe2O3 due to the electroreduction treatment. Besides, compared with Cu–Fe2O3-30 and Cu–Fe2O3-120 after electroreduction, Cu–Fe2O3-60 exhibited a stronger EPR signal at g = 2.003, indicating that a higher concentration of OVs in Cu–Fe2O3-60 (Fig. 2d).51 The above results prove that electron transfer from metallic Cu to semiconductor Fe2O3 at the interface of Cu–Fe2O3-60 and the electroreduction treatment could create much more OVs in Cu–Fe2O3-x.52 The change in the built-in electric field in Cu–Fe2O3-x due to electron transfer was further studied. As shown in Fig. 2e and Fig. S6, (ESI†) we used a Kelvin probe atomic force microscope to analyze the surface charge of Cu–Fe2O3-x. Compared with Cu–Fe2O3-30 (12.76 mV) and Cu–Fe2O3-120 (19.96 mV), the contact potential difference between the internal Cu and Fe2O3 heterogeneous interface and Si substrate in Cu–Fe2O3-60 (32.62 mV) was more negative (Fig. 2f). In other words, it is logical to believe that the negatively charged surface field on Fe2O3 NPs expands by accepting more electrons from Cu NP-based electron donors in Cu–Fe2O3-60.
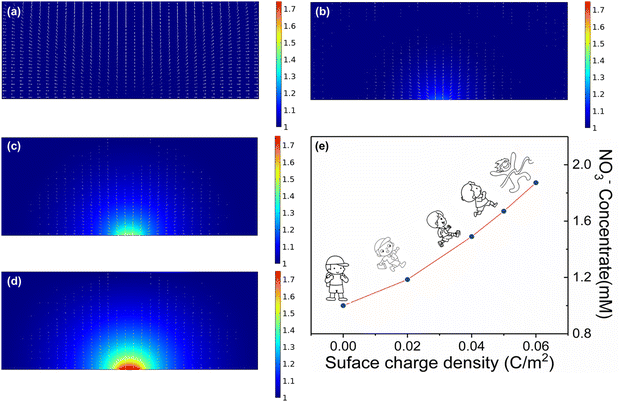
We directly associate the built-in electric field with the enrichment of nitrate ions near the catalyst. To understand the catalytic enhancement effect of the built-in electric field, we further simulated the nitrate enrichment process using finite element analysis. As shown in Fig. 3a–d and Fig. S7 (ESI†), to quantitatively calculate the influence of the electric field on the concentration of nitrate on the surface, we used a two-dimensional plane model to simulate the enrichment of nitrate ion density near the electrode. Compared with the negligible neutral surface, the charged electrode with a local electric field could greatly increase the nitrate ion density, and the stronger the electric field was, the more obvious the nitrate enrichment effect. More importantly, the nitrate anion density on the simulated heterogeneous interface increased from 1 to 1.87 mM with the introduction of a small number of charges (0.06 C m−2), theoretically demonstrating the key role of the built-in electric field in enhancing the enrichment of nitrate anions (Fig. 3e).
3.2 Electrochemical nitrate reduction activity
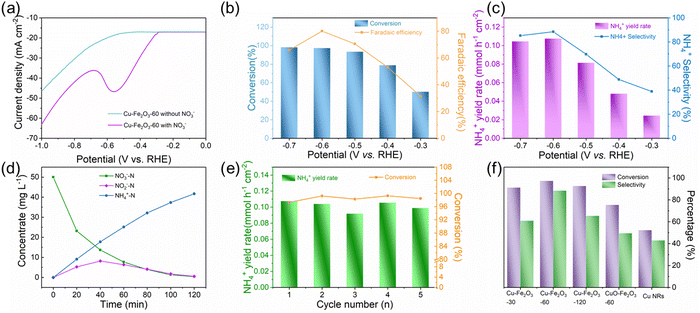
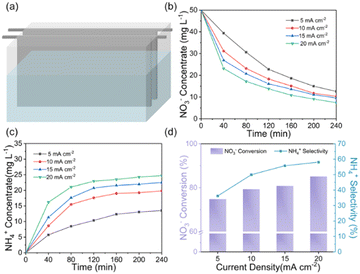
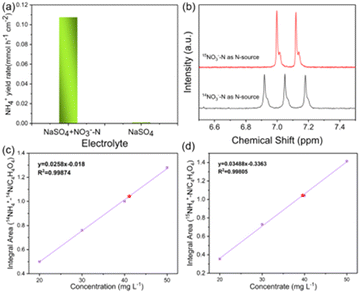
The ENRA performance of Cu–Fe2O3-x was evaluated by using a typical three-electrode system (Fig. S8, ESI†). The concentrations of nitrate, nitrite, and ammonium in the electrolyte before and after the test were determined by colorimetric methods (Fig. S9, ESI†).53–55 Before the experiment, we measured the electrochemical double-layer capacitance by cyclic voltammetry and then compared the electrochemical surface area (ECSA) of the different catalysts. As shown in Fig. S10 and Table S4 (ESI†), the ECSAs of Cu–Fe2O3-30, Cu–Fe2O3-60 and Cu–Fe2O3-120 were 27.51, 40.53 and 33.91 cm2, respectively, which preliminarily reflect the catalytic superiority of Cu–Fe2O3-60. Then, LSV measurements of Cu–Fe2O3-30, 60, and 120 were performed in a 0.5 M Na2SO4 solution with and without 50 ppm NO3−–N (Fig. 4a and Fig. S11, ESI†). The current density increased significantly at −0.3 V vs. RHE with the addition of NO3−, suggesting that NO3− in the solution participated in the reduction reactions. Thus, the nitrate reduction reactions on Cu–Fe2O3-30, 60 and 120 were studied in the potential range from −0.3 to −0.7 V vs. RHE (Fig. S12, ESI†). Under the same potential, the nitrate conversion rate, ammonium selectivity and yield rate of Cu–Fe2O3-60 were obviously higher than those of Cu–Fe2O3-30 and Cu–Fe2O3-120. Based on the above results, Cu–Fe2O3-60 was selected for follow-up research. From −0.3 V to −0.7 V vs. RHE, the conversion rate of NO3− increased gradually, while the Faraday efficiency showed a volcano-shaped curve, which reached a maximum of 80.1% at −0.6 V vs. RHE (Fig. 4b). In addition, Fig. 4c displays the selectivity and yield of ammonium at different potentials. The results show that the optimal selectivity of 88.47% and the yield rate of 0.108 mmol h−1 cm−2 were achieved at −0.6 V vs. RHE. Meanwhile, the selectivity of NO2−−N and NH4+–N both tended to reach the optimal value at −0.6 V vs. RHE (Fig. S13, ESI†). Therefore, we chose −0.6 V vs. RHE as the operational potential for the ENRA activity test. With the prolongation of the reduction reaction time, the concentration of NO3−–N continuously decreased, while the concentration of NH4+–N increased, which means that NO3−–N was reduced to NH4+–N. At the same time, the concentration of NO2−–N ramped up first and then declined, indicating that the reaction had high selectivity for ammonium (Fig. 4d). Simultaneously, the nitrite selectivity of Cu–Fe2O3-30, Cu–Fe2O3-60, Cu–Fe2O3-120 decreased gradually and tended to a lower value at −0.6 V vs. RHE, which further proved the high selectivity for the reduction of nitrate to ammonium (Fig. S14, ESI†). Moreover, the nitrate conversion and ammonium yield rate of Cu–Fe2O3-60 showed no obvious decay after five consecutive recycling tests using the same piece of catalyst, confirming its excellent stability (Fig. 4e). In addition, Cu–Fe2O3-60 still retained the original tubular array morphology (Fig. S15, ESI†). At the same time, the XRD and XPS data of the tested samples also showed that the phase of Cu–Fe2O3-60 had not changed significantly (Fig. S16, ESI†). Finally, the performance of Cu–Fe2O3-30, Cu–Fe2O3-120, CuO-Fe2O3-60 and Cu NWs was studied and compared with that of Cu–Fe2O3-60. As shown in Fig. 4f, the conversion rate of NO3− and selectivity for ammonium were 91.25% and 60.96% over Cu–Fe2O3-30, 92.72% and 65.43% over Cu–Fe2O3-120, 75.46% and 49.59% over CuO-Fe2O3-60, and 52.35% and 42.96% over Cu NWs, respectively, which were significantly lower than those of Cu–Fe2O3-60 (conversion rate of NO3−: 97.33%, selectivity of ammonium: 88.47%). Compared with Cu–Fe2O3-60, the yield of ammonium while using Cu–Fe2O3-30, Cu–Fe2O3-120, CuO-Fe2O3-60 and Cu NWs at −0.6 V vs. RHE was also far from satisfactory (Fig. S17, ESI†). Based on the previous evaluation of the built-in electric field and oxygen vacancies in Cu–Fe2O3-x, we could conclude that the best catalytic performance of Cu–Fe2O3-60 was due to the positive effect of the built-in electric field and oxygen vacancies. To expand this experiment from the laboratory to industrial scale, we constructed a 180 L pilot-scale reactor that used Cu–Fe2O3-60 integrated with a titanium plate to convert nitrate to ammonium in simulated wastewater. Fig. S18 (ESI†) shows the physical setup of the reactor, in which the internal circulation was implemented by using a circulating pump to enhance mass transfer to amplify the overall performance of electrocatalysis. As shown in Fig. 5, the concentrate-time curves of nitrate and ammonium were recorded under different current densities. It was found that a conversion rate close to 85% was maintained at the current density of 20 mA cm−2, which preliminarily supports the application of the catalyst at the industrial scale. The above results show that Cu–Fe2O3-60, which exhibits high catalytic activity, selectivity and stability in both experimental and industrial settings, is suitable for large-scale application in ENRA.To eliminate possible interferences from the electrocatalyst itself or the environment, the electrochemical measurement was performed in the pure Na2SO4 electrolyte (Fig. 6a), and the result showed that the generation of ammonium could be ignored. In addition, 15N isotope labeling experiments were implemented to verify the sources of ammonium, and the yield rate of ammonium was quantified by the 1H NMR spectra.56–59 We carried out electrochemical measurements at −0.6 V vs. RHE for 2.0 h in the solutions with Na15NO3 and Na14NO3 as the N sources, respectively. As shown in Fig. 6b, when the electrocatalytic reduction was implemented in the solution with Na15NO3, the 1H NMR spectra of the products showed the representative double peaks of 15NH4+ at δ = 6.97 and 7.09 ppm, and there was no triple peak representing 14NH4+ at δ = 6.94, 7.03 and 7.12 ppm (Fig. 6b). This result proves that the ammonium produced by electrocatalytic reduction came entirely from nitrate. Maleic acid (C4H4O4) was used as the external standard for quantifying the produced 15NH4+–N and 14NH4+–N products (Fig. S19 and S20, ESI†). The standard curve of the integral area against the concentration of NH4+–N was established to determine the concentration of 15NH4+–N or 14NH4+–N (Fig. 6c and d). The quantitative 1H NMR results of ammonium produced were very close to the quantitative results from the colorimetric methods (Table S5, ESI†), which confirms the accuracy of the different quantitative methods.
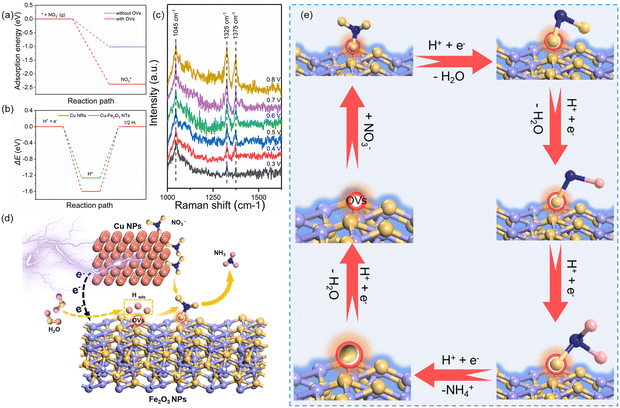
Based on the excellent catalytic performance of Cu–Fe2O3-60, the enhancement mechanism of OV and the reaction path of nitrate electroreduction in Cu–Fe2O3-60 were explored by the in situ Raman test and theoretical calculations. For comparison, the Fe2O3(220) surface without OVs and with OVs were chosen as models (Fig. S21, ESI†). The adsorption energy of NO3− on Fe2O3(220) with OVs was −2.38 eV, which was much higher than that on Fe2O3(220) without OVs (−1.02 eV) (Fig. 7a). This result confirmed the key role of OVs in anchoring NO3−. In other words, the existence of OVs promoted the initial anchoring of NO3− on the catalyst surface, and the strong anchoring of NO3− on the catalyst surface will inhibit the competitive anchoring of other anions in the solution, thus ensuring the overall reduction reaction process. Hence, the anchoring mechanism of OVs should be considered an important factor that favors the subsequent reduction reaction of NO3− along with the proton–electron pairs. Additionally, the energy barrier of H2 formation on Cu–Fe2O3-60 with OVs was 1.6 eV, which was higher than that on Cu NWs (1.27 eV), indicating poor HER activity over the Cu–Fe2O3 NTs (Fig. 7b). Then, the in situ Raman spectra were recorded to capture the adsorbed intermediates on the electrode.60Fig. 7c displays the absorbance spectra from −0.3 to −0.8 V vs. RHE. During electrocatalytic nitrate reduction, an obvious Raman characteristic peak was observed at 1045 cm−1, which was attributed to the stretching vibration of adsorbed NO3−.61 Surprisingly, a significant Raman peak was observed at 1315–1330 cm−1, which could be designated to ammonia adsorption.62 In addition, the characteristic peak observed at 1375 cm−1 could be assigned to the antisymmetric stretching of NO2− in nitrate during the electrocatalytic nitrate reduction process.61 Theoretically, the Raman shift of NH4+ is around 1400 cm−1 and 1480 cm−1,63 but its Raman signal could not be detected due to its weak intensity in water. However, colorimetric methods and nuclear magnetic resonance have long been used to prove the existence of NH4+. The schematic of the built-in electric field formation and electrocatalytic reduction is shown in Fig. 7d. When metals and semiconductors are placed together, spontaneous charge directional movement occurs at their interface, thereby resulting in a built-in electric field. As the external driving force of nitrate enrichment, the built-in electric field plays a vital role. Based on the spontaneous electron transfer from Cu to Fe2O3, the built-in electric field verified by KPFM promotes the enrichment of NO3− at the interface, which solves the problem of slow mass transfer of nitrate in the solution. The OVs act as grippers and anchor the NO3- at the interface, giving rise to the adsorbed nitrate state  , which completes the overall reduction reaction due to the action of proton–electron pairs. Based on the above intermediates detected in the in situ Raman spectra and reported in the literature,64 we propose the steps of the whole process from the anchoring of OVs to the recovery of OVs after the reduction of nitrate to ammonium (Fig. 7e). The three O atoms in NO3− are labeled as O1, O2 and O3, respectively. For NO3− anchoring on the Cu–Fe2O3-60 surface with vacancies, O1 of NO3− fills in the OV site to form
  . The N–O3 bond is broken by the action of the proton–electron pairs to form
  and H2O. Then, by adsorbing a proton to couple with an electron transfer, the N–O2 bond in
  is broken, and
  is converted to H2NO*. Subsequently, H2NO* couples with the proton–electron pairs to form NH4+, leaving O1 on the OV site. Finally, the O filling the OV site is reduced to H2O by protons to restore the oxygen vacancy on the surface. Based on the built-in electric field and OVs of Cu–Fe2O3-60, an assembly-line electrocatalytic reduction route for the recovery of the nitrate-anchoring vacancies, thereby achieving a cycle-efficient catalytic effect.
4. Conclusions
In summary, we successfully synthesized Cu–Fe2O3-60, which exhibits excellent catalytic activity, faradaic efficiency, and selectivity for nitrate electroreduction. The XPS, KPFM and EPR results confirmed the formation of a built-in electric field and OVs. Based on the enhancement effect of the built-in electric field and OVs, we have reasonably proposed an assembly-line electroreduction route for nitrate enrichment via anchoring. Under the optimal potential, the nitrate conversion rate, faradaic efficiency and selectivity for ammonium reached 97.33%, 80.1%, and 88.47%, respectively. The 15N isotope labeling experiment certified that ammonium was produced solely from nitrate electroreduction. The accuracy of the data was verified mutually by 1H NMR spectroscopy and colorimetric methods. Based on the results of in situ Raman spectroscopy and the colorimetric methods, we deduced the reaction path. The results of the theoretical calculations and structural model show that an oxygen atom in nitrate fills the OV site, which weakens N–O bonding and promotes the speed-controlling step of nitrate conversion. The subsequent intermediate generates the target ammonium and restores the oxygen vacancies on the surface under the action of proton–electron pairs. The assembly-line-like design for material engineering is conducive to solving the problem of low ammonium generation rate at low concentrations.Author contributions
Yihong Gao: conceptualization, investigation, formal analysis, data curation, methodology, writing – original draft, writing – review & editing; Kun Huang: conceptualization, investigation, formal analysis, data curation, validation; Chen Yan: theoretical calculation; Hui Zhang: methodology, investigation; Shikuo Li: methodology, investigation; Longjiu Cheng: formal analysis, performed the theoretical calculations; Fangzhi Huang: conceptualization, data curation, formal analysis, funding acquisition, resources, supervision.Conflicts of interest
There are no conflicts to declare.Acknowledgements
This work was supported by the National Natural Science Foundation of China (52172174 and 21771001), Key projects of quality engineering teaching and research in Anhui Province (2018jyxm0365), Anhui provincial key research and development plan (202004a07020026), the Program of Anhui Scientific and Technical Leaders Reserve Candidates (2018H168), the Scholar Program for the Outstanding Innovative Talent of College Discipline (Specialty), and open fund for Discipline Construction, Institute of Physical Science and Information Technology, Anhui University. Key Lab of Photovoltaic and Energy Conservation Materials, Chinese Academy of Sciences is gratefully acknowledged by the authors.References
- N. Lehnert, H. T. Dong, J. B. Harland, A. P. Hunt and C. J. White, Nat. Rev. Chem., 2018, 2, 278–289 CrossRef CAS.
- M. Duca and M. T. M. Koper, Energy Environ. Sci., 2012, 5, 9726–9742 RSC.
- Z. Zhang, Y. Xu, W. Shi, W. Wang, R. Zhang, X. Bao, B. Zhang, L. Li and F. Cui, Chem. Eng. J., 2016, 290, 201–208 CrossRef CAS.
- K. N. Heck, S. Garcia-Segura, P. Westerhoff and M. S. Wong, Acc. Chem. Res., 2019, 52, 906–915 CrossRef CAS PubMed.
- H. Niu, Z. Zhang, X. Wang, X. Wan, C. Shao and Y. Guo, Adv. Funct. Mater., 2020, 31, 2008533 CrossRef.
- E. Pérez Gallent, M. C. Figueiredo, I. Katsounaros and M. T. M. Koper, Electrochim. Acta, 2017, 227, 77–84 CrossRef.
- W. Li, S. Patton, J. M. Gleason, S. P. Mezyk, K. P. Ishida and H. Liu, Environ. Sci. Technol., 2018, 52, 6417–6425 CrossRef CAS PubMed.
- M. Alikhani and M. R. Moghbeli, Chem. Eng. J., 2014, 239, 93–104 CrossRef CAS.
- K. M. Chon, Y. H. Lee, J. Traber and U. V. Gunten, Water Res., 2013, 47, 5381–5391 CrossRef CAS PubMed.
- A. C. Alba-Rubio, J. L. G. Fierro, L. León-Reina, R. Mariscal, J. A. Dumesic and M. López Granados, Appl. Catal., B, 2017, 202, 269–280 CrossRef CAS.
- J. Ma, Q. Yang, S. Wang, L. Wang, A. Takigawa and Y. Peng, J. Hazard. Mater., 2010, 175, 518–523 CrossRef CAS PubMed.
- S. J. Tesh and T. B. Scott, Adv. Mater., 2014, 26, 6056–6068 CrossRef CAS PubMed.
- M. Markiewicz, J. Kumirska, I. Lynch, M. Matzke, J. Köser, S. Bemowsky, D. Docter, R. Stauber, D. Westmeier and S. Stolte, Green Chem., 2018, 20, 4133–4168 RSC.
- L. Su, D. Han, G. Zhu, H. Xu, W. Luo, L. Wang, W. Jiang, A. Dong and J. Yang, Nano Lett., 2019, 19, 5423–5430 CrossRef CAS PubMed.
- W. Hong, L. Su, J. Wang, M. Jiang, Y. Ma and J. Yang, Chem. Commun., 2020, 56, 14685–14688 RSC.
- H. Xu, J. Wu, W. Luo, Q. Li, W. Zhang and J. Yang, Small, 2020, 16, 2001775 CrossRef CAS PubMed.
- W. J. Sun, H. Q. Ji, L. X. Li, H. Y. Zhang, Z. K. Wang, J. H. He and J. M. Lu, Angew. Chem., Int. Ed., 2021, 60, 22933–22939 CrossRef CAS PubMed.
- G. Chen, Y. Yuan, H. Jiang, S. Ren, L. Ding, L. Ma, T. Wu, J. Lu and H. Wang, Nat. Energy, 2020, 5, 605–613 CrossRef CAS.
- Y. Lan, J. Chen, H. Zhang, W. Zhang and J. Yang, J. Mater. Chem. A, 2020, 8, 15853–15863 RSC.
- J. Gao, N. Shi, X. Guo, Y. Li, X. Bi, Y. Qi, J. Guan and B. Jiang, Environ. Sci. Technol., 2021, 55, 10684–10694 CrossRef CAS PubMed.
- Y. Guo, R. Zhang, S. Zhang, Y. Zhao, Q. Yang, Z. Huang, B. Dong and C. Zhi, Energy Environ. Sci., 2021, 14, 3938–3944 RSC.
- H. Liu, X. Lang, C. Zhu, J. Timoshenko, M. Ruscher, L. Bai, N. Guijarro, H. Yin, Y. Peng, J. Li, Z. Liu, W. Wang, B. R. Cuenya and J. Luo, Angew. Chem., Int. Ed., 2022, e202202556 CAS.
- D. Wang and X. Gong, Nat. Commun., 2021, 12, 158 CrossRef CAS PubMed.
- Z. Xue, H. Su, Q. Yu, B. Zhang, H. Wang, X. Li and J. Chen, Adv. Energy Mater., 2017, 7, 1602355 CrossRef.
- J. Hou, Y. Sun, Y. Wu, S. Cao and L. Sun, Adv. Funct. Mater., 2018, 28, 1704447 CrossRef.
- H. Su, K. Zhang, B. Zhang, H. Wang, Q. Yu, X. Li, M. Antonietti and J. Chen, J. Am. Chem. Soc., 2017, 139, 811–818 CrossRef CAS PubMed.
- H. Wang, Q. Mao, T. Ren, T. Zhou, K. Deng, Z. Wang, X. Li, Y. Xu and L. Wang, ACS Appl. Mater. Interfaces, 2021, 13, 44733–44741 CrossRef CAS PubMed.
- R. Zhang, Y. Guo, S. Zhang, D. Chen, Y. Zhao, Z. Huang, L. Ma, P. Li, Q. Yang, G. Liang and C. Zhi, Adv. Energy Mater., 2022, 2103872 CrossRef CAS.
- W. Teng, N. Bai, Y. Liu, Y. Liu, J. Fan and W. Zhang, Environ. Sci. Technol., 2018, 52, 230–236 CrossRef CAS PubMed.
- Y. Yu, C. Wang, Y. Yu, Y. Wang and B. Zhang, Sci. China: Chem., 2020, 63, 1469–1476 CrossRef CAS.
- P. Gao, Z. H. Xue, S. N. Zhang, D. Xu, G. Y. Zhai, Q. Y. Li, J. S. Chen and X. H. Li, Angew. Chem., Int. Ed., 2021, 60, 20711–20716 CrossRef CAS PubMed.
- X. Wan, W. Guo, X. Dong, H. Wu, X. Sun, M. Chu, S. Han, J. Zhai, W. Xia, S. Jia, M. He and B. Han, Green Chem., 2022, 24, 1090–1095 RSC.
- J. Wang, C. Cai, Y. Wang, X. Yang, D. Wu, Y. Zhu, M. Li, M. Gu and M. Shao, ACS Catal., 2021, 11, 15135–15140 CrossRef CAS.
- X. Zhang, C. Wang, Y. Guo, B. Zhang, Y. Wang and Y. F. Yu, J. Mater. Chem. A, 2022, 10, 6448–6453 RSC.
- X. Li, W. Fan, Y. Bai, Y. Liu, F. Wang, H. Bai and W. Shi, Chem. Eng. J., 2022, 433, 133225 CrossRef CAS.
- R. Jia, Y. Wang, C. Wang, Y. Ling, Y. Yu and B. Zhang, ACS Catal., 2020, 10, 3533–3540 CrossRef CAS.
- Y. T. Wang, H. J. Li, W. Zhou, X. Zhang, B. Zhang and Y. F. Yu, Angew. Chem., Int. Ed., 2022, e202202604 CAS.
- X. Zhang, Y. Wang, C. Liu, Y. Yu, S. Lu and B. Zhang, Chem. Eng. J., 2021, 403, 126269 CrossRef CAS.
- X. Fu, C. Shang, G. Zhou and X. Wang, J. Mater. Chem. A, 2021, 9, 24963–24970 RSC.
- Q. Li, W. Deng, C. Li, Q. Sun, F. Huang, Y. Zhao and S. Li, ACS Appl. Mater. Interfaces, 2018, 10, 40265–40273 CrossRef CAS PubMed.
- Y. Wang, W. Zhou, R. Jia, Y. Yu and B. Zhang, Angew. Chem., Int. Ed., 2020, 59, 5350–5354 CrossRef CAS PubMed.
- M. Li, C. Liu, Z. Zhang, S. Cao, H. Liu, S. Shen and W. Wang, Sep. Purif. Technol., 2022, 281, 119978 CrossRef CAS.
- W. Liu, Z. Zhang, Y. Zhang, Y. Zheng, N. Liu, J. Su and Y. Gao, Nano-Micro Lett., 2021, 13, 61 CrossRef PubMed.
- X. Meng, Y. Xu, X. Sun, L. Xiong and Q. Wang, J. Power Sources, 2016, 326, 389–396 CrossRef CAS.
- C. F. Yang, W. D. Zhong, K. Shen, Q. Zhang, R. Zhao, H. Xiang, J. Wu, X. K. Li and N. J. Yang, Adv. Energy Mater., 2022, 2200077 CrossRef CAS.
- P. Ling, Q. Zhang, T. Cao and F. Gao, Angew. Chem., Int. Ed., 2018, 57, 6819–6824 CrossRef CAS PubMed.
- W. He, J. Zhang, S. Dieckhofer, S. Varhade, A. C. Brix, A. Lielpetere, S. Seisel, J. R. C. Junqueira and W. Schuhmann, Nat. Commun., 2022, 13, 1129 CrossRef CAS PubMed.
- M. Tahir, L. Pan, R. Zhang, Y. Wang, G. Shen, I. Aslam, M. A. Qadeer, N. Mahmood, W. Xu, L. Wang, X. Zhang and J. Zou, ACS Energy Lett., 2017, 2, 2177–2182 CrossRef CAS.
- Y. Lu, C. Dong, Y. Huang, Y. Zou, Y. Liu, Y. Li, N. Zhang, W. Chen, L. Zhou, H. Lin and S. Wang, Sci. China: Chem., 2020, 63, 980–986 CrossRef CAS.
- Z. Ping, Q. Sun, J. Yi, Q. Li, L. Zhao, H. Zhang, F. Huang, S. Li and L. Cheng, ACS Appl. Mater. Interfaces, 2021, 13, 49556–49566 CrossRef CAS PubMed.
- X. Yu, B. Kim and Y. K. Kim, ACS Catal., 2013, 3, 2479–2486 CrossRef CAS.
- K. Qian, Y. Yan, S. Xi, T. Wei, Y. Dai, X. Yan, H. Kobayashi, S. Wang, W. Liu and R. Li, Small, 2021, 17, 2102970 CrossRef CAS PubMed.
- S. Ye, Z. Chen, G. Zhang, W. Chen, C. Peng, X. Yang, L. Zheng, Y. Li, X. Ren, H. Cao, D. Xue, J. Qiu, Q. Zhang and J. Liu, Energy Environ. Sci., 2022, 15, 760–770 RSC.
- C. Lv, L. Zhong, H. Liu, Z. Fang, C. Yan, M. Chen, Y. Kong, C. Lee, D. Liu, S. Li, J. Liu, L. Song, G. Chen, Q. Yan and G. Yu, Nat. Sustain., 2021, 4, 868–876 CrossRef.
- Z. Wu, M. Karamad, X. Yong, Q. Huang, D. Cullen, P. Zhu, C. Xia, Q. Xiao, M. Shakouri, F. Chen, J. Y. T. Kim, Y. Xia, K. Heck, Y. Hu, M. Wong, Q. Li, I. Gates, S. Siahrostami and H. Wang, Nat. Commun., 2021, 12, 2870 CrossRef CAS PubMed.
- S. Z. Andersen, V. Colic, S. Yang, J. A. Schwalbe, A. C. Nielander, J. M. McEnaney, K. Enemark-Rasmussen, J. G. Baker, A. R. Singh, B. A. Rohr, M. J. Statt, S. J. Blair, S. Mezzavilla, J. Kibsgaard, P. C. K. Vesborg, M. Cargnello, S. F. Bent, T. F. Jaramillo, I. E. L. Stephens, J. K. Norskov and I. Chorkendorff, Nature, 2019, 570, 504–508 CrossRef CAS PubMed.
- L. Zhang, L. Ding, G. Chen, X. Yang and H. Wang, Angew. Chem., Int. Ed., 2019, 58, 2612–2616 CrossRef CAS PubMed.
- X. Yang, J. Nash, J. Anibal, M. Dunwell, S. Kattel, E. Stavitski, K. Attenkofer, J. Chen, Y. Yan and B. Xu, J. Am. Chem. Soc., 2018, 140, 13387–13391 CrossRef CAS PubMed.
- C. Hu, X. Chen, J. Jin, Y. Han, S. Chen, H. Ju, J. Cai, Y. Qiu, C. Gao, C. Wang, Z. Qi, R. Long, L. Song, Z. Liu and Y. Xiong, J. Am. Chem. Soc., 2019, 141, 7807–7814 CrossRef CAS PubMed.
- J. S. Zhu, H. Yang, W. H. Zhang, Y. C. Mao, S. S. Lyu and J. Chen, Inorg. Chem. Front., 2020, 7, 1892–1899 RSC.
- D. P. Butcher Jr. and A. A. Gewirth, Nano Energy, 2016, 29, 457–465 CrossRef.
- F. Lei, K. Li, M. Yang, J. Yu, M. Xu, Y. Zhang, J. Xie, P. Hao, G. Cui and B. Tang, Inorg. Chem. Front., 2022, 9, 2734–2740 RSC.
- S. H. Han, S.-i Jeon, J. Lee, J. Ahn, C. Lee, J. Lee and J. Y. Yoon, Chem. Eng. J., 2022, 431, 134233 CrossRef CAS.
- Y. X. Guo, J. R. Stroka, B. Kandemir, C. E. Dickerson and K. L. Bren, J. Am. Chem. Soc., 2018, 140, 16888–16892 CrossRef CAS PubMed.
Footnotes |
| † Electronic supplementary information (ESI) available. See DOI: https://doi.org/10.1039/d2ma00685e |
| ‡ These authors contribute equally to this paper. |
| This journal is © The Royal Society of Chemistry 2022 |

