DOI:
10.1039/D2MA00537A
(Paper)
Mater. Adv., 2022,
3, 6584-6596
Colour tunable cool pigments based on TiZn2O4 inverse spinels†
Received
16th May 2022
, Accepted 13th July 2022
First published on 18th July 2022
Abstract
A new class of near-infrared (NIR) reflecting yellow and orange cool pigments based on TiZn2O4 inverse spinels were synthesized. The colour tuning in pure TiZn2O4 was made possible by the substitution of octahedral Zn2+ ions by Cu2+ and Fe3+ ions separately. By the incorporation of Cu2+ and Fe3+ ions into the inverse spinel lattice in varying amounts, a series of pigment compositions having colours ranging from greenish-yellow to reddish-brown was obtained. The developed pigments exhibited moderate to high NIR reflectance ranging from 47.61 to 87.81%. The TiZn2O4 based NIR reflecting pigment provided an interior 4.8 °C cooler than an uncoated roofed interior. Cu2+ and Fe3+ doped TiZn2O4 systems were found to be highly stable and eco-friendly cool pigment candidates capable of achieving better thermal conditioning and impressive energy conservation.
Introduction
Colour plays a crucial role in conveying information, creating memories, determining moods, and even in decision making. In such a way, inorganic pigments capable of imparting colours also have an effect on us. There are a wide range of inorganic pigments available in the market spanning over a broad range of colours.1,2 The investigations for more attractive and affordable pigments with better characteristics are still on. The development of environmentally benign inorganic pigments is one of the prime objectives of pigment manufacturers. The presence of elements such as Cd, Cr and Pb in pigment compositions is discouraged nowadays.3,4 Lead tin oxide (PbSnO3), cadmium sulfide (CdS), nickel titanate (NiTiO3), Al2O3:Cr3+ (corundum), cadmium red (CdS:CdSe), etc. are some of the conventional inorganic pigments in the yellow-orange-red colour range in use.5–9 The presence of heavy metals in these pigments is a deterrent to their commercial use. Such pigments can cause serious health and environmental hazards.10,11 Synthesis of efficient substitutes for hazardous pigments without compromising the optical characteristics and stability is one of the challenges faced by manufacturers. Environmental friendliness, economic viability and high stability are the main objectives of present-day pigment research.12–15 Apart from the aesthetic aspects, the functional properties of pigments such as solar reflectance, magnetic nature, corrosion inhibition, etc. are also under exploration.1,16 Earth's temperature has risen by 0.18 °C per decade since 1981.17 The rising global temperature will lead to a climatic catastrophe if left unaddressed. About 52% of the solar spectrum consist of NIR.18 These NIR radiations are responsible for the heat build-up from solar radiation. To deal with the heat build-up inside buildings, cooling facilities which consume an immense amount of energy are in use. Here arises the significance of NIR reflecting cool pigment coatings, which has an instantaneous effect as well as a long-term impact on rising global temperature.19,20 The instant effect is nothing but the cooler interiors provided by the NIR reflecting pigment-coated buildings even in the midst of high solar irradiance. The long-term impact occurs from the energy conserved by the utilization of cool coatings instead of air conditioning and other cooling appliances. In the long run, conservation of the energy spent on cooler interiors can lead to a more sustainable and eco-friendly mode of energy utilization.
We have chosen the less explored TiZn2O4 inverse spinel system as our parent material for investigation.21 By incorporating Cu2+ and Fe3+ ions into the TiZn2O4 lattice, we have developed a series of pigment compositions with colours ranging from greenish-yellow to reddish-brown. Here we report TiZn2O4-based pigments as affordable, high NIR reflecting and eco-friendly alternatives to many of the environmentally malignant and high-cost commercial pigments.
Experimental
Materials
Zinc nitrate (Zn(NO3)2·6H2O, Alfa Aesar, 98%), titanium isopropoxide (Ti(OCH(CH3)2)4, Aldrich Chemistry, 97%), cupric nitrate trihydrate (Cu(NO3)2·3H2O, Alfa Aesar, 98%), ferric nitrate nonahydrate (Fe(NO3)3·9H2O, Alfa Aesar, 98%) and citric acid monohydrate (C6H8O7·H2O, Vetec AR, 99.5%) were used as received. Commercial titanium dioxide (TiO2) powder and acrylic repair material (DPI RR cold cure) were used for coating application studies.
Synthesis
The pigments of formulated stoichiometries were developed by the solution combustion method. Stoichiometric amounts of metal nitrate precursors were dissolved in a minimum amount of distilled water. Titanium isopropoxide was separately dissolved in 10% HNO3 solution and added to the former solution of metal nitrates. Then, the calculated amount of citric acid was added as a fuel (the fuel-to-oxidiser ratio was maintained at 0.4). The precursor solution was placed on a hotplate with constant stirring at a temperature of 250 °C. The reactant mixture slowly transformed into a viscous gel which on combustion formed a fluffy voluminous solid. The obtained solids were ground using a mortar and pestle and the finely powdered samples were then transferred to crucibles and placed in a muffle furnace for calcination at a temperature of 800 °C for 3 h to obtain the pigment powders of desired compositions. The structural compositions of the Cu2+ and Fe3+ doped series of pigments are given in Table 1 along with their abbreviations.
Table 1 Composition and the corresponding abbreviations of the developed TiZn2O4 based pigments
| Composition |
Abbreviation |
| TiZn2O4 |
TZ |
| TiZn1.8Cu0.2O4 |
TZC-0.2 |
| TiZn1.6Cu0.4O4 |
TZC-0.4 |
| TiZn1.4Cu0.6O4 |
TZC-0.6 |
| TiZn1.2Cu0.8O4 |
TZC-0.8 |
| TiZn1Cu1O4 |
TZC-1 |
| TiZn1.8Fe0.2O4.1 |
TZF-0.2 |
| TiZn1.6Fe0.4O4.2 |
TZF-0.4 |
| TiZn1.4Fe0.6O4.3 |
TZF-0.6 |
| TiZn1.2Fe0.8O4.4 |
TZF-0.8 |
| TiZn1Fe1O4.5 |
TZF-1 |
Preparation of coatings and thermal shielding evaluation
Selected pigment compositions were used to make NIR reflecting coatings over concrete and aluminium sheets. The preparation of NIR reflecting coatings was done in two steps. The first step involves the coating of a concrete cement block/Al sheet with TiO2, which is a highly NIR reflecting pigment. In the next step, the designed pigments are coated onto the TiO2 precoated concrete/Al sheets. For this, the developed pigments are mixed with acrylic binder in the weight ratio of 1![[thin space (1/6-em)]](https://www.rsc.org/images/entities/char_2009.gif) :
:![[thin space (1/6-em)]](https://www.rsc.org/images/entities/char_2009.gif) 1. The mixture is ultrasonicated thoroughly for 30 minutes to ensure the even dispersion of the pigment particles in the binder. The resultant emulsion was coated onto a TiO2-coated concrete/Al sheet and was allowed to dry in air. The concrete coatings were then subjected to solar reflectance measurements and chromatic studies using the ASTM standard number G173-03 model and CIE 1976 L*a*b* colour scheme, respectively.
1. The mixture is ultrasonicated thoroughly for 30 minutes to ensure the even dispersion of the pigment particles in the binder. The resultant emulsion was coated onto a TiO2-coated concrete/Al sheet and was allowed to dry in air. The concrete coatings were then subjected to solar reflectance measurements and chromatic studies using the ASTM standard number G173-03 model and CIE 1976 L*a*b* colour scheme, respectively.
The thermal shielding effect of the developed pigment compositions was evaluated using an experimental setup. The setup consists of two foam boxes (8 × 8 × 8 cm3) with Al sheet roofing of dimensions 10 × 10 cm2 coated with the developed pigments as per the procedure mentioned above. A thermocouple was inserted into the foam box just 2 cm below the roof. The foam boxes with pigment-coated roofs were then placed under an IR lamp (Philips, 250 watts), 40 cm below, for 1 hour. The temperatures were recorded at 10 minute intervals.
Characterisation
The X-ray diffraction studies of the developed pigments were carried out using a PANalytical X’Pert3 Powder with Cu-Kα radiation of 1.5405 Å wavelength. The X-ray diffraction data were observed over the 2θ range of 10–90° with a step size of 0.0167 and a time per step of 15.24 s. The lattice parameters of the samples were calculated by the Rietveld refinement method on the PXRD patterns using the GSAS-EXPGUI program.22 XPS analysis of selected compositions was performed using an XPS spectrometer (Omicron Nanotechnology Ltd.) and all binding energies were referenced to the C 1s peak (284.8 eV) arising from adventitious carbon. Surface morphologies were analysed using a Zeiss Sigma field emission scanning electron microscope. Optical studies were carried out using a Jasco V-770 UV-Visible-NIR spectrometer with an integrating sphere attachment. The NIR measurements were carried out with polytetrafluoroethylene (PTFE) as the reference. The band-gaps of the developed pigment compositions were obtained from the diffuse reflectance spectra using the Kubelka–Munk equation, i.e.,
where R is the observed reflectance of the samples.
The thermal stability of the developed pigments was studied using a PerkinElmer STA 8000 TG-DTA analyser in the temperature range of 30–1000 °C.
The chromatic characteristics were calculated using the CIE 1976 L*a*b* colour scheme of Commission Internationale De l’eclairage (CIE).21 Here L* represents the lightness scale which ranges from 0 (black) to 100 (white). The transition from green (−ve) to red (+ve) is represented by the a* coordinate and b* gives the blue (−ve) to yellow (+ve) transition. Another factor, c*, known as chroma represents the saturation of colour and is calculated using the equation:
The hue angle
h° is expressed in degrees and it ranges from 0° to 360° and is calculated using the formula:
Solar reflectance measurements were carried out according to the ASTM standard number G173-03.
23 The solar reflectances of the developed pigments were calculated over the wavelength range of 700–2500 nm using the equation:
where
r(
λ) is the spectral reflectance of the sample obtained experimentally and
i(
λ) is the standard solar spectral irradiance (W m
−2 mm
−1) according to the ASTM standard model G173-03.
Results and discussion
X-ray diffraction studies
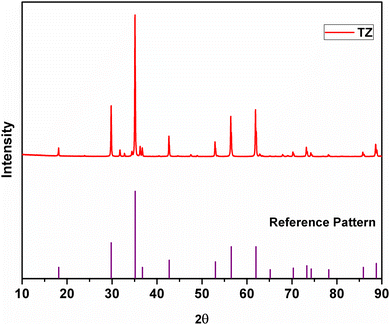
The XRD pattern of TZ, i.e. the undoped version of TiZn2O4, along with the reference pattern is shown in Fig. 1. The PXRD pattern of TZ can be indexed to the cubic crystal structure belonging to the Fd![[3 with combining macron]](https://www.rsc.org/images/entities/char_0033_0304.gif) m space group (JCPDS00-025-1164).21 TiZn2O4 has an inverse spinel structure in which half of the Zn2+ ions occupy the tetrahedral voids and the other half occupy octahedral voids along with Ti4+ ions in the lattice.24
m space group (JCPDS00-025-1164).21 TiZn2O4 has an inverse spinel structure in which half of the Zn2+ ions occupy the tetrahedral voids and the other half occupy octahedral voids along with Ti4+ ions in the lattice.24
 |
| | Fig. 1 XRD pattern of TiZn2O4 and the reference pattern. | |
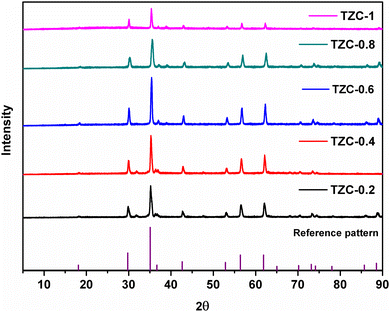
The XRD patterns of the synthesized Cu doped TiZn2O4 compositions having the general formula TiZn2−xCuxO4 (where x ranges from 0 to 1) are shown in Fig. 2. Upon examination, Cu2+ doped variants, i.e. TZC-0.2, TZC-0.4, TZC-0.6, TZC-0.8 and TZC-1, were also found to have a cubic crystal structure with the Fd![[3 with combining macron]](https://www.rsc.org/images/entities/char_0033_0304.gif) m space group. In addition to the cubic TiZn2O4 phase, the XRD patterns of TZC-0.2 and TZC-0.4 exhibited ZnO, that of TZC-0.6 showed TiO2 and those of TZC-0.8 and TZC-1 contained the CuO phase in negligible amounts. Since TiZn2O4 had an inverse spinel structure, upon Cu2+ doping the Zn2+ ions present in the octahedral sites of the inverse spinel lattice were replaced by Cu2+ ions. The crystal field stabilization energy of Cu2+ plays a crucial role here.25,26 Even after doping of Cu2+ ions into the TiZn2O4 lattice, the XRD patterns showed no significant phase changes or additional peaks, except the minute ZnO, TiO2 and CuO peaks. Upon close examination, the XRD patterns of Cu2+ doped variants showed a narrow shift towards higher 2θ values. This can be attributed to the slightly smaller ionic radii of Cu2+ (73 pm) compared to Zn2+ (74 pm) ions.
m space group. In addition to the cubic TiZn2O4 phase, the XRD patterns of TZC-0.2 and TZC-0.4 exhibited ZnO, that of TZC-0.6 showed TiO2 and those of TZC-0.8 and TZC-1 contained the CuO phase in negligible amounts. Since TiZn2O4 had an inverse spinel structure, upon Cu2+ doping the Zn2+ ions present in the octahedral sites of the inverse spinel lattice were replaced by Cu2+ ions. The crystal field stabilization energy of Cu2+ plays a crucial role here.25,26 Even after doping of Cu2+ ions into the TiZn2O4 lattice, the XRD patterns showed no significant phase changes or additional peaks, except the minute ZnO, TiO2 and CuO peaks. Upon close examination, the XRD patterns of Cu2+ doped variants showed a narrow shift towards higher 2θ values. This can be attributed to the slightly smaller ionic radii of Cu2+ (73 pm) compared to Zn2+ (74 pm) ions.
 |
| | Fig. 2 X-ray diffraction patterns of the synthesized Cu2+ doped TiZn2O4 compositions. | |
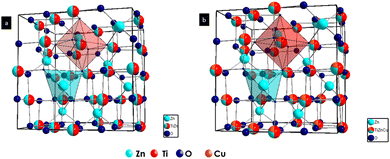
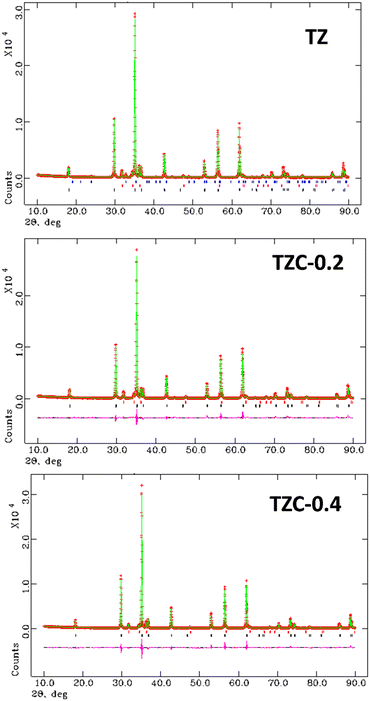
To understand the TZ crystal structure and the changes occurring in the lattice upon doping with Cu2+ ions, we have carried out Rietveld refinement studies of the synthesized samples. Fig. 3 shows the crystal structures drawn from the lattice parameters obtained by the Rietveld refinement of TZ and TZC-0.4. The experimental and refined patterns obtained after the Rietveld refinement of TZ and two of the best promising candidates for NIR reflecting pigment applications, i.e. TZC-0.2 and TZC-0.4, are shown in Fig. 4. The lattice parameters obtained for TZ and Cu2+ doped TiZn2O4 compositions after Rietveld refinement are shown in Table 2. Rietveld refinement was performed on all the samples using the structural parameter of cubic TiZn2O4. Refinement of the XRD patterns with these parameters proceeded smoothly and the refinement details of the rest of the Cu2+ doped TiZn2O4 compositions are given in the ESI† (Fig. S1 and Table S1).21Table 2 shows a reduction in lattice parameters and cell volume with an increase in Cu2+ doping. The decrease in lattice parameters and cell volume can be attributed to the smaller ionic radii of Cu2+ relative to Zn2+. The refinement data obtained show that the doping of Cu2+ into TiZn2O4 proceeded as planned. The fractional coordinates, sites occupied and extent of occupancy of each atom upon completion of Rietveld refinement of pristine and two best promising Cu2+ doped TiZn2O4 compositions, i.e., TZC-0.2 and TZC-0.4, are shown in Table 3. The observed XRD patterns are in good agreement with the calculated Cu2+ doped TiZn2O4 models. The extent of agreement is evident from the χ2, Rp and wRp values obtained upon refinement. The reduction in lattice volume and cell edge lengths due to the incorporation of Cu2+ ions is evident from the refinement data.
 |
| | Fig. 3 Crystal structures of (a) TZ and (b) TZC-0.4 obtained through Rietveld refinement studies. | |
 |
| | Fig. 4 The experimental and refined patterns obtained on Rietveld analysis of TZ, TZC-0.2 and TZC-0.4 samples. | |
Table 2 The reliability factors and lattice parameters obtained for TZ and the TiZn2−xCuxO4 series by Rietveld refinement studies
| Samples |
χ
2
|
wRp (%) |
R
p (%) |
a (Å) |
Volume |
| TZ |
3.75 |
9.55 |
7.40 |
8.4650(0) |
606.6 |
| TZC-0.2 |
3.65 |
9.37 |
7.24 |
8.4596(0) |
605.4 |
| TZC-0.4 |
4.24 |
10.44 |
8.14 |
8.4542(0) |
604.3 |
| TZC-0.6 |
5.32 |
8.51 |
11.44 |
8.4510(0) |
603.6 |
| TZC-0.8 |
3.79 |
9.64 |
7.22 |
8.4493(5) |
603.2 |
| TZC-1 |
4.81 |
10.90 |
8.18 |
8.4367(0) |
600.5 |
Table 3 The fractional coordinates, sites occupied and extent of occupancy obtained upon Rietveld refinement for TZ, TZC-0.2 and TZC-0.4 compositions
| Atom |
Site |
x
|
y
|
z
|
U
iso
|
Occupancy |
| TZ |
| Zn(1) |
8a |
0.125 |
0.125 |
0.125 |
0.01745 |
1 |
| Ti |
16d |
0.5 |
0.5 |
0.5 |
0.00953 |
0.5 |
| Zn(2) |
16d |
0.5 |
0.5 |
0.5 |
0.01975 |
0.5 |
| O |
32e |
0.25885 |
0.25885 |
0.25885 |
0.01897 |
1 |
|
|
| TZC-0.2 |
| Zn(1) |
8a |
0.125 |
0.125 |
0.125 |
0.01831 |
1 |
| Ti |
16d |
0.5 |
0.5 |
0.5 |
0.00848 |
0.5 |
| Zn(2) |
16d |
0.5 |
0.5 |
0.5 |
0.01802 |
0.4 |
| Cu |
16d |
0.5 |
0.5 |
0.5 |
0.00908 |
0.1 |
| O |
32e |
0.25918 |
0.25918 |
0.25918 |
0.01937 |
1 |
|
|
| TZC-0.4 |
| Zn(1) |
8a |
0.125 |
0.125 |
0.125 |
0.01849 |
1 |
| Ti |
16d |
0.5 |
0.5 |
0.5 |
0.00748 |
0.5 |
| Zn(2) |
16d |
0.5 |
0.5 |
0.5 |
0.01528 |
0.3 |
| Cu |
16d |
0.5 |
0.5 |
0.5 |
0.01698 |
0.2 |
| O |
32e |
0.25895 |
0.25895 |
0.25895 |
0.02028 |
1 |
The Fe3+ doped TiZn2O4 compositions having the general formula TiZn2−xFexO4+δ (where x = 0.2, 0.4, 0.6, 0.8, 1 and δ = x/2) showed XRD patterns identical to that of the cubic structure of TiZn2O4. The XRD patterns of the TiZn2−xFexO4+δ series are shown in Fig. 5.
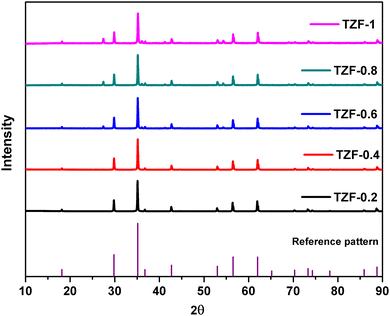 |
| | Fig. 5 X-ray diffraction patterns of the synthesized Fe3+ doped TiZn2O4 compositions. | |
From the XRD data, it is evident that the Fe3+ doped TiZn2O4 structures belong to the Fd![[3 with combining macron]](https://www.rsc.org/images/entities/char_0033_0304.gif) m space group. The proposed crystal structure for the TiZn2−xFexO4+δ composition involves an inverse spinel structure in which Fe3+ ions are expected to occupy the octahedral sites and site allocation is given by the formula Ti(oh)Zn1(Td)Zn1−x(oh)Fex(Oh)O4+δ. The allocation of Fe3+ into the octahedral sites is confirmed with the help of Rietveld refinement and XPS in a later section. The doping of Fe3+ into the octahedral Zn2+ positions was manifested as a shift in the XRD peaks towards higher 2θ values. This is mainly due to the smaller ionic radii of Fe3+ compared to Zn2+. The replacement of octahedral Zn2+ ions by Fe3+ may result in a reduction of lattice distances.
m space group. The proposed crystal structure for the TiZn2−xFexO4+δ composition involves an inverse spinel structure in which Fe3+ ions are expected to occupy the octahedral sites and site allocation is given by the formula Ti(oh)Zn1(Td)Zn1−x(oh)Fex(Oh)O4+δ. The allocation of Fe3+ into the octahedral sites is confirmed with the help of Rietveld refinement and XPS in a later section. The doping of Fe3+ into the octahedral Zn2+ positions was manifested as a shift in the XRD peaks towards higher 2θ values. This is mainly due to the smaller ionic radii of Fe3+ compared to Zn2+. The replacement of octahedral Zn2+ ions by Fe3+ may result in a reduction of lattice distances.
The effect of Fe3+ doping on the TiZn2O4 crystal structure was evaluated with the help of Rietveld refinement. Similar to the Cu2+ doped TiZn2O4 compositions, the cubic structure was taken as the starting model for refinement. The refined crystal structure for TZF-0.4 is shown in Fig. 6. The experimental and refined patterns for TZF-0.2 and TZF-0.4 are shown in Fig. 7. The lattice parameters for TZ and TiZn2−xFexO4+δ are listed in Table 4 along with refinement reliability factors. In addition, refinement parameters along with atom positions and site occupancies of TZF-0.2 and TZF-0.4 are provided in Table 5. The refinement details of the remaining compositions are presented in Fig. S2 and Table S2 (ESI†). The lattice distances obtained by refinement studies show a gradual decrease with an increase in Fe3+ ion doping into the lattice. The smaller ionic radii of Fe3+ compared to Zn2+ ions are responsible for this reduction.
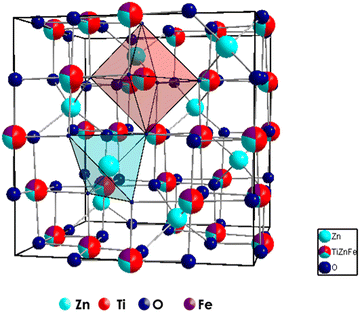 |
| | Fig. 6 Crystal structures of TZF-0.4 obtained through Rietveld refinement studies. | |
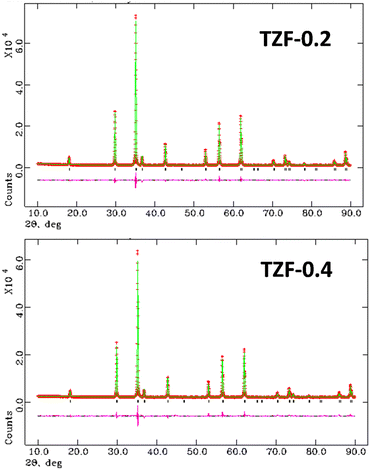 |
| | Fig. 7 The experimental and refined patterns obtained on Rietveld analysis of TZF-0.2 and TZF-0.4 samples. | |
Table 4 The reliability factors and lattice parameters obtained for TZ and the TiZn2−xFexO4 series by Rietveld refinement studies
| Samples |
χ
2
|
wRp (%) |
R
p (%) |
a (Å) |
Volume |
| TZ |
3.75 |
9.55 |
7.40 |
8.4650(0) |
606.6 |
| TZF-0.2 |
3.82 |
4.48 |
3.28 |
8.4615(0) |
605.8 |
| TZF-0.4 |
3.81 |
3.79 |
2.66 |
8.4511(0) |
603.6 |
| TZF-06 |
1.71 |
3.74 |
2.79 |
8.4491(0) |
603.2 |
| TZF-0.8 |
1.89 |
3.59 |
2.59 |
8.4497(0) |
603.3 |
| TZF-1 |
1.29 |
2.80 |
2.15 |
8.4493(0) |
603.2 |
Table 5 The fractional coordinates, sites occupied and extent of occupancy obtained upon Rietveld refinement for TZF-0.2 and TZF-0.4 compositions
| Atom |
Site |
x
|
y
|
z
|
U
iso
|
Occupancy |
| TZF-0.2 |
| Zn(1) |
8a |
0.125 |
0.125 |
0.125 |
0.01240 |
1 |
| Ti |
16d |
0.5 |
0.5 |
0.5 |
0.00471 |
0.5 |
| Zn(2) |
16d |
0.5 |
0.5 |
0.5 |
0.01612 |
0.4 |
| Fe |
16d |
0.5 |
0.5 |
0.5 |
0.00134 |
0.1 |
| O |
32e |
0.25840 |
0.25840 |
0.25840 |
0.01363 |
1 |
|
|
| TZF-0.4 |
| Zn(1) |
8a |
0.125 |
0.125 |
0.125 |
0.01668 |
1 |
| Ti |
16d |
0.5 |
0.5 |
0.5 |
0.01017 |
0.5 |
| Zn(2) |
16d |
0.5 |
0.5 |
0.5 |
0.01630 |
0.3 |
| Fe |
16d |
0.5 |
0.5 |
0.5 |
0.00654 |
0.2 |
| O |
32e |
0.25868 |
0.25868 |
0.25868 |
0.01833 |
1 |
To confirm the successful doping of Fe3+ ions into the octahedral sites, we have carried out XRD refinement studies using three different starting models. The first model has the general formula Ti(oh)Zn1(Td)Zn1−x(oh)Fex(Oh)O4+δ where the Fe3+ ions are completely allotted to the octahedral sites. The second one Ti(oh)Zn1(Oh)Zn1−x(Td)Fex(Td)O4+δ has got all the Fe3+ ions occupying the tetrahedral voids. The third model assumes an equal distribution of Fe3+ ions between octahedral and tetrahedral voids, i.e., Ti(oh)Zn1−x/2(Oh)Fex/2(Oh)Zn1−x/2(Td)Fex/2(Td)O4+δ. After the completion of refinement using all the three models, a comparison of the chi square, Rp and wRp values given in Table 6 revealed that the general composition of Fe3+ doped TiZn2O4 samples is Ti(oh)Zn1(Td)Zn1−x(Oh)Fex(Oh)O4+δ. The refinement details of models 2 and 3 are shown in Fig. S3 and Table S3 (ESI†). Thus, it is evident that both Cu2+ and Fe3+ ions occupy the octahedral sites in the inverse spinel lattice of TiZn2O4. The percentages of main and secondary phases calculated from Rietveld refinement for each of the developed compositions are given in Table S4 (ESI†).
Table 6 The reliability factors and lattice parameters obtained for three different models of site allocation in TiZn2−xFexO4 by Rietveld refinement studies
|
|
χ
2
|
wRp (%) |
R
p (%) |
a (Å) |
Volume |
| Model 1 |
3.82 |
4.48 |
3.28 |
8.4615(0) |
605.8 |
| Model 2 |
6.121 |
5.67 |
4 |
8.4604(2) |
605.6 |
| Model 3 |
6.522 |
5.85 |
4.06 |
8.4575(2) |
604.9 |
XPS analysis
The XPS measurements were carried out mainly to confirm the oxidation state and site of occupancy of Fe in TiZn2−xFexO4+δ compositions. Cu2+ had CFSE considerations towards the octahedral sites, which was further confirmed by Rietveld refinement studies.26 So the TZC series does not require any additional assurance on its Cu2+ site of occupancy. Such a conclusion cannot be made in the case of Fe3+ doped samples without XPS measurements. Here we have performed the XPS analysis of TZF-0.2 as a model system. The XPS spectra of TZF-0.2 in the regions of O, Ti, Zn and Fe are shown in Fig. 8. The O 1s signal of TZF-0.2 shown in Fig. 8a can be deconvoluted into three peaks with binding energies centred at 529.7, 531.6 and 532.8 eV which correspond to lattice oxygen, oxygen-deficient regions and surface hydroxyl groups, respectively.27 In the case of Zn2+, the peaks corresponding to Zn 2p3/2 and Zn 2p1/2 states were observed at binding energies of 1021 and 1044 eV (ESI,† Fig. S4).28 To confirm the distribution of Zn2+ among the octahedral and tetrahedral sites, we have carried out the deconvolution of the Zn 2p3/2 peak. From the literature, it is evident that the 2p3/2 signal that appears at 1019 eV corresponds to Zn2+ ions occupying tetrahedral sites and the signal around 1021 eV corresponds to octahedral sites occupying Zn2+ ions.29 Here we have deconvoluted the Zn 2p3/2 signal into two peaks corresponding to Zn2+ ions occupying octahedral and tetrahedral sites as shown in Fig. 8b. In the case of Ti, Ti4+ shows a single peak centred at 458.3 which belongs to the Ti 2p3/2 state of octahedral coordination as shown in Fig. 8c.27 Also, the Fe 2p3/2 peak of TZF-0.2 is observed at 709.8 eV and the Fe 2p1/2 peak is observed at 723.3 eV.27 The presence of a satellite peak at 718.6 eV confirmed the oxidation state of Fe as 3+.30,31 Apart from this, due to spin–orbit and electrostatic interactions present in high spin early transition metal ions, each of the Fe 2p3/2 and 2p1/2 peaks can be deconvoluted into four peaks as shown in Fig. 8d.32,33 The fitting of Fe 2p XPS spectrum into four multiplets further ensured the presence of Fe3+ ions in octahedral sites.33,34 Thus, the XPS measurement results are found to be in exact agreement with Rietveld refinement data and expected stoichiometries.
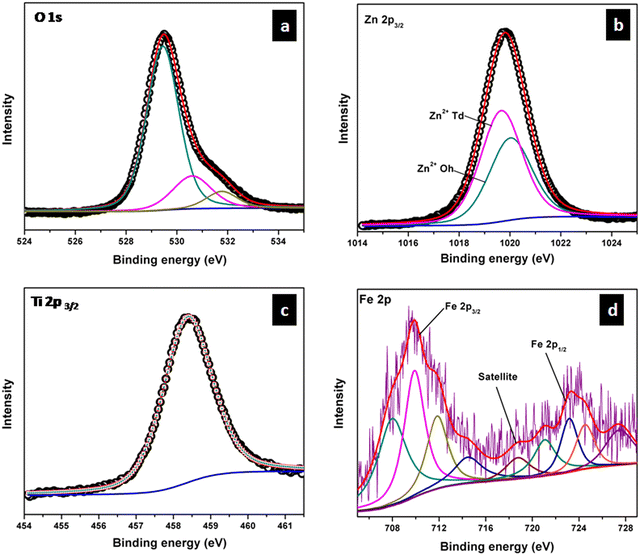 |
| | Fig. 8 High-resolution XPS spectra of (a) O 1s, (b) Zn 2p3/2, (c) Ti 2p3/2 and (d) Fe 2p core levels in TZF-0.2. | |
FE-SEM
The SEM micrographs of TZ, TZC-0.2 and TZC-0.4 are shown in Fig. 9. The SEM images show extended aggregation of particles and the aggregates are found to be in the micrometre regime. With Cu2+ doping, there is a variation in the shape of the aggregates. The particles are getting transformed from the spherical form into needle-like structures with an increase in the Cu2+ dopant amount. Fig. 10 shows that, in the case of TZF-0.2 and TZF-0.4, the extent of aggregation is somewhat similar to that found in TZ. From Fig. 10, TZF-0.2 is found to contain flake-like aggregates which are smaller than those of TZF-0.4. The increment in the size of the aggregates results in a reduction in NIR reflectance.35
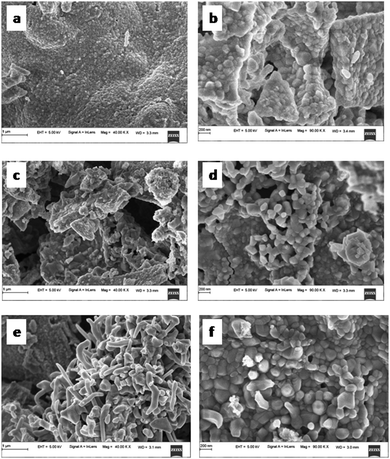 |
| | Fig. 9 FE-SEM images of (a and b) TZ, (c and d) TZC-0.2 and (e and f) TZC-0.4 samples. | |
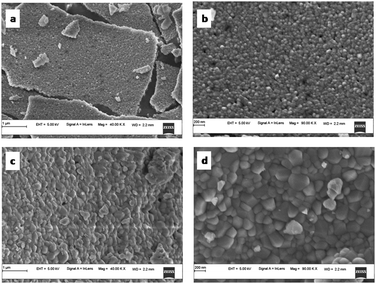 |
| | Fig. 10 FE-SEM images of (a and b) TZF-0.2 and (c and d) TZF-0.4 samples. | |
UV-visible diffuse reflectance studies
The UV-visible diffuse reflectance spectra of Cu2+ doped TiZn2O4 pigment powders are shown in Fig. 11a. Here we can see that the undoped TiZn2O4, i.e. TZ, shows no characteristic absorption in the visible region and, as a result, it appears white. With the incorporation of Cu2+ ions into the TiZn2O4 lattice, a gradual shift of the absorption edges towards higher wavelengths is seen. This bathochromic shift can be explained by the bandgap measurements made using the Kubelka–Munk function. The bandgaps of all the developed Cu2+ doped TiZn2O4 compositions are shown in Table 4. From Fig. 11b, the gradual decrease in bandgaps which is responsible for the bathochromic shift is evident. All the Cu2+ doped variants exhibited absorptions in the visible region. The absorption in the region of 740–800 nm can be attributed to the 2Eg–2T2g transition in a d9 octahedral system.36 One such absorption centred around 800 nm helps in imparting a green tint to TZC-0.2. At the same time, for TZC-0.4, the absorption is around 780 nm which accounts for its yellow colour. Upon increasing the Cu2+ ion concentration, the absorption band gets broader and extends all over the visible region. Thus, the compositions become darker on increasing the Cu2+ concentration.
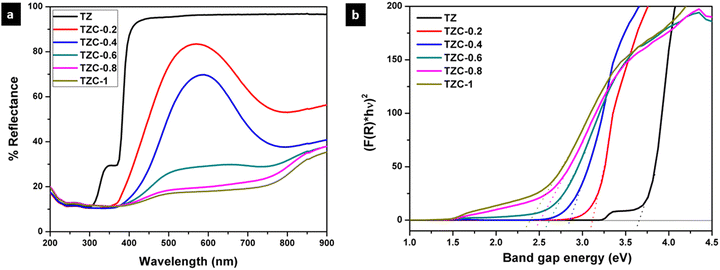 |
| | Fig. 11 (a) UV-visible diffuse reflectance spectra and (b) Kubelka–Munk plots of Cu2+ doped TiZn2O4 pigments. | |
In the case of Fe3+ doped TiZn2O4 pigment powders, the observed changes in the diffuse reflectance spectra are shown in Fig. 12a. TZ which displays no significant absorption in the visible region gradually shows absorptions within the range of 350 to 900 nm with the introduction of Fe3+ into the TiZn2O4 structure. The changes in the optical properties of TZF-0.2, TZF-0.4, TZF-0.6, TZF-0.8 and TZF-1 are due to the incorporation of Fe3+ into the octahedral sites of the TiZn2O4 lattice as confirmed by the XRD refinement studies. Among the absorptions shown by Fe3+ doped TiZn2O4, the one around 380 nm can be attributed to the 6A1(6S) → 4E(4D) transition.36 Again the absorptions around 430 and 470 nm are due to the 6A1(6S) → 4E(4G) and 6A1(6S) → 4A1(4G) transitions. The Fe3+ doped samples show a significant reduction in reflectance around 650 and 800 nm, which results from 6A1(6S) → 4T2(4G) and 6A1(6S) → 4T1(4G) bands.36,37 With an increase in Fe3+ dopant concentration, the 6A1(6S) → 4T2(4G) and 6A1(6S) → 4T1(4G) bands become more superior and the absorption becomes broader and extends over the range of 500–900 nm. The extension of the absorption edges towards higher wavelengths due to the gradual decrease in bandgap with an increase in dopant Fe3+ ion concentration is shown in Fig. 12b. The calculated bandgap values are given in Table 5. Here we can see that TZF-0.2 shows light yellowish-orange colour which gradually transforms into orange and brownish-orange as we move along the series. The yellowish-orange colour in TZF-0.2 arises due to the absorption of visible light in the violet-indigo region and TZF-0.2 appears in the complementary yellowish-orange colour. In the case of TZF-0.4, the absorption extends towards the violet-blue region and a corresponding increase in orange hue is observed. As we move from TZF-0.4 to TZF-1, i.e. with an increasing concentration of Fe3+ ions in TiZn2O4, the absorptions are found to be in the blue-green region. The extension of visible light absorption towards the green region manifests as an increase in the orange colour intensity.
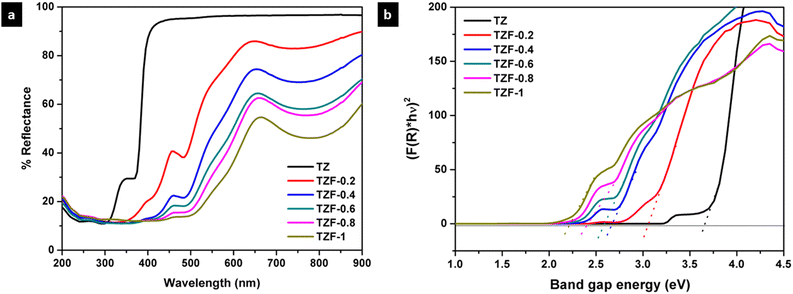 |
| | Fig. 12 (a) UV-visible diffuse reflectance spectra and (b) Kubelka–Munk plots of Fe3+ doped TiZn2O4 pigments. | |
Near-infrared reflectance analysis
The NIR reflectance in the range of 700–2500 nm, for the Cu2+ doped TiZn2O4 samples, is shown in Fig. 13 along with the solar reflectance spectra of TZ, TZC-0.2 and TZC-0.4. Pure TiZn2O4 (TZ) shows a solar reflectance of 96.76% in the NIR region. Compared to TZ, the NIR reflection is less for Cu2+ doped TiZn2O4 compositions. Percentage NIR reflectance decreases with an increase in the amount of Cu2+ ions. Even though there is a reduction in reflectance along with the Cu2+ doped series, TZC-0.2 and TZC-0.4 exhibited attractive colours along with considerable solar reflectance values. The NIR reflectance R* values for the developed Cu2+ incorporated TiZn2O4 pigment samples along with BiPO4, an already reported yellow pigment, are given in Table 7.38
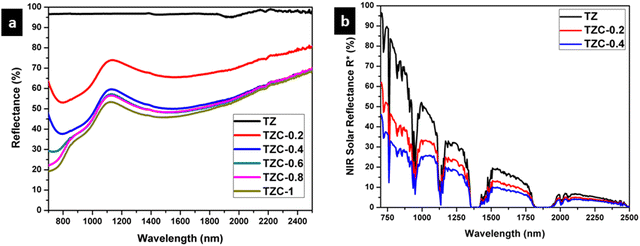 |
| | Fig. 13 (a) NIR reflectance spectra of Cu2+ doped TiZn2O4 pigment powders and (b) solar reflectance spectra of TZ, TZC-0.2 and TZC-0.4 samples. | |
Table 7 Bandgap, percentage NIR reflectance and CIE L*a*b* parameters of pure and Cu2+ doped TiZn2O4 compositions
|
|
Bandgap (eV) |
NIR reflectance (R*) (%) |
L*
|
a*
|
b*
|
c
|
h° |
|
Literature reported.
|
| TZ |
3.54 |
96.76 |
98.41 |
−0.05 |
0.99 |
0.99 |
92.89 |
| TZC-0.2 |
3.12 |
62.83 |
91.12 |
−7.50 |
24.18 |
25.32 |
107.23 |
| TZC-0.4 |
2.93 |
47.61 |
82.92 |
−5.48 |
36.41 |
36.82 |
98.56 |
| TZC-0.6 |
2.65 |
43.19 |
59.61 |
−2.44 |
14.13 |
14.34 |
99.79 |
| TZC-0.8 |
2.51 |
41.90 |
50.88 |
−0.66 |
7.04 |
7.07 |
95.36 |
| TZC-1 |
2.39 |
39.13 |
48.84 |
−1.08 |
6.28 |
6.37 |
99.76 |
| BiPO4a |
3.657 |
86.40 |
96.85 |
−0.27 |
0.64 |
0.69 |
112.87 |
The NIR reflectance of Fe3+ doped TiZn2O4 samples was also determined. The NIR reflectance spectra of the Fe3+ incorporated pigment series are shown in Fig. 14. The percentage of NIR reflectance R* values for Fe3+ doped TiZn2O4 pigments and commercial BiVO4 are given in Table 8. Both TZF-0.2 and TZF-0.4 exhibited percentage NIR reflectance values higher than BiVO4.39 Compared to the percentage reflectance of TZ, there is a reduction of reflectance around the 700–1600 nm region, with the substitution of Zn2+ ions in octahedral sites with Fe3+ ions. The introduction of chromophore Fe3+ ions into the TiZn2O4 lattice enhances the visual appearance by imparting different shades of orange colour to the samples. The observed colours ranged from yellowish-orange to reddish-brown. Despite having a reduction in solar reflectance across the Fe3+ doped series, TZF-0.2 and TZF-0.4 show promising solar reflectance values of 87.81 and 77.83%, respectively.
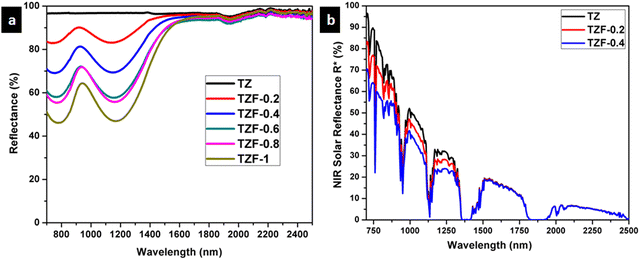 |
| | Fig. 14 (a) NIR reflectance spectra of Fe3+ doped TiZn2O4 pigment powders and (b) solar reflectance spectra of TZ, TZF-0.2 and TZF-0.4 samples. | |
Table 8 Bandgap, percentage NIR reflectance and CIE L*a*b* parameters of pure and Fe3+ doped TiZn2O4 compositions
|
|
Bandgap (eV) |
NIR reflectance (R*) (%) |
L*
|
a*
|
b*
|
c
|
h° |
|
Literature reported.
|
| TZ |
3.54 |
96.76 |
98.41 |
−0.05 |
0.99 |
0.99 |
92.89 |
| TZF-0.2 |
3.07 |
87.81 |
84.81 |
6.92 |
31.72 |
32.47 |
77.693 |
| TZF-0.4 |
2.69 |
77.83 |
73.70 |
14.49 |
37.78 |
40.46 |
69.016 |
| TZF-0.6 |
2.57 |
68.73 |
66.97 |
16.39 |
32.84 |
36.70 |
63.47 |
| TZF-0.8 |
2.29 |
67.44 |
63.27 |
19.55 |
31.54 |
37.11 |
58.207 |
| TZF-1 |
2.19 |
60.43 |
57.68 |
19.70 |
25.29 |
32.06 |
52.081 |
| BiVO4a |
2.40 |
73.51 |
82.43 |
4.25 |
76.26 |
76.38 |
86.81 |
Chromatic studies
As a part of analysing the chromatic characteristics of the developed pigments, the CIELAB colour coordinates were measured. Fig. 15 shows the photograph of the developed TiZn2O4 based pigment powders. The CIE L*a*b* parameters of TZ and Cu2+ doped compositions along with BiPO4 are listed in Table 7. With the incorporation of Cu2+ chromophores, there is a decrease in the lightness coordinate, L*. At the same time, there is an initial reduction in the a* value due to the green tint attributed to the Cu2+ doping in TZC-0.2, which becomes less negative with a further increase in the Cu2+ dopant amount. The increase in yellowish hue from TZ to TZC-0.4 is evident from the rise in b* values. The b* values start decreasing from TZC-0.6 onwards. The lightness coordinate L* also shows a reduction in values, with an increase in Cu2+ chromophore concentration. Even though inferior to BiPO4 in NIR reflectance, TZC-0.2 and TZC-0.4 exhibited superior yellow hues compared to BiPO4.38
 |
| | Fig. 15 Photographs of the developed TiZn2O4 based pigment powders. | |
The CIELAB coordinates for Fe3+ doped compositions are given in Table 8 along with commercial BiVO4. Here also a reduction in the lightness coordinate with an increase in Fe3+ content was observed. Again, as the dopant Fe3+ concentration increases, the orange tint was found to be increasing which manifests as an increment in a* and b* coordinates. The TZF series exhibited an enhanced red hue represented by the rise in the a* coordinate with an increase in Fe3+ doping. The b* values clearly show that the yellow hue increases from TZ to TZF-0.4 and then starts diminishing. Fe3+-doped variants managed to retain attractive orange to brownish-orange shades even with increased dopant concentrations. TZF-0.2 and TZF-0.4 managed to exhibit considerable yellow hues even without the use of hazardous elements. Even though commercial BiVO4 exhibited superior yellow colour, TZF-0.2 and TZF-0.4 compositions have higher NIR reflectance and more economic viability.39
Coating studies
The NIR reflectance values were calculated for the selected pigment coatings over concrete and Al sheet substrates. Fig. 16 shows the NIR reflectance spectra of TZ, TZC-0.2 and TZC-0.4 coatings over concrete in comparison with bare concrete and TiO2 coating. Fig. 17 shows the NIR reflectance spectra of TZ, TZF-0.2 and TZF-0.4 pigment coatings on concrete along with bare concrete and TiO2 coatings. The NIR reflectance R* values calculated according to the ASTM model for the selected pigment coatings are listed in Table 9 along with their CIE L*a*b* coordinates. Fig. 18 shows the NIR reflectance spectra of TZ, TZC-0.2 and TZC-0.4 coatings over the Al sheet in comparison with the bare Al sheet and TiO2 coating. Fig. 19 shows the NIR reflectance spectra of TZ, TZF-0.2 and TZF-0.4 pigment coatings on the Al sheet. The NIR reflectance R* values calculated according to the ASTM model for the selected pigment coatings over the Al sheet are listed in Table 10 along with their CIE L*a*b* coordinates.
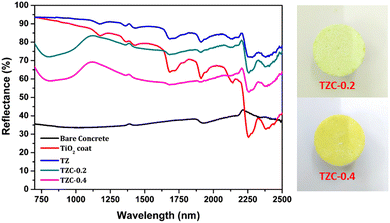 |
| | Fig. 16 NIR reflectance spectra of coated TZ, TZC-0.2 and TZC-0.4 in comparison with TiO2 and bare concrete coatings. | |
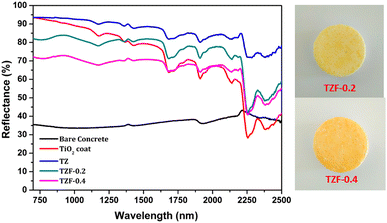 |
| | Fig. 17 NIR reflectance spectra of coated TZ, TZF-0.2 and TZF-0.4 in comparison with TiO2 and bare concrete coatings. | |
Table 9 Percentage NIR reflectance, R* values and CIE L*a*b* coordinates for the selected pigment coatings over concrete
| Sample |
R* (%) |
L*
|
a*
|
b*
|
| Concrete |
34.94 |
61.911 |
0.055 |
3.952 |
| TiO2 coat |
85.17 |
97.686 |
−0.221 |
0.473 |
| TZ |
89.31 |
96.532 |
0.006 |
4.085 |
| TZC-0.2 |
76.28 |
95.283 |
−4.067 |
11.812 |
| TZC-0.4 |
61.91 |
88.809 |
−3.294 |
14.894 |
| TZF-0.2 |
79.38 |
85.127 |
4.797 |
18.588 |
| TZF-0.4 |
69.26 |
85.768 |
4.98 |
26.445 |
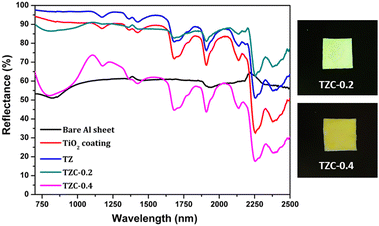 |
| | Fig. 18 NIR reflectance spectra of coated TZ, TZC-0.2 and TZC-0.4 in comparison with the TiO2 coating and bare Al sheet. | |
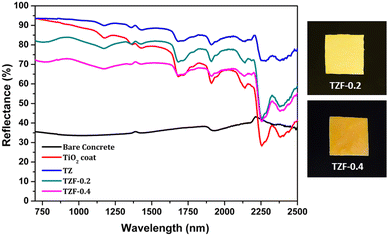 |
| | Fig. 19 NIR reflectance spectra of coated TZ, TZF-0.2 and TZF-0.4 in comparison with the TiO2 coating and bare Al sheet. | |
Table 10 Percentage NIR reflectance, R* values and CIE L*a*b* coordinates for the selected pigment coatings over an Al sheet
| Sample |
R* (%) |
L* |
a* |
b* |
| Bare Al sheet |
56.65 |
78.329 |
−0.12 |
0.995 |
| TiO2 coating |
88.56 |
98.426 |
−0.443 |
0.59 |
| TZ |
94.20 |
99.285 |
−0.19 |
0.461 |
| TZC-0.2 |
87.53 |
96.956 |
−1.279 |
4.76 |
| TZC-0.4 |
58.65 |
91.099 |
−4.127 |
25.043 |
| TZF-0.2 |
90.59 |
95.427 |
1.07 |
7.784 |
| TZF-0.4 |
74.57 |
77.834 |
13.869 |
42.26 |
Thermal shielding studies
The thermal shielding performance of two best pigment compositions, i.e., TZC-0.2 and TZF-0.2, was evaluated. As described in the experimental section, foam boxes roofed with coated and uncoated Al sheets were placed under an IR lamp (40 cm above the roof) and separate temperature sensors were inserted into the foam boxes to monitor the interior temperature. To evaluate the thermal shielding performance, time-dependent temperature measurements were made for 1 hour. We have carried out the thermal shielding analysis for TZC-0.2 and TZF-0.2 separately and compared the results with those of uncoated Al sheet roofing. The time-dependent temperature measurements made for TZC-0.2 and TZF-0.2 coated roofs along with bare Al sheets are shown in Fig. 20. The time–temperature plots indicate a steady increase in temperature with time initially and then gradually get stabilized over 1 hour. Fig. 21a and b show the difference in interior temperatures observed after 1 hour of IR irradiation for the TZC-0.2 and TZF-0.2 coated and uncoated Al roofing. The TZC-0.2 coating provided an interior 3.6 °C cooler than the uncoated roofing interior. In the case of TZF-0.2, the observed temperature difference was 4.8 °C. Thus, the overall results suggest that TZC-0.2 and TZF-0.2 are promising cool pigment candidates with good NIR reflectance characteristics.
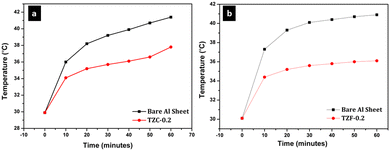 |
| | Fig. 20 Time dependent temperature measurements obtained for (a) TZC-0.2 and (b) TZF-0.2 coated Al sheet roofing along with the bare Al sheet. | |
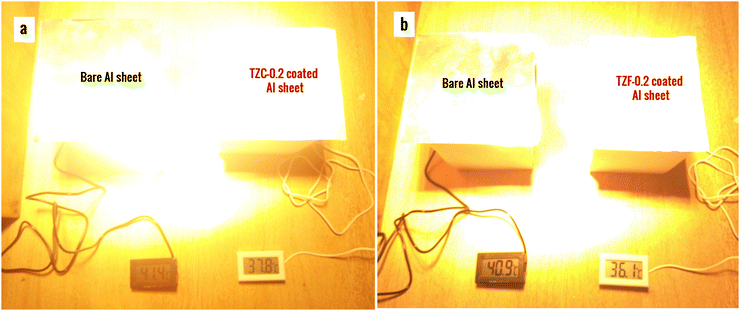 |
| | Fig. 21 Difference in interior temperatures observed after thermal shielding studies using (a) TZC-0.2 and (b) TZF-0.2 coated Al sheet roofing in comparison with bare Al sheet roofing. | |
Thermal stability studies
The thermal stability of the developed pigments was studied using thermogravimetric analysis. The thermogravimetric analysis of TZ, TZC-0.2, TZC-0.4, TZF-0.2 and TZF-0.4 was carried out in the presence of air in the temperature range of 30–1000 °C. The TGA and DTA results in Fig. 22 show that the developed pigment compositions exhibit high thermal stability, even above 900 °C. There is no significant weight loss observed or no phase changes in the temperature range of 30–1000 °C. High thermal stability is an essential requirement for NIR reflecting pigments. So these compositions can be considered promising pigment candidates.
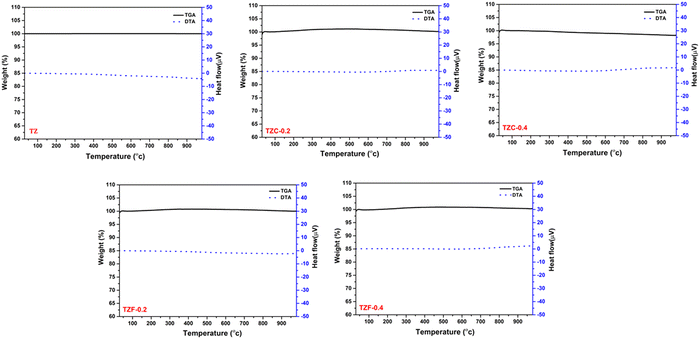 |
| | Fig. 22 TGA and DTA curves of TZ, TZC-0.2, TZC-0.4, TZF-0.2 and TZF-0.4 pigment powders. | |
Chemical stability studies
The chemical stability of the developed pigments towards acid and alkaline environments was evaluated by treating them with 5% HNO3 and 5% NaOH solutions. The resistance of the selected pigment compositions towards chemically aggressive environments was studied by weighing out 0.5 g of the pigment and then treating it with acid/alkaline solutions, accompanied by constant stirring. After 30 minutes, the pigment samples were collected by centrifugation, washed and dried. The dried powders were then subjected to chromatic studies to measure their CIE L*a*b* coordinates. The NIR reflectance of the pigments was also measured after acid/alkali treatment. The obtained CIE L*a*b* coordinates are listed in Table 11 along with the colour difference ΔE* calculated. The XRD analysis of three selected pigment compositions was also carried out after chemical treatment. The XRD patterns obtained can be clearly indexed to the cubic TiZn2O4 phase and are exactly in agreement with the XRD patterns of untreated samples (Fig. S5, ESI†). Even after acid/alkali treatment, the pigments have retained their colour characteristics and NIR reflectance without significant changes. Thus, the developed TiZn2O4 based compositions are found to be resistant to harsh chemical environments, which makes them suitable for commercial application.
Table 11 CIE L*a*b* coordinates, colour difference ΔE* and percentage NIR reflectance obtained after acid/alkali treatment of the developed pigment samples
| Sample |
Untreated |
HNO3 |
NaOH |
|
R* (%) |
L*
|
a*
|
b*
|
R* (%) |
L*
|
a*
|
b*
|
(ΔE*) |
R* (%) |
L*
|
a*
|
b*
|
(ΔE*) |
| TZ |
96.76 |
98.41 |
−0.05 |
0.99 |
96.8 |
98.51 |
−0.22 |
1.26 |
0.33 |
95.63 |
97.03 |
0.33 |
2.72 |
2.24 |
| TZC-0.2 |
62.83 |
91.12 |
−7.50 |
24.18 |
62.02 |
90.87 |
−7.48 |
24.27 |
0.27 |
61.25 |
90.59 |
−7.32 |
26.25 |
2.14 |
| TZC-0.4 |
47.61 |
82.92 |
−5.48 |
36.41 |
47.34 |
83.02 |
−5.41 |
36.63 |
0.25 |
46.32 |
82.94 |
−4.65 |
36.92 |
0.98 |
| TZF-0.2 |
87.81 |
84.81 |
6.92 |
31.72 |
86.82 |
84.90 |
6.56 |
30.88 |
0.93 |
83.73 |
83.20 |
7.43 |
31.99 |
1.71 |
| TZF-0.4 |
77.83 |
73.70 |
14.49 |
37.78 |
77.25 |
72.93 |
15.09 |
38.15 |
1.05 |
76.45 |
72.76 |
14.92 |
37.36 |
1.12 |
Conclusion
Here TiZn2O4 based NIR reflecting inorganic pigments which are economically affordable and eco-friendly were developed through a citric acid fuel-assisted solution combustion strategy. The optical properties of the inverse spinel structured TiZn2O4 lattice were modified with the incorporation of Cu2+ and Fe3+ ions as chromophores capable of imparting attractive hues and reducing band gaps. The replacement of octahedral Zn2+ ions by Cu2+ and Fe3+ ions in varying amounts resulted in a series of pigment colours ranging from greenish-yellow to reddish-brown. The resulted crystal structures were characterised well and site allocations and lattice changes were understood in detail with the help of Rietveld refinement of XRD patterns. Four among the ten developed compositions were selected for application as possible NIR reflecting pigments. They exhibited percentage NIR reflectance ranging from 47.61 to 87.81% and showed very high thermal and chemical stability. Pure TiZn2O4 showed a very high NIR reflectance of 96.76% which is comparable with those of commercial TiO2 pigments. The thermal shielding studies conducted using two of the selected pigment candidates showed a reduction in interior temperature by 3.6 °C for Cu2+ doped TiZn2O4 and 4.8 °C for Fe3+ doped TiZn2O4 coated roofing relative to uncoated roofed interiors. Thus Cu2+ and Fe3+ doped TiZn2O4 pigments can ensure better thermal conditioning of buildings with zero cost to the environment. Apart from tackling the urban heat island effect, these pigments have the capability for energy conservation over the long term. Further modifications of the TiZn2O4 lattice with suitable dopants and synthetic strategies may result in pigments with enhanced optical and solar reflectance properties.
Conflicts of interest
There are no conflicts to declare.
Acknowledgements
DJ thanks the University Grants Commission, Government of India for the Senior Research Fellowship. CPJ acknowledges DSKPDF for financial support.
References
-
G. Pfaff, Inorganic pigments, de Gruyter, 2017 Search PubMed.
-
J. G. Speight, in Environmental Inorganic Chemistry for Engineers, ed. J. G. Speight, Butterworth-Heinemann, 2017, pp. 111–169 DOI:10.1016/B978-0-12-849891-0.00003-5.
- G. Gramm, G. Fuhrmann, M. Wieser, H. Schottenberger and H. Huppertz, Dyes Pigm., 2019, 160, 9–15 CrossRef CAS.
- S. Divya and S. Das, Ceram. Int., 2021, 47, 30381–30390 CrossRef CAS.
- M. Kato, M. Takahashi, H. Unuma and S. Suzuki, J. Ceram. Soc. Jpn., 1999, 107, 181–183 CrossRef CAS.
- J.-L. Wang, Y.-Q. Li, Y.-J. Byon, S.-G. Mei and G.-L. Zhang, Powder Technol., 2013, 235, 303–306 CrossRef CAS.
- A. Eroles and A. Friedberg, J. Am. Ceram. Soc., 1965, 48, 223–227 CrossRef.
- M. Heck, T. Rehren and P. Hoffmann, Archaeometry, 2003, 45, 33–44 CrossRef CAS.
- P. Wanrooij, U. Agarwal, J. Meuldijk, J. V. Kasteren and P. Lemstra, J. Appl. Polym. Sci., 2006, 100, 1024–1031 CrossRef CAS.
- K. White, T. Detherage, M. Verellen, J. Tully and M. P. S. Krekeler, Environ. Earth Sci., 2014, 71, 3517–3528 CrossRef CAS.
- H. Liu, K. Liu, H. Fu, R. Ji and X. Qu, Environ. Pollut., 2020, 263, 114484 CrossRef CAS PubMed.
- M. Jansen and H. P. Letschert, Nature, 2000, 404, 980–982 CrossRef CAS PubMed.
- A. Coccato, L. Moens and P. Vandenabeele, Heritage Sci., 2017, 5, 1–25 CrossRef.
- S. Jose, D. Joshy, S. B. Narendranath and P. Periyat, Sol. Energy Mater. Sol. Cells, 2019, 194, 7–27 CrossRef CAS.
- P. K. Thejus, K. V. Krishnapriya and K. G. Nishanth, Sol. Energy Mater. Sol. Cells, 2021, 219, 110778 CrossRef CAS.
- B. Sarkodie, C. Acheampong, B. Asinyo, X. Zhang and B. Tawiah, Color Res. Appl., 2019, 44, 396–410 CrossRef.
-
N. Noaa, 2019, http://www.ncdc.noaa.gov/sotc/global/201813.
-
H. Akbari, P. Berdahl, R. Levinson, S. Wiel, B. Miller and A. Desjarlais, California Energy Commission PIER Program; Heat Island Group, Lawrence Berkeley National Laboratory: Berkeley, CA, USA, 2006 Search PubMed.
- A. Synnefa, M. Santamouris and K. Apostolakis, Sol. Energy, 2007, 81, 488–497 CrossRef CAS.
- R. Sharma, S. Tiwari and S. K. Tiwari, ACS Sustainable Chem. Eng., 2018, 6, 2004–2010 CrossRef CAS.
- R. L. Millard, R. C. Peterson and B. K. Hunter, Am. Mineral., 1995, 80, 885–896 CAS.
- B. H. Toby, J. Appl. Crystallogr., 2001, 34, 210–213 CrossRef CAS.
- A. Marzo, P. Ferrada, F. Beiza, J. Alonso-Montesinos, J. Ballestrín and R. Román, EuroSun, 2016 Search PubMed , ISES Conference Proceedings, 2016.
- S. Souza, I. Santos, M. Silva, M. Cássia-Santos, L. Soledade, A. Souza, S. Lima and E. Longo, J. Therm. Anal. Calorim., 2005, 79, 451–454 CrossRef CAS.
- X. Lu, W. Bian, Y. Li, H. Zhu, Z. Fu and Q. Zhang, J. Am. Ceram. Soc., 2018, 101, 1646–1654 CrossRef CAS.
- J. K. Burdett, G. D. Price and S. L. Price, J. Am. Chem. Soc., 1982, 104, 92–95 CrossRef CAS.
- M. Arillo, M. López, C. Pico, M. Veiga, A. Jimenez-Lopez and E. Rodrıguez-Castellon, J. Alloys Compd., 2001, 317, 160–163 CrossRef.
- C. Vinuthna, D. Ravinder, R. Madhusudan and D. Ravinder, Int. J. Eng. Res. Appl., 2013, 3, 654–660 Search PubMed.
- U. Steinike, P. Druska, B. Wallis, D.-C. Uecker and V. Sepelak, Chem. Pap., 1998, 52, 147–151 CAS.
- S. Dhankhar, K. Gupta, G. Bhalerao, N. Shukla, M. Chandran, B. Francis, B. Tiwari, K. Baskar and S. Singh, RSC Adv., 2015, 5, 92549–92553 RSC.
- J. Liu, M. Zeng and R. Yu, Sci. Rep., 2016, 6, 1–10 CrossRef PubMed.
- T. Aghavnian, J.-B. Moussy, D. Stanescu, R. Belkhou, N. Jedrecy, H. Magnan, P. Ohresser, M.-A. Arrio, P. Sainctavit and A. Barbier, J. Electron. Spectrosc. Relat. Phenom., 2015, 202, 16–21 CrossRef CAS.
- R. Gupta and S. Sen, Phys. Rev. B: Solid State, 1974, 10, 71 CrossRef CAS.
- N. McIntyre and D. Zetaruk, Anal. Chem., 1977, 49, 1521–1529 CrossRef CAS.
- J. Peoples, X. Li, Y. Lv, J. Qiu, Z. Huang and X. Ruan, Int. J. Heat Mass Transfer, 2019, 131, 487–494 CrossRef CAS.
- S. L. Reddy, T. Endo and G. S. Reddy, Adv. Aspects Spectrosc., 2012, 4–48 Search PubMed.
- L. I. Granone, K. Nikitin, A. Emeline, R. Dillert and D. W. Bahnemann, Catalysts, 2019, 9, 434 CrossRef CAS.
- C. Ding, A. Han, M. Ye, Y. Zhang, L. Yao and J. Yang, RSC Adv., 2018, 8, 19690–19700 RSC.
- P. Thejus and K. Nishanth, Sol. Energy Mater. Sol. Cells, 2019, 200, 109999 CrossRef CAS.
|
| This journal is © The Royal Society of Chemistry 2022 |
Click here to see how this site uses Cookies. View our privacy policy here.  Open Access Article
 a and
Pradeepan
Periyat
 *c
*c
![[thin space (1/6-em)]](https://www.rsc.org/images/entities/char_2009.gif) :
:![[thin space (1/6-em)]](https://www.rsc.org/images/entities/char_2009.gif) 1. The mixture is ultrasonicated thoroughly for 30 minutes to ensure the even dispersion of the pigment particles in the binder. The resultant emulsion was coated onto a TiO2-coated concrete/Al sheet and was allowed to dry in air. The concrete coatings were then subjected to solar reflectance measurements and chromatic studies using the ASTM standard number G173-03 model and CIE 1976 L*a*b* colour scheme, respectively.
1. The mixture is ultrasonicated thoroughly for 30 minutes to ensure the even dispersion of the pigment particles in the binder. The resultant emulsion was coated onto a TiO2-coated concrete/Al sheet and was allowed to dry in air. The concrete coatings were then subjected to solar reflectance measurements and chromatic studies using the ASTM standard number G173-03 model and CIE 1976 L*a*b* colour scheme, respectively.
![[3 with combining macron]](https://www.rsc.org/images/entities/char_0033_0304.gif) m space group (JCPDS00-025-1164).21 TiZn2O4 has an inverse spinel structure in which half of the Zn2+ ions occupy the tetrahedral voids and the other half occupy octahedral voids along with Ti4+ ions in the lattice.24
m space group (JCPDS00-025-1164).21 TiZn2O4 has an inverse spinel structure in which half of the Zn2+ ions occupy the tetrahedral voids and the other half occupy octahedral voids along with Ti4+ ions in the lattice.24
![[3 with combining macron]](https://www.rsc.org/images/entities/char_0033_0304.gif) m space group. In addition to the cubic TiZn2O4 phase, the XRD patterns of TZC-0.2 and TZC-0.4 exhibited ZnO, that of TZC-0.6 showed TiO2 and those of TZC-0.8 and TZC-1 contained the CuO phase in negligible amounts. Since TiZn2O4 had an inverse spinel structure, upon Cu2+ doping the Zn2+ ions present in the octahedral sites of the inverse spinel lattice were replaced by Cu2+ ions. The crystal field stabilization energy of Cu2+ plays a crucial role here.25,26 Even after doping of Cu2+ ions into the TiZn2O4 lattice, the XRD patterns showed no significant phase changes or additional peaks, except the minute ZnO, TiO2 and CuO peaks. Upon close examination, the XRD patterns of Cu2+ doped variants showed a narrow shift towards higher 2θ values. This can be attributed to the slightly smaller ionic radii of Cu2+ (73 pm) compared to Zn2+ (74 pm) ions.
m space group. In addition to the cubic TiZn2O4 phase, the XRD patterns of TZC-0.2 and TZC-0.4 exhibited ZnO, that of TZC-0.6 showed TiO2 and those of TZC-0.8 and TZC-1 contained the CuO phase in negligible amounts. Since TiZn2O4 had an inverse spinel structure, upon Cu2+ doping the Zn2+ ions present in the octahedral sites of the inverse spinel lattice were replaced by Cu2+ ions. The crystal field stabilization energy of Cu2+ plays a crucial role here.25,26 Even after doping of Cu2+ ions into the TiZn2O4 lattice, the XRD patterns showed no significant phase changes or additional peaks, except the minute ZnO, TiO2 and CuO peaks. Upon close examination, the XRD patterns of Cu2+ doped variants showed a narrow shift towards higher 2θ values. This can be attributed to the slightly smaller ionic radii of Cu2+ (73 pm) compared to Zn2+ (74 pm) ions.
![[3 with combining macron]](https://www.rsc.org/images/entities/char_0033_0304.gif) m space group. The proposed crystal structure for the TiZn2−xFexO4+δ composition involves an inverse spinel structure in which Fe3+ ions are expected to occupy the octahedral sites and site allocation is given by the formula Ti(oh)Zn1(Td)Zn1−x(oh)Fex(Oh)O4+δ. The allocation of Fe3+ into the octahedral sites is confirmed with the help of Rietveld refinement and XPS in a later section. The doping of Fe3+ into the octahedral Zn2+ positions was manifested as a shift in the XRD peaks towards higher 2θ values. This is mainly due to the smaller ionic radii of Fe3+ compared to Zn2+. The replacement of octahedral Zn2+ ions by Fe3+ may result in a reduction of lattice distances.
m space group. The proposed crystal structure for the TiZn2−xFexO4+δ composition involves an inverse spinel structure in which Fe3+ ions are expected to occupy the octahedral sites and site allocation is given by the formula Ti(oh)Zn1(Td)Zn1−x(oh)Fex(Oh)O4+δ. The allocation of Fe3+ into the octahedral sites is confirmed with the help of Rietveld refinement and XPS in a later section. The doping of Fe3+ into the octahedral Zn2+ positions was manifested as a shift in the XRD peaks towards higher 2θ values. This is mainly due to the smaller ionic radii of Fe3+ compared to Zn2+. The replacement of octahedral Zn2+ ions by Fe3+ may result in a reduction of lattice distances.


