
 Open Access Article
 This Open Access Article is licensed under a Creative Commons Attribution-Non Commercial 3.0 Unported Licence
Multifunctional CeO2 incorporated Fe2O3 anchored on a rich porous structured carbon backbone for supercapacitors and adsorption of acid orange II†
Hang
Zhang
a,
Lijuan
Xia
a,
Jianping
Tang
a,
Yuan
Li
a,
Lei
Wang
*a,
Chuying
Ouyang
*b and
Shengliang
Zhong
 *a
*a
aKey Lab of Fluorine and Silicon for Energy Materials and Chemistry of Ministry of Education, College of Chemistry and Chemical Engineering, Jiangxi Normal University, Nanchang, 330022, China. E-mail: slzhong@jxnu.edu.cn
bDepartment of Physics, Laboratory of Computational Materials Physics, Jiangxi Normal University, Nanchang, 330022, P. R. China
First published on 25th July 2022
Abstract
Cerium dioxide–hematite/carbon porous microspheres (CeO2–Fe2O3/C, CFC) with a rough surface and a particle size of approximately 1 μm were manufactured through a simple solvothermal and then pyrolytic process using 1,1′-dipentadecadienoic acid (DDA) as both a ligand and a metal core. Cerium ions are first coordinated with carboxylic acid at room temperature to produce Ce-DDA coordination polymers (CPs) with a rich pore structure, and then calcined in a protective gas atmosphere to produce a carbon skeleton that retains the porous states, while the Ce/Fe ions in the complex remained bonded to oxygen. Due to the massive electron gain/loss valence of cerium ions (Ce3+/Ce4+) and the strong conductivity of iron ions, the prepared CFC can indeed perform ion-proton exchange rapidly and moreover show high stability. The CFC has a specific capacitance of 803 F g−1 at a scan rate of 1 mV s−1 for supercapacitor electrode materials. Moreover, it displays an excellent capacitance retention of 95% after 10![[thin space (1/6-em)]](https://www.rsc.org/images/entities/char_2009.gif) 000 cycles, indicating that the material has outstanding cycling stability and potential applications in the electrode materials of supercapacitors. Furthermore, CFC has a strong adsorption effect for degrading acid orange II dye (AO7), with a high degradation rate of over 96% after 25 min at various pH (pH = 2, 4, 6, 8, 10, 12), showing that the sample has an excellent adsorption effect throughout a wide pH range. This newly designed CFC has excellent adsorption activity and exceptional supercapacitive cycling stability, making it ideal for wastewater treatment and energy storage applications.
000 cycles, indicating that the material has outstanding cycling stability and potential applications in the electrode materials of supercapacitors. Furthermore, CFC has a strong adsorption effect for degrading acid orange II dye (AO7), with a high degradation rate of over 96% after 25 min at various pH (pH = 2, 4, 6, 8, 10, 12), showing that the sample has an excellent adsorption effect throughout a wide pH range. This newly designed CFC has excellent adsorption activity and exceptional supercapacitive cycling stability, making it ideal for wastewater treatment and energy storage applications.
1. Introduction
Researchers are investigating sustainable energy storage solutions with higher power and energy density as a result of growing energy demand and dwindling fossil fuel supply. As a sustainable energy storage technology, supercapacitors have a long cycle life, good low temperature resistance, and fast charging and discharging rates.1,2 They may be augmented or replaced in a short period of time when a large amount of power is required.3,4 Pseudo-capacitors (PCs) are also known as Faraday quasi-capacitors because they may conduct highly reversible electrochemical adsorption, desorption, or oxidation and reduction processes and create capacitors proportionate to the electrode charging potential, resulting in increased performance.5,6 Metal oxide semiconductors have been widely used in superconductors, ceramics, oxygen sensors, catalysts, and solid oxide fuel cell electrolytes in recent years.7,8 Cerium oxide (CeO2), a promising material for photocatalysts, fuel cells, tripartite catalysts, sensors, water treatment, solar cells and electrochemical redox processes, has aroused research curiosity among environmentally friendly rare earth metal oxides due to its special band gap structure.9,10 Ce, which has a valence of 4f15d16s2, can lose one 5d and two 6s electrons to form stable Ce3+, similar to other lanthanide metals, or an additional 4f electron to form the 4f empty state, resulting in stable Ce4+.11 So, CeO2 is one of the most attractive candidates for metal oxide anode materials in supercapacitors, which has the ability to transition between Ce3+ and Ce4+ as an outstanding redox material.12 Despite this, due to its poor conductivity and structural stability, as well as the lattice broadening when Ce4+ was reduced to Ce3+, there are few reports on the employment of CeO2 alone as an anode materials.13To overcome this bottleneck, it has been claimed that integrating high electrical conductivity carbon materials and additional active sites transitionmetal oxides with CeO2.14 CeO2-Based composites with other transitionmetal oxides, such as CeO2@Co3O4,15 CeO2–Fe2O3,16 CeO2–CuO,17 CeO2–MnO2,18 and others,19 have recently been created and used as counter electrodes. Hematite (α-Fe2O3), a direct bandgap (2.1 eV) semiconductor material, can be applied in supercapacitors due to its high theoretical capacity (>600 mA h g−1), low cost, environmental friendliness, natural abundance, and good capacitance retention.20–22 In addition, combining highly conductive carbon compounds can increase electrochemical activity.23 Porous carbon structures have been shown in multiple studies to increase performance not only by dispersing functional sites and providing a broad accessible area due to the huge surface area of such pores, but also by permitting efficient material movement across the pores.24,25
Coordination polymers (CPs) consist of ligand polymers with a regular pore structure and organic ligands containing carboxylic acids, phosphoric acids or nitrogen that are linked to metal ions or metal clusters by coordination bonds, with the organic ligands acting as conduits and the alloy ions or metal clusters acting as junctions.26,27 The carbon skeleton materials obtained by pyrolysis of CPs can still maintain the original porous and stable structure, with the advantages of adjustable pore size, adjustable pore surface, and selective adsorption of gas molecules, vs inorganic porous molecular sieves and activated carbon materials.28,29 Roncaroli et al. developed a linear coordination polymer as a sacrificial material for the preparation of Co–N doped mesoporous carbon, which was subsequently heat treated at high temperature and acid dipped as a supercapacitor electrode with high active sites.30 Therefore, CPs-derived carbon porous structures as carbon skeletons for CeO2/Fe2O3 composites are predicted to simultaneously improve supercapacitor performance.
Here, we have prepared porous structured Ce-DDA CPs by solvothermal method, where high-temperature pyrolysis transformed the ligand into a porous carbon skeleton, while CeO2 and Fe2O3 were retained and anchored to the carbon skeleton as synergistic composites. The specific synthesis process is shown in Scheme 1. In contrast to other experiments in which coordination competition causes uneven coordination between metal ions and ligands, using DDA as an iron source and providing carboxylate to coordinate with cerium ions allows for uniform coordination of cerium ions and iron ions, and the final form is uniformly anchored on the carbon skeleton and behaves as a uniform active site in electrocatalysis. The multifunctional material CFC was used to improve the electrode performance of supercapacitors. To assess the adsorption activity of CFC, the AO7 was chosen as the organic pollutant.
 | ||
| Scheme 1 The preparation of CFC and CF are depicted in the flow chart. | ||
2. Experimental section
2.1 Materials
Chemicals and reagents of analytical quality were utilized throughout the work and were used exactly as they were supplied. Alfa Aesar provided cerium(III) nitrate (Ce(NO3)3·6H2O) and 1,1′-dipentadecadienoic acid (C12H10FeO4).2.2 Synthesis of CFC and CF
0.1 mmol Ce(NO3)3 6H2O and 0.2 mmol C12H10FeO4 were dissolved in 15 mL and 10 mL anhydrous ethanol, respectively, stirring for 10 min at room temperature, and poured into a beaker a 40 mL polytetrafluoroethylene reactor at 140 °C for 12 h. After the reaction was finished, it was washed three times with anhydrous ethanol and distilled water alternately, then dried overnight at 80 °C. The synthesized products were poured into crucibles and calcined in a muffle furnace and tube furnace at 800 °C, respectively, and cooled to room temperature to obtain CF and CFC. The corresponding product yields and production rates are attached to Table S1 in ESI.†2.3 Structural and morphology characterization
The Rigaku D/max-3B diffractometer with a copper target and K1 radiation (λ = 1.54056 Å) was used to analyze the X-ray powder diffraction (XRD) pattern. The sample was scanned in 0.01° increments from 5° to 80°. Images of the morphology were taken using an FEI QUANTA200 scanning electron microscope (SEM) running at 30 kV. The microstructure was examined in further detail using transmission electron microscopy (TEM) (JEOL JEM-2100) at a 200 kV acceleration voltage. High-resolution transmission electron microscopy (HRTEM) and energy-dispersive X-ray spectroscopy were utilized to create elemental maps (EDS). X-ray photoelectron spectroscopy (XPS) measurements (ESCALAB 250) were used to investigate the surface species and their chemical states. The light absorption properties of the catalysts were determined using ultraviolet-visible (UV-VIS) spectroscopy. UV-vis spectra were collected using a Shimadzu UV-visible spectrophotometer-3600. The Brunauer–Emmett–Teller (BET) technique was used to compute the specific surface area, and the Barrett–Joyner–Halenda (BJH) model was utilized to quantify pore volume and pore size distribution based on the adsorption branches of N2 sorption isotherms. Fourier transform infrared (FTIR) spectra were taken on a Bruker Tensor 27 spectrometer from 4000 to 400 cm−1 using KBr as the dispersion.2.4 Adsorption activity test
Adsorption tests were conducted at 25 °C with magnetic stirring in a beaker containing 30 mL of 10 mg L−1 AO7 dye solution. A weighed amount of adsorbent (15 mg) was added to the dye solution. These solutions had a pH of approximately 7.31 and were first equilibrated for dark adsorption, followed by taking 1 ml of sample from the solution at intervals under magnetic stirring and centrifuging it in a high-speed centrifuge for 10 min. The supernatant was then collected, and the concentration was determined by measuring the absorbance at 485 nm. Subsequently, tests were performed in different pH ranges.2.5 Electrochemical measurements
The active ingredient (CFC and CF), acetylene black, and polytetrafluoroethylene solution (PTFE: mucilage) were combined in a mass ratio of 8:1:1, dispersed well with ethanol and rolled out on flat glass to a sheet of 5 mm thickness. After drying in an oven at 60 °C, 100 mg of sample was placed on a Ni mesh current collector and pressed under the pressure of a 10 Mpa roller press to form a working electrode (thickness of approx. 50 μm).
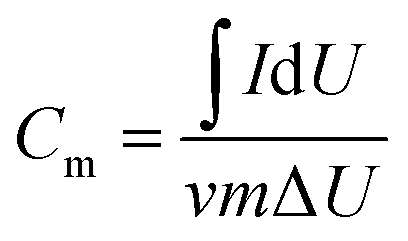
For electrochemical experiments, a three-electrode setup with 6 M KOH as the electrolyte solution was utilized at room temperature with an electrochemical analyzer (CHI760E workstation, Shanghai Chenhua), whose data was represented by cyclic voltammetry (CV) with potentials ranging from 0.1 to 0.4 V and at various scan rates, galvanostatic discharge/charge (GDC) tests, and electrochemical impedance spectroscopy (EIS) tests. The specific capacity of the electrode material may be computed using the cyclic voltammetry curve in the three-electrode system test, and the formula for determining the specific capacity of mass is presented in Formula (1):31
 | (1) |
 is the integrated area of the CV curve; ν is the scan rate (V s−1); m is the mass of the active material (g); and ΔU is the voltage range (V).
3. Results and discussion
3.1 Morphological and structural analysis
To examine the impact on the structure of the produced Ce-DDA, a series of reaction parameters, such as duration, temperature, and raw material ratio, were adjusted, and the corresponding exploratory reaction conditions are listed in Table S2 (ESI†). The influence of varying reaction periods at 140 °C on product morphology was first assessed. As shown in Fig. S1 (ESI†), only a few spheres are created due to the short reaction period of 8 h (Fig. S1a, ESI†), the majority of which are impurities, and the reaction was inadequate; when the reaction time is increased to 16 h, the reaction is sufficient (Fig. S1b, ESI†), it can be seen that there are still impurities in the product, and the spheres formed are not uniform in size. The time was increased to 20 h (Fig. S1d, ESI†), however, the product was broken due to the long reaction time and still contained a large amount of impurities as a result. Therefore, we chose a more moderate reaction time of 12 h as the optimal reaction time. The remaining variables remained unchanged, and the reaction time was set as 12 h. The impact of different reaction temperatures on the final products was investigated, and SEM pictures of the samples are shown in Fig. S2 (ESI†). The spheres formed by the synthesized Ce-DDA at 120 °C were not homogeneous (Fig. S2a, ESI†) and when the temperature was increased to 180 °C (Fig. S2c, ESI†), the resulting homogeneous spheres had many small particles on their surface. A large number of spheres broke due to the high temperature at 200 °C (Fig. S2c, ESI†). The results of the study indicate that neither too low nor too high temperatures promote the establishment of spheres. Therefore, considering the economic cost, the ideal reaction temperature is 140 °C. The influence of the stoichiometric ratio of Ce(NO3)3·6H2O to C12H10FeO4 on the morphology was next investigated using the reaction temperature and time (140 °C and 12 h) determined before. The produced spherical shapes had non-uniform particle sizes when the feedstock component ratio was 1:1 in Fig. S3 (ESI†). When the raw material ratio was 1:3, the result contained a lot of contaminants. The spherical form exhibited a significant increase in particle size and was not homogenous when the ratio was 1:4 or 1:5. When evaluating common samples, it was discovered that a feedstock ratio of 1:2 provided the best molar ratio of reaction concentration.
The SEM of Ce-DDA produced by reacting at a 1:2 raw material ratio at 140 °C for 12 h is shown in Fig. S4 (ESI†). The sample is made up of spheres with a rough surface, consistent shape, and particle sizes of 600–700 nm. The XRD of the Ce-DDA precursor in Fig. S5 (ESI†) and the lack of diffraction peaks in the image indicated that the produced precursor is amorphous. Bending and C–O stretching vibrations within the O–H face of the dimer create the absorption peaks at 1403 and 1300 cm−1 for the DDA ligand in Fig. S6 (ESI†), whereas oscillating vibrations outside the O–H face cause the strong broad peak of about 919 cm−1. 794 and 1695 cm−1 are the cyclic olefin absorption peaks, showing the retention of cyclopentadiene,32 whereas the locations of the aforementioned C![[double bond, length as m-dash]](https://www.rsc.org/images/entities/char_e001.gif) O, C–O, and O–H peaks are altered,33 EDS spectra (Fig. S7, ESI†) also reveal the presence of Ce elements in the precursor, suggesting effective coordination of the carboxylate to Ce ion. The thermal analysis test was carried out to determine an appropriate pyrolysis temperature for the conversion of precursors to oxides. The thermal gravity-derivative thermogravimetry (TG-DTG) curves obtained from the thermal examination of the Ce-DDA are shown in Fig. S8 (ESI†). The first stage is weight loss in the range of room temperature to 220 °C, with a slow weight loss of roughly 15%, largely owing to physical and structural water loss; The weight loss in the second stage is between 220 °C and 800 °C, after which it stops losing weight and maintains a stable structure with a 58% weight reduction.34 Weight loss is more noticeable at this stage, owing to the breakdown of the carboxylic acid in the ligand.
O, C–O, and O–H peaks are altered,33 EDS spectra (Fig. S7, ESI†) also reveal the presence of Ce elements in the precursor, suggesting effective coordination of the carboxylate to Ce ion. The thermal analysis test was carried out to determine an appropriate pyrolysis temperature for the conversion of precursors to oxides. The thermal gravity-derivative thermogravimetry (TG-DTG) curves obtained from the thermal examination of the Ce-DDA are shown in Fig. S8 (ESI†). The first stage is weight loss in the range of room temperature to 220 °C, with a slow weight loss of roughly 15%, largely owing to physical and structural water loss; The weight loss in the second stage is between 220 °C and 800 °C, after which it stops losing weight and maintains a stable structure with a 58% weight reduction.34 Weight loss is more noticeable at this stage, owing to the breakdown of the carboxylic acid in the ligand.
The precursors were then calcined at 800 °C for 4 h in a N2 atmosphere to obtain CFC composites that retain the Ce-DDA carbon skeleton, and we used carbon-free CF obtained by calcination in the air as the comparison material. SEM images of CF are shown in Fig. S9a and b (ESI†). Due to the collapse of the initial skeleton induced by the interaction of carbon with oxygen to form carbon oxides escaping during calcination, the calcined products are hollow and porous microspheres with a particle size of around 500 nm, which is smaller than the precursor. The solid precursor was calcined in the air into hollow spheres created by the aggregation of nanoparticles, according to the TEM images in Fig. S9c and d (ESI†). The CFC spheres have a rougher surface than the precursors, with an almost identical particle size of approximately 1 μm (Fig. S10a and b, ESI†), and consist of porous microspheres that retain the carbon of the CPs in an oxygen-deprived nitrogen environment (Fig. S10c and d, ESI†).
In Fig. S11 (ESI†), the diffraction peaks (black) in the (111), (200), (220) and (311) planes correspond to the cubic crystalline phase CeO2 standard card (JCPDS card 34-0394), indicating that it is CeO2 with a cubic fluorite structure. Several other diffraction peaks (red lines) are correspond to the hexagonal phase α-Fe2O3 (JCPDS card 33-0664). Furthermore, the lack of impurity peaks suggests that the calcined product is of great purity and that all of it has been converted to CF.35 No diffraction peaks of carbon were found in CFC except for the above diffraction peaks, but EDS (Fig. S12, ESI†) showed that CF contains about 0.1 wt% of carbon, which is negligible due to carbon from the environment, while CFC contains about 30.09 wt% of carbon, which is known that the carbon in the sample is mainly amorphous,36 and in addition, the XRD diffraction peaks corresponding to CFC are significantly broadened, also as a result of the weakened crystallinity due to the high carbon content. The CFC was calculated to contain 40.01 wt% CeO2 and 24.87 wt% Fe2O3.
TEM testing was done to have a better understanding of the detailed structure of CFC. Nanoparticles are visible in the porous microsphere structure in Fig. 1a and b. A clear lattice fringe on the core with an interplanar spacing of 0.27 nm, corresponding to the (104) planes of Fe2O3,37 and another lattice fringe on the shell with an interplanar spacing of 0.32 nm, corresponding to the (111) planes of CeO2 in Fig. 1c.38 The coexistence of CeO2 and Fe2O3 in the microsphere structure of CFC is confirmed by HRTEM imaging. Furthermore, the amorphous carbon skeleton is represented by the lattice-free areas at the borders. The element mapping characterized in Fig. 1e–k strongly reflected the uniform distribution of CeO2 and Fe2O3 on the carbon skeleton, forming a porous microsphere structure, and the presence of Ce, Fe, O, and C elements are proved and dispersed uniformly, as shown in Fig. 1d.
 | ||
| Fig. 1 TEM and element mapping of CFC. (a and b) TEM image; (c) HRTEM of the selective area; (d): HAADF-STEM image; (e–k) element mapping of C, O, Fe and Ce. | ||
Fig. S13 (ESI†) shows a TEM study of CF to further understand its hollow spheres composed of nanoparticles. The HRTEM image of the selected region (Fig. S13c, ESI†) reveals a pretty obvious lattice stripe upon that center without an amorphous region with a planar distance of 0.27 nm, where it corresponds to the (104) plane of Fe2O3, and another lattice edge on the shell with a planar layout of 0.32 nm, which matches up to the (111) plane of CeO2, confirming that CeO2 and Fe2O3 coexist in CF. A typical HAADF-STEM image is shown in Fig. S13d (ESI†), and the elemental profiles in Fig. S13e–j (ESI†) strongly reflect the uniform distribution of Ce, O, and Fe.
The chemical state and surface composition of elements in a material are measured using XPS. In Fig. 2a, the binding energy maxima for C 1s, O 1s, Fe 2p, and Ce 3d are 284.4, 529, 716.2, and 882.3 eV, respectively. The core energy spectra of Ce 3d suggest Ce3+ and Ce4+ oxidation states due to spin double splitting (3d3/2 and 3d5/2 orbitals) (Fig. 2b). Ce3+ 3d3/2 has a peak at 885.6 eV, with satellite peaks at around 904.2 eV, Ce3+ 3d5/2 at 913.31 eV, and satellite peaks at 881.84 and 885.72 eV, respectively.39 The adsorption strengths of 878.7, 711.2 and 724.7 eV indicate Fe 2p3/2 and Fe 2p1/2,40 respectively, as shown in Fig. 2c, which are compatible with the prior data. Likewise, the satellite peak can be seen between 719.6 eV. Due to the peak position and energy imbalance between Fe 2p3/2 with Fe 2p1/2, iron is Fe2+/Fe3+ in the typical Fe2O3 phase that arises in CF (13.5 eV). The signal at 283.5 eV corresponds to M–C–O in Fig. 2d,41 indicating that carbon in CFC is bonded to and interacts with Fe2O3/CeO2. The peak in the spectra of the O 1s core level at the binding energy (530.2 eV, O 1s) shows lattice oxygen in Fig. 2e.42 The shift in the characteristic peak in CFC is due to the interaction of carbon on oxygen atoms. Fe2O3 nanoparticles are successfully mixed into CeO2 nanoparticles, according to XPS data, which agrees with XRD and EDX results.
 | ||
| Fig. 2 The XPS (a–e) and Raman (f) patterns of CF and CFC. (XPS: (a) survey; (b) Ce 3d; (c) Fe 2p; (d) C 1s; (e) O 1s). | ||
Special structural traits or distinctive groupings can be identified using Raman analysis. Raman spectra of composites are shown in Fig. 2f. Several CF and CFC peaks may be detected in the range of 200–1800 cm−1. The band detected at 466 cm−1 is due to the F2g vibrational mode of the cubic CeO2 structure. Compared with pure CeO2, the characteristic peaks appearing at 462 cm−1 and 464 cm−1 in CF and CFC are weakened, which may be due to the formation of composites with Fe2O3 and carbon. Instead, the blue shift occurred because Fe, which has a smaller ionic radius, replaced Ce, thus suggesting that CF and CFC are composites. The α-Fe2O3 phase is represented by these additional peaks at 216, 286, 398, 658 and 1095 cm−1. Raman peaks in the A1g mode appear at 216 cm−1, while Raman peaks in the Eg mode appear at 286 and 398 cm−1.43 The peak at 658 cm−1 was ascribed to the disordered effect of Fe2O3. Additionally, the peaks of 1321 and 1581 cm−1 in the CFC diagram are the Eg vibration modes corresponding to the sp2 electronic structure of D and G modes.44 The carbon in CFC composites is mostly deposited in amorphous form, according to XRD and element analyses.
The relative pressure ranges from 0–1.0, as can be observed in Fig. S14 (ESI†). The isotherms can be classified as type IV with type H3 hysteresis loops with a slit-like uneven mesopore,45 which is mostly formed by the accumulation of flaky particles, according to the International Union of Pure and Applied Chemistry (IUPAC) and Brunauer–Deming–Demin–Teller classification, and CFC has a specific surface area of 71.2 m2 g−1.
3.2 Electrochemical properties
To prove the potential application of CFC as supercapacitor electrodes, the electrochemical properties and charge storage machines in a 6 M KOH electrolyte were studied with a three-electrode system. Fig. 3a depicts the CV of the CFC electrode at various scan rates (1–100 mV s−1) and window voltages ranging from 0.1 to 0.4 V. The CV curve of the CFC electrode clearly shows a couple of reversible redox, which is primarily due to the reversible transformation between Fe2+/Fe3+ and Ce3+/Ce4+,46 indicating that the CFC electrode has pseudocapacitance properties. The redox peaks for CeO2 are not obvious, which is due to the coverage of the Fe2O3 redox peak. The current rose as the scanning rate increased from 1 to 100 mV s−1. It should be proportional to the reaction ability of the electrode-electrolyte interface and the height of the OH− concentration. The high-energy storage process of CFC in aquatic KOH electrolytes is primarily composed of two processes: surface adsorption-desorption and CFC surface insertion/extraction. The reaction eqn (2) and (3) is as follows:47| CeO2 + e− + H2O ↔ Ce3+OOH + OH−48 | (2) |
| Fe2O3 + OH− ↔ Fe2O3OH + e− | (3) |
 | ||
| Fig. 3 (a) Cyclic voltammetry curves; (b) comparison of specific capacitance at various scan rates of CFC electrode; (c) galvanostatic charge/discharge curves of CFC at different current densities; (d) Nyquist plots. | ||
The Cs of the CFC electrode at 1 mV s−1 scan rate is 803 F g−1 in Fig. 3b, which is significantly better than the Cs recorded above the identical CF with 144 F g−1 in Fig. S15b (ESI†). Combined with the analysis of the surface data, the pore structure provides a higher specific surface and more active sites, which increased the electron conduction of energy storage. This tremendous potential performance could be attributed to the presence of carbon, which maintains the rapid transmission of electrolyte electrochemical reactions on the electrode, improved the conductivity and increased the overall charge storage capacity. Cs is recognized when the scan rate increases and the Cs value decreases. The drop in value is owing to ions having restricted access to the mesoporous network inside the electrode material at high scan rates, as well as ions having limited movement due to sluggish diffusion. The GCD curves of CFC composites at varied current densities are shown in Fig. 3c, and the stationary curves fit the redox peaks in CV curves well. All discharge branches are almost symmetrical with their charging platform, demonstrating the optimum capacitance behavior. The use of carbon as a conductive carrier increased the activity of the electrode, which is consistent with previous studies.49,50 The discharge time decreases with the increase of the current density, and the corresponding Cs value decreases. The OH− ion may be completely used from the electrolyte to the internal electrode at low current densities, resulting in a high surface efficiency and hence a greater specific capacitance. The decrease in capacitance at high current density is since some active surfaces of active materials can not be exploited for charge storage. However, CF exhibits poorer charge and discharge performance than CFC.
EIS is being utilized to further investigate the electrochemical features of these electrodes to better explain the aforementioned experimental results. Fig. 3d shows the Nyquist impedance diagram in the frequency range from 10 MHz to 100 kHz. The solution resistance and charge transfer resistance are reflected by the intercept between the real axis and the tiny semicircle in the high-frequency zone (Rct).51 At high frequency, the Rs value of CFC can be seen from the intercept of the curve and the transverse axis as 0.28 Ω, indicating that the resistance of the solution is also very small. The almost vertical line shows that the supercapacitor electrode exhibits typical capacitance behavior in the low-frequency region, The quick mass transfer mechanism enabled by the activated carbon backbone enables high and low-frequency impedance of CFC superior to CF in general. Fig. S16 (ESI†) shows the stability over 10000 cycles, with a slight increase in coulombic efficiency after material activation and Cs remaining at around 20 mA h g−1.
3.3 Adsorption performance test for AO7
In the food industry, the structure of AO7 is a non-food coloring and is not allowed to be added in foods. In the experiments, it was found that CeO2, Fe2O3 and CF did not show significant degradation of AO7 (Fig. S17b–d, ESI†), while CFC showed significant adsorption performance on AO7 (Fig. S17a, ESI†), and the porous activated carbon structure in the composite material provided catalytic substrates for CeO2 and Fe2O3, which was ascribed to the porous structure of activated carbon in the composite material.52The magnetic separation and regeneration test was carried out under the influence of an applied magnetic field, and four cycles were conducted to assess the reuse potential of the employed CFC. In this test, CFC was recovered after the equilibrium conditions were reached, and the sample dried in an oven was desorbed by adding 50 mL of absolute ethanol. After adsorption equilibrium, the solution was filtered, and the residual dye concentration of the filtrate was analyzed at the maximum absorption wavelength (485 nm) using an ultraviolet/visible spectrophotometer. The dye removal percentage was calculated using the following eqn (4):53
 | (4) |
The absorption spectra of the free AO7 solution is depicted in Fig. 4a. To illustrate how to dye absorbance decreases with exposure time, samples were obtained at regular intervals. No formation of new compounds was detected by UV spectral analysis. The distinctive absorption edge of AO7 in solution at 485 nm rapidly declines, and after 90 min, the characteristic peak practically vanishes, suggesting that the degradation equilibrium has been achieved. According to the Lambert–Beer equation, the concentration of AO7 solution for the relevant time interval from the absorbance of the distinctive peak in Fig. 4b, and then the dye removal rate for a certain time was calculated. It can be found that the removal rate of dye is getting slower after 65 min, and the maximum removal rate is 97.0% after 90 min.
 | ||
| Fig. 4 (a) The absorbance spectra and color changes (inset) (C0 = 10 mg L−1); (b) removal rate of the CFC at different time intervals; (c and d) adsorption stability of the CFC; (e): effect of pH on AO7 adsorption using CFC. | ||
In Fig. 4c, the cycle stability is demonstrated. Four cycles of degradation tests were performed and a certain degree of degradation performance was found, which may be due to the lack of catalyst washing allowing the interior of the material to be occupied by dye molecules. Fig. 4d shows the corresponding removal rates for each cycle. After repeating the experiment four times, the removal rate of AO7 dye could reach 83.3%. The results indicate that the material has good cycle stability. In the degradation process, especially in aqueous solutions, the pH of the solution is considered a significant parameter. The behavior of the process may change if the pH is changed. The impact of pH on dye removal is seen in Fig. 4e. The adsorption capacity declined as the pH climbed from 2 to 12, and dye removal fell from 99.9% to 96.0%, with the greatest adsorption being recorded at pH = 2. In conclusion, the material showed good degradation of the AO7 dye over a wide pH range.
4. Conclusions
The solvothermal approach was used to efficiently create Ce-DDA CPs with a porous microsphere morphology and to produce composite CFC anchored on organic ligand-derived carbon skeletons in an N2 atmosphere. The supercapacitor performance was investigated in a 6 M KOH electrolyte. The capacitance of CFC was significantly better than that of CF at a scan rate of 1 mV s−1, and its specific capacitance could reach 803 F g−1, owing to the porous carbon skeleton as a conductive active substrate that provided an extremely rich porous channel mass transfer pathway for the electrolyte and catalyst. After 10000 cycles, the coulombic efficiency remained basically unchanged, indicating that it has high cycling stability as a supercapacitor electrode material and has broad application prospects. As a multifunctional material, the hazardous dye acid orange was efficiently degraded by the active composite catalyst anchored on the carbon skeleton, and the high degradation rate is still maintained in the full pH range after 4 cycles.
Author contributions
The manuscript was written through contributions of all authors. All authors have given approval to the final version of the manuscript.Conflicts of interest
There are no conflicts to declare.Acknowledgements
This study was financially supported by the National Natural Science Foundation of China (22061020), Jiangxi Provincial Department of Science and Technology (No. 20192BBEL50017 and 20202ACBL203002) and the Innovation Foundation for graduate students of Jiangxi Normal University (YC2020-B065).References
- Y. Wu, C. Liu, C. Wang, S. Lu and B. Zhang, Angew. Chem., Int. Ed., 2020, 59, 21170–21175 CrossRef CAS PubMed.
- S. Ke, D. Xie, K. Zhang, F. Cheng and Y. Wu, Mater. Adv., 2022, 3, 2026–2036 RSC.
- Q. C. Zhu, D. Y. Zhao, M. Y. Cheng, J. Q. Zhou, K. A. Owusu, L. Q. Mai and Y. Yu, Adv. Energy Mater., 2019, 9, 1901081 CrossRef.
- P. Simon, Y. Gogotsi and B. Dunn, Science, 2014, 343, 1210–1211 CrossRef CAS PubMed.
- Q. Yin, H. B. Jia, A. Mohamed, Q. M. Ji and L. Hong, Nanoscale, 2020, 12, 5507–5520 RSC.
- L. Y. Yuan, B. Yao, B. Hu, K. F. Huo, W. Chen and J. Zhou, Energy Environ. Sci., 2013, 6, 470–476 RSC.
- H. C. Ji, W. Zeng and Y. Q. Li, Nanoscale, 2019, 11, 22664–22684 RSC.
- C. Xia, Y. Mi, B. Wang, B. Lin, G. Chen and B. Zhu, Nat. Commun., 2019, 10, 1707 CrossRef PubMed.
- X. J. Wen, C. G. Niu, L. Zhang, C. Liang and G. M. Zeng, Appl. Catal., B, 2018, 221, 701–714 CrossRef CAS.
- H. A. Miller, A. Lavacchi, F. Vizza, M. Marelli, F. Di Benedetto, F. D. I. Acapito, Y. Paska, M. Page and D. R. Dekel, Angew. Chem., Int. Ed., 2016, 55, 6004–6007 CrossRef CAS PubMed.
- H. Kim, M. Kim and S.-H. Byeon, J. Mater. Chem. C, 2017, 5, 444–451 RSC.
- Z. Yang, M. Xiang, W. Zhu, J. Hui and H. Qin, ACS Sustainable Chem. Eng., 2020, 8, 6675–6681 CrossRef CAS.
- K. Prasanna, P. Santhoshkumar, Y. N. Jo, I. N. Sivagami, S. H. Kang, Y. C. Joe and C. W. Lee, Appl. Surf. Sci., 2018, 449, 454–460 CrossRef CAS.
- N. Wu, X. Bai, D. Pan, B. Dong, R. Wei, N. Naik, R. R. Patil and Z. Guo, Adv. Mater. Interfaces, 2021, 8, 2001710 CrossRef CAS.
- X. Li, S. You, J. Du, Y. Dai, H. Chen, Z. Cai, N. Ren and J. Zou, J. Mater. Chem. A, 2019, 7, 25853–25864 RSC.
- K. Li, H. Wang, Y. Wei and D. Yan, Chem. Eng. J., 2010, 156, 512–518 CrossRef CAS.
- T. Zhang, X. Ren, D. Fan, X. Kuang, H. Wang, D. Wu and Q. Wei, Sens. Actuators, B, 2019, 297, 126800 CrossRef CAS.
- G. P. Ojha, B. Pant, S.-J. Park, M. Park and H.-Y. Kim, J. Colloid Interface Sci., 2017, 494, 338–344 CrossRef CAS PubMed.
- L. Yin, J. Xu, B. Zhang, L. Wang, W. Tao, X. Teng, W. Ning and Z. Zhang, Chem. Eng. J., 2022, 428, 132581 CrossRef CAS.
- D. Cao, J. Zhang, A. Wang, X. Yu and B. Mi, J. Mater. Sci. Technol., 2020, 56, 189–195 CrossRef.
- B.-C. He, C. Zhang, P.-P. Luo, Y. Li and T.-B. Lu, Green Chem., 2020, 22, 7552–7559 RSC.
- M. Alexandreli, C. B. Brocchi, D. M. Soares, W. G. Nunes, B. G. Freitas, F. E. R. de Oliveira, L. E. C. A. Schiavo, A. C. Peterlevitz, L. M. da Silva and H. Zanin, J. Energy Storage, 2021, 42, 103052 CrossRef.
- L. Liu, J. Shi, R. Wang, H. Cao and Z. Liu, J. Alloys Compd., 2017, 725, 544–556 CrossRef CAS.
- H. Huang, P. He, T. Huang, S. Hu, T. Xu, H. Gu, S. Yang, L. Song, X. Xie and G. Ding, ACS Appl. Mater. Interfaces, 2019, 11, 1239–1246 CrossRef CAS PubMed.
- R. Vinodh, C. V. V. M. Gopi, V. G. R. Kummara, R. Atchudan, T. Ahamad, S. Sambasivam, M. Yi, I. M. Obaidat and H.-J. Kim, J. Energy Storage, 2020, 32, 101831 CrossRef.
- G. Cai, P. Yan, L. Zhang, H.-C. Zhou and H.-L. Jiang, Chem. Rev., 2021, 121, 12278–12326 CrossRef CAS PubMed.
- T. A. Schaub, E. A. Prantl, J. Kohn, M. Bursch, C. R. Marshall, E. J. Leonhardt, T. C. Lovell, L. N. Zakharov, C. K. Brozek, S. R. Waldvogel, S. Grimme and R. Jasti, J. Am. Chem. Soc., 2020, 142, 8763–8775 CrossRef PubMed.
- D. Liu, W. Gu, L. Zhou, L. Wang, J. Zhang, Y. Liu and J. Lei, Chem. Eng. J., 2022, 427, 131503 CrossRef CAS.
- X. Zhou, B. Liu, Y. Chen, L. Guo and G. Wei, Mater. Adv., 2020, 1, 2163–2181 RSC.
- A. K. Díaz-Duran, G. Montiel, F. A. Viva and F. Roncaroli, Electrochim. Acta, 2019, 299, 987–998 CrossRef.
- Q. Wu, T. He, Y. Zhang, J. Zhang, Z. Wang, Y. Liu, L. Zhao, Y. Wu and F. Ran, J. Mater. Chem. A, 2021, 9, 24094–24147 RSC.
- A. B. Andreeva, K. N. Le, L. Chen, M. E. Kellman, C. H. Hendon and C. K. Brozek, J. Am. Chem. Soc., 2020, 142, 19291–19299 CrossRef CAS PubMed.
- B. Ellis and H. Pyszora, Nature, 1958, 181, 181–182 CrossRef CAS.
- Z. Yang, L. Zhang, Y. Zhang, M. Bai, Y. Zhang, Z. Yue and E. Duan, Chem. Eng. J., 2020, 395, 124980 CrossRef CAS.
- P. Bera, K. R. Priolkar, A. Gayen, P. R. Sarode, M. S. Hegde, S. Emura, R. Kumashiro, V. Jayaram and G. N. Subbanna, Chem. Mater., 2003, 15, 2049–2060 CrossRef CAS.
- V. Y. Iakovlev, D. V. Krasnikov, E. M. Khabushev, J. V. Kolodiazhnaia and A. G. Nasibulin, Carbon, 2019, 153, 100–103 CrossRef CAS.
- Q.-Q. Xu, W. Huo, S.-S. Li, J.-H. Fang, L. Li, B.-Y. Zhang, F. Zhang, Y.-X. Zhang and S.-W. Li, Appl. Surf. Sci., 2020, 533, 147368 CrossRef CAS.
- L. Ye, A. H. Mahadi, C. Saengruengrit, J. Qu, F. Xu, S. M. Fairclough, N. Young, P.-L. Ho, J. Shan, L. Nguyen, F. F. Tao, K. Tedsree and S. C. E. Tsang, ACS Catal., 2019, 9, 5171–5177 CrossRef CAS.
- Q. He, S. Mukerjee, B. Shyam, D. Ramaker, S. Parres-Esclapez, M. J. Illán-Gómez and A. Bueno-López, J. Power Sources, 2009, 193, 408–415 CrossRef CAS.
- S. Chen, S. Perathoner, C. Ampelli, H. Wei, S. Abate, B. Zhang and G. Centi, J. Energy Chem., 2020, 49, 22–32 CrossRef.
- Y. Guo, J. He, T. Wang, H. Xue, Y. Hu, G. Li, J. Tang and X. Sun, J. Power Sources, 2011, 196, 9299–9307 CrossRef CAS.
- M. Ma, A. Kumar, D. Wang, Y. Wang, Y. Jia, Y. Zhang, G. Zhang, Z. Yan and X. Sun, Appl. Catal., B, 2020, 274, 119091 CrossRef CAS.
- T. Tsoncheva, C. Rosmini, M. Dimitrov, G. Issa, J. Henych, Z. Němečková, D. Kovacheva, N. Velinov, G. Atanasova and I. Spassova, ACS Appl. Mater. Interfaces, 2021, 13, 1838–1852 CrossRef CAS PubMed.
- L. Wang, Z. Sofer and M. Pumera, ACS Nano, 2020, 14, 21–25 CrossRef CAS PubMed.
- H. Ren, Y. Pan, C. C. Sorrell and H. Du, J. Mater. Chem. A, 2020, 8, 3154–3159 RSC.
- M. Nolan and M. V. Ganduglia-Pirovano, Appl. Catal., B, 2016, 197, 313–323 CrossRef CAS.
- S. Ghosh, K. Anbalagan, U. N. Kumar, T. Thomas and G. R. Rao, Appl. Mater. Today, 2020, 21, 100872 CrossRef.
- N. Chakrabarty, A. Dey, S. Krishnamurthy and A. K. Chakraborty, Appl. Surf. Sci., 2021, 536, 147960 CrossRef CAS.
- M. Demir and M. Doguscu, ChemistrySelect, 2022, 7, e202104295 CAS.
- H. Aydın, U. Kurtan, M. Demir and S. Karakuş, Energy Fuels, 2022, 36, 2212–2219 CrossRef.
- G. K. Mishra and R. Kant, J. Power Sources, 2020, 473, 228467 CrossRef CAS.
- M. Demir, B. H. Taymaz, M. Sarıbel and H. Kamış, ChemistrySelect, 2022, 7, e202103787 CAS.
- S. Masimukku, Y.-C. Hu, Z.-H. Lin, S.-W. Chan, T.-M. Chou and J. M. Wu, Nano Energy, 2018, 46, 338–346 CrossRef CAS.
Footnote |
| † Electronic supplementary information (ESI) available. See DOI: https://doi.org/10.1039/d2ma00377e |
| This journal is © The Royal Society of Chemistry 2022 |