DOI:
10.1039/D2MA00324D
(Paper)
Mater. Adv., 2022,
3, 5375-5382
Superconductivity in Bi based Bi2PdPt
Received
21st March 2022
, Accepted 29th April 2022
First published on 3rd May 2022
Abstract
We report the synthesis and properties of superconducting Bi2PdPt, a new member of the Bi–Pd based compounds that are known for simultaneous existence of topological surface states and superconductivity. It crystallizes in a hexagonal structure having space group P63/mmc. A detailed investigation of the properties via transport, magnetization and specific heat measurements confirms bulk superconductivity with a transition temperature, TC, of 4.0 (1) K in the moderate coupling limit.
I. Introduction
The topological aspects of electronic states provide a thrust in the recent research of condensed matter physics. With the realization of spin polarization in these electronic states, various exotic quantum phases emerge, such as topological insulators, topological semimetals, and topological superconductors (TSCs).1–3 Particularly, topological superconductors have attracted immense attention because of the potential appearance of exotic quasiparticles called Majorana fermions and their application in topological quantum computing. A topological superconductor is characterized by a bulk superconducting gap and Majorana zero modes at the symmetry protected topological surface states (TSSs).3 The various proposed ways to realize a TSC include carrier doped topological insulator and superconductor–topological insulator heterostructures,4–6 which introduce the challenge of preparing high-quality samples and observing interfacial phenomena. Here, the bulk compounds having topological nontrivial band structure and superconductivity coexist intrinsically emerge as a promising route to realize topological superconductivity.
Bi-based materials are well known for the presence of TSSs.7–14 And Bi-based binary systems α-PdBi, α-PdBi2, and β-PdBi2 are among the promising candidates exhibiting bulk topological superconductivity. Notably, in α-PdBi2 and non-centrosymmetric α-PdBi, Rashba surface states near the Fermi level, EF, were theoretically predicted and experimentally verified via angle-resolved photoemission spectroscopy (ARPES) with intrinsic superconductivity.15–20 Moreover, the observed non-helical spin texture near EF for β-PdBi2 combined with the various reports of fully gapped multiband superconductivity in bulk suggests the possible presence of Majorana fermions at the surface states.21–25
Recently, PtBi2 has been shown to exhibit a large anisotropy for in-plane and inter-plane transport and stated as a bulk topological metal with pressure-induced superconductivity at 2.0 K.26,27 This indicates that the vast family of Bi compounds is associated with various aspects of nontrivial topological electronic states and this is accompanied by superconductivity, which demands a detailed investigation in the respective family. Furthermore, the spin–orbit coupling (SOC) strength affects the Fermi surface to capture the nontrivial band topology8,28 and also impacts the low-energy properties like superconductivity.29 Thus, the superconductivity with a high SOC strength and the possible nontrivial topological band structure may direct unconventionality in the superconducting ground state. As SOC is directly proportional to the fourth power of atomic number Z, introducing a heavier element will increase the SOC strength of the system.
We have synthesized single crystals of a new member of the Bi compound family, Bi2PdPt in this prospect. Powder XRD and Laue diffraction were performed to investigate the crystal structure and orientation. The superconducting and normal state properties of Bi2PdPt are studied using transport, magnetization and specific heat measurements. Type-II superconductivity in the moderate coupling limit is established in Bi2PdPt.
II. Experimental details
Single-crystals of Bi2PdPt were prepared by the modified Bridgman method. First, the polycrystalline sample was prepared using the solid state reaction method by taking a stoichiometric mixture of the required elemental powder Bi (99.99%), Pd (99.95%) and Pt (99.9%). Subsequently, the palletized form of the mixture was heated at 700 °C for four days in a vacuum-sealed tube, which was then transferred to a conical end quartz ampoule for single-crystal growth. The ampoule was kept at 700 °C for 12 h and slowly cooled to 650 °C at a rate of 0.4 °C h−1, followed by water quenching. The obtained single-crystals were extremely brittle with a metallic lustre. Mechanically cleaved single-crystals were used for all of the measurements. Powder X-ray diffraction (XRD) data for the ground single crystal were collected at room temperature using a PANalytical X'Pert powder diffractometer with Cu Kα (λ = 1.5406 Å) radiation. The Laue diffraction pattern was recorded using a Photonic–Science Laue camera system for single-crystal orientation and quality determination. Magnetic measurements were performed using a Superconducting Quantum Interference Device (SQUID) of the Quantum Design Magnetic Property Measurement System (MPMS-3). AC transport and specific heat measurements were performed using the two-τ relaxation method using a Quantum Design Physical Property Measurement System (PPMS) 9 T with an applied magnetic field parallel to the crystallographic [001] axis.
III. Results and discussion
a. Sample characterization
The Rietveld refinement of the powder X-ray diffraction pattern of Bi2PdPt was performed using the FullProf software (shown in Fig. 1).30 A small elemental impurity peak of Pt is observed, shown by an asterisk in Fig. 1. The refined pattern confirms the crystallization of Bi2PdPt in the NiAs hexagonal crystal structure having space group P63/mmc, which is in accordance with the literature31 and different from the structures reported for other superconducting compounds of the family, α-BiPd (non-centrosymmetric) and α-, β-PdBi2, and PtBi2 (layered structures).15,19,23,26
 |
| | Fig. 1 NiAs hexagonal crystal structure of Bi2PdPt is shown with solid orange balls as Bi atoms and half green or grey solid balls as Pd/Pt atoms. (a) Side view of the crystal structure and (b) top view of the crystal structure. (c) Rietveld refined pattern, represented by black lines, of XRD recorded at room temperature (open orange circles) for Bi2PdPt. The inset shows the Laue diffraction pattern of the single-crystal. | |
The structure of Bi2PdPt consists of Bi atoms that lie inside the hexagonal geometry while Pd and Pt atoms share the edge sites with equal probability, as shown in Fig. 1(a) and (b). Detailed refinement results with the associated Wyckoff position of each atom are summarized in Table 1. The Laue diffraction pattern of different crystals of the same batch depicts the orientation of the crystal along the [001] direction, and bright spots reveal the quality of the single-crystal, as shown in the inset of Fig. 1(c).
Table 1 Structure parameters of Bi2PdPt obtained from the Rietveld refinement of XRD
| Structure |
Hexagonal |
| Space group |
P63/mmc |
| Lattice parameters |
|
a = b(Å) |
4.294(5) |
|
c (Å) |
5.567(1) |
| Atom |
Wyckoff position |
x
|
y
|
z
|
Occupancy |
| Bi |
2c |
0.333 |
0.666 |
0.250 |
1.0008 |
| Pd |
2a |
0 |
0 |
0 |
0.5017 |
| Pt |
2a |
0 |
0 |
0 |
0.4877 |
b. Superconducting and normal state properties
The in-plane AC resistivity at zero magnetic field in the temperature range of 1.9 K to 250 K was measured for the single-crystal of Bi2PdPt, as shown in Fig. 2. A sharp resistivity drop from the normal state resistivity at TC,onset = 4.0(1) K with a width of 0.1 K is recorded as a superconducting transition. Above the transition temperature, the resistivity behaviour of Bi2PdPt shows a slight deviation from the linear behaviour, which is described by Wilson's theory.32 However, the high value of the absolute resistivity with a saturated trend is consistent with those of α-BiPd and other A15 compounds where the parallel resistor model is implanted.33 Hence, the resistivity behaviour of Bi2PdPt is characterized using the parallel resistor model described by Wisemann as34| |  | (1) |
where ρs is the saturated resistivity independent of the temperature and ρi (T) is the ideal contribution consisting of two terms which are expressed as| |  | (2) |
here, the first term ρi,0 is the temperature-independent residual resistivity, and the second term represents the temperature dependent contribution including the effect of electron–phonon scattering stated by the generalized Bloch–Grüneisen expression.32,35ΘR is the Debye temperature from the resistivity measurement and C is a material-dependent quantity. The best fitting of Bi2PdPt for n = 3 yield Debye temperature ΘR = 123(3) K, C = 5.70(2) μΩ cm, ρs = 47(3) μΩ cm and ρi,0 = 3.32(1) μΩ cm. The estimated residual resistivity ratio, ρ (250 K)/ρ (5 K) = 2.5, is much smaller than the reported values for the other Bi–Pd compounds, which can be possibly due to the increase in the disorder of the system due to the presence of Pt.33,36
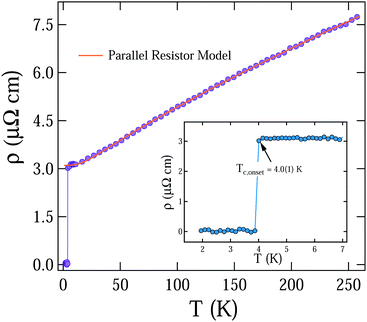 |
| | Fig. 2 Temperature dependence of resistivity in the zero field fitted above the transition temperature is shown in the main panel. The inset shows the limited temperature region presenting the superconducting transition at TC,onset = 4.0(1) K. | |
Magnetization versus temperature measurement under 1 mT magnetic field in zero field cooled warming (ZFCW) and field cooled cooling (FCC) modes is shown in Fig. 3(a). The curve shows a diamagnetic onset at temperature, TC = 3.98(1) K perpendicular to the crystallographic axis [001] of single-crystal Bi2PdPt. The poor overlap of ZFCW and FCC curves depicts the presence of strong pinning centres in the sample, and a superconducting volume fraction close to 96% from ZFCW curve certain the bulk superconducting property. The AC susceptibility results also depict the transition temperature to be 3.99(2) K in a similar magnetic field (shown in inset of Fig. 3(a)). A magnetization hysteresis loop under an applied magnetic field of ± 1 T at a temperature of 1.8 K is shown in Fig. 3(b). The loop represents the conventional type-II superconductor behaviour along with an irreversible nature of magnetization up to Hirr = 0.45 T, above which unpinning of the vortices starts.
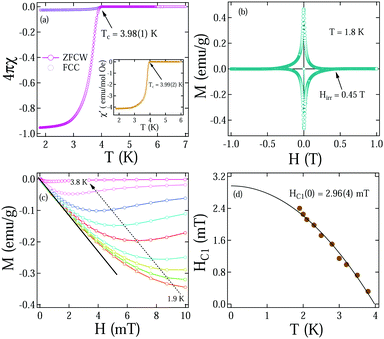 |
| | Fig. 3 (a) Superconducting transition in a 1 mT magnetic field at TC = 3.98(1) K and the inset shows the AC susceptibility curve with the same transition temperature. (b) Magnetization hysteresis loop at 1.8 K. (c) Magnetic moment variation under a magnetic field at different temperatures up to the transition temperature. (d) The lower critical field with temperature is fitted using the GL eqn (4). | |
Furthermore, to estimate the lower critical field value HC1, the magnetization variation in the applied magnetic field at different isotherms up to the transition temperature TC were analyzed. HC1 for each isotherm is considered as a magnetic field value where the curve starts to deviate from the linear Meissner state, as shown in Fig. 3(c). The temperature evolution of the lower critical field is fitted with the Ginzburg–Landau (GL) equation
| |  | (3) |
which gives
HC1(0) = 2.96(4) mT for
TC = 3.98(1) K (
Fig. 3(d)). The upper critical field,
HC2, is evaluated by the observed shifts in the superconducting transition temperature with increasing applied magnetic field. The change in the transition temperature
TC is marked from magnetization at onset and for resistivity measurements at 90% drop from the normal state resistivity value (
TC,90%), as shown in the inset of
Fig. 4. The upper critical field,
HC2(0), is estimated from the expression
| |  | (4) |
Here
t =
T/
TC is the reduced temperature. The fitted data yield
HC2,M(0) = 0.92(1) T and
HC2,ρ(0) = 1.08(1) T from magnetization and resistivity measurements, respectively, as displayed in
Fig. 4.
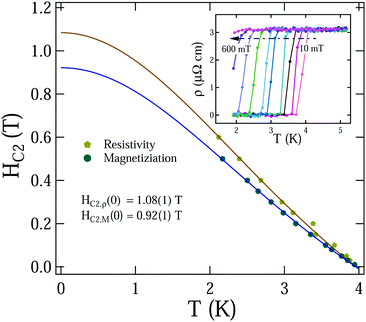 |
| | Fig. 4 The upper critical field variation with temperature (determined via magnetization and resistivity measurements) fitted using eqn (4) is shown. The inset shows the resistivity drop temperature variation with an applied magnetic field. | |
In addition to the resistivity and magnetization measurements, the specific heat is also measured for Bi2PdPt at zero field and 2 T (well above the upper critical field) under temperature variation, as shown in Fig. 5. A small anomaly in 0 T specific heat measurement is observed around 3.93(7) K, as shown in the inset of Fig. 5, which is consistent with the observed superconducting transition temperature from the resistivity and magnetization measurements. The measurement recorded at 2 T presents the normal state of Bi2PdPt. The normal state specific data are fitted using the Debye relationship
where
γn is the Sommerfeld coefficient corresponding to electronic contribution,
β3 is the Debye constant representing the phononic contribution, and
β5 includes the anharmonic contribution to the specific heat. The fitted data produce
γn = 5.1(6) mJ mol
−1 K
−2,
β3 = 1.72(6) mJ mol
−1 K
−4 and
β5 = 11.2(1) μJ mol
−1 K
−6 (
Fig. 5). The Sommerfeld coefficient value of Bi
2PdPt matches well with the reported value of α-PdBi, but a large deviation from α- and β-PdBi
2 is observed.
33,36,37 According to free electron theory, the Sommerfeld coefficient is used to evaluate the density of state at the Fermi level as per the relationship

, where
kB = 1.38 × 10
−23 J K
−1 is the Boltzmann constant.
DC(
EF) is calculated to be 2.1(2) states eV
−1 f.u.
−1. Furthermore, considering the Debye model, the Debye temperature
ΘD is estimated to be 165(2) K for
β3 = 1.72(6) mJ mol
−1 K
−4 using the expression

, where
R = 8.314 J mol
−1 K
−1 is a gas constant. The calculated Debye temperature value is consistent with the value obtained using the parallel resistor model. The average electron–phonon coupling constant,
λe−ph is also calculated by implanting McMillan's theory given as
38| |  | (6) |
where
μ* varies in the range of 0.1 ≤
μ* ≤ 0.15, a material-specific value accounting for the screened Coulomb repulsion. Considering
TC = 3.93(7) K,
θD = 165(2) K and
μ* = 0.1 (as speculated for Bi–Pd binary compounds)
λe−ph = 0.64(1) is obtained, which puts Bi
2PdPt in the moderately coupled superconductor regime respective to other Bi–Pd compounds α-, β-PdBi
2, and α-PdBi.
33,37
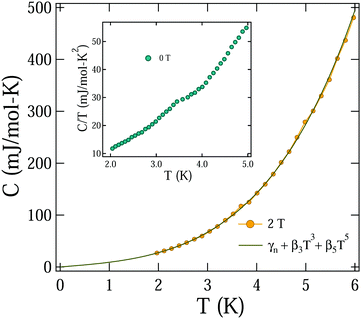 |
| | Fig. 5 Temperature dependence specific heat of Bi2PdPt represented in the C vs. T form at a 2 T magnetic field is fitted with eqn (5). The inset presents the C vs. T curve at a zero magnetic field where an anomaly is clearly observed. | |
c. Superconducting parameters and Uemura plot
The external applied magnetic field imposes a limiting field on the superconductor, portrayed independently by the spin paramagnetic and orbital limiting effects. According to the BCS theory, the spin paramagnetic effect comes from pair breaking due to the Zeeman effect defined as the Pauli limiting field, HPC2(0) = 1.86 TC.39,40 For Bi2PdPt with TC = 3.98(1) K, HPC2(0) = 7.40(2) T is yielded. Whereas, the orbital limit for an upper critical field refers to the critical field where vortex cores begin to overlap. The orbital limiting field is given by the Werthamer–Helfand–Hohenberg (WHH) expression41,42| |  | (7) |
where α = 0.69 for the dirty limit and 0.73 for the clean limit superconductors. The initial slope  at T = TC is estimated to be 0.23(1) T/K which gives HorbitalC2 (0) = 0.64(1) T considering the dirty limit. Furthermore, the relative strength of Pauli and the orbital limiting field is measured from the Maki parameter defined using the relationship
  , which evaluates αM = 0.12(2).43 The small value of the Maki parameter indicates negligible effect of the Pauli limiting field for Bi2PdPt.
Furthermore, the fundamental superconducting length parameters are calculated from the upper, HC2(0), and lower, HC1(0), critical field values. The Ginzburg–Landau coherence length (ξGL(0)) is estimated from  ,44 where Φ0 = 2.07 × 10⁻¹⁵ T m2 is the magnetic flux quantum. Using HC2,M(0) = 0.92(1) T, ξGL(0) is evaluated as 190(1) Å. The equation45
| |  | (8) |
provides the Ginzburg–Landau penetration depth,
λGL(0) = 4231(76) Å, for
HC1(0) = 2.96(4) mT and
ξGL(0) = 190(1) Å. Moreover, the ratio

gives the Ginzburg–Landau parameter,
κGL = 22.2(5), which is much higher than

, indicating a strong type-II superconductivity in Bi
2PdPt. The thermodynamic critical field,
HC, is evaluated using the expression:
45HC1(0)
HC2(0) =
HC2![[thin space (1/6-em)]](https://www.rsc.org/images/entities/char_2009.gif)
ln
![[thin space (1/6-em)]](https://www.rsc.org/images/entities/char_2009.gif) κGL
κGL, yielding
HC = 29(1) mT.
For Bi2PdPt, to determine the rest of the superconducting parameters including the London penetration depth, λL, and the electronic mean free path, le, and to verify the dirty limit superconductivity, a set of equations is used assuming the spherical Fermi surface. The electronic mean free path, le, is estimated from the quasiparticle number density, n, and Sommerfeld coefficient, γn. The quasiparticle number density of Bi2PdPt has been extracted from the Hall measurement, n = 2.45(2) × 1028 m−3 (more details are provided in the Appendix). The Fermi vector, kF, is evaluated using kF = (3π2n)1/3, which gives kF = 0.90(1) Å−1. The effective mass, m*, is calculated from the Sommerfeld coefficient via relation, m* = (ħkF)2γn/π2nkB2, where kB is the Boltzmann constant, γn = 95.51 J m−3 K−2 and m* = 2.0(3) me. According to the Drude model,44 the Fermi velocity is determined from the relationship vF = ħkF/m* = 5.1(7) × 105 m s−1 and scattering time is determined from τ−1 = ne2ρ0/m*, which was further used to calculate the electronic mean free path, le = vFτ, providing le = 455(68) Å.
In consideration of BCS theory, the coherence length ξ0 is defined as 0.18ħvF/kBTC providing ξ0 = 1756(147) Å. A ξ0/le ratio of 3.9 is greater than 1, implying that Bi2PdPt is a dirty limit superconductor. Furthermore, in the dirty limit, the London penetration depth, λL,46 is written as
| |  | (9) |
From the above expression the estimated λL is 483(36) Å. The order of calculated parameters matches well with β-PdBi2 where the dirty limit superconductivity is observed24 whereas α-PdBi lies in the clean type-II superconducting limit.33
Moreover, to classify Bi2PdPt in the context of other superconductors, the Uemura plot47 of TC with the effective Fermi temperature, TF, has been plotted, which is used to define the unconventionality characteristics of a superconductor based on the  ratio. For the 3D spherical Fermi surface, the Fermi temperature is calculated using48
| |  | (10) |
where
n is the quasiparticle number density per unit volume, and
m* is the effective mass of quasiparticles. The
TF value is estimated to be
TF = 17576 (104) K, considering the respective values of the parameters from
Table 2. The ratio

places this material, Bi
2PdPt, close to the other family member, β-PdBi
2, and outside the band of the unconventional superconductor which includes iron based superconductors, cuprates and Chevrel phase.
49,50 Conventional superconductors are considered to be on the right-hand side of the Uemura plot. Bi
2PdPt with the other member of the Bi–Pd compound family, β-PdBi
2,
24 is shown by the solid green symbol in
Fig. 6.
Table 2 Parameters in the superconducting and normal states of Bi2PdPt and α-BiPd
| Parameters |
Unit |
Bi2PdPt |
α-BiPd33 |
|
T
C
|
K |
4.0 |
3.8 |
|
H
C1 (0) |
mT |
2.96 |
12.0 |
|
H
C2,M (0) |
T |
0.92 |
0.8 |
|
H
PC2 (0) |
T |
7.40 |
7.07 |
|
H
OrbitalC2 (0) |
T |
0.64 |
|
|
ξ
GL (0) |
Å |
190 |
170 |
|
λ
GL (0) |
Å |
4231 |
1792 |
|
k
GL
|
|
22.2 |
7.6 |
|
γ
n
|
mJ mol−1 K−2 |
5.1 |
4.0 |
|
θ
D
|
K |
165.0 |
169.0 |
|
ξ
0/le |
|
3.9 |
0.01 |
|
v
F
|
105 m s−1 |
5.1 |
|
|
n
|
1028 m−3 |
2.45 |
|
|
T
F
|
K |
17576 |
|
|
m*/me |
|
2.0 |
|
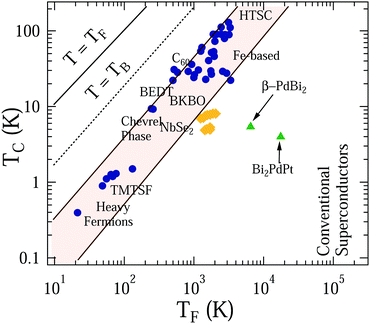 |
| | Fig. 6 Uemura plot showing the superconducting transition temperature TCvs. the effective Fermi temperature TF for Bi2PdPt with β-PdBi2, shown as solid green triangles. Other data points represent the different families of superconductors together with the shaded region representing the families of unconventional superconductors. The dashed line corresponds to the Bose–Einstein condensation temperature TB. | |
Among the Bi–Pd compound family, Bi2PdPt is a possible high SOC candidate, based on the presence of heavy constituent elements establishing a strong foundation to exhibit intriguing properties. The different crystal structure NiAs type of Bi2PdPt eliminates all the possibilities of the presence of any secondary superconducting phase of the Bi–Pd/Pt compound, implementing intrinsic bulk superconductivity. The recorded superconducting transition temperature of 4.0 K for Bi2PdPt is close to that for α-BiPd though both have different crystal structures. Furthermore, the Hall measurement (see the Appendix) suggests dominated hole charge carriers (1028 m−3) the same as for other Bi–Pd compounds, which indicate negligible effect of Pt on the electronic states. The specific heat of Bi2 PdPt gives a Sommerfeld coefficient of 5.1(6) mJ mol−1 K−2, which is slightly higher than what is reported for α-BiPd (4.0 mJ mol−1 K−2), suggesting only a minimal increase in the density of states at EF. However, the observed value is comparable to those of β-PdBi2 and Pt1.26Bi2.51 Concluding that neither substitution at the Pd site nor increasing the Bi concentration predominately affects the density of states in Bi–Pd/Pt compounds. Despite the presence of a heavy 5d Pt element, no change in phonon frequency, extracted from the Debye temperature, is noted between Bi2PdPt and α-BiPd.33
Moreover, the present bulk measurement of Bi2PdPt is not sufficient to establish the gap symmetry of the sample. The possible explanation for a low specific jump value can be due to multiband superconductivity with a single superconducting gap.52 Also, layered transition-metal dichalcogenide superconductors are well known to exhibit no anomaly in specific heat measurement.53 In addition, the low value of specific heat jump or no jump at all has been observed in many Bi-based half-Heusler alloys (RPdBi), where superconductivity is attributed to surface states.54 Furthermore, the similar behaviour is determined in the case of strongly or locally disordered systems such as quasi-skutterudites.55
No deviation or anisotropy has been observed in the upper critical field of Bi2PdPt, directing toward the bulk nature of the superconducting state and the absence of multigap superconductivity. Apart from this, the variation of the superconducting volume fraction with the different cooling procedures of sample preparation showed the disorder effect in the sample (details are provided in the Appendix). To fully understand the effect of increased SOC strength, the possible reason for the low value of the specific heat jump and the presence of the nontrivial band structure in Bi2PdPt detailed theoretical and experimental analyses of the superconducting ground state with band topology are required.
IV. Conclusions
In summary, we synthesized single-crystal Bi2PdPt and transport, magnetization, and specific heat measurements were performed for the detailed analysis of superconducting properties. The superconducting transition of Bi2PdPt has been recorded at 4.0(1) K with upper and lower critical field values, HC1(0) = 2.96(4) mT and HC2,M(0) = 0.92(1) T, fitted using the Ginzburg–Landau equation. An anomaly is observed around the transition temperature in specific heat measurement, confirming the bulk superconductivity. The comparison of various normal and superconducting state parameters of Bi2 PdPt and α-BiPd is summarized in Table 2. Bi2PdPt is classified as a moderately coupled type-II dirty limit superconductor. The estimated value of the Fermi temperature TF places Bi2PdPt close to the other member of the family, β-PdBi2 in the Uemura plot. Further microscopy measurements such as muon spectroscopy, scanning tunneling microscopy (STM) and angle-resolved photoemission spectroscopy (ARPES) are required to understand the superconducting ground state and the possible topological nature of Bi2PdPt.
Conflicts of interest
The authors declare no conflicts of interest.
Appendix
a. Characterization
The superconducting volume fraction in Bi2PdPt is highly dependent on the sample cooling procedure during preparation. Three different samples were made such as S1 cooled at 1.0 °C h−1, S2 cooled at 0.5 °C h−1, and S3 cooled at 0.4 °C h−1 while preparing the sample. XRD patterns of the two samples S2 and S3 are shown in Fig. 7(a). The results of the magnetic characterization of S1 and S2 are presented in Fig. 7(b). The observed superconducting transition temperature is the same for all three samples; however, the superconducting shielding fraction 96% is the maximum for S3. S2 only shows 60% volume fraction with less than 10% fraction observed in S1, implying that samples cooled only at a specific rate show a large volume fraction with the same diamagnetic onset temperature in magnetization measurement. This variation of superconducting fraction reflects the effect on grain boundaries, disorder and point defects of samples due to different cooling procedures.56 The energy dispersive spectroscopy (EDS) analysis for Bi2PdPt is summarised in Table 3, stating the nominal composition within the error limit, and the corresponding spectra is also shown in the inset of Fig. 8.
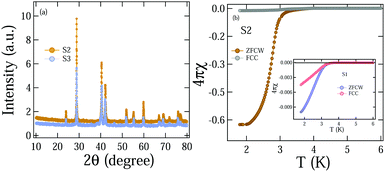 |
| | Fig. 7 (a) XRD comparison of the powder sample having two different cooling rates of 0.5 °C h−1 (S2) and 0.4 °C h−1 (S3) during preparation. (b) Magnetic measurement compilation of S2 and S1 in the inset, whereas S3 is shown in Fig. 3(a). | |
Table 3 Elemental concentration obtained from the EDS measurements at 3 different positions
| Elements |
Bi |
Pt |
Pd |
| Atm% |
| Scan 1 |
45.9 |
24.0 |
30.1 |
| Scan 2 |
44.6 |
26.5 |
28.9 |
| Scan 3 |
46.5 |
24.1 |
29.4 |
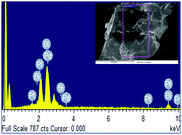 |
| | Fig. 8 EDS pattern of the Bi2PdPt sample with the SEM image in the inset. | |
b. Normal state properties
To perceive the normal state properties of Bi2PdPt, magnetoresistance (MR) and normal Hall effects were also measured. Hall measurements were performed on Bi2PdPt under a varying magnetic field of ±9 T at 30 K to extract the carrier density as shown in the left panel of Fig. 9(a), where a linear variation with the magnetic field represents the small contribution of the longitudinal resistivity. The Hall coefficient, RH, was determined by the slope of the variation ρxy with both +H and −H fields. The estimated RH is 2.52(2) × 10−4 cm3 C−1, and the positive sign indicates the hole as the dominant charge carrier in the sample. By simply using the single band expression n = 1/RHq, the electron concentrations were calculated, n = 2.45(2) × 1028 m−3. The carrier density order matches well with those reported for α-PdBi and PdBi2.57 MR was measured in the longitudinal configuration under a varying magnetic field of 9 T at different temperatures. The magnetic field dependence MR is defined as  . A significant small MR value is observed in our sample Fig. 9(b).
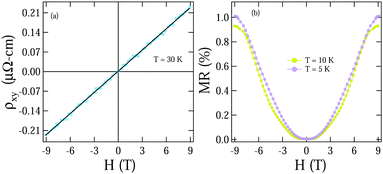 |
| | Fig. 9 (a) Hall resistivity at T = 30 K under a field variation of ±9 T. (b) MR data taken at T = 5 K and T = 10 K on the Bi2 PdPt crystal. | |
Acknowledgements
A. Kataria acknowledges the funding agency Council of Scientific and Industrial Research (CSIR), Government of India, for providing the SRF fellowship (Award No: 09/1020(0172)/2019-EMR-I). R. P. S. acknowledges the Science and Engineering Research Board, Government of India, for the Core Research Grant CRG/2019/001028.
References
- A. P. Schnyder, S. Ryu, A. Furusaki and A. W.-W. Ludwig, Phys. Rev. B: Condens. Matter Mater. Phys., 2008, 78, 195125 CrossRef.
- X. L. Qi, T. L. Hughes, S. Raghu and S. C. Zhang, Phys. Rev. Lett., 2009, 102, 187001 CrossRef PubMed.
- X. L. Qi and S. C. Zhang, Rev. Mod. Phys., 2011, 83, 1057 CrossRef CAS.
- M. Sato and Y. Ando, Rep. Prog. Phys., 2017, 80, 076501 CrossRef PubMed.
- L. Fu and C. L. Kane, Phys. Rev. Lett., 2008, 100, 096407 CrossRef PubMed.
- A. Yu. Kitaev, Phys.-Usp., 2001, 44, 131 CrossRef.
- L. Fu and C. L. Kane, Phys. Rev. B: Condens. Matter Mater. Phys., 2007, 76, 045302 CrossRef.
- H. Zhang, C. X. Liu, X. L. Qi, X. Dai, Z. Fang and S. C. Zhang, Nat. Phys., 2009, 5, 438 Search PubMed.
- T. Sato, K. Segawa, H. Guo, K. Sugawara, S. Souma, T. Takahashi and Y. Ando, Phys. Rev. Lett., 2010, 105, 136802 CrossRef PubMed.
- K. Kuroda, M. Ye, A. Kimura, S. V. Eremeev, E. E. Krasovskii, E. V. Chulkov, Y. Ueda, K. Miyamoto, T. Okuda, K. Shimada, H. Namatame and M. Taniguchi, Phys. Rev. Lett., 2010, 105, 146801 CrossRef CAS PubMed.
- Y. L. Chen, Z. K. Liu, J. G. Analytis, J.-H. Chu, H. J. Zhang, B. H. Yan, S.-K. Mo, R. G. Moore, D. H. Lu, I. R. Fisher, S. C. Zhang, Z. Hussain and Z.-X. Shen, Phys. Rev. Lett., 2010, 105, 266401 CrossRef CAS PubMed.
- S. Souma, K. Eto, M. Nomura, K. Nakayama, T. Sato, T. Takahashi, K. Segawa and Y. Ando, Phys. Rev. Lett., 2012, 108, 116801 CrossRef CAS PubMed.
- K. Kuroda, H. Miyahara, M. Ye, S. V. Eremeev, Yu.-M. Koroteev, E. E. Krasovskii, E. V. Chulkov, S. Hiramoto, C. Moriyoshi, Y. Kuroiwa, K. Miyamoto, T. Okuda, M. Arita, K. Shimada, H. Namatame, M. Taniguchi, Y. Ueda and A. Kimura, Phys. Rev. Lett., 2012, 108, 206803 CrossRef CAS PubMed.
- Y. Nakajima, R. Hu, K. Kirshenbaum, A. Hughes, P. Syers, X. Wang and J. Paglione, Sci. Adv., 2015, 1, e1500242 CrossRef PubMed.
- Y. Zhou, X. Chen, C. An, Y. Zhou, L. Ling, J. Yang, C. Chen, L. Zhang, M. Tian, Z. Zhang and Z. Yang, Phys. Rev. B: Condens. Matter Mater. Phys., 2019, 99, 054501 CrossRef.
- S. Mitra, K. Okawa, S. K. Sudheesh, T. Sasagawa, J.-X. Zhu and E. E.-M. Chia, Phys. Rev. B: Condens. Matter Mater. Phys., 2017, 95, 134519 CrossRef.
- K. Dimitri, M. M. Hosen, G. Dhakal, H. Choi, F. Kabir, C. Sims, D. Kaczorowski, T. Durakiewicz, J. X. Zhu and M. Neupane, Phys. Rev. B: Condens. Matter Mater. Phys., 2018, 97, 144514 CrossRef CAS.
- H. Choi, M. Neupane, T. Sasagawa, E. E.-M. Chia and J. X. Zhu, Phys. Rev. Mater., 2017, 1, 034201 CrossRef.
- Z. Sun, M. Enayat, A. Maldonado, C. Lithgow, E. Yelland, D. Peets, D. C. Peets, A. Yaresko, A. P. Schnyder and P. Wahl, Nat. Commun., 2015, 6, 1 Search PubMed.
- A. Yaresko, A. P. Schnyder, H. M. Benia, C. M. Yim, G. Levy, A. Damascelli, C. R. Ast, D. C. Peets and P. Wahl, Phys. Rev. B: Condens. Matter Mater. Phys., 2018, 97, 075108 CrossRef CAS.
- M. Sakano, K. Okawa, M. Kanou, H. Sanjo, T. Okuda, T. Sasagawa and K. Ishizaka, Nat. Commun., 2015, 6, 8595 CrossRef CAS PubMed.
- T. Xu, B. T. Wang, M. Wang, Q. Jiang, X. P. Shen, B. Gao, M. Ye and S. Qiao, Phys. Rev. B: Condens. Matter Mater. Phys., 2019, 100, 161109(R) CrossRef.
- J. Kacmarcik, Z. Pribulova, T. Samuely, P. Szabo, V. Cambel, J. Soltys, E. Herrera, H. Suderow, A. Correa-Orellana, D. Prabhakaran and P. Samuely, Phys. Rev. B: Condens. Matter Mater. Phys., 2016, 93, 144502 CrossRef.
- P. K. Biswas, D. G. Mazzone, R. Sibille, E. Pomjakushina, K. Conder, H. Luetkens, C. Baines, J. L. Gavilano, M. Kenzelmann, A. Amato and E. Morenzoni, Phys. Rev. B: Condens. Matter Mater. Phys., 2016, 93, 220504(R) CrossRef.
- E. Herrera, I. Guillamon, J. A. Galvis, A. Correa, A. Fente, R. F. Luccas, F. J. Mompean, M. Garcia-Hernandez, S. Vieira, J. P. Brison and H. Suderow, Phys. Rev. B: Condens. Matter Mater. Phys., 2015, 92, 054507 CrossRef.
- C. Q. Xu, X. Z. Xing, X. Xu, B. Li, B. Chen, L. Q. Che, X. Lu, J. Dai and Z. X. Shi, Phys. Rev. B: Condens. Matter Mater. Phys., 2016, 94, 165119 CrossRef.
- J. Wang, X. Chen, Y. Zhou, C. An, Y. Zhou, C. Gu, M. Tian and Z. Yang, Phys. Rev. B: Condens. Matter Mater. Phys., 2021, 103, 014507 CrossRef CAS.
- M. Z. Hasan and C. L. Kane, Rev. Mod. Phys., 2010, 82(4), 3045 CrossRef CAS.
- D. F. Shao, X. Luo, W. J. Lu, L. Hu, X. D. Zhu, W. H. Song, X. B. Zhu and Y. P. Sun, Sci. Rep., 2016, 6, 1 CrossRef PubMed.
- J. Rodríguez-Carvajal, Phys. B, 1993, 192, 55 CrossRef.
- N. N. Zhuravlev, G. S. Zhdanov and Y. M. Smirnova, Phys. Met. Metallogr., 1962, 13, 55 Search PubMed.
-
A. H. Wilson, Theory of Metals, Cambridge University Press, Cambridge, England, 1958 Search PubMed.
- B. Joshi, A. Thamizhavel and S. Ramakrishnan, Phys. Rev. B: Condens. Matter Mater. Phys., 2011, 84, 064518 CrossRef.
- H. Wiesmann, M. Gurvitch, H. Lutz, A. K. Ghosh, B. Schwarz, M. Strongin, P. B. Allen and J. W. Halley, Phys.
Rev. Lett., 1977, 38, 782 CrossRef CAS.
-
G. Grimvall, The Electron–Phonon Interaction in Metals, North-Holland, Amsterdam, 1981 Search PubMed.
- Y. Imai, F. Nabeshima, T. Yoshinaka, K. Miyatani, R. Kondo, S. Komiya, I. Tsukada and A. Maeda, J. Phys. Soc. Jpn., 2012, 81, 113708 CrossRef.
- G. Pristas, Mat Orendac, S. Gabani, J. Kacmarcik, E. Gazo, Z. Pribulova, A. Correa-Orellana, E. Herrera, H. Suderow and P. Samuely, Phys. Rev. B: Condens. Matter Mater. Phys., 2018, 97, 134505 CrossRef CAS.
- W. L. McMillan, Phys. Rev., 1968, 167, 331 CrossRef CAS.
- B. S. Chandrasekhar, Appl. Phys. Lett., 1962, 1, 7 CrossRef CAS.
- A. M. Clogston, Phys. Rev. Lett., 1962, 9, 266 CrossRef.
- E. Helfand and N. R. Werthamer, Phys. Rev., 1966, 147, 288 CrossRef CAS.
- N. R. Werthamer, E. Helfand and P. C. Hohenberg, Phys. Rev., 1966, 147, 295 CrossRef CAS.
- K. Maki, Phys. Rev. B: Condens. Matter Mater. Phys., 1966, 148, 362 CrossRef CAS.
-
M. Tinkham, Introduction to Superconductivity, McGraw-Hill, New York, 2nd edn, 1996 Search PubMed.
- T. Klimczuk, F. Ronning, V. Sidorov, R. J. Cava and J. D. Thompson, Phys. Rev. Lett., 2007, 99, 257004 CrossRef CAS PubMed.
- D. A. Mayoh, J. A.-T. Barker, R. P. Singh, G. Balakrishnan, D. Mc. K. Paul and M. R. Lees, Phys. Rev. B: Condens. Matter Mater. Phys., 2017, 96, 064521 CrossRef.
- Y. J. Uemura, G. M. Luke, B. J. Sternlieb, J. H. Brewer, J. F. Carolan, W. N. Hardy, R. Kadono, J. R. Kempton, R. F. Kiefl, S. R. Kreitzman, P. Mulhern, T. M. Riseman, D. L. Williams, B. X. Yang, S. Uchida, H. Takagi, J. Gopalakrishnan, A. W. Sleight, M. A. Subramanian, C. L. Chien, M. Z. Cieplak, G. Xiao, V. Y. Lee, B. W. Statt, C. E. Stronach, W. J. Kossler and X. H. Yu, Phys. Rev. Lett., 1989, 62, 2317 CrossRef CAS PubMed.
- A. D. Hillier and R. Cywinski, Appl. Magn. Reson., 1997, 13, 95 CrossRef CAS.
- K. Hashimoto, K. Cho, T. Shibauchi, S. Kasahara, Y. Mizukami, R. Katsumata, Y. Tsuruhara, T. Terashima, H. Ikeda, M. A. Tanatar, H. Kitano, N. Salovich, R. W. Giannetta, P. Walmsley, A. Carrington, R. Prozorov and Y. Matsuda, Science, 2012, 336, 1554 CrossRef CAS PubMed.
- R. Khasanov, H. Luetkens, A. Amato, H. H. Klauss, Z. A. Ren, J. Yang, W. Lu and Z. X. Zhao, Phys. Rev. B: Condens. Matter Mater. Phys., 2008, 78, 092506 CrossRef.
- K. Kudo, H. Y. Nguyen, C. Oh, K. Takaki and M. Nohara, J. Phys. Soc. Jpn., 2021, 90, 063706 CrossRef.
- E. Herrera, I. Guillamon, J. A. Galvis, A. Correa, A. Fente, R. F. Luccas, F. J. Mompean, M. Garcia-Hernandez, S. Vieira, J. P. Brison and H. Suderow, Phys. Rev. B: Condens. Matter Mater. Phys., 2015, 92, 054507 CrossRef.
- M. Mandal and R. P. Singh, J. Phys.: Condens. Matter, 2021, 33, 135602 CrossRef CAS PubMed.
- P. Orest, D. Kaczorowski and P. Wisniewski, Sci. Rep., 2015, 5, 1 Search PubMed.
- A. Slebarski, M. M. Maska, M. Fijalkowski, C. A. McElroy and M. B. Maple, J. Alloys Compd., 2015, 646, 866 CrossRef CAS.
- W. Liu, S. Li, H. Wu, N. Dhale, P. Koirala and B. Lv, Phys. Rev. Mater., 2021, 5, 014802 CrossRef CAS.
- K. Zhao, B. Lv, Y. Y. Xue, X. Y. Zhu, L. Z. Deng, Z. Wu and C. W. Chu, Phys. Rev. B: Condens. Matter Mater. Phys., 2015, 92, 174404 CrossRef.
|
| This journal is © The Royal Society of Chemistry 2022 |
Click here to see how this site uses Cookies. View our privacy policy here.  Open Access Article
 and
R. P.
Singh
 *
*


 , where kB = 1.38 × 10⁻²³ J K−1 is the Boltzmann constant. DC(EF) is calculated to be 2.1(2) states eV−1 f.u.−1. Furthermore, considering the Debye model, the Debye temperature ΘD is estimated to be 165(2) K for β3 = 1.72(6) mJ mol−1 K−4 using the expression
  , where R = 8.314 J mol−1 K−1 is a gas constant. The calculated Debye temperature value is consistent with the value obtained using the parallel resistor model. The average electron–phonon coupling constant, λe−ph is also calculated by implanting McMillan's theory given as38


 at T = TC is estimated to be 0.23(1) T/K which gives HorbitalC2 (0) = 0.64(1) T considering the dirty limit. Furthermore, the relative strength of Pauli and the orbital limiting field is measured from the Maki parameter defined using the relationship
  , which evaluates αM = 0.12(2).43 The small value of the Maki parameter indicates negligible effect of the Pauli limiting field for Bi2PdPt.
 ,44 where Φ0 = 2.07 × 10⁻¹⁵ T m2 is the magnetic flux quantum. Using HC2,M(0) = 0.92(1) T, ξGL(0) is evaluated as 190(1) Å. The equation45
 gives the Ginzburg–Landau parameter, κGL = 22.2(5), which is much higher than
  , indicating a strong type-II superconductivity in Bi2PdPt. The thermodynamic critical field, HC, is evaluated using the expression:45HC1(0) HC2(0) = HC2
![[thin space (1/6-em)]](https://www.rsc.org/images/entities/char_2009.gif) ln
ln![[thin space (1/6-em)]](https://www.rsc.org/images/entities/char_2009.gif) κGL, yielding HC = 29(1) mT.
κGL, yielding HC = 29(1) mT.

 ratio. For the 3D spherical Fermi surface, the Fermi temperature is calculated using48
 places this material, Bi2PdPt, close to the other family member, β-PdBi2, and outside the band of the unconventional superconductor which includes iron based superconductors, cuprates and Chevrel phase.49,50 Conventional superconductors are considered to be on the right-hand side of the Uemura plot. Bi2PdPt with the other member of the Bi–Pd compound family, β-PdBi2,24 is shown by the solid green symbol in Fig. 6.

 . A significant small MR value is observed in our sample Fig. 9(b).


