 Open Access Article
MOF@PVA beads for dynamic and low concentration VOC capture†
Pamela Berilyn
So
 a,
Chen-Yu
Liu
a,
Yu-Lun
Lai
b,
Cheng-Shiuan
Lee
b and
Chia-Her
Lin
a,
Chen-Yu
Liu
a,
Yu-Lun
Lai
b,
Cheng-Shiuan
Lee
b and
Chia-Her
Lin
 *a
*a
aDepartment of Chemistry, National Taiwan Normal University, Taipei 11677, Taiwan. E-mail: chiaher@ntnu.edu.tw
bGreen Energy and Environment Research Laboratories, Industrial Technology Research Institute, Hsinchu 31040, Taiwan
First published on 21st June 2022
Abstract
This work explores the capacity of metal–organic framework (MOF)–polyvinyl alcohol (PVA) composites (MOF@PVA beads) in volatile organic compound (VOC) adsorption. The selected MOFs include HKUST-1, MIL-68, ZIF-8, A520, ZIF-67, and CAU-10, wherein the MOFs were optimized to be synthesized on a larger scale of production. Various proportions of the MOF@PVA bead composites were prepared to evaluate the optimal ratio to yield the best adsorption capacity. Most of the prepared MOF@PVA beads exhibited a higher VOC adsorption capacity as compared to commercially available activated carbon and zeolite adsorbents, proving the universality of the method of preparation. Among the composites, the MIL-68@PVA beads exhibited the best static VOC adsorption, while HKUST-1@PVA beads exhibited the best dynamic low concentration (200 ppm) toluene adsorption capacity.
Introduction
Metal–organic frameworks (MOF)1 are porous materials designed with various metal ions and organic ligands. Due to their high surface area, good crystallinity, multiple pore size and ordered periodic porosity, they have been developed for many potential applications such as gas separation and storage,2 drug release,3 and selective catalysis.4Among the vast applications MOFs are capable of, gas adsorption is the most popular because of the tunability of the framework's porosity, ordered structures, and pore sizes,5 to cater for different types of gases for adsorption. However, there are still two issues to overcome. First is the cost of MOF production. The high cost, as well as the utilization of toxic solvents for the synthesis of some MOFs, makes the process hard to scale-up. Secondly, the final product of MOF synthesis is in powder form, which cannot be directly used as an adsorbent.
In order to address this problem, MOF beads were fabricated with the aid of polymers as binders.6 As the procedure in the literature involved the use of DMF to embed the MOF into the polymer matrix, a different polymer was selected to be able to utilize DI water instead. Among various polymers, polyvinyl alcohol (PVA) exhibited good binding properties and was suitable for the freeze granulation7 method. Previous work involving the freeze granulation method employs freeze-dryer equipment,8 which may not be available in many areas, so a more practical approach is needed to be able to replicate the process. Upon pelletizing the MOFs, highly stable MOF–PVA beads may be afforded, maintaining the high crystallinity and gas adsorption capacity, while increasing the mechanical strength of the overall particle.9
In the published literature, two examples of scalable MOFs, or MOFs that may be synthesized on a larger scale with no apparent changes in their properties include HKUST-110 and MIL-68(Al).11 These two MOFs may be synthesized on a large scale without encountering many problems. Other promising MOFs that may be evaluated for their capability to undergo large scale production include ZIF-812 and A520.13 In-depth research has revealed the application of MOFs for the removal of volatile organic compounds (VOCs).14–17 Together with ZIF-67 and CAU-10, these six MOFs will be evaluated for their capacity to adsorb VOCs to combat pollution.
Pollution mainly arises from fuel combustion, traffic waste gas, industrial waste gas and photochemical pollution, cigarettes, oil fumes, building materials, paint materials, and so on.18 According to the regulations of the European Union (EU), if the initial boiling point of an organic substance at an atmospheric pressure of 101.3 kPa is less than 250 °C, it is considered as a VOC. The rising amount of VOCs present in the environment has led to a massive decline in the quality of air all around the world, ultimately bringing out a grievous impact on the health and well-being of the population.19
One example of VOC commonly affecting the general population is toluene, as it is commonly encountered among household products such as paints, adhesives, synthetic fragrances and nail polish. The legal airborne permissible exposure limit (PEL) for toluene is 200 ppm averaged over an 8 hour work shift20 which is why it is important for adsorbents to be able to effectively adsorb toluene even at the low concentration present in the environment. Literature on dynamic low concentration adsorption of toluene is limited and currently the zeolite material Y@MnO2 exhibits the best adsorption capacity for toluene (50 mg g−1).21
The main drawback for MOFs, in comparison to commercially available activated carbon (AC) and zeolites such as ZSM-5 for use in VOC adsorption is the cost of production. Upon addressing the issues with synthesis, the production costs may be brought down and MOFs, which possess a better adsorption capacity, may have the potential to outperform and replace these commercial products.
In this study, optimization of the appropriate ratio for MOF–PVA composite beads was evaluated toward their capacity for VOC adsorption. The adsorption capacity of the MOF@PVA beads towardsseveral VOCs including acetic acid, acetone, isopropanol, formaldehyde, and toluene was also assessed, to make the evaluation more encompassing with the chosen VOCs serving as representative models for a specific functional group: toluene for benzene containing compounds, acetone for those with the ketone functional group, formaldehyde for those with aldehyde groups, IPA for alcohols, and acetic acid for those possessing carboxylic acid functional groups. Dynamic toluene adsorption was performed for selected MOF@PVA beads.
Experimental
Materials and methods
MOF@PVA granulation
Material characterization
The prepared materials were characterized by powder X-ray diffraction (PXRD), wherein the patterns were measured using a Bruker D8 Advance diffractometer with Cu Kα radiation (λ = 1.54056 Å) at room temperature operated at 40 kV and 40 mA current. For surface area and pore size analysis, the nitrogen adsorption/desorption isotherms were measured using a Micromeritics 3Flex Physisorption surface area analyzer. The samples were degassed under vacuum at 120 °C prior to analysis to ensure pore vacancy from the guest or solvents. BET surface areas were calculated from N2 adsorption isotherms at 77![[thin space (1/6-em)]](https://www.rsc.org/images/entities/char_2009.gif) K. Micropore volume and pore size distribution were estimated by NLDFT fitting of the measured adsorption isotherms. FTIR analyses were carried out using a Bruker Tensor 27 FT-IR Spectrometer where IR spectra were collected in the 4000–450 cm−1 range with 4.0 cm−1 resolution. Thermogravimetric analyses were carried out using TA Q500 thermogravimetric analyzer wherein sample weights were determined from room temperature to 700 °C with a heating rate of 5 °C minute−1 under 60 mL min−1 N2 gas flow. A JEOL JSM-7600F field-emission scanning electron microscope was used to observe the MOF and MOF@PVA morphology.
K. Micropore volume and pore size distribution were estimated by NLDFT fitting of the measured adsorption isotherms. FTIR analyses were carried out using a Bruker Tensor 27 FT-IR Spectrometer where IR spectra were collected in the 4000–450 cm−1 range with 4.0 cm−1 resolution. Thermogravimetric analyses were carried out using TA Q500 thermogravimetric analyzer wherein sample weights were determined from room temperature to 700 °C with a heating rate of 5 °C minute−1 under 60 mL min−1 N2 gas flow. A JEOL JSM-7600F field-emission scanning electron microscope was used to observe the MOF and MOF@PVA morphology.
VOC adsorption
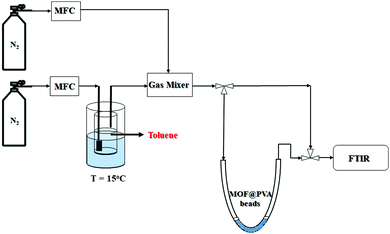
![[thin space (1/6-em)]](https://www.rsc.org/images/entities/char_2009.gif) a schematic representation of the flow system employed is presented in Scheme 1, consisting of the toluene VOC generator, U-tube to hold the MOF@PVA beads, and the detection device, which is the FTIR. The total flow rate was kept at 1 L min−1 with the concentration of toluene controlled at 200 ppm toluene in N2. The sample weights were both 0.2 g for MIL-68@PVA beads and HKUST-1@PVA beads. The VOC concentration at the outlet was monitored by FTIR, and once the concentration of toluene at the outlet equaled that of the inlet, it signals that the adsorption equilibrium was already reached, wherein the adsorption capacities of the samples were calculated using eqn (1):
a schematic representation of the flow system employed is presented in Scheme 1, consisting of the toluene VOC generator, U-tube to hold the MOF@PVA beads, and the detection device, which is the FTIR. The total flow rate was kept at 1 L min−1 with the concentration of toluene controlled at 200 ppm toluene in N2. The sample weights were both 0.2 g for MIL-68@PVA beads and HKUST-1@PVA beads. The VOC concentration at the outlet was monitored by FTIR, and once the concentration of toluene at the outlet equaled that of the inlet, it signals that the adsorption equilibrium was already reached, wherein the adsorption capacities of the samples were calculated using eqn (1): | (1) |
ln(qe − qt) = ln![[thin space (1/6-em)]](https://www.rsc.org/images/entities/char_2009.gif) qe − k1t qe − k1t | (2) |
 | (3) |
| qt = kit1/2 + ci | (4) |
Results and discussion
Material characterization
As a representative sample, the results for the characterization of MIL-68@PVA beads are presented in Fig. 1. The PXRD patterns of the synthesized MOFs and MOF@PVA beads are presented in Fig. S1 (ESI†). Each type of MOF has its own unique crystal structure, by comparing the theoretical peak value of the MOF itself with the measured experimental value, the crystal signals of the selected MOFs and MOF@PVA beads are consistent with the theoretical values, which proves that the synthesis is successful and the granulation process did not adversely affect the crystallinity of the MOFs.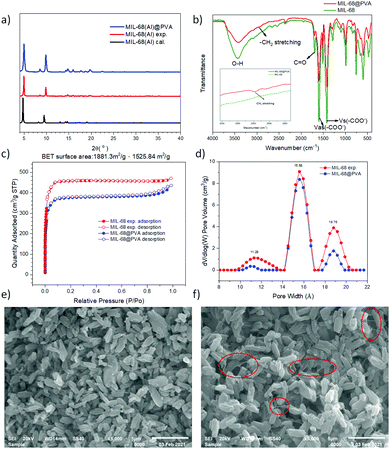 | ||
| Fig. 1 Characterization of MIL-68@PVA beads. (a) PXRD pattern, (b) FTIR, (c) N2 adsorption isotherm, (d) pore size distribution, (e) MIL-68 powder SEM image and (f) MIL-68@PVA beads SEM image. | ||
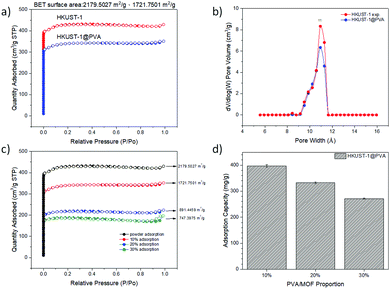
The analysis of the nitrogen adsorption–desorption isotherms revealed the pore volume, BET calculated surface area, and pore size distribution of the prepared samples and showed the differences between the N2 adsorption isotherm and BET specific surface area of the MOF powder and MOF@PVA beads. It can be seen from the comparison overlays in Fig. 1c and Fig. S2 (ESI†) that the amount of N2 adsorption after granulation has decreased by a significant amount, and this is due to the fact that the PVA polymer is not porous. Acting as a binder in the MOF@PVA beads, it contributes to the weight of the finished product, thereby decreasing the total surface area of the sample. To prove this point, HKUST-1, showing an excellent N2 adsorption isotherm (Fig. 2a), was assessed when varying the ratio of PVA for bead formation and it can be observed that as the mixing ratio of PVA increases, the specific surface area of the MOF@PVA beads decreases (Fig. 2c). Likewise, a decrease in adsorption capacity was observed with the preliminary toluene adsorption tests performed upon increasing the PVA ratio, as presented in Fig. 2d. On the other hand, it can be observed that the pore sizes of the samples remained the same even after the granulation process, suggesting that the granulation method may successfully retain the gas adsorption selectivity of the MOFs and the physical adsorption characteristics of the micropores (Fig. S2 insets, ESI†).
The FTIR spectra elucidate the major functional groups present on the surface of the samples. For MIL-68 and MIL-68@PVA beads, the characteristic band at 1717 cm−1 was ascribed to the carboxylate stretching of ligand while the prominent bands between 3284 and 3572 cm−1 were attributed to the –OH stretching. The characteristic bands at 1603 cm−1 were attributed to the asymmetric carboxylate stretching, whereas the prominent bands at 1423 cm−1 were attributed to the symmetrical carboxylate stretching (Fig. 1b). The FTIR spectra of MIL-68 and MIL-68@PVA are well matched with each other, except for a weak band at 2946 cm−1 which was attributed to the C–H stretching (Fig. 1b inset) of alkane on the PVA polymer. Through the appearance of this signal, it can be proven that PVA acts as a binder in the MOF@PVA beads, while retaining the inherent chemical properties of the functional groups of the MOF itself.
The thermogravimetric analyses of the representative MOF powder and MOF@PVA are presented in Fig. S3 (ESI†). It should be noted that no activation under high temperature and vacuum was performed with the materials prior to the TGA. With MIL-68, a gradual 75% decrease in its weight was observed from 478 °C to 641 °C, which was ascribed to the ligand decomposition. In the case of PVA, a gradual 5.9% decrease in its weight was observed up to 239 °C, which was ascribed to the liberation of weakly trapped H2O and crystalline hydrates. A further temperature increase (beyond 250 °C) resulted in the gradual decomposition of the PVA structure, which well matched the literature data.27 The MIL-68@PVA shows a gradual 14.4% decrease in its weight from the starting temperature up to 449 °C, which is from the gradual decomposition of the PVA structure and release of trapped H2O in the beads. This coincides with the 10% PVA formulation used for the MOF@PVA granulation wherein the remaining 4.4% is attributed to the water molecules. Likewise, the weight loss from 450 °C to 639 °C was ascribed to the ligand decomposition.
The morphology of the MIL-68 powder and MIL-68@PVA is presented in Fig. 1e and f, respectively, having been observed under SEM. It can be seen that there are filamentous PVA polymers (encircled in red) incorporated in between the MIL-68 crystals in Fig. 1f. This shows that the prepared MIL-68@PVA beads, effectively utilized PVA as a binder to form the composite beads. Moreover, this also shows that the MIL-68 crystalline structure was not altered by the granulation process, as a similar morphology can be observed for both the MIL-68 powder and the MIL-68@PVA beads.
Static state VOC adsorption
Among the three different activation temperatures evaluated, all the MOF@PVA samples have the highest toluene adsorption capacity after activation at 200 °C (Fig. S4, ESI†) in the preliminary evaluation. The is due to the fact that at a temperature of 120 °C, not all of the adsorbed guest molecules may be evacuated while at a temperature of 250 °C, the PVA polymer is unstable and may deteriorate and affect the sample. With this, samples were activated at 200 °C prior to the succeeding adsorption experiments. Table 1 presents the adsorption capacities of the six different MOF powders and their corresponding MOF@PVA beads form in comparison to commercially available activated carbon (AC) and zeolite (ZSM-5). For the VOCs with an oxygen-containing functional group and kinetic diameters close to 4.7 Å (IPA and acetone), the following order of performance was observed: MIL-68 > A520 > HKUST-1 > ZIF-8 > ZIF-67 > CAU-10. Having Al3+ as its central metal an octahedral structure coordinated with an oxygen atom, MIL-68 forms a strong intermolecular hydrogen bond with the group of the acetone and the hydroxyl group of IPA, so the adsorption capacity is higher. A520, HKUST-1 and ZIF-8, also show the good adsorption capacity of isopropanol. The reason is mainly due to their surface area and porosity. Cu2+ metal is also more stable as compared to Zn2+ metal, even more so, when compared to Co2+ metal, which is why ZIF-8 has a better performance than ZIF-67.| Acetone | IPA | Formaldehyde | Toluene | Acetic acid | |
|---|---|---|---|---|---|
| HKUST-1 | 544 ± 38 | 429 ± 43 | 654 ± 11 | 558 ± 45 | 688 ± 33 |
| HKUST-1@PVA | 503 ± 45 | 302 ± 39 | 558 ± 4 | 385 ± 35 | 616 ± 36 |
| MIL-68 | 799 ± 45 | 670 ± 42 | 622 ± 40 | 733 ± 52 | 1065 ± 58 |
| MIL-68@PVA | 594 ± 22 | 511 ± 49 | 564 ± 46 | 673 ± 27 | 790 ± 56 |
| ZIF-8 | 405 ± 20 | 407 ± 58 | 404 ± 20 | 493 ± 13 | N/A |
| ZIF-8@PVA | 371 ± 6 | 309 ± 51 | 389 ± 6 | 351 ± 7 | N/A |
| A520 | 646 ± 111 | 460 ± 61 | 456 ± 17 | 498 ± 15 | 607 ± 71 |
| A520@PVA | 557 ± 47 | 367 ± 19 | 418 ± 21 | 408 ± 8 | 429 ± 38 |
| ZIF-67 | 387 ± 19 | 380 ± 46 | N/A | 478 ± 77 | N/A |
| ZIF-67@PVA | 361 ± 5 | 316 ± 3 | N/A | 407 ± 28 | N/A |
| CAU-10 | 331 ± 18 | 388 ± 10 | 410 ± 12 | 407 ± 23 | 381 ± 64 |
| CAU-10@PVA | 381 ± 58 | 310 ± 35 | 273 ± 40 | 379 ± 15 | 405 ± 14 |
| AC | 265 ± 6 | 268 ± 14 | 363 ± 21 | 340 ± 17 | 336 ± 18 |
| ZSM-5 | 246 ± 8 | 199 ± 19 | 379 ± 7 | 246 ± 15 | 267 ± 11 |
Compared to the other VOCs that possess a carbonyl group, the results obtained in the test for formaldehyde capture are different from those of acetone and acetic acid. For formaldehyde molecules, aluminum MOFs hold no advantage over other MOFs and it is speculated that the reason is due to the fact that the formaldehyde is a relatively small molecule with an effective size of only ∼2.5 Å.28 Thereby, HKUST-1, which has the highest adsorption capacity among the MOFs evaluated, holds the advantage of being able to adsorb more formaldehyde.
For formaldehyde molecules, the specific surface area is the main factor affecting the adsorption capacity, but ZIF-8 is an exception (Fig. S5, ESI†). The reason is that ZIF-8 is not acid stable, and although the sample did not liquefy in this test, it has affected the stability of the sample causing a low adsorption capacity. In the same way, ZIF-67 is not stable in an acidic environment, thus causing structure collapse, so no data was obtained for ZIF-67.
For toluene, because of its large kinetic diameter of 5.85 Å, the pore widths of the MOFs will matter (Fig. S6, ESI†). Among the MOFs with similar specific surface areas, MIL-68 has the largest hexagonal window with a pore size of 16 Å, which is the only pore that can fit two toluene molecules consecutively. Multi-layer adsorption can be achieved in a high-concentration environment, thus MIL-68 possesses the highest toluene adsorption capacity. As HKUST-1 also has a high specific surface area with a pore width of 11 Å, toluene may also be effectively adsorbed. Moreover, the benzene ring of its trimesic acid ligand may also act on toluene through the π–π intermolecular force,29 generating a relatively higher toluene adsorption capacity.
As for acetic acid, since the structures of the two MOFs, ZIF-8 and ZIF-67 are not acid-resistant, the samples liquefied during the adsorption test (Fig. S7, ESI†) so no data may be obtained. In the results, MIL-68 showed nearly 40% adsorption superiority compared to HKUST-1, which has the second highest adsorption capacity. This is because MIL-68 has a high-porosity hexagonal window with an extremely high multi-layer adsorption capacity. The framework is also capable of providing strong hydrogen bonds for acetic acid with a corresponding adsorption energy reaching −119.32 kJ mol−1,11 thus the high adsorption capacity is recorded. A summary of the pore sizes of the MOFs as well as the kinetic diameters of the VOCs are presented in Table S1 (ESI†) to provide a better comparison.
A comparison of the adsorption capacities of the MOF powders vs. the MOF@PVA beads, as given in Table 1, shows a slight decrease in the values. Nevertheless, most of the results still show significantly good adsorption for various VOCs, which prove that the prepared MOF@PVA beads successfully retained the physical and chemical adsorption characteristics of the MOFs. Compared with the powdered samples, the MOF@PVA beads have a lower adsorption capacity, with the exception of CAU-10@PVA beads for acetone adsorption. This is attributed to the astounding increase in the 9 Å pore window as seen in the inset of Fig. S2f (ESI†). It can also be observed that most of the prepared MOF@PVA beads exhibited a higher VOC adsorption capacity as compared to commercially available activated carbon and zeolite adsorbents, proving the universality of the method of preparation.
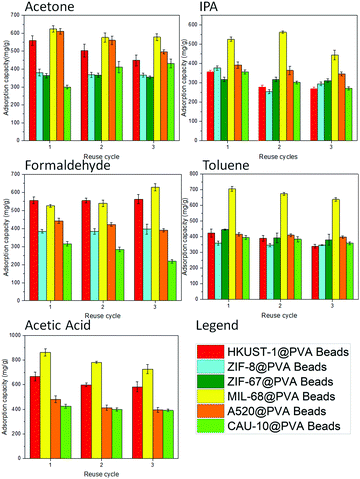
Another consideration in the use of adsorbents is the reusability of the sample. With this in mind, the MOF@PVA beads were evaluated for their VOC adsorption capacities for 3 continuous cycles. Consistent VOC adsorption across all prepared MOF@PVA beads and across all different VOCs including acetone, IPA, formaldehyde, toluene, and acetic acid can be observed in Fig. 3, proving the stability and reusability of the prepared materials. It is also observed that MIL-68@PVA proved to be the most promising material among the rest, showing consistently high VOC adsorption capacities cycle after cycle. With this, MIL-68@PVA was selected to further evaluate the reusability of the adsorbent for an extended period of time of up to 10 cycles. As seen in Fig. S8a (ESI†), the adsorption capacity of MIL-68@PVA beads within 7 toluene adsorption cycles did not change significantly. However, the adsorption capacity fell drastically by ∼15% in the 8th cycle. This is mainly attributed to the partial decomposition of the PVA polymer, characterized by the yellow discoloration after the 7th cycle as seen in Fig. S8b (ESI†). The discoloration is inevitable after exposure to high temperatures for an extended period of time.30 Besides, it can be observed that no significant changes in the crystallinity are seen from the PXRD patterns measured after the 5th and 10th cycle (Fig. S8c, ESI†), thus considerably high values of toluene adsorption can still be observed after the 7th cycle towards the 10th cycle. This also proved the durability of the material under the repeated test conditions.
Dynamic toluene adsorption
As mentioned earlier, MIL-68@PVA proved to be the most promising adsorbent among the prepared MOF@PVA beads, followed by HKUST-1@PVA, which is why these 2 materials were selected to be further evaluated for their dynamic toluene adsorption. Fig. 4a presents the breakthrough curves of toluene adsorption of MIL-68@PVA and HKUST-1@PVA beads which were used to calculate the adsorption capacities (Fig. 4a inset). Looking into the data, it can be seen that the MIL-68@PVA beads, which exhibited excellent static adsorption at high concentrations, are shown to be far less than HKUST-1@PVA in terms of dynamic adsorption capacity, wherein the dynamic adsorption capacity is nearly 3 times greater. From Fig. 4b, it can be seen that the removal concentration of toluene over time is much higher for HKUST-1@PVA as compared to that of MIL-68@PVA. In dynamic low concentration adsorption, the mechanism mainly relies on monolayer adsorption,31 which is why it is more favorable for adsorbents with smaller pores, as with the case of HKUST-1 with 11 Å pores, in comparison to that of the 16 Å hexagonal pores of MIL-68. Moreover, the dynamic toluene adsorption capacity of HKUST-1@PVA (123.82 mg g−1) beads exceeds that of the zeolite Y@MnO2, which is reported to be at 50 mg g−1.21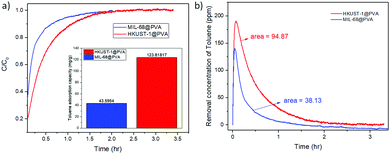 | ||
| Fig. 4 Graphs from the dynamic toluene adsorption of HKUST-1@PVA and MIL-68@PVA beads showing: (a) breakthrough curves (inset: toluene adsorption capacity) and (b) toluene removal over time. | ||
With this, analyses of the adsorption kinetics were carried out by fitting the adsorption data to two adsorption kinetic models. The fitted curves and kinetic parameters are presented in Fig. S9 (ESI†) and Table 2, respectively. The experimental data were more suitably fitted for the pseudo-second-order model as compared to the pseudo-first-order model (correlation coefficient R2 = 0.99847, 0.99976), and the qe was close to the experimental value (Table 2), suggesting that it is influenced by chemisorption.26
| Models | Parameters | HKUST-1@PVA | MIL-68@PVA |
|---|---|---|---|
| Pseudo-first order | q e (mg g−1) | 158.3266 | 55.33137 |
| k 1 (1 min−1) | 0.02856 | 0.03785 | |
| R 2 | 0.88791 | 0.87875 | |
| Pseudo-second order | q e (mg g−1) | 149.925 | 50.15045 |
| k 2 (1 g−1 mg−1 min−1) | 0.01361 | 0.030698 | |
| R 2 | 0.99847 | 0.99976 |
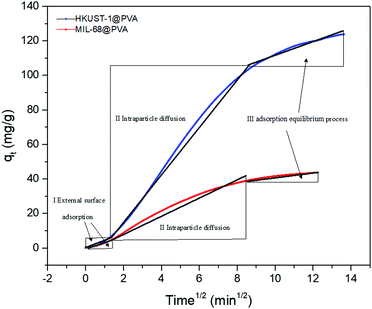
Furthermore, in order to shed more light toward understanding the adsorption process, the intraparticle diffusion model was utilized to determine the diffusion mechanism for toluene. Fig. 5 demonstrates the plots of qtversus t1/2 for the adsorption of toluene by the MOF@PVA beads, and the linear fitting data are shown in Table S2 (ESI†). Each plot is divided into the three stages involved in the adsorption process. The first stage (I) represents toluene diffusion from the bulk gas phase to the external surface of the MOF@PVA beads, wherein the toluene concentration in the gas phase and the external surface area of the beads were the main factors influencing toluene adsorption. The second stage (II) is attributed to the particle diffusion process of toluene from the external surface into the micropores, which was determined by the pore size distribution of MOF@PVA. Finally, the third stage (III) portrays the toluene adsorption on the inner surfaces of the micropores, until finally reaching equilibrium.26 It is found that the most distinct difference in the adsorption of the two MOF@PVA beads comes from stage 2 which involves the rate of the particle diffusion of toluene from the external surface into the micropores, which is related to the pore size distribution, the specific surface area, and window type of the materials. As dynamic low concentration toluene adsorption mainly involves monolayer adsorption, the smaller pores of HKUST-1 with 9 and 11 Å windows are more conducive to the diffusion of toluene molecules into the pores. Not only does HKUST-1@PVA possess a higher BET specific surface area of 1721.80 m2 g−1 as compared to that of MIL-68@PVA's 1525.84 m2 g−1, its 3D-cage window can also allow more toluene molecules to be adsorbed as compared to the channel-type MIL-68 pores, as cage-type MOFs generally possess higher pore occupancy than that of channel-type MOFs.32 As for the third stage, adsorption in the micropores is attributed to the open metal sites of the central metal Cu2+ ion of HKUST-1. The dipole–dipole force of the polar molecule toluene, and the dense π electron cloud of the ligands provide a strong π–π force, so the adsorption rate constant KIII is larger by 3 folds.
Conclusions
In summary, a universal method to synthesize MOF@PVA beads was presented which can be utilized by a variety of MOFs towards VOC capture applications. Processing the MOF powders into MOF@PVA beads not only maintained the crystallinity and porosity of MOFs themselves, but also increased their potential for commercial and industrial application. Moreover, HKUST-1@PVA beads were also proved to be an efficient material for dynamic low concentration toluene adsorption with a capacity of 123.82 mg g−1.Author contributions
Pamela Berilyn So: writing – review and editing, data curation, formal analysis, and validation. Chen-Yu Liu: investigation, writing – original draft. Yu-Lun Lai: methodology and resources. Cheng-Shiuan Lee: methodology, resources. Chia-Her Lin: conceptualization and writing – review and editing, supervision, project administration, and funding acquisition.Conflicts of interest
There are no conflicts to declare.Acknowledgements
The authors would like to acknowledge the Taiwan Ministry of Science and Technology, for funding the research with grant numbers: MOST 110-2113-M-003-011-MY3 and MOST 110-2811-M-003-534.References
- H.-C. J. Zhou and S. Kitagawa, Metal–Organic Frameworks (MOFs), Chem. Soc. Rev., 2014, 43, 5415–5418 RSC.
- H. Li, K. Wang, Y. Sun, C. T. Lollar, J. Li and H.-C. Zhou, Recent advances in gas storage and separation using metal–organic frameworks, Mater. Today, 2018, 21, 108–121 CrossRef CAS.
- P. Horcajada, R. Gref, T. Baati, P. K. Allan, G. Maurin, P. Couvreur, G. Férey, R. E. Morris and C. Serre, Metal–Organic Frameworks in Biomedicine, Chem. Rev., 2012, 112, 1232–1268 CrossRef CAS PubMed.
- D. Yang and B. C. Gates, Catalysis by Metal Organic Frameworks: Perspective and Suggestions for Future Research, ACS Catal., 2019, 9, 1779–1798 CrossRef CAS.
- M. Eddaoudi, J. Kim, N. Rosi, D. Vodak, J. Wachter, M. O'Keeffe and O. M. Yaghi, Systematic Design of Pore Size and Functionality in Isoreticular MOFs and Their Application in Methane Storage, Science, 2002, 295, 469–472 CrossRef CAS PubMed.
- B. Valizadeh, T. N. Nguyen, B. Smit and K. C. Stylianou, Porous Metal–Organic Framework@Polymer Beads for Iodine Capture and Recovery Using a Gas-Sparged Column, Adv. Funct. Mater., 2018, 28, 1801596 CrossRef.
- F. La Lumia, L. Ramond, C. Pagnoux and G. Bernard-Granger, Fabrication of homogenous pellets by freeze granulation of optimized TiO2-Y2O3 suspensions, J. Eur. Ceram. Soc., 2019, 39, 2168–2178 CrossRef CAS.
- V. N. Le, D. Kim, J. Kim and M. R. Othman, Freeze Granulation of Nanoporous UiO-66 Nanoparticles for Capture of Volatile Organic Compounds, ACS Appl. Nano Mater., 2021, 4, 8863–8871 CrossRef CAS.
- S. Gökpinar, S.-J. Ernst, E. Hastürk, M. Möllers, I. El Aita, R. Wiedey, N. Tannert, S. Nießing, S. Abdpour, A. Schmitz, J. Quodbach, G. Füldner, S. K. Henninger and C. Janiak, Air-Con Metal–Organic Frameworks in Binder Composites for Water Adsorption Heat Transformation Systems, Ind. Eng. Chem. Res., 2019, 58, 21493–21503 CrossRef.
- G. Majano and J. Pérez-Ramírez, Scalable Room-Temperature Conversion of Copper(II) Hydroxide into HKUST-1 (Cu3(btc)2), Adv. Mater., 2013, 25, 1052–1057 CrossRef CAS PubMed.
- P. B. So, P.-H. Tang, B.-S. Liao, N. Sathishkumar, H.-T. Chen and C.-H. Lin, Sustainable scale-up synthesis of MIL-68(Al) using IPA as solvent for acetic acid capture, Microporous Mesoporous Mater., 2021, 316, 110943 CrossRef CAS.
- M. García-Palacín, J. I. Martínez, L. Paseta, A. Deacon, T. Johnson, M. Malankowska, C. Téllez and J. Coronas, Sized-Controlled ZIF-8 Nanoparticle Synthesis from Recycled Mother Liquors: Environmental Impact Assessment, ACS Sustainable Chem. Eng., 2020, 8, 2973–2980 CrossRef PubMed.
- E. Alvarez, N. Guillou, C. Martineau, B. Bueken, B. Van de Voorde, C. Le Guillouzer, P. Fabry, F. Nouar, F. Taulelle, D. de Vos, J.-S. Chang, K. H. Cho, N. Ramsahye, T. Devic, M. Daturi, G. Maurin and C. Serre, The Structure of the Aluminum Fumarate Metal–Organic Framework A520, Angew. Chem., Int. Ed., 2015, 54, 3664–3668 CrossRef CAS PubMed.
- C.-Y. Huang, M. Song, Z.-Y. Gu, H.-F. Wang and X.-P. Yan, Probing the Adsorption Characteristic of Metal–Organic Framework MIL-101 for Volatile Organic Compounds by Quartz Crystal Microbalance, Environ. Sci. Technol., 2011, 45, 4490–4496 CrossRef CAS PubMed.
- M. T. Luebbers, T. Wu, L. Shen and R. I. Masel, Trends in the Adsorption of Volatile Organic Compounds in a Large-Pore Metal−Organic Framework, IRMOF-1, Langmuir, 2010, 26, 11319–11329 CrossRef CAS PubMed.
- S. Sudan, A. Gładysiak, B. Valizadeh, J.-H. Lee and K. C. Stylianou, Sustainable Capture of Aromatic Volatile Organic Compounds by a Pyrene-Based Metal–Organic Framework under Humid Conditions, Inorg. Chem., 2020, 59, 9029–9036 CrossRef CAS PubMed.
- K. Vikrant, K.-H. Kim, S. Kumar and D. W. Boukhvalov, Metal–Organic Frameworks for the Adsorptive Removal of Gaseous Aliphatic Ketones, ACS Appl. Mater. Interfaces, 2020, 12, 10317–10331 CrossRef CAS PubMed.
- C. He, J. Cheng, X. Zhang, M. Douthwaite, S. Pattisson and Z. Hao, Recent Advances in the Catalytic Oxidation of Volatile Organic Compounds: A Review Based on Pollutant Sorts and Sources, Chem. Rev., 2019, 119, 4471–4568 CrossRef CAS PubMed.
- J. J. West, A. Cohen, F. Dentener, B. Brunekreef, T. Zhu, B. Armstrong, M. L. Bell, M. Brauer, G. Carmichael, D. L. Costa, D. W. Dockery, M. Kleeman, M. Krzyzanowski, N. Künzli, C. Liousse, S.-C. C. Lung, R. V. Martin, U. Pöschl, C. A. Pope, J. M. Roberts, A. G. Russell and C. Wiedinmyer, What We Breathe Impacts Our Health: Improving Understanding of the Link between Air Pollution and Health, Environ. Sci. Technol., 2016, 50, 4895–4904 CrossRef CAS PubMed.
- NIOSH Pocket Guide to Chemical Hazards, https://www.cdc.gov/niosh/npg/npgd0619.html.
- T. Yin, X. Meng, S. Wang, X. Yao, N. Liu and L. Shi, Study on the adsorption of low-concentration VOCs on zeolite composites based on chemisorption of metal-oxides under dry and wet conditions, Sep. Purif. Technol., 2022, 280, 119634 CrossRef CAS.
- J. Qin, S. Wang and X. Wang, Visible-light reduction CO2 with dodecahedral zeolitic imidazolate framework ZIF-67 as an efficient co-catalyst, Appl. Catal., B, 2017, 209, 476–482 CrossRef CAS.
- H. Reinsch, M. A. van der Veen, B. Gil, B. Marszalek, T. Verbiest, D. de Vos and N. Stock, Structures, Sorption Characteristics, and Nonlinear Optical Properties of a New Series of Highly Stable Aluminum MOFs, Chem. Mater., 2013, 25, 17–26 CrossRef CAS.
- J. Qi, J. Li, Y. Li, X. Fang, X. Sun, J. Shen, W. Han and L. Wang, Synthesis of porous carbon beads with controllable pore structure for volatile organic compounds removal, Chem. Eng. J., 2017, 307, 989–998 CrossRef CAS.
- J. Carratalá-Abril, M. A. Lillo-Ródenas, A. Linares-Solano and D. Cazorla-Amorós, Activated Carbons for the Removal of Low-Concentration Gaseous Toluene at the Semipilot Scale, Ind. Eng. Chem. Res., 2009, 48, 2066–2075 CrossRef.
- X. Ma, Z. Zhang, H. Wu, J. Li and L. Yang, Adsorption of Volatile Organic Compounds at Medium-High Temperature Conditions by Activated Carbons, Energy Fuels, 2020, 34, 3679–3690 CrossRef CAS.
- M. Mohsin, A. Hossin and Y. Haik, Thermal and mechanical properties of poly(vinyl alcohol) plasticized with glycerol, J. Appl. Polym. Sci., 2011, 122, 3102–3109 CrossRef CAS.
- P. Kowalczyk, J. Miyawaki, Y. Azuma, S.-H. Yoon, K. Nakabayashi, P. A. Gauden, S. Furmaniak, A. P. Terzyk, M. Wisniewski, J. Włoch, K. Kaneko and A. V. Neimark, Molecular simulation aided nanoporous carbon design for highly efficient low-concentrated formaldehyde capture, Carbon, 2017, 124, 152–160 CrossRef CAS.
- K. Vellingiri, J. E. Szulejko, P. Kumar, E. E. Kwon, K.-H. Kim, A. Deep, D. W. Boukhvalov and R. J. C. Brown, Metal organic frameworks as sorption media for volatile and semi-volatile organic compounds at ambient conditions, Sci. Rep., 2016, 6, 27813 CrossRef CAS PubMed.
- T.-J. Lee, D.-J. Lee, J.-H. Seo, K.-S. Lee, D. Guerin, P. Martinez, M.-K. Lee and J.-Y. Ryu, Preventing Discoloration of Poly(vinyl alcohol)-Coated Paper Hydrophobized by Gas Grafting with Palmitoyl Chloride, ACS Sustainable Chem. Eng., 2018, 6, 1702–1707 CrossRef CAS.
- S. N. Rao, in Interface Science and Technology, ed. V. Ball, Elsevier, 2018, vol. 21, pp. 251–331 Search PubMed.
- X. Zhang, R.-B. Lin, J. Wang, B. Wang, B. Liang, T. Yildirim, J. Zhang, W. Zhou and B. Chen, Optimization of the Pore Structures of MOFs for Record High Hydrogen Volumetric Working Capacity, Adv. Mater., 2020, 32, 1907995 CrossRef CAS PubMed.
Footnote |
| † Electronic supplementary information (ESI) available. See DOI: https://doi.org/10.1039/d2ma00257d |
| This journal is © The Royal Society of Chemistry 2022 |

