DOI:
10.1039/D2MA00211F
(Paper)
Mater. Adv., 2022,
3, 5337-5343
A highly sensitive SERS substrate based on a mesoporous Ag–TiO2 thin film for the detection of dye molecules
Received
24th February 2022
, Accepted 14th April 2022
First published on 16th April 2022
Abstract
We present a fast, accurate, and molecular specific detection technique of dyes at an ultra-trace level using surface-enhanced Raman spectroscopy (SERS). A highly sensitive Ag–TiO2 thin film having a nanocage (NC) structure is explored for SERS applications. The facile fabrication method requires significantly less Ag on the TiO2 nanostructure. The Raman enhancement mechanism of the fabricated film is investigated using two different excitation lasers of 514.5 nm and 785 nm considering both experimental and simulation studies. We obtained a significant enhancement for the 514.5 nm excitation laser as it is closest to the plasmonic resonance wavelength of the fabricated SERS film. We have demonstrated the detection of Rhodamine 6G (R6G) and N719 Ruthenium dyes at various concentrations up to picomolar and nanomolar levels, respectively, using the fabricated SERS substrates. The limits of detection (LOD) of R6G and N719 dyes were calculated to be 3.83 × 10⁻¹² M and 1.58 × 10⁻⁹ M, respectively. Thus, this systematic study emphasizes that the fabricated SERS substrate effectively detects different dyes at low concentrations, and further presents more opportunities for practical applications.
1. Introduction
In recent years, the excessive use of organic dyes, pollutants, and pesticides by various industries has potentially threatened soil and water quality due to their toxicity.1,2 The increased contamination in soil and water raises a red flag to save the environment. Therefore, immediate detection and quantification of various dye pollutants present in the air, water, soil, and food constituents are necessary to prevent severe human health issues and environmental hazards.3,4 The spectroscopy-based detection tools such as fluorescence spectroscopy, IR spectroscopy, and Raman spectroscopy offer reliable specification of molecules in terms of their electronic, vibrational, and rotational energy levels.5,6 However, the Raman signal is weak and fails to provide molecular information at the ultra-trace level.7 Surface-enhanced Raman spectroscopy (SERS), unravelled by Fleishman et al., has received enormous attention due to its applications in multidisciplinary areas.8,9 The SERS technology is powerful in detecting various harmful chemicals, explosives, clinical pathogens etc., by accomplishing enhancement in the Raman signal of the target analytes.10–12 The enhancement in the Raman signal occurs due to the localized surface plasmon resonance (LSPR) of novel metallic nanostructures.13 The LSPR condition occurs when the incident laser frequency matches the oscillation frequency of plasmons creating hotspots at a minimal volume. These hotspots provide an enormous amount of electric field by trapping the incident laser energy within a minimum volume.13
The hotspots can be engineered by fabricating the periodic nanostructures of various dimensions over a solid surface. The traditional lithographic techniques incorporate e-beam lithography, nanoimprint lithography, etc., to fabricate nanostructured surfaces. However, these are expensive and time-consuming.14,15 In recent years, low cost, reproducible SERS substrates with facile and scalable fabrication methods are desirable for practical applications.16 Currently, the fabrication of SERS substrates using a combination of different metals and semiconductor-metal nanostructures are receiving considerable attention due to the synergistic effect of SERS and photocatalytic applications.17,18 Several sources in literature report the superior SERS activity of Ag–Au bimetallic nanoparticles, Ag–Cu nanostructures, and Ag–Au–Pt trimetallic nanostructures compared to the SERS activity of a single metal.19–21 The substrates exhibit tunable plasmonic wavelengths by varying their composition, length and morphology. We have recently reported that the Ag capped Al nanorods (NRs) based an SERS substrate fabricated by the glancing angle deposition (GLAD) technique shows excellent SERS activity in the visible-NIR region.22 Apart from the novel metals, the metal-semiconductor heterostructures show enhanced synergistic plasmon and charge transfer effects.17 The Ag/Au nanoparticles decorated on ZnO, TiO2, MoS2 nanosheets, nanorods, nanospheres, and nanocomposites have proven useful reusable SERS properties.23–25 In particular, TiO2 is extensively studied for SERS applications as it is nontoxic, stable and exhibits high photocatalytic activity.24
We have fabricated a highly sensitive, mesoporous Ag–TiO2 nanocage film as an SERS substrate using a scalable method. In this study, the maximum SERS enhancement of the fabricated film for various excitation laser wavelengths is thoroughly studied using experiments and simulations. The SERS activity of the fabricated film is explored for the detection of rhodamine 6G (R6G) and N719 ruthenium dyes at various concentrations. The N719 dye is commonly used in the dye-sensitized solar cell. R6G is used in different chemical industries. Herein, we represent an accurate and cost-effective method for detecting the dye molecules at an ultra-trace level. The limit of detection of the fabricated SERS substrate is calculated for both the dyes. Further, a 3D-FDTD simulation study investigated the amount of local field enhancement for various laser wavelengths considering 514.5 nm, and 785 nm excitation laser wavelengths. Our previous reported work thoroughly evaluated a detailed study of the enhancement factor (EF), reproducibility and self-cleaning ability of the fabricated film.26 The porous, nanocage structure of the TiO2 film contributes a greater surface area for the growth of Ag and more surface for reactions and diffusion in photocatalytic activity.26 In this study, we investigate the Raman activity of the Ag–TiO2 nanocage SERS film using two different excitation lasers of wavelengths 514.5 nm and 785 nm, respectively. The FDTD simulation is also used to calculate the maximum Raman enhancement for various excitation lasers. Furthermore, a thorough explanation of how different wavelengths of laser excitation influence the plasmonic activity of nanocage films is provided. Therefore, both the simulation and experimental research are focused on maximising the SERS activity of the optimised film for a variety of excitation laser wavelengths. The study focuses on the physics of plasmonic enhancement on excitation lasers and how to choose the best excitation laser to maximise the SERS activity. Hence, the research is valuable in understanding the role of the excitation laser source, the plasmonic activity of the optimised nanostructure, and the detection limit of chemically hazardous dyes such as R6G and N719 molecules, respectively.
2. Experimental details
Fabrication procedure
The fabrication details of the Ag–TiO2 SERS substrate is reported in our previous study.26 Briefly, the glass plates were cleaned using a soap solution, ultrasonicated and rinsed in deionised water and finally boiled in isopropanol. The titania paste was prepared by taking TiO2 nanopowder (0.8 mg), polyethylene glycol (0.6 ml) and acetic acid (0.6 ml). All chemicals were completely mixed for 12 h using a magnetic stirrer.
The coating of the as-prepared TiO2 puree on cleaned glass plates was performed using the doctor blade method. For the TiO2 film growth at the anatase phase, coated glass slides were heated inside a furnace at 500 °C for half an hour. The coated TiO2 films were further placed inside a vacuum coating unit for the thermal deposition of Ag. A 10 nm thick Ag was deposited on the TiO2 films placed inside the thermal coating unit and the thickness of Ag was monitored using a quartz crystal microbalance. The deposition was executed at a pressure of 2 × 10⁻⁶ mbar at a rate of 0.3 nm per sec, respectively.
Morphology of nanostructure
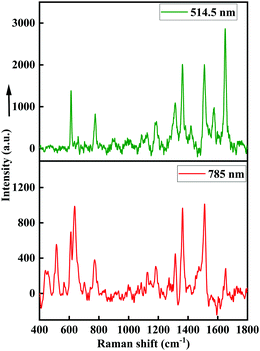
The fabricated TiO2 film has a mesoporous nanocage (NC) morphology, as illustrated in Fig. 1(a), acquired by a ZEISS EVO 50 field emission scanning electron microscope (FESEM). The optimised Ag coating parameters allow the decoration of the sphere-shaped structures of Ag on the interlinked branches of the TiO2 film, as shown in Fig. 1(b). The pore distribution plot, as depicted in Fig. 1(c), varies mainly from 20–60 nm, implying that the film is mesoporous. According to our previous report,26 if the Ag coating thickness is increased, the Ag nanostructure will appear as irregular islands on the TiO2 film. In addition, the porosity is reduced with the increase in the thickness of Ag. The optimised thickness of Ag was found to be 10 nm for maximum SERS activity from previous studies.26
 |
| | Fig. 1 Field emission scanning electron microscope (FESEM) images reveal the morphology of (a) TiO2 film with unique nanocage structure, (b) Ag coated TiO2 film, and (c) indicates the Histogram plot of pore diameters present within Ag–TiO2 nanocage film. | |
UV-Visible absorption spectra
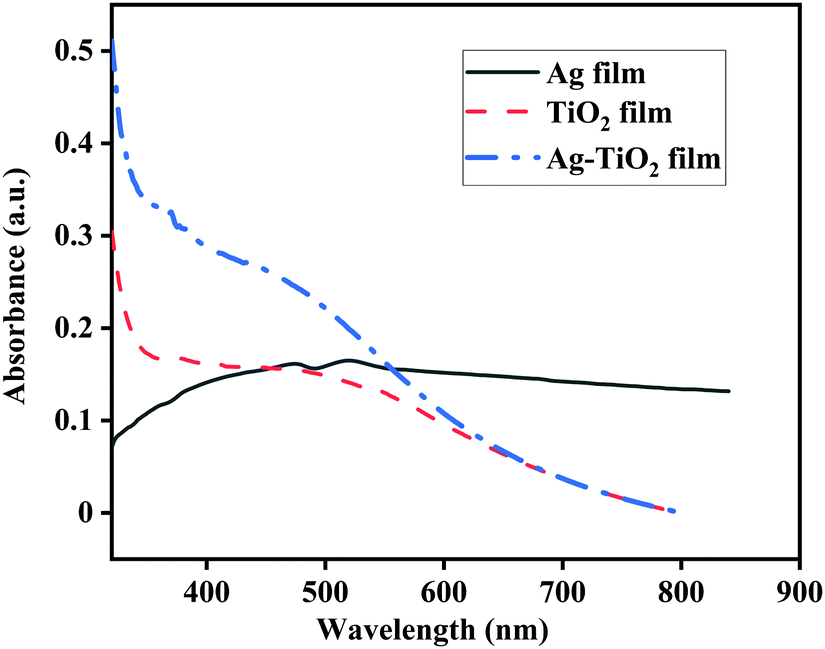
The absorption spectra of pure Ag film, TiO2 film, and Ag–TiO2 film are shown in Fig. 2, and were recorded using a UV-Visible spectrophotometer (PerkinElmer, Singap). The ultrathin Ag film exhibits a finite amount of absorption in the visible region, with a peak at 520 nm. The absorption occurs due to the plasmonic resonance caused by the ultrathin film.27 The fabrication of ultrathin films using physical vapour deposition methods such as thermal evaporation leads to the formation of islands with a discontinuous porous structure.28 Thus, the nanostructure exhibits increased absorption in the visible region. The TiO2 film has an absorption peak situated at 371 nm, which is attributed to the absorption peak of TiO2 at the anatase phase.29 A considerable increase in absorption occurs for the Ag-coated TiO2 film, as can be observed from Fig. 2. The absorption spectrum of the Ag–TiO2 nanocage film consists of a sharp peak at 371 nm corresponding to TiO2 and another large absorption region spanning the wavelength range of 400–600 nm, caused by the LSPR absorption of Ag nanostructures on the TiO2 nanocage film.29 Thus, the fabricated SERS film has enhanced plasmonic activity in the visible region.
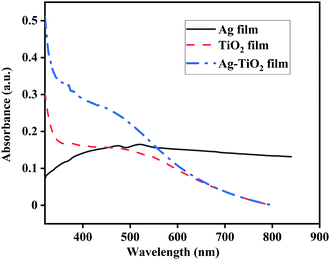 |
| | Fig. 2 Normalised absorption spectra for Ag, TiO2 and Ag–TiO2 SERS film. | |
SERS measurements
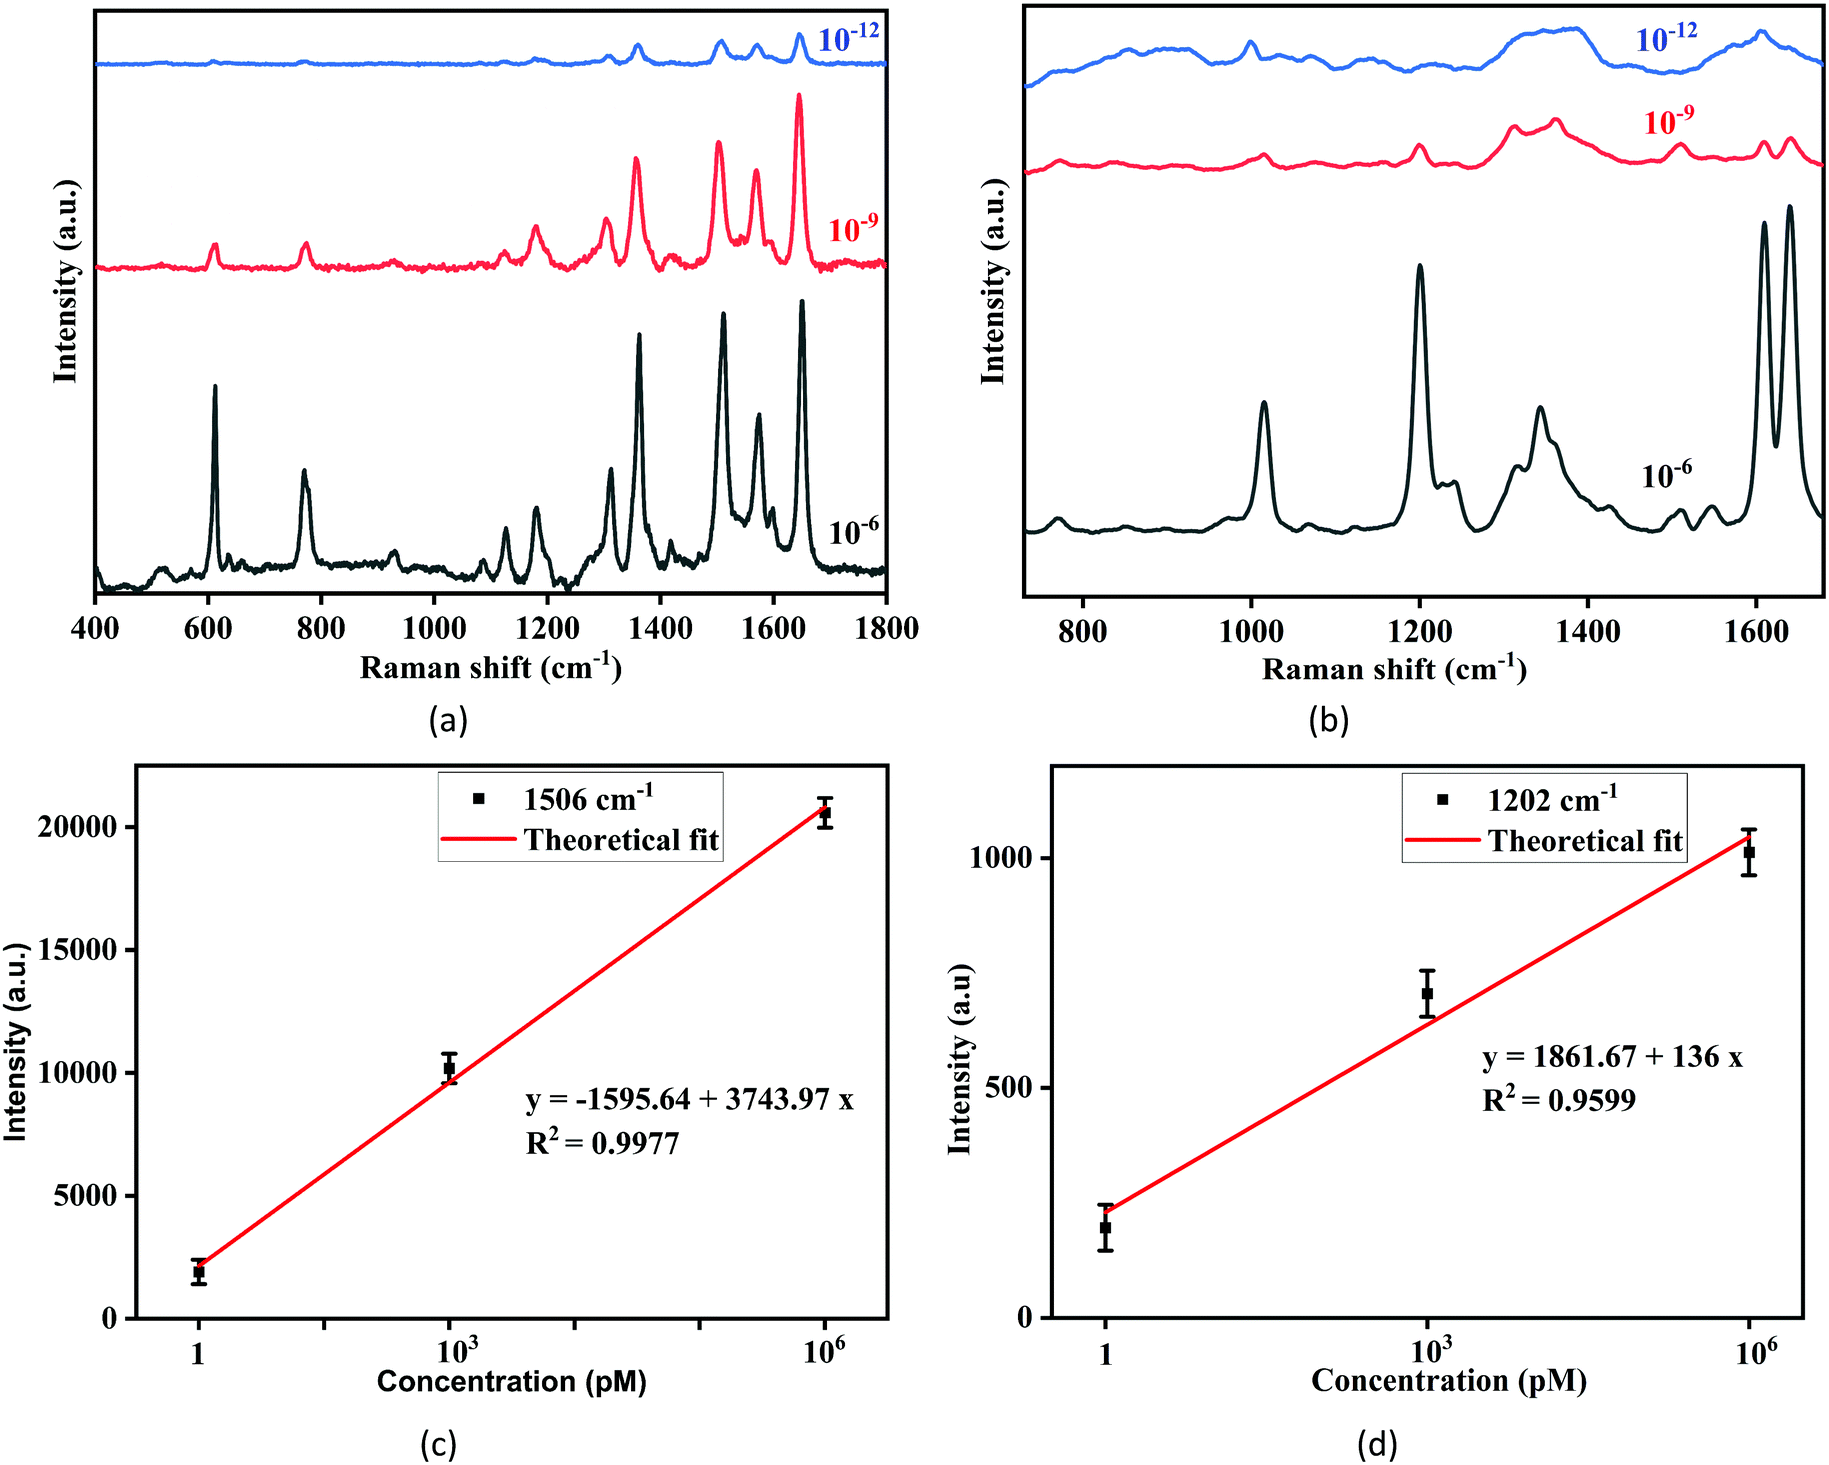
SERS measurements of R6G and N719 dyes at various concentrations were taken using a tabletop Raman spectrometer (Renishaw inVia Raman spectrometer coupled to a Leica microscope with a 50x objective lens) with excitation lasers at 514.5 nm and 785 nm and 0.05 mW power for both dye molecules at various concentrations, as shown in Fig. 3(a–d) and 4(a–d), respectively. A 5 μL amount of each dye for various concentrations was dropped on the Ag–TiO2 SERS film. The coated substrate was allowed to dry at room temperature before taking the measurements. A total of 20 measurements at eight different spots on one SERS substrate for each concentration were recorded.
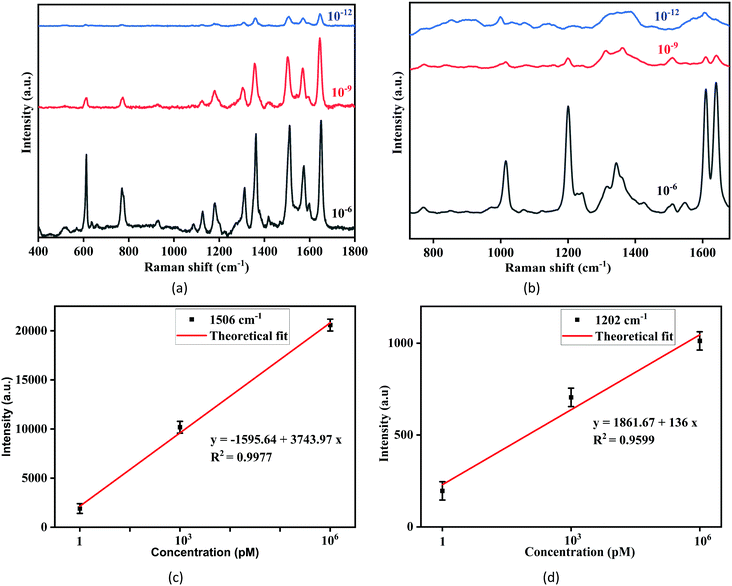 |
| | Fig. 3 SERS spectra of R6G at various concentrations on the Ag–TiO2 SERS film for (a) 514.5 nm, (b) 785 nm excitation laser, and (c and d) represent their corresponding plot of SERS intensity vs. analyte concentration at 1506 cm−1 and 1202 cm−1 Raman shifts, respectively. | |
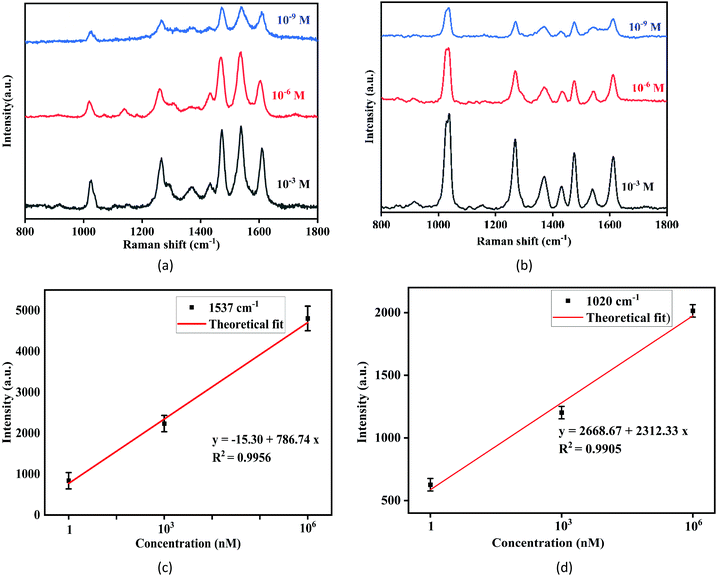 |
| | Fig. 4 SERS spectra of N719 at various concentrations from 10−3 M to 10−9 M on the Ag–TiO2 SERS film for (a) 514.5 nm and (b) 785 nm excitation laser, and (c and d) represent their corresponding plot of SERS intensity vs. analyte concentration at 1537 cm−1, and 1020 cm−1, respectively. | |
Calculation of limit of detection (LOD)
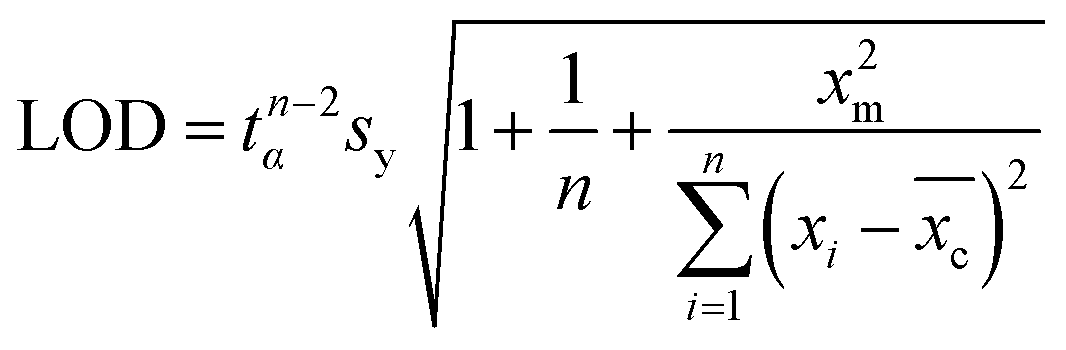
The limit of detection (LOD) of analyte molecules using the SERS substrate was computed by the MATLAB software based on experimental data from a calibration experiment (Raman intensity vs. concentration). The calculation requires a prediction interval with a confidence limit and degrees of freedom. The LOD can be estimated using the following formula:22| | 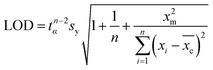 | (1) |
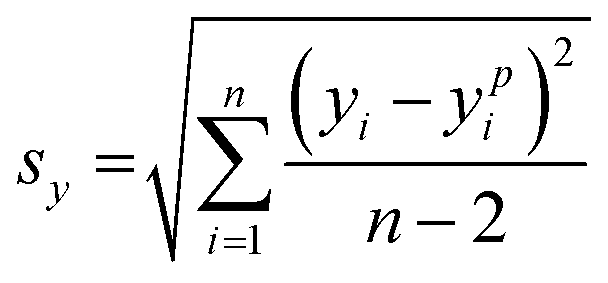
Here, tn−2α represents the critical value of the t-distribution, and α denotes the confidence limit of the prediction interval with (n − 2) degrees of freedom. The value of α is taken to be 95%. The mean value of concentration is xm. sy denotes mean square about the regression that calculates the normalized summation of squares of the difference between experimentally measured values (yi) and predicted values (ypi) from theoretical fitting using the regression curve. The value of sy can be calculated from the given formula:| | 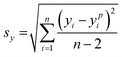 | (2) |
FDTD simulation
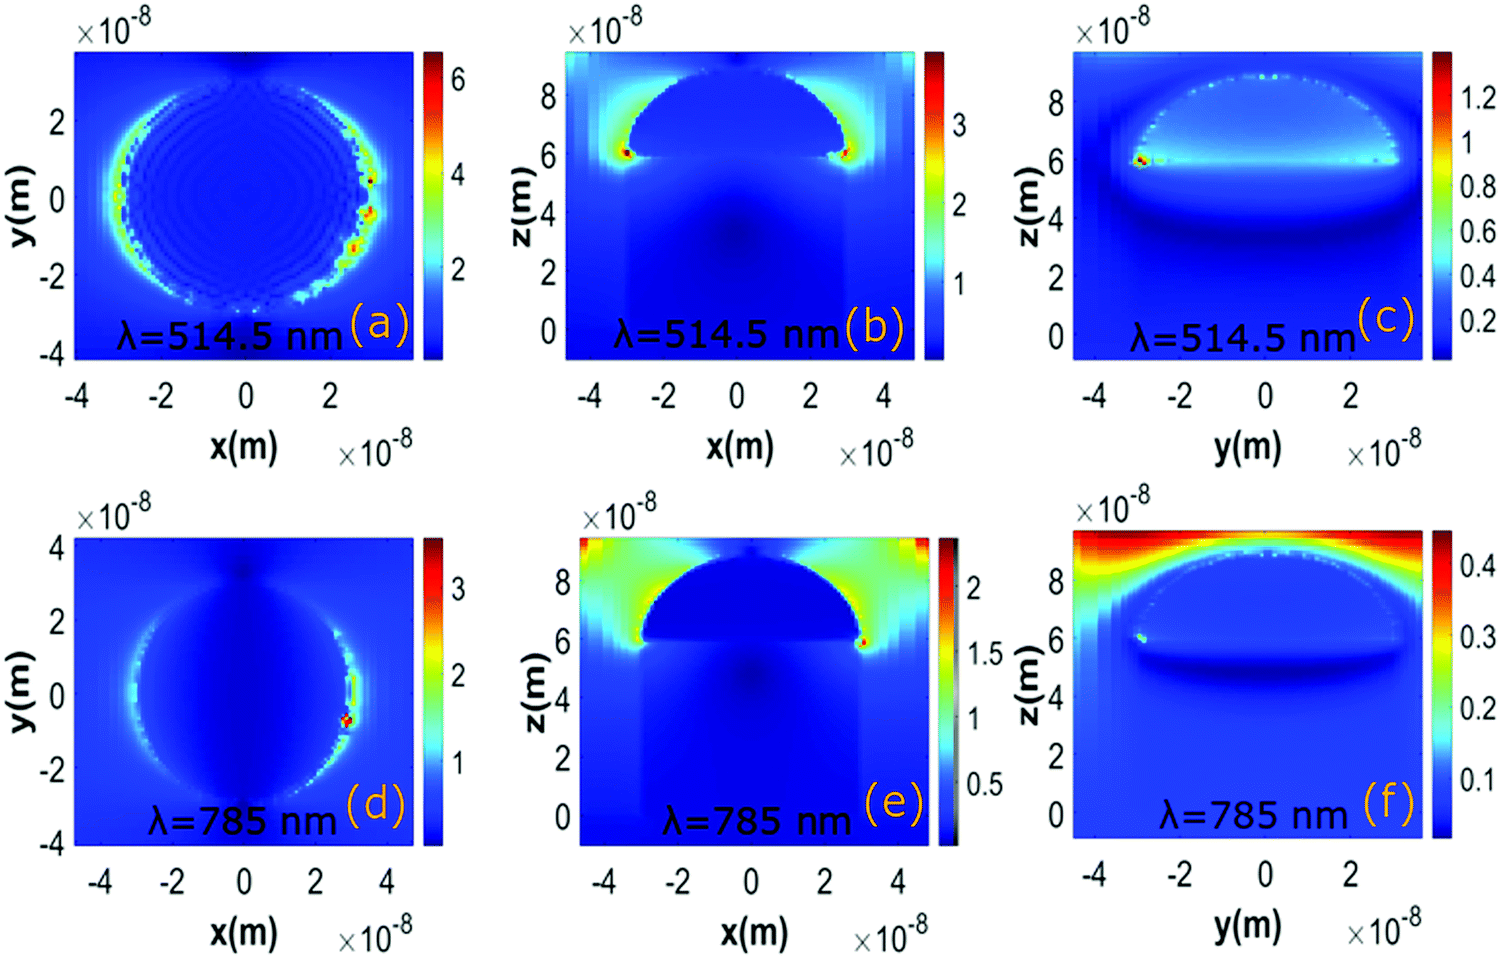
The plasmonic enhancement at various planes (XY, XZ, YZ) for 514.5 nm and 785 nm excitation lasers was investigated considering the finite difference time domain (FDTD) simulation using the Lumerical software, as shown in Fig. 5(a–f). The simulation model comprises a cylindrical nanostructure of TiO2 having a hemispherical cap of Ag. The refractive index of TiO2 and Ag is considered from the Palik database.30 The simulation structure consists of only one Ag–TiO2 nanostructure to reduce the memory size. The morphology of the nanostructure was chosen from the FESEM images, as shown in Fig. 1. The simulation uses a perfectly matched layer (PML) condition. In this simulation, an auto non-uniform mesh was applied, whereas an override region with a fine mesh size of 1 nm was chosen to enclose the entire nanostructure. The incident laser with electric field oscillation in the XY plane propagates along the negative Z direction. The field profile monitors are utilised to visualise the local field distribution maps at various planes such as XY, XZ, and YZ, respectively.
 |
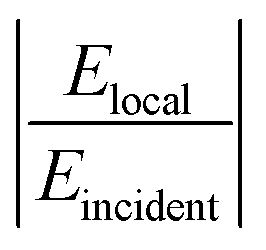
| | Fig. 5 Electric field distribution map at various planes for two different excitation lasers of 514.5 nm and 785 nm wavelengths respectively. (a–c) represent the field variation at XY, XZ and YZ plane for 514.5 nm, (d–f) denote the field variation at XY, XZ, and YZ planes for 785 nm excitation laser wavelength. The colour bar indicates  . . | |
3. Results and discussion
Ultralow detection of R6G and N719 ruthenium dyes
Fig. 3(a) displays the SERS spectra of R6G at several concentrations (10−6 M–10−12 M) using a 514.5 nm laser wavelength, whereas Fig. 3(b) displays the SERS spectra of R6G for the same concentrations (10−6 M to 10−12 M) with the 785 nm excitation laser. The assigned vibrational peaks of R6G are provided in Table 1.31 The distinct peaks occurring repetitively for several measurements in each concentration were considered. The peak at 606 cm−1 is attributed to aromatic (C–C–C) stretching vibrations, and the peaks at 765 cm−1 and 1179 cm−1 are attributed to the out-of-plane and in-plane bending vibrations in xanthene rings. The peaks at 1202 cm−1 and 1305 cm−1 are assigned to the stretching and in-plane bending vibrations of (C–O–C) vibrational modes, respectively, and peaks at 1359 cm−1, 1506 cm−1 and 1645 cm−1 are attributed to the aromatic (C–C) stretching vibration. The Raman peaks having a 514.5 nm laser source are highly prominent with much larger counts compared to the SERS spectra of 785 nm laser source. In particular, the Raman shift at higher wavenumbers such as 1359 cm−1, 1503 cm−1, 1645 cm−1 are immensely enhanced and distinguished up to the picomolar level for excitation laser having lower wavelengths. The reason for enhancement at a higher wavenumber is due to the available amount of energy in the excitation laser. Laser excitation energy for 514.5 nm is sufficient to excite the electrons at higher vibrational levels, which is not possible for a 785 nm excitation laser as it possesses lower energy. Hence, enhanced peaks at higher Raman modes are observed in Fig. 3(a).
Table 1 Assigned vibrational peaks of R6G dye22,31
| Raman shift (cm−1) |
Vibrational assignments |
| 606 |
Stretching of aromatic (C–C–C) ring |
| 765 |
Out of plane bending of (C–H) |
| 1179 |
In plane bending of (C–H) |
| 1202 |
Stretching of C–O–C |
| 1305 |
In plane bending of (C–O–C) |
| 1359 |
Stretching of aromatic (C–C) ring |
| 1506 |
Stretching of aromatic (C–C) ring |
| 1645 |
Stretching of aromatic (C–C) stretching |
The calibration plots of the SERS intensity vs. analyte concentration at 1506 cm−1 and 1202 cm−1 Raman modes for 514.5 nm and 785 nm excitation laser source are depicted in Fig. 3(c and d), respectively. The variation in the Raman intensity is linear and the inset error bars indicate the standard deviation for several measurements considering a particular concentration of the analyte.
The SERS spectra of the N719 ruthenium dye at various concentrations (10−3 M to 10−9 M) using 514.5 nm and 785 nm laser sources are displayed in Fig. 4(a and b), respectively. The assigned Raman bands of the N719 dye are provided in Table 2.32 The SERS spectrum shows distinct peaks at 1020 cm−1, 1260 cm−1, 1413 cm−1, and 1464 cm−1 ascribed to the C![[double bond, length as m-dash]](https://www.rsc.org/images/entities/char_e001.gif) C stretching modes, and the shifts at 1537 cm−1 and 1602 cm−1 are ascribed to the stretching of CN in bipyridine rings. The peaks at 1368 cm−1 and 1734 cm−1 are attributed to the (COO–) and (CO) symmetric stretching vibrations, respectively. The Raman peaks at higher wavenumbers such as 1464 cm−1,1537 cm−1, and 1602 cm−1 are significantly enhanced and sharp even at the nanomolar level for the 514.5 nm laser. The peaks at 1020 cm−1 and 1260 cm−1 are prominent for the 785 nm laser source. Fig. 4(c and d) show calibration plots of SERS intensity vs. analyte concentration for Raman modes of 1537 cm−1 and 1020 cm−1 for 514.5 nm and 785 nm excitation laser sources, respectively. The Raman intensity varies linearly, and the inset error bars show the standard deviation for several measurements at a given analyte concentration.
C stretching modes, and the shifts at 1537 cm−1 and 1602 cm−1 are ascribed to the stretching of CN in bipyridine rings. The peaks at 1368 cm−1 and 1734 cm−1 are attributed to the (COO–) and (CO) symmetric stretching vibrations, respectively. The Raman peaks at higher wavenumbers such as 1464 cm−1,1537 cm−1, and 1602 cm−1 are significantly enhanced and sharp even at the nanomolar level for the 514.5 nm laser. The peaks at 1020 cm−1 and 1260 cm−1 are prominent for the 785 nm laser source. Fig. 4(c and d) show calibration plots of SERS intensity vs. analyte concentration for Raman modes of 1537 cm−1 and 1020 cm−1 for 514.5 nm and 785 nm excitation laser sources, respectively. The Raman intensity varies linearly, and the inset error bars show the standard deviation for several measurements at a given analyte concentration.
Table 2 Assigned vibrational peaks of N719 Ruthenium dye32
| Raman shift (cm−1) |
Vibrational assignments |
| 1020 |
Ring breathing of bipyridine |
| 1152 |
In plane deformation of δ (CCH) |
| 1260 |
CC and CN bipyridine rings stretching |
| 1368 |
ν
s (COO–) |
| 1413 |
(CN) bipyridine rings stretching |
| 1464 |
(CN) bipyridine rings stretching |
| 1537 |
(CC) bipyridine rings stretching |
| 1602 |
(CC) bipyridine rings stretching |
| 1734 |
ν (CO) |
The LOD of R6G is calculated to be 3.83 × 10⁻¹² M using the intensity vs. concentration plot considered for the 1506 cm−1 Raman band, as shown in Fig. 3(c). The LOD for the N719 dye is computed to be 1.07 × 10⁻⁹ M considering the plot of intensity vs. concentration at the 1537 cm−1 Raman band, as shown in Fig. 4(c).
Simulation results
The local field enhancement observed in the FDTD simulation study is caused by the decoration of a Ag nanostructure on TiO2, as shown in Fig. 5(a–f). Fig. 5(a–c) and (d–f) show the electric field maps at various planes for excitation laser having 514.5 nm and 785 nm wavelengths, respectively. The simulation results imply that the incident electric field creates large, induced dipoles concentrated at the corners of the Ag nanostructure. The amount of enhancement is dependent on the excitation laser. The most extensive plasmonic enhancement occurs when the nanostructure is excited at a dipolar resonance wavelength.22 As shown in Fig. 2, the fabricated Ag–TiO2 SERS film exhibits a broad plasmonic dipolar resonance absorption spectrum with a peak at 484 nm. Hence, the nanostructure leads to higher enhancement in the local electric field for the 514.5 nm excitation laser as it is close to the plasmon absorption wavelength.
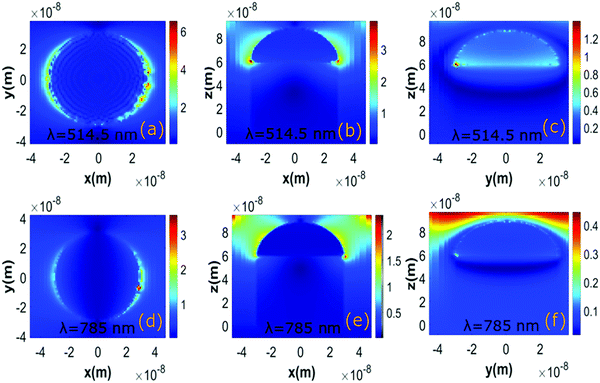
The simulation results of enhancement were further verified considering 1 mM R6G molecule as a probe. The SERS spectra of 1 mM R6G solution for 514.5 nm and 785 nm excitation laser is shown in Fig. 6. Moreover, Fig. 6 shows that while the R6G molecules exhibit distinct Raman peaks for both lasers at millimolar concentration, they exhibit significantly higher counts for the 514.5 nm excitation laser than the 785 nm laser when all other experimental parameters are held constant. As a result, it demonstrates that the SERS enhancement is more significant for the 514.5 nm excitation laser.
 |
| | Fig. 6 SERS spectra of 1 mM R6G using 514.5 nm and 785 nm excitation laser. | |
4. Conclusions
In conclusion, we have fabricated a nanocage-shaped Ag–TiO2 SERS film, enabling efficient and accurate detection of dye molecules present at ultralow concentrations. The fabrication technique is simple, low cost and scalable. The near field enhancement arises from the contribution of hotspots in the vicinity of Ag nanostructures that lead to highly intense and enhanced Raman peaks of dye molecules. The fabricated SERS film exhibits better plasmonic enhancement for 514.5 nm excitation laser than 785 nm laser. The FDTD simulation study helped to scrutinize the local electric field variation and creation of hotspots at various planes. The SERS film efficiently detects R6G and N719 molecules up to 10−12 M and 10−9 M, respectively. Hence, the fabricated film is excellent in molecular detection in food safety inspection, environmental monitoring, and chemical sensing applications.
Author contributions
Sathi Das: conceptualization, methodology, software, data curation, writing – original draft preparation; Kanchan Saxena: conceptualization, visualization, investigation, writing – reviewing and editing; Dalip Singh Mehta: supervision.
Conflicts of interest
There are no conflicts of interest to declare.
Acknowledgements
The author S. Das is thankful to PMRF fellowship of Govt. of India for the financial support throughout the research.
Notes and references
- B. Lellis, C. Z. Fávaro-Polonio, J. A. Pamphile and J. C. Polonio, Biotechnol. Res. Innov., 2019, 3, 275–290 CrossRef.
- B. S. Rathi, P. S. Kumar and D.-V. N. Vo, Sci. Total Environ, 2021, 797, 149134 CrossRef CAS PubMed.
- K. Aguilar-Pérez, M. Heya, R. Parra-Saldívar and H. M. Iqbal, Case Stud. Chem. Environ. Eng., 2020, 2, 100055 CrossRef.
- S. Gupta, C. H. Huang, G. P. Singh, B. S. Park, N.-H. Chua and R. J. Ram, Sci. Rep., 2020, 10, 746586 Search PubMed.
-
N. M. Noah and P. M. Ndangili, Spectroscopy and Machine Learning for Water Quality Analysis, 2021, pp. 4–1 Search PubMed.
- M. Wang, M. Ateia, Y. Hatano, K. Miyanaga and C. Yoshimura, Environ. Sci., 2022 10.1039/D1VA00017A.
- N. Kuhar, S. Sil, T. Verma and S. Umapathy, RSC Adv., 2018, 8, 25888–25908 RSC.
- M. Fleischmann, P. Hendra and A. Mcquillan, Chem. Phys. Lett., 1974, 26, 163–166 CrossRef CAS.
- M.-C. Wu, M.-P. Lin, S.-W. Chen, P.-H. Lee, J.-H. Li and W.-F. Su, RSC Adv., 2014, 4, 10043 RSC.
- Y. Jiang, S. Cong, G. Song, H. Sun, W. Zhang, W. Yao and Z. Zhao, J. Raman Spectrosc., 2021, 1265–1274 CrossRef CAS.
- G. Bodelón and I. Pastoriza-Santos, Front. Chem., 2020, 8, 478 CrossRef PubMed.
- C. Zong, M. Xu, L.-J. Xu, T. Wei, X. Ma, X.-S. Zheng, R. Hu and B. Ren, Chem. Rev., 2018, 018(118), 4946–4980 CrossRef PubMed.
- R. Pilot, R. Signorini and L. Fabris, Metal Nanopart. Clust., 2017, 89–164 Search PubMed.
- S. J. Barcelo, W. Wu, X. Li, Z. Li and R. S. Williams, Appl. Phys. A: Mater. Sci. Process., 2015, 121, 443–449 CrossRef CAS.
- N. A. A. Hatab, J. M. Oran and M. J. Sepaniak, ACS Nano, 2008, 2, 377–385 CrossRef PubMed.
- L. Ouyang, W. Ren, L. Zhu and J. Irudayaraj, Rev. Anal. Chem., 2017, 36(1), 20160027 Search PubMed.
- Y. Liu, H. Ma, X. X. Han and B. Zhao, Mater. Horiz., 2021, 8, 370–382 RSC.
- W. Liao, K. Liu, Y. Chen, J. Hu and Y. Gan, J. Alloys Compd., 2021, 868, 159136 CrossRef CAS.
- Z.-Q. Cheng, Z.-W. Li, R. Yao, K.-W. Xiong, G.-L. Cheng, Y.-H. Zhou, X. Luo and Z.-M. Liu, Nanoscale Res. Lett., 2020, 15, 1–7 CrossRef PubMed.
- S. Kaja and A. Nag, Langmuir, 2021, 37, 13027–13037 CrossRef CAS PubMed.
- S. Tang, S. Vongehr, Y. Wang, J. Cui, X. Wang and X. Meng, J. Mater. Chem. A, 2014, 2, 3648–3660 RSC.
- S. Das, L. P. Goswami, J. Gayathri, S. Tiwari, K. Saxena and D. S. Mehta, Nanotechnology, 2021, 32, 495301 CrossRef CAS PubMed.
- C. Liu, X. Xu, C. Wang, G. Qiu, W. Ye, Y. Li and D. Wang, Sens. Actuators, B, 2020, 307, 127634 CrossRef.
- C. Wang, Y. Xu, C. Deng, Z. Liu, R. Wang and H. Zhao, RSC Adv., 2016, 6, 113115–113122 RSC.
- J. Wu, Y. Zhou, W. Nie and P. Chen, J. Nanopart. Res., 2018, 20(1), 1–13 CrossRef CAS.
- S. Das, K. Saxena, L. P. Goswami, J. Gayathri and D. S. Mehta, Opt. Mater., 2022, 125, 111994 CrossRef.
- N. Ahmad, J. Stokes, N. A. Fox, M. Teng and M. J. Cryan, Nano Energy, 2012, 1, 777–782 CrossRef CAS.
- Y. Pan, Y. Fan and J. Niu, Infrared Phys. Technol., 2020, 104, 103123 CrossRef CAS.
- Q. Huang, J. Li, W. Wei, Y. Wu and T. Li, RSC Adv., 2017, 7, 26704–26709 RSC.
-
E. D. Palik, Handbook of Optical Constants of Solids, Academic Press, Orlando, 1985, 294–295 Search PubMed.
-
S. Das, D. S. Mehta and K. Saxena, Emerging Technologies for Cell and Tissue Characterization, 2021, paper ETu2A.21.
- C. Muehlethaler, A. Odate, J. L. Weyher, I. Dzięcielewski and J. R. Lombardi, Appl. Surf. Sci., 2018, 457, 809–814 CrossRef CAS.
|
| This journal is © The Royal Society of Chemistry 2022 |
Click here to see how this site uses Cookies. View our privacy policy here. 
 Open Access Article
 This Open Access Article is licensed under a Creative Commons Attribution-Non Commercial 3.0 Unported Licence
 a,
Kanchan
Saxena
a,
Kanchan
Saxena

 .
.