 Open Access Article
Synthesis of porous carbon from a PVC polymer and its application in supercapacitors
Pawan Singh
Dhapola
 *ab,
Abhimanyu
Singh
*ac,
Manoj
Karakoti
b,
Manoj K.
Singh
d,
Subhrajit
Konwar
a,
Sushil
Dohare
e,
Aysh Y.
Madkhli
f,
I. M.
Noor
*g,
Pramod K.
Singh
*a and
Nanda Gopal
Sahoo
 *b
*b
aCenter of Excellence on Solar Cells & Renewable Energy, School of Basic Sciences and Research, Sharda University, Greater Noida, India. E-mail: dhapolapawan@gmail.com; pramodkumar.singh@sharda.ac.in
bProfessor Rajendra Singh Nanosciene and Nanotechnology Centre, Department of Chemistry, DSB Campus, Kumaun University, Nainital, Uttarakhand, India. E-mail: ngsahoo@yahoo.co.in
cDepartment of Applied Physics, Gautam Buddha University, Greater Noida, India. E-mail: abhichess14@gmail.com
dEnergy Storage & Conversion Lab, Department of Applied Science & Humanities, Rajkiya Engineering College Banda, AKTU, Uttar Pradesh-210201, India
eDepartment of Epidemiology, Faculty of Public Health & Tropical Medicine, Jazan University, Jazan, Saudi Arabia
fDepartment of Physics, Faculty of Science, Jazan University, Jazan, Saudi Arabia
gPhysics Division, Centre of Foundation Studies for Agricultural Sciences, Universiti Putra Malaysia, 43400, UPM Serdang, Selangor Darul Ehsan, Malaysia. E-mail: imnoor@upm.edu.my
First published on 23rd May 2022
Abstract
In this study, the laboratory scale production of activated carbon synthesized from PVC with CoCl2 and H3PO4, which is cheaper and has a good yield source material, is reported. A prototype supercapacitor was successfully developed using activated carbon as an electrode material derived from the PVC polymer and IL (1-ethyl-3-methylimidazolium thiocyanate) as the electrolyte. The performance of the supercapacitor was estimated via electrochemical impedance spectroscopy, cyclic voltammetry, and the charge–discharge technique. The supercapacitor offered a high specific capacitance of ∼120 F g−1 at 5 m V s−1. The performances of the supercapacitor were also estimated up to 15 days and up to 9000 cycles via cyclic voltammetry.
Introduction
Carbon is a well-known material for having different allotropes with distinctive structures ranging from sp3 to sp2 bonded atoms. There is also a possibility of mixed states and forms of amorphous carbon.1 The multiplicity of carbon structures paves the way for large variations in the bulk characteristics of carbon materials in mechanical, electrical, high surface area, porous structure and thermal properties. Therefore, it is applicable in numerous applications, such as supercapacitors, solar cells, drug delivery, polymer composites, batteries, and sensing. There are a number of carbon structures that are known, such as activated carbon, porous carbon, graphene, carbon nanotubes, and 3D carbon. Among these, porous activated carbon is the most popular and low-cost material with distinct characteristics, such as a large specific surface area, high porosity, and desired surface functionalization. As a result, activated carbon is widely employed in adsorption, pollution removal, water treatment, and energy generation, among other uses.2 Furthermore, a lot of research have been conducted and focused on exploiting the advantageous properties of porous carbon in supercapacitor (SC) electrode materials. SCs are high-power energy storage devices that use electrostatic or electrochemical ion adsorption to rapidly accumulate and release charges at the electrode/electrolyte interface. SCs are basically of two types: one is electric double-layer capacitors (EDLCs) and the other is pseudocapacitors.3 Therefore, numerous approaches have been carried out for the synthesis of porous carbon from various carbon sources, such as resins, petrochemicals, coal, transition-metal carbide, lignin, cellulose, and polymers, for SC applications. However, the synthesis of porous carbon from PVC is not much explored in the supercapacitor applications. Therefore, our group reported the synthesis of nitrogen-doped non-porous carbon using cobalt chloride, which exhibited the highest specific capacitance of 62.28 F g−1.4 Sun et al. derived porous carbon from aminated polyvinyl chloride (PVC). Further, they activated this carbon with KOH, which exhibited 345 F g−1 in 6 M KOH electrolyte.5Therefore, in this study, our focus is towards the laboratory scale production of activated porous carbon synthesized from PVC with CoCl2 and H3PO4, which is a cheaper source material. The EDLCs were tested using the as-prepared carbon, and the outcomes were fascinating and encouraging. The fabricated device showed the highest specific capacitance of 120 F g−1 at 5 m V s−1 in 1-ethyl-3-methylimidazolium thiocyanate, which is comparable to the available literature. Also, the stability test for the fabricated cell was performed by measuring its specific capacitance up to 15 days and up to 9000 cycles via cyclic voltammetry.
Materials used
Our precursor material for the synthesis of carbon, PVC, (Mw = 233![[thin space (1/6-em)]](https://www.rsc.org/images/entities/char_2009.gif) 000) was procured from Sigma-Aldrich. Cobalt(II) chloride was purchased from CDH (P) Ltd and H3PO4 was purchased from Fisher. To fabricate the supercapacitor, the electrolyte IL (1-ethyl-3-methylimidazolium thiocyanate) was procured from Reinste. Other materials such as filter paper (used as a separator) and THF were procured from Qualikems Fine Chem Pvt. Ltd.
000) was procured from Sigma-Aldrich. Cobalt(II) chloride was purchased from CDH (P) Ltd and H3PO4 was purchased from Fisher. To fabricate the supercapacitor, the electrolyte IL (1-ethyl-3-methylimidazolium thiocyanate) was procured from Reinste. Other materials such as filter paper (used as a separator) and THF were procured from Qualikems Fine Chem Pvt. Ltd.
Synthesis of PC
In the present effort, we have synthesized pure carbon and H3PO4 doped with cobalt(II) chloride in PVC using the same method. To synthesize H3PO4 doped with cobalt(II) chloride in PVC carbon, 10 g PVC was initially dissolved in THF in room temperature till a homogeneous mixture was achieved. In continuation, we added 20 wt% cobalt(II) chloride (CoCl2·6H2O) and 5 wt% H3PO4 to the obtained mixture. After that, the mixture was dehydrated in a vacuum oven at 90 °C for 2 h. Moving onwards, the as-prepared mixture was carbonized at 800 °C at ramp of heating 5 °C min−1 under a nitrogen environment in a tube furnace. After reaching the desired temperature, the sample was put further for ∼1 h in the same reaction conditions. Further, the sample was allowed to cool at room temperature and washed with conc. HCl as well as with DD water. A similar method was carried out for the synthesis of pure carbon from PVC. Samples for pure carbon were denoted by “C” and for H3PO4 doped with cobalt(II) chloride by “HC-Co.”Material characterization
XRD
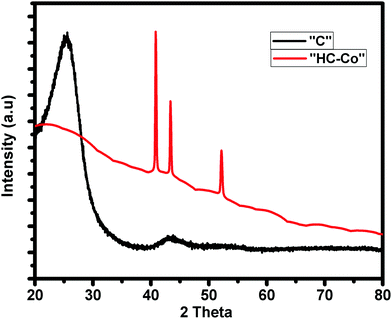
Fig. 1 shows the distinctive XRD pattern of pure carbon, i.e. “C” and H3PO4 doped with cobalt(II) chloride in PVC, i.e. “HC-Co.” Here, the pattern “C” shows the two broad peaks centered at 2θ of ∼21.46° and ∼40.54°, corresponding to the (002) and (001) planes,6 which show that the carbon is amorphous in nature. On the other hand, for the XRD pattern of H3PO4 doped with cobalt(II) chloride in PVC, i.e. “HC-Co,” the spiky peaks seen at 2θ of 41.02°, 43.48° and 52.31° with a reduced crest broadening imply the presence of defects and a large graphitization degree. The addition of cobalt (Co) in pure activated carbon led to crystallinity, which improved the conductivity of the activated carbon material.Raman
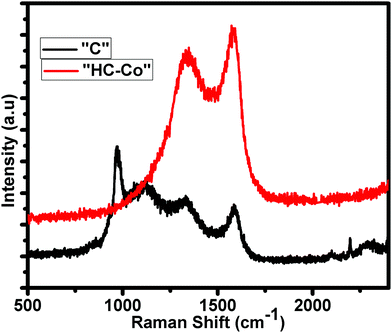
Fig. 2 shows the distinctive Raman spectra of “C” and “HC-Co” obtained from the slow pyrolysis of PVC in a nitrogen atmosphere. According to the Raman analysis, carbon achieved from PVC, i.e. “C,” is likely due to a preliminary polymer chain having a little bit of variation in bands, which is confirmed by the intensity of the Raman bands seen at ∼1335 cm−1 for D-band, ∼1592 cm−1 for G-band, and two others peaks at ∼1000 and 1130 cm−1. On the addition of H3PO4 doped with cobalt(II) chloride in PVC carbon [“HC-Co”], the other peaks were suppressed and only the D- and G-band appeared. The peak positions of the D and G bands in the Raman spectra of “HC-Co” show the typical ∼1341 cm−1 for D-band and ∼1570 cm−1 for G-band, accredited to defects and the vibration of the disordered atoms of carbon as well as the sp2-bonded carbon atoms in the 2D hexagonal lattice, respectively.7 The ratio of the areal intensity of ID/IG (0.85) in “HC-Co” was lesser, signifying a superior graphitized ratio of “HC-Co,” which is consistent with the XRD results. On comparing the “C”'s (pure carbon) XRD and Raman spectroscopy data shown in Fig. 1 and 2 respectively, momentous defects present in H3PO4 doped with cobalt(II) chloride in PVC carbon, i.e. “HC-Co,” were spotted, which are advantageous in order to have a better electrochemical performance of a cell.BET
The surface area of activated carbon is an important factor, which is determined by BET analysis. The pure carbon, i.e. “C” and H3PO4 doped with cobalt(II) chloride in PVC, i.e. “HC-Co,” offer the surface area of ∼4.9 and ∼738.283 m2 g−1, respectively. Fig. 3 shows the typical N2 adsorption-desorption BET isothermal of a sample of HC-Co, which is referred to as type-IV isotherm, showing H4-type hysteresis according to IUPAC classification.8 The sudden rising in the isotherm indicates the micropore (<2 nm) and plateau region mesopore (2–50 nm). Hence, the activated carbon derived from H3PO4 doped with cobalt(II) chloride in PVC offers micro- and mesopores. The H4-type of hysteresis is generally observed with complex materials containing both micropores and mesopores.9 The pore size present in activated carbon has been also estimated, and it was found that 0.84, 1.70, and 3.9 nm pores were available. Further, the supercapacitor has been fabricated using the high surface area with micro-meso pore activated carbon “HC-Co” derived H3PO4 doped with cobalt chloride in PVC.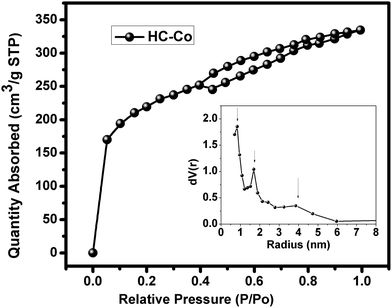 | ||
| Fig. 3 Nitrogen adsorption-desorption BET isothermal plot and pore size in activated carbon “HC-Co.”. | ||
TGA
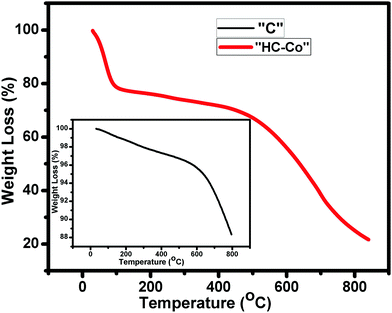
Fig. 4 illustrates the thermal disintegration of “C” (pure carbon) and “HC-Co” (H3PO4 doped with cobalt(II) chloride in PVC), which interprets the thermal constancy of the as-prepared porous carbon (PC). The TGA curve of “C” and “HC-Co” depicts the major weight loss around 600 °C and 500 °C, correspondingly. In the curve for “C,” the weight thrashing was initiated at ∼600 °C and reaches ∼88% at ∼800 °C. However, the other curve for “HC-Co” that was synthesized from the same precursor, PVC, depicts a weight thrashing in the early phase due to presence of water molecules and PC being thermally constant up to ∼500 °C. The decline in the thermal constancy in “HC-Co” comparatively with “C” is because of defects present in the “HC-Co.”Sem
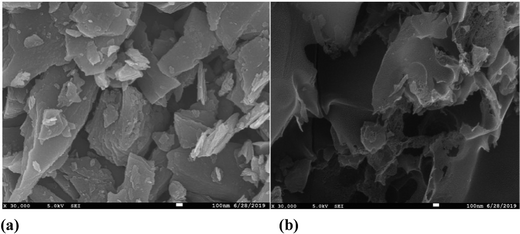
The SEM micrographs of pure carbon, i.e. “C,” and cobalt chloride doped carbon, i.e. “HC-Co,” in PVC divulges the porous nature of the as-prepared carbon, which is responsible for the ultra high capacitance of the developed supercapacitor in laboratory. SEM morphology for both samples, i.e. pure carbon “C” (a) and H3PO4 doped with cobalt(II) chloride in PVC, i.e. “HC-Co,” (b), is revealed in Fig. 5, and the micrographs of SEM were scaled up in 100 nm.Edax
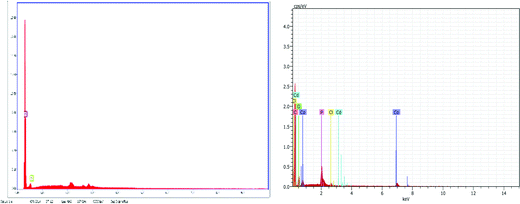
Fig. 6 demonstrates the energy dispersive X-ray (EDX) spectra of “C” and “HC-Co,” i.e. pure carbon and H3PO4 doped with cobalt(II) chloride based carbon, correspondingly. The sample “C,” i.e. pure carbon, confirms only the existence of carbon and oxygen, whereas the sample “HC-Co” confirms an opus of carbon, oxygen, and cobalt and thus reveals the complex nature of the developed porous carbon.Linear sweep voltammetry (LSV)
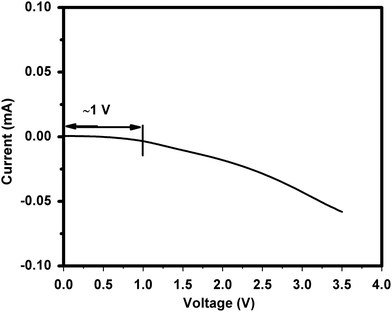
The electrochemical stability of the ionic liquid 1-ethyl-3-methylimidazolium thiocyanate as an electrolyte (operating voltage) is the most important phenomenon. The electrochemical stability window (ESW) has been carried out by LSV measurement. Fig. 7 shows the LSV profile of the present IL stability that is around 1 V, which affirms the suitability of the ionic liquid as electrolyte for developing supercapacitors.10,11Supercapacitor performance
The specific capacitance of the fabricated supercapacitor using the prepared carbon material, i.e. H3PO4 and CoCl2.6H2O doped in PVC, was measured via CV, EIS, and charge–discharge. A cyclic voltammetry (CV) graph with different scan rates (SR) at a voltage range of 0–1 V is revealed in Fig. 8(a). Additionally, the electrolyte IL 1-ethyl-3-methylimidazolium thiocyanate was soaked in a filter paper and sandwiched in between the prepared carbon material, layered on the current collector (CC), which was approximately 1 mg. At lower SR, i.e. 5 mV s−1 at 0–1 V for the cell fabricated, voltammograms confirm almost the undistinguished hysteresis loop of the square shape, which is a fundamental characteristic feature of an EDLC supercapacitor. The deviation from the shape at a higher scan rate is due to the equivalent series resistance (ESR), which is basically present due to the series resistance to the two electrodes and filter paper. The specific capacitance value has been calculated using cyclic voltammetry for all the cells using the following formula:| C = 2I/s·m, |
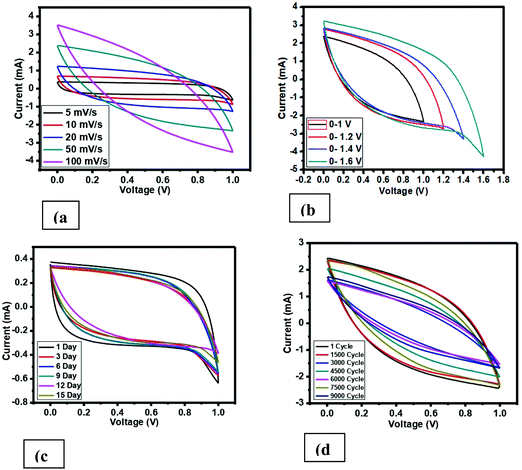 | ||
| Fig. 8 Cyclic voltammetry curve (a) with varying scan rate, (b) with varying voltage range, (c) on different days, (d) on 9000 cycles. | ||
The specific capacitance estimation using CV is roughly in a nice agreement with the specific capacitance calculated from low frequency impedance spectroscopy. The calculated data of the specific capacitance using cyclic voltammetry of the developed supercapacitor cell with varying scan rates based on PVC derived carbon materials is mentioned in Table 1, and the graph of cyclic voltammetry is shown in Fig. 8. From Table 1 and Fig. 8(a), it is clearly seen that there is a tremendous enhancement in the value of the specific capacitance compared to that of the pure PVC derived carbon,12 which is because of the wettability of the surface sandwiched electrolyte in between the two electrodes and porous nature of the prepared carbon. Additionally, the value of the specific capacitance has been seen to be scan rate dependent, which is also known in supercapacitors. Moving further, the specific capacitance value has been also estimated with varying voltage using CV at a 50 mV s−1 scan rate, which is shown in Fig. 8(b), and the value of the specific capacitance is listed in Table 1. The cell, i.e. pure carbon derived from PVC polymer, shows a small hysteresis curve shape having a very low specific capacitance.12 On the other hand, an imprecise square hysteresis curve shape seen over a broad voltage range (0–1.6 V) shows the supercapacitor behavior.
| Varying scan rate (mV s−1) (@ 0–1 V) | Varying voltage (V) (@ 50 mV s−1) | Varying days (@ 5 mV s−1) | 9000 cycles (@ 50 mV s−1) | Low frequency impedance spectroscopy (0.01 Hz) | |||||
|---|---|---|---|---|---|---|---|---|---|
| mV s−1 | F g−1 | V | F g−1 | Days | F g−1 | Cycles | F g−1 | Days | F g−1 |
| 5 | 127.4 | 0–1 | 62 | 1 | 127.4 | 1 | 66.8 | 1 | 115.4 |
| 10 | 114.3 | 0–1.2 | 77.8 | 3 | 106.0 | 1500 | 64.6 | 3 | 88.2 |
| 20 | 94.1 | 0–1.4 | 77.2 | 6 | 119.6 | 3000 | 26.7 | 6 | 111.1 |
| 50 | 62.0 | 0–1.6 | 92.0 | 9 | 121.6 | 4500 | 44.8 | 9 | 107.9 |
| 100 | 36.7 | — | — | 12 | 109.0 | 6000 | 29.7 | 12 | 102.5 |
| — | — | — | — | 15 | 109.8 | 7500 | 56.4 | 15 | 92.4 |
| — | — | — | — | — | — | 9000 | 34.7 | — | — |
Additionally, to check the stability of the prepared cell, the performance of the cell has been recorded in various cycling and different number of days using CV. Fig. 8(c) demonstrates the CV profile at 5 mV s−1 and very small deviation has been observed. Similarly, Fig. 8(d) offers the cycling stability for 9000 cycles at 50 mV s−1. The specific capacitance value was also estimated for both cases and also listed in Table 1.
Low frequency impedance spectroscopy (LIS)
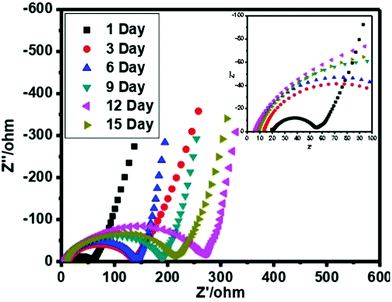
In order to check the specific capacitance of the cell, typical complex low frequency impedance spectra are shown in Fig. 9. In an ideal capacitor, the performance of the impedance graph illustrates the line that is straight and parallel to the imaginary axis of a plot. The behavior of the impedance plot for a cell demonstrates a curved thrust in the high frequency area pursued by a vertical escalating behavior over the low frequency of 10 mHz. The vertical escalating behavior in the low frequency area shows the capacitive behavior of the cells. On the other hand at the high frequency area, the behavior reveals the bulk properties of the electrolyte and interfacial transfer processes of the charge.The specific capacitance value is also estimated by EIS at the frequency of 10 mHz and listed in Table 1. We have evaluated the specific capacitance using EIS by the following formula:
| C = −1/ω Z′′. |
Galvanostatic charging and discharging
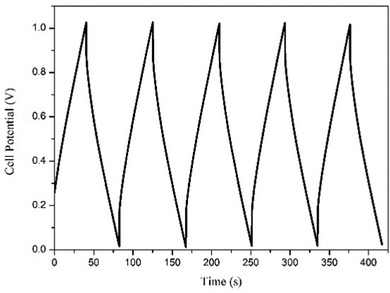
Galvanostatic charge–discharge performance was carried out to inspect the various electrochemical properties of the fabricated EDLC. A current of 1 mA was applied for the charge and discharge processes. The first 5 cycles of the charge–discharge process are shown in Fig. 10. The discharge specific capacitance of 168 F g−1 for the 1st and 152 F g−1 for the 500th cycles in the voltage range 0–1 V, representing approximately a 5% decrease in performance, which shows the stable nature of the EDLC cell, which is also close to the specific capacitance calculated using cyclic voltammetry and impedance spectroscopy. The EDLC cell also delivers a coulombic efficiency of 95–97%, energy density of 24.36–21.53 Whkg−1 and power density of 2040 W kg−1, which proves the fabrication of a highly efficient EDLC cell.The EDLC cell is also further tested for 500 cycles using the charge–discharge technique. Coulombic efficiency, discharge specific capacitance, energy density and power density over the 500 cycles has been calculated and plotted in Fig. 11. It is clearly observed that the EDLC cell have lost very little performance over the cycles.
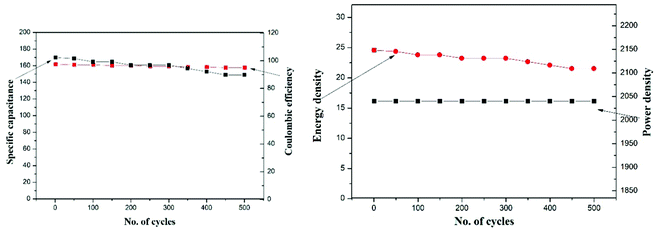 | ||
| Fig. 11 Stability of the developed supercapacitor in terms of specific capacitance, coulombic efficiency, energy density and power density over 500 cycles of charge/discharge. | ||
Conclusion
Herein, we have successfully developed PC obtained through PVC, i.e. H3PO4 doped with cobalt(II) chloride in PVC “HC-Co.” XRD data showed the amorphous nature of “C” and for the “HC-Co” sample revealed a reduction in the peak broadening, implying the presence of defects and a large graphitization degree. Raman spectra revealed a vibration of disordered carbon atoms having defects and the sp2-bonded carbon atoms in the 2D hexagonal lattice, respectively. The ratio of areal intensity ID/IG (0.85) in “HC-Co” was lesser, signifying a superior graphitized ratio in H3PO4 doped with cobalt(II) chloride in PVC “HC-Co,” which was consistent with the XRD outcome. BET analysis revealed the porosity of the prepared carbon material. TGA data showed the thermal stability of “HC-Co” synthesized from the precursor PVC, weight thrashing occur in the initial phase due to water particles and PC being thermally steady up to ∼500 °C. The decline in the thermal constancy in “HC-Co” compared to “C” was because of defects present in the “HC-Co.”Finally, the supercapacitor has been successfully fabricated using carbon as an electrode material derived from the PVC polymer and IL (1-ethyl-3-methylimidazolium thiocyanate) as electrolyte. The specific capacitance has been estimated to be 120 F g−1 at 5 m V s−1, which is a huge hike in the specific capacitance compared to the pure carbon's derived from PVC, which is below 10 F g−1 at 5 mV s−1. The supercapacitor cell is highly stable, which is estimated by measuring its specific capacitance up to 15 days and up to 9000 cycles using cyclic voltammetry.
Conflicts of interest
There are no conflicts to declare.References
- Y. Hu, O. A. Shenderova, Z. Hu, C. W. Padgett and D. W. Brenner, Rep. Prog. Phys., 2006, 69, 1847 CrossRef CAS.
- J. Yin, W. Zhang, N. A. Alhebshi, N. Salah and H. N. Alshareef, Small Methods, 2020, 4, 1900853 CrossRef CAS.
- C. Wang, B. Yan, J. Zheng, L. Feng, Z. Chen, Q. Zhang, T. Liao, J. Chen, S. Jiang, C. Du and S. He, Adv. Powder Mater., 2022, 1, 100018 CrossRef.
- P. S. Dhapola, N. G. Sahoo, B. Bhattacharya, Y. Kumar, P. K. Singh and M. Gupta, Macromol. Symp., 2019, 388, 1900035 CrossRef CAS.
- L. Sun, C. Wang, Y. Zhou, Q. Zhao, X. Zhang and J. Qiu, J. Solid State Electrochem., 2014, 18, 49–58 CrossRef CAS.
- H. Shang, Y. Lu, F. Zhao, C. Chao, B. Zhang and H. Zhang, RSC Adv., 2015, 5, 75728–75734 RSC.
- J. Zhou, J. Lian, L. Hou, J. Zhang, H. Gou, M. Xia, Y. Zhao, T. A. Strobel, L. Tao and F. Gao, Nat. Commun., 2015, 6, 8503 CrossRef CAS.
- M. K. Singh, M. Suleman, Y. Kumar and S. A. Hashmi, Energy, 2015, 80, 465–473 CrossRef CAS.
- M. Bee, R. E. Lechner, J. P. Amoureux and R. Fouret, J. Phys. C-Solid State Phys., 1983, 16, 4973–4983 CrossRef CAS.
- D. Wang, J. Nai, H. Li, L. Xu and Y. Wang, Carbon, 2019, 141, 40–49 CrossRef CAS.
- D. Wang, Y. Wang, H. Liu, W. Xu and L. Xu, Chem. Eng. J., 2018, 342, 474–483 CrossRef CAS.
- A. Singh, P. S. Dhapola, S. Singh, P. K. Singh, A. S. Samsudin, N. G. Sahoo and H. W. Rhee, High Perform. Polym., 2020, 33, 469–475 CrossRef.
| This journal is © The Royal Society of Chemistry 2022 |

