
 Open Access Article
 This Open Access Article is licensed under a
 Creative Commons Attribution 3.0 Unported Licence
Green solvent engineering for enhanced performance and reproducibility in printed carbon-based mesoscopic perovskite solar cells and modules†
C.
Worsley
 *,
D.
Raptis
,
S. M. P.
Meroni
,
R.
Patidar
,
A.
Pockett
,
T.
Dunlop
,
S. J.
Potts
,
R.
Bolton
,
C. M. E.
Charbonneau
,
M.
Carnie
,
E.
Jewell
and
T.
Watson
*
*,
D.
Raptis
,
S. M. P.
Meroni
,
R.
Patidar
,
A.
Pockett
,
T.
Dunlop
,
S. J.
Potts
,
R.
Bolton
,
C. M. E.
Charbonneau
,
M.
Carnie
,
E.
Jewell
and
T.
Watson
*
SPECIFIC, Faculty of Science and Engineering, Swansea University, UK. E-mail: 938002@swansea.ac.uk; T.M.Watson@Swansea.ac.uk
First published on 30th November 2021
Abstract
Mesoscopic carbon-based perovskite solar cells (CPSCs) are frequently described as a potential frontrunner for PSC commercialization. Previous work has introduced γ-valerolactone (GVL) as a sustainable, non-toxic, green alternative to GBL for CPSC perovskite precursors. In this work, methanol (MeOH) solvent additives are applied to enhance the performance and reproducibility of GVL-based precursors, through improving electrode wetting, infiltration, and perovskite crystal quality. Precursors incorporating 10% MeOH are found to substantially enhance reproducibility and performance, achieving a champion PCE of 13.82% in a 1 cm2 device and >9% in a 220 cm2 module fabricated in ambient conditions. Stability is also improved, with an unencapsulated MeOH device exhibiting a T80 of >420 hours at 50 °C in ambient humidity under continuous AM1.5 illumination. This work established GVL-based precursors as commercially attractive and provides an example of how green solvent engineering can be applied in the development, amelioration and scale-up of novel photovoltaics.
1. Introduction
Since their advent in 2009, lead halide perovskite solar cells (PSCs) have progressed rapidly to power conversion efficiencies (PCEs) of 25.5%, approaching that of monocrystalline silicon devices. These semiconductors are inexpensive and amenable to low-cost solution-based processing, as well as exhibiting excellent carrier mobility, high absorption coefficients, tuneable bandgaps and unusual defect tolerance.1–4 However, the lab-scale spin coating processes frequently used to achieve high performance are inherently unsuitable for large-scale production, representing a barrier to commercial viability.5,6Mesoscopic carbon-based perovskite solar cells (CPSCs) are frequently described as a potential frontrunner for PSC commercialization, as they are fabricated using easily scaled manufacturing processes and use stable, low-cost carbon electrodes in place of costly and unstable organic hole transport materials such as SPIRO-OMe-TAD.7,8 Cell and modules are fabricated via sequential screen printing of thick mesoporous TiO2, ZrO2 and carbon layers, before drop casting of the perovskite precursor.9–12 Modules of up to 198 cm2 are already present in the literature, as well as examples applying common industrial techniques such as Near-infra-red (NIR) annealing and inkjet printing.13–15
This architecture has also demonstrated remarkable stability. While the mesoscopic scaffold provides mechanical stability the hydrophobic carbon electrode also helps prevent moisture access, limits O2 entry and prohibits the loss of volatile methylammonium species.16 Stability can be further enhanced by incorporating 5-aminovaleric acid (AVA) to improve precursor infiltration and induce stable 2D/3D crystal formations at the perovskite–TiO2 interface, which limits superoxide production.7,17–19 Polyurethane/glass encapsulated MAPbI3 devices produced using 3% AVA additives in γ-butyrolactone (GBL) precursors have recently passed stringent IEC61215:2016 tests, including damp heat tests (85 °C at 85% RH, for 1100 h), thermal cycling (−40–85 °C for 200 cycles), ultraviolet preconditioning tests (60 °C, 50 kW h m−2), and MPPT light soaking (55 °C, 9000 h).19
However, significant barriers to commercialisation are still present. For example, the γ-butyrolactone (GBL) in the previous examples is a psychoactive, and legally restricted in many countries.20 This can introduce legislative costs for large scale production and significantly hamper lab scale research where access is restricted. Other CPSCs rely mostly on precursors with highly toxic DMF solvent mixes, which are environmentally harmful and present significant health risks at scale.21–23
Previous work introduced γ-valerolactone (GVL) as a sustainable, non-toxic, green alternative to GBL.24 Optimised precursor concentrations (1.1 M) and annealing temperatures (45 °C) were shown to produce AVA-containing MAPbI3 devices of comparable performance and stability to standard GBL precursors, with devices achieving a champion PCE of 12.9% in a 1 cm2 active area.24 Additionally, GVL precursors were shown to produce more oriented perovskite be more stable towards room temperature precipitation-advantageous when considering large-scale deposition methods such as inkjet printing as ink crystallisation can clog equipment nozzles and significantly impact production.14,24
However, GVL is slightly more viscous than GBL, and precursors demonstrated peak efficiency at higher concentration (1.1 M GVL, 0.95 M GBL).24–26 GVL precursors may therefore be significantly more viscous than standard GBL formulations. This can be significantly detrimental in CPSCs, as to produce a functional device, precursor must infiltrate through over 15 μm of mesoscopic material and leave minimal perovskite-free voids. Highly viscous or poorly wetting perovskite precursors can struggle to penetrate all three layers and enter smaller pores deep within the TiO2 electron transport layer (ETL), negatively impacting charge extraction.
GBL precursors are sometimes heated prior to infiltration to remove precipitates and reduce viscosity.24,27 However, this increases the energetic cost of fabrication and is impractical at large scale. Additionally, 60 °C heating can induce unwanted perovskite crystal formation within the solution.24 Therefore, a different approach to heating is required for GVL.
Small additions of highly polar solvents have been used in many architectures to improve perovskite crystal quality and coverage. For example, addition of highly coordinating DMSO to DMF-based precursors improves grain size, coverage and crystallinity in conventional NIP and PIN sandwich architectures.28,29 In CPSCs, GBL devices have been found to reproducibly exhibit improved performance when diluted with 15% ethanol due to reductions in viscosity and improved precursor wetting.27
GVL is commercially attractive as it is a non-toxic green solvent available from renewable sources.30 It is also readily biodegradable, exhibits low toxicity to aquatic organisms, and has recently experienced a significant price drop in Europe.31 To maintain these advantages, any solvent additions to GVL-based precursors should be cheap, similarly sustainable, biodegradable and present a relatively low toxicity risk. Small molecule alcohols such as ethanol and methanol (MeOH) fit this profile and are already mass-produced at low cost.
In this work, methanol is used as a solvent additive to improve the performance and reproducibility of CPSCs fabricated with GVL-based MAPbI3 precursors.
2. Results and discussion
CPSCs are unique in that precursors must percolate through over 15 μm of mesoscopic material to produce a functional device. The lack of a crystalline perovskite capping layer introduces the need for dense, high quality perovskite formation throughout the three layers: for a high performing device, consistent infiltration with minimal perovskite-free voids is essential. Precursor infiltration can be influenced by several factors, including viscosity, wetting, colloidal diameters and crystallisation dynamics.8,27,32,33 The following section will therefore examine the impact of MeOH addition on precursor viscosity, wetting, colloidal composition, and the resultant MAPbI3 crystal properties.2.1 Precursor behaviour and optical characterisations
GVL is slightly more viscous than GBL (1.9 cP and 1.7 cP respectively), and GVL precursors perform best at higher concentrations (1.1 M GVL, 0.95 M GBL).24 Optimised GVL precursors may therefore be significantly more viscous than standard GBL formulations. Highly viscous solutions can struggle to penetrate small pores deep within the TiO2 ETL, leading to wetting problems, poor perovskite/electrode contact and decreases in device performance and reproducibility.27,33,34 Although MAPbI3 is typically insoluble in MeOH, small amounts of this highly polar, low viscosity (0.54 cP) solvent could drastically reduce precursor viscosity and improve TiO2 wetting and infiltration.35 The viscosities and wetting properties of various GVL–MeOH mixtures were therefore examined and compared with standard GBL precursors (Fig. 1).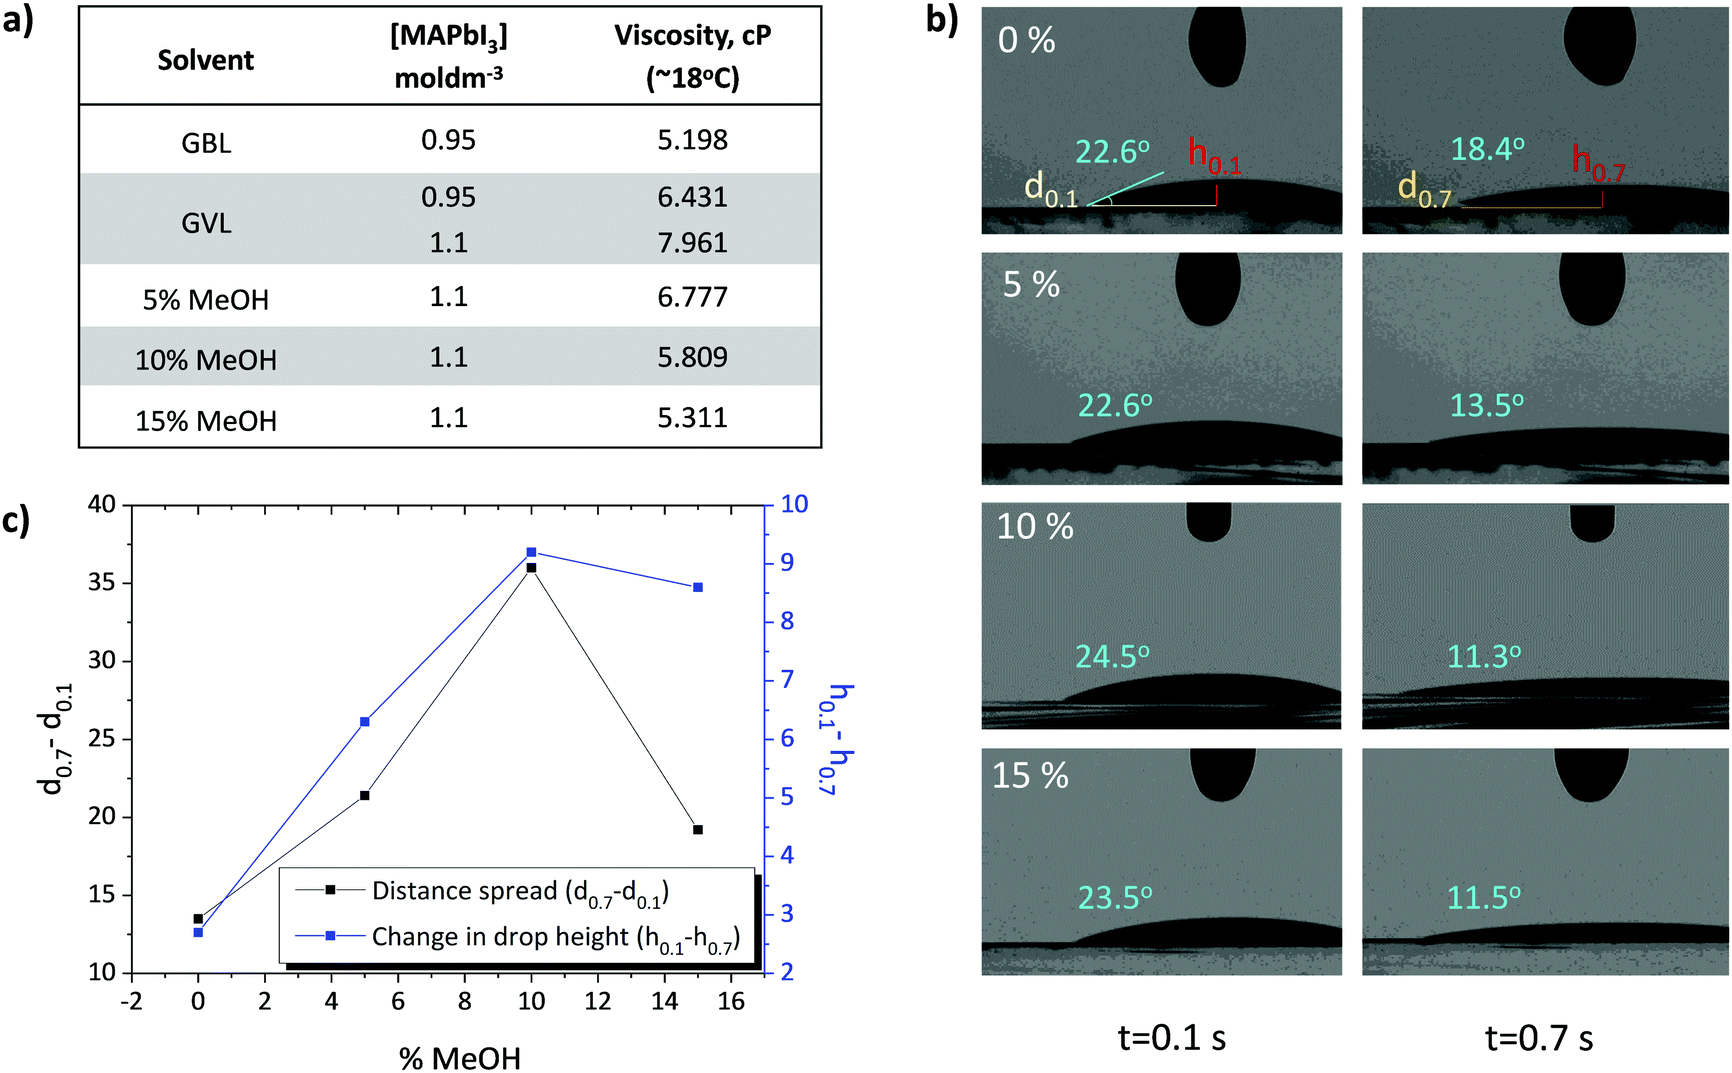 | ||
| Fig. 1 (a) Measured viscosities of GBL, GVL only and GVL:MeOH precursors at 18 °C. Presented viscosities are average values from 10–12 empirical measurements. (b) Photos from contact angle measurements of precursors with various GVL–MeOH mixes at t = 0.1 s and t = 0.7 s after deposition onto mesoporous TiO2 (∼800 nm). The contact angle is presented in blue. (c) Plot of horizontal distance travelled (Δd), and magnitude change in droplet height (Δh) measurements between t = 0.1 s and t = 0.7 s during contact angle measurements. Examples of distance (d) and height (h) measurements used for plotting (c) are shown on the 0% samples. | ||
As shown in Fig. 1a, 0.95 M GVL precursors were found to be over 24% more viscous than those made using GBL. The previously optimised 1.1 M GVL precursor was more viscous again, at 7.96 cP (Fig. 1a). Such high viscosities could impede precursor wetting and access to smaller pores within the stack, preventing good perovskite–electrode contact and decreasing device performance.14,27,34
Further rheological tests showed that GVL–MeOH precursors exhibited a linear reduction in viscosity up to 10% MeOH (Fig. 1a). Interestingly, increasing the solvent ratio from 10–15% MeOH had a less significant impact on precursor viscosity than previous additions. This is potentially a consequence of the poor solubility of MAPbI3 in MeOH, which will limit the proportion of MeOH that can be added without inducing precipitation.
The impact of viscosity on electrode wetting is confirmed with contact angle analysis, where GVL–MeOH precursors dropped onto TiO2 layers show increased spread rate and height reduction (Fig. 1b and c). In good agreement with the viscosity data, spreading rates rose linearly with MeOH proportion up to 10%, before dropping slightly upon increasing to 15%. In addition to increased horizontal spread showing improved wetting, faster droplet height reduction suggests that more precursor has entered the mesoporous layer in GVL–MeOH samples. This indicates that GVL–MeOH precursors will exhibit superior infiltration when applied to device stacks.
Precursor viscosity clearly impacts on the rate of electrode wetting. However, changing the solvent composition of a precursor can also impact colloidal composition, crystallisation dynamics and the quality of the formed perovskite.33,34 For example, changing the polarity of the solvent mixture can cause significant changes to the precursor ink and the quality of formed perovskite: less polar aprotic solvents of lower Gutman donor numbers (Dn) such as GBL or GVL coordinate less easily to Pb2+ centres, leading to increased Pb–I interactions, larger colloidal networks and correspondingly larger crystals with fewer defects.30,36 Given the insolubility of MAPbI3 in MeOH, and its high polarity and low boiling point, it is possible that its incorporation could have a negative influence on precursor properties, or those of the crystallised perovskite. To obtain high quality perovskite layers and devices it is therefore key to understand the influence of the MeOH on the colloidal nature of the precursor and the properties of the annealed film.
To probe the colloidal composition of the mixed systems, diluted precursors were therefore subjected to UV-Vis analysis (Fig. 2). This technique can be used to compare solvent coordination to Pb2+ centres, which has been shown to correlate to changes in the colloidal diameters of more concentrated solutions: Where Pb2+–solvent coordination is less favourable, a larger amount of I− interact with the metal ions, increasing the relative concentration of highly coordinated iodoplumbates and changing the relative absorption intensities of solvated PbI2, PbI3− and PbI42−.27,36,37 Increased relative absorption of the PbI3− and PbI42− peaks have been shown to correspond to increased colloidal diameters in GBL, GBL: Ethanol and DMF: DMSO based perovskite precursors.27,36,37
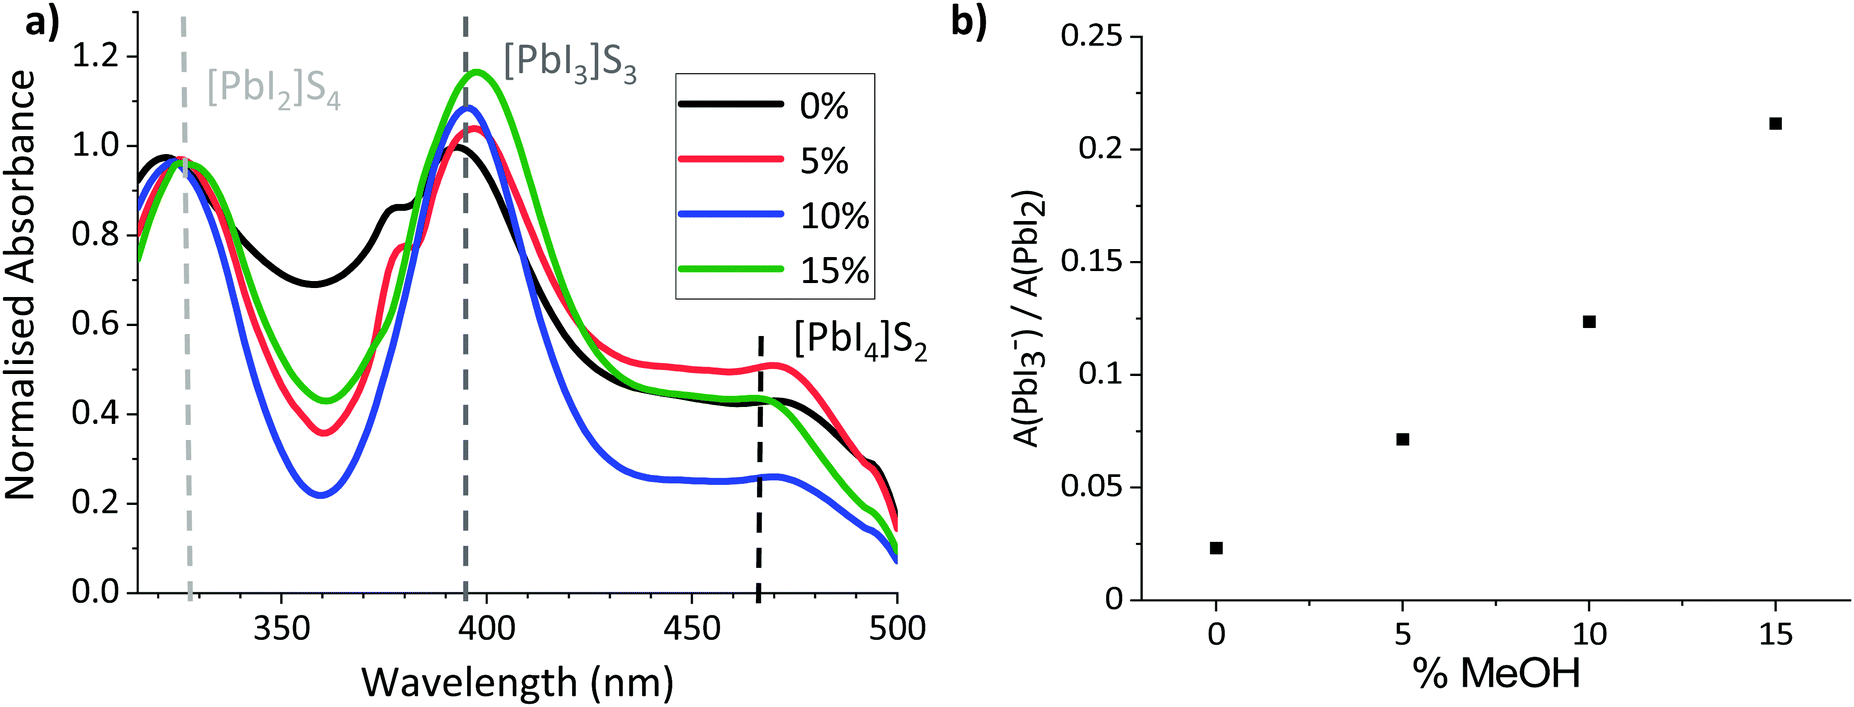 | ||
| Fig. 2 (a) UV-Vis absorption spectra of MAPbI3 in GVL–MeOH mixtures with 0, 5, 10 and 15% MeOH. It should be noted that the peaks at 380 nm in the 0 and 5% samples are caused by an equipment artefact and do not represent an absorption peak. (b) Change in height ratio of the PbI2 and PbI3− peaks with % MeOH. | ||
As shown in Fig. 2b, the relative intensity of the PbI3− peak increased linearly with the proportion of MeOH, suggesting that solvent–Pb2+ interaction is less favourable in the GVL–MeOH systems. Lower solvent–solute coordination for MeOH systems is logical in this case, as both PbI2 and MAPbI3 are insoluble in MeOH. This result suggests that MeOH incorporation induces the formation of larger colloids, which could in turn produce higher quality MAPbI3 crystals.32
However, although larger colloidal networks have previously been found to produce higher quality, more oriented crystals, including a more volatile solvent in the precursor formulation could also induce fast nucleation of less crystalline perovskite.32,36,37
In MAPbI3 perovskites, crystallinity and orientation can be compared by analysing relative peak breadths and intensities of XRD traces.38 For example, an increase in the relative intensity of the 2θ = 14.13° (110) peak indicates preferential growth of the tetragonal phase in the (110) direction, while a decrease of the full width at half maximum (FWHM) occurs with improved crystallinity.39 X-Ray diffraction scaffolds were therefore performed on MAPbI3 crystallised from GVL only and GVL–MeOH mixed in ZrO2 scaffolds. ZrO2 scaffolds were used over glass substrates to provide the most accurate representation of infiltrated CPSCs: precursors crystallised in the absence of a scaffold exhibit much larger crystals and can have different morphology and orientation.
As shown in Fig. 3a, all three MeOH samples exhibited much higher relative intensity of the 2θ = 14.13° (110) signal as well as significantly narrower peaks (Fig. 3c). MeOH incorporation to the precursor therefore produces higher quality crystals during device annealing. Interestingly, the 10% samples also consistently showed a particularly intense 2D peak at ∼5.8° (Fig. 3b), although there was no significant trend observed between ∼5.8° peak height and MeOH content.
 | ||
| Fig. 3 (a) XRD of MAPbI3 perovskites annealed from different GVL–MeOH solvent mixtures in inert mesoporous ZrO2 scaffolds. ZrO2 signals have been removed for clarity. (b) Magnified 2D peak at 5.8°. (c) Table showing peak heights, widths, and peak height ratios of the 14° (110) and 28° (220) signals. | ||
The increased crystallinity is likely a consequence of larger colloidal diameters in GVL–MeOH precursors, caused by the decreased solvent–Pb2+ coordination observed with UV-Vis analysis (Fig. 2).40 Such crystallinity enhancements have been shown to improve device performance and stability, as crystals with fewer defects experience less carrier recombination and have fewer sites for ambient O2 or water to bind.41
MeOH inclusion could also impact crystal nucleation and the speed of crystal growth. Precursors continue to percolate into the stack in the initial stages of annealing, and very fast nucleation or crystal growth at heat onset can produce blockages, preventing full infiltration.42 Larger colloidal networks can be prone to faster nucleation, and the high volatility of MeOH could exacerbate this. To observe whether MeOH inclusion impacted on the speed of perovskite nucleation and crystal growth, the crystallisation of GVL and GVL–10MeOH based precursors was monitored during initial CPSC infiltration and perovskite annealing. Precursor solutions were drop cast onto stacks on the XRD stage, and evolution of the 2θ = 14.13° (110) peak in the ZrO2 layer monitored using PSD (position sensitive detector) fixed scans from 2θ = 13–15.26° every fifteen seconds during room temperature stack percolation and subsequent 45 °C perovskite annealing.
Both solvent systems exhibited similar crystallisation behaviour, with crystallisation onset occurring at 1174 s and 1275 s for GVL only and GVL-10MeOH respectively (Fig. 4). Interestingly, while standard γ-butyrolactone (GBL)-based precursors have been found to form stable crystallite populations during the initial annealing stage, this was not the case for either solvent here: once initiated, crystallisation progressed rapidly to completion in both samples.43 Samples generally formed a single peak at 2θ ≈ 14° during annealing, which separated to two overlapping peaks at 2θ ≈ 13.9° and 2θ ≈ 14.1°. This is consistent with heat induced cubic to tetragonal phase transitions, commonly observed in MAPbI3 systems.44
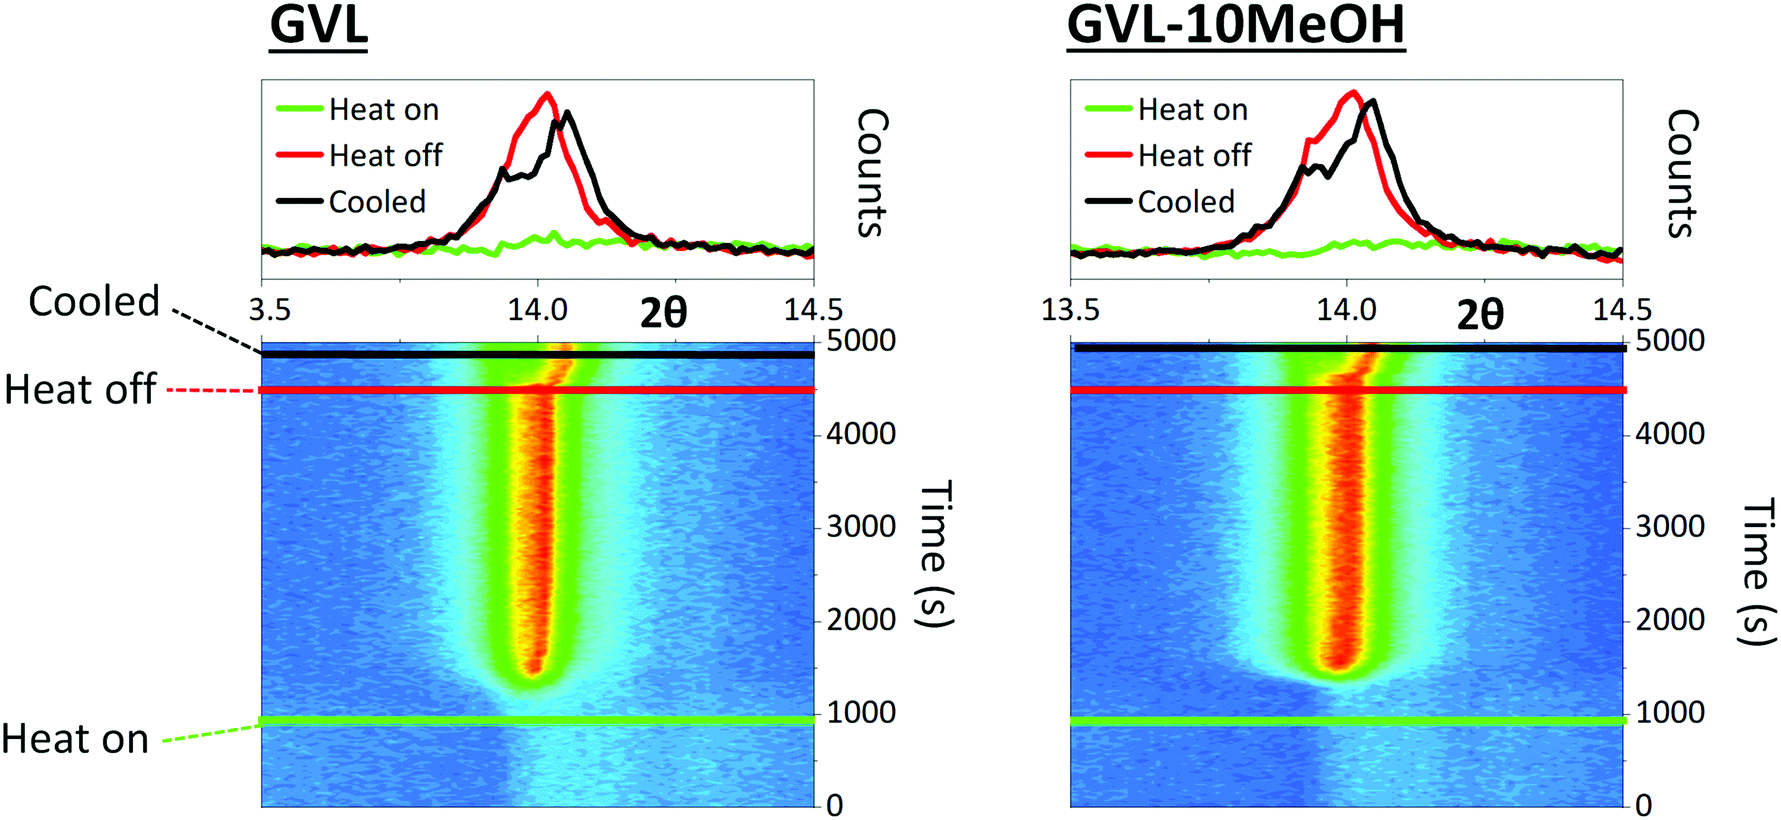 | ||
| Fig. 4 2D contour maps and monitoring the evolution of the 2θ = 14.3° peak over time during stack infiltration and annealing at 45 °C. Measurements were taken every 15 s for the duration. Coloured lines correspond to the time of heat onset, heat removal and cooled sample. Corresponding 1D profiles display the 14.3° peak at each stage. Peak evolution was monitored in the ZrO2 layer as the carbon electrode can introduce a large peak and amorphous baseline that prevents accurate analysis. | ||
Although the GVL only sample begins crystallising slightly earlier and takes longer to finish annealing in this case, this was not true of all samples (S1). Slight variations in crystallisation onset time, annealing duration and peak evolution were observed in each test, but no consistent differences were observed between the two solvent systems. Indeed, the variation observed between tests was far greater than that observed between samples on each day, suggesting that that both solvent systems exhibit similar crystallisation times regardless of the environmental conditions.
As GVL has a high boiling point of 207 °C and samples were annealed at 45 °C, lower crystallinity in GVL only samples could potentially be a consequence of solvent retention. This would likely be less problematic in GVL–MeOH systems due to the high volatility of MeOH. FTIR measurements were therefore performed on MAPbI3 crystallised from GVL only and GVL–10MeOH precursors in ZrO2 scaffolds to check for the presence of a C![[double bond, length as m-dash]](https://www.rsc.org/images/entities/char_e001.gif) O lactone peak at 1600 cm−1. The appearance, or significant growth of this peak could indicate that a significant amount of GVL remained in the completed device after perovskite annealing. Presented in S2, there was no significant difference between the two samples. The lower sample crystallinity observed in GVL only devices is not therefore a consequence of significant solvent retention, and is instead likely a consequence of larger colloidal diameters due to decreased solvent–Pb2+ coordination in GVL–MeOH systems (Fig. 2).32
O lactone peak at 1600 cm−1. The appearance, or significant growth of this peak could indicate that a significant amount of GVL remained in the completed device after perovskite annealing. Presented in S2, there was no significant difference between the two samples. The lower sample crystallinity observed in GVL only devices is not therefore a consequence of significant solvent retention, and is instead likely a consequence of larger colloidal diameters due to decreased solvent–Pb2+ coordination in GVL–MeOH systems (Fig. 2).32
The lower viscosity and increased crystallinity of the annealed GVL–MeOH precursors are likely to benefit device performance. In particular, the GVL–10MeOH was considered a good candidate for improving device performance, as it exhibited the fastest wetting. The next section will therefore examine the impact of MeOH incorporation on device performance.
2.2 Device infiltration and performance
The lower viscosity, improved electrode wetting and higher annealed crystallinity of GVL–MeOH precursors could all enhance device performance. Devices were therefore fabricated with GVL–MeOH mixes of 0, 5, 10 and 15% MeOH to determine the optimal solvent mix. The lower viscosity and increased crystallinity of the annealed GVL–10MeOH mix made it the most probable candidate for improving device performance, as it was considered most likely to produce well infiltrated, high quality perovskite crystals.This is confirmed in Fig. 5a and b, where GVL–10MeOH show significantly improved reproducibility, producing the highest PCEs across three batches. Results from the highest performing batch are presented in Fig. 5a, where the GVL–10MeOH produced an average PCE of 13.0 ± 0.5% and champion result of 13.8%, compared to 11.4 ± 0.8% and 12.6% for GVL only (Fig. 5c). Performance enhancements were mainly due to improvements in device Voc and FF: GVL–10MeOH devices exhibited average Voc of 0.91 V and FF of 59%, compared to 0.88 V and 50% for GVL only. Full box plots of all photovoltaic device parameters are presented in S3.
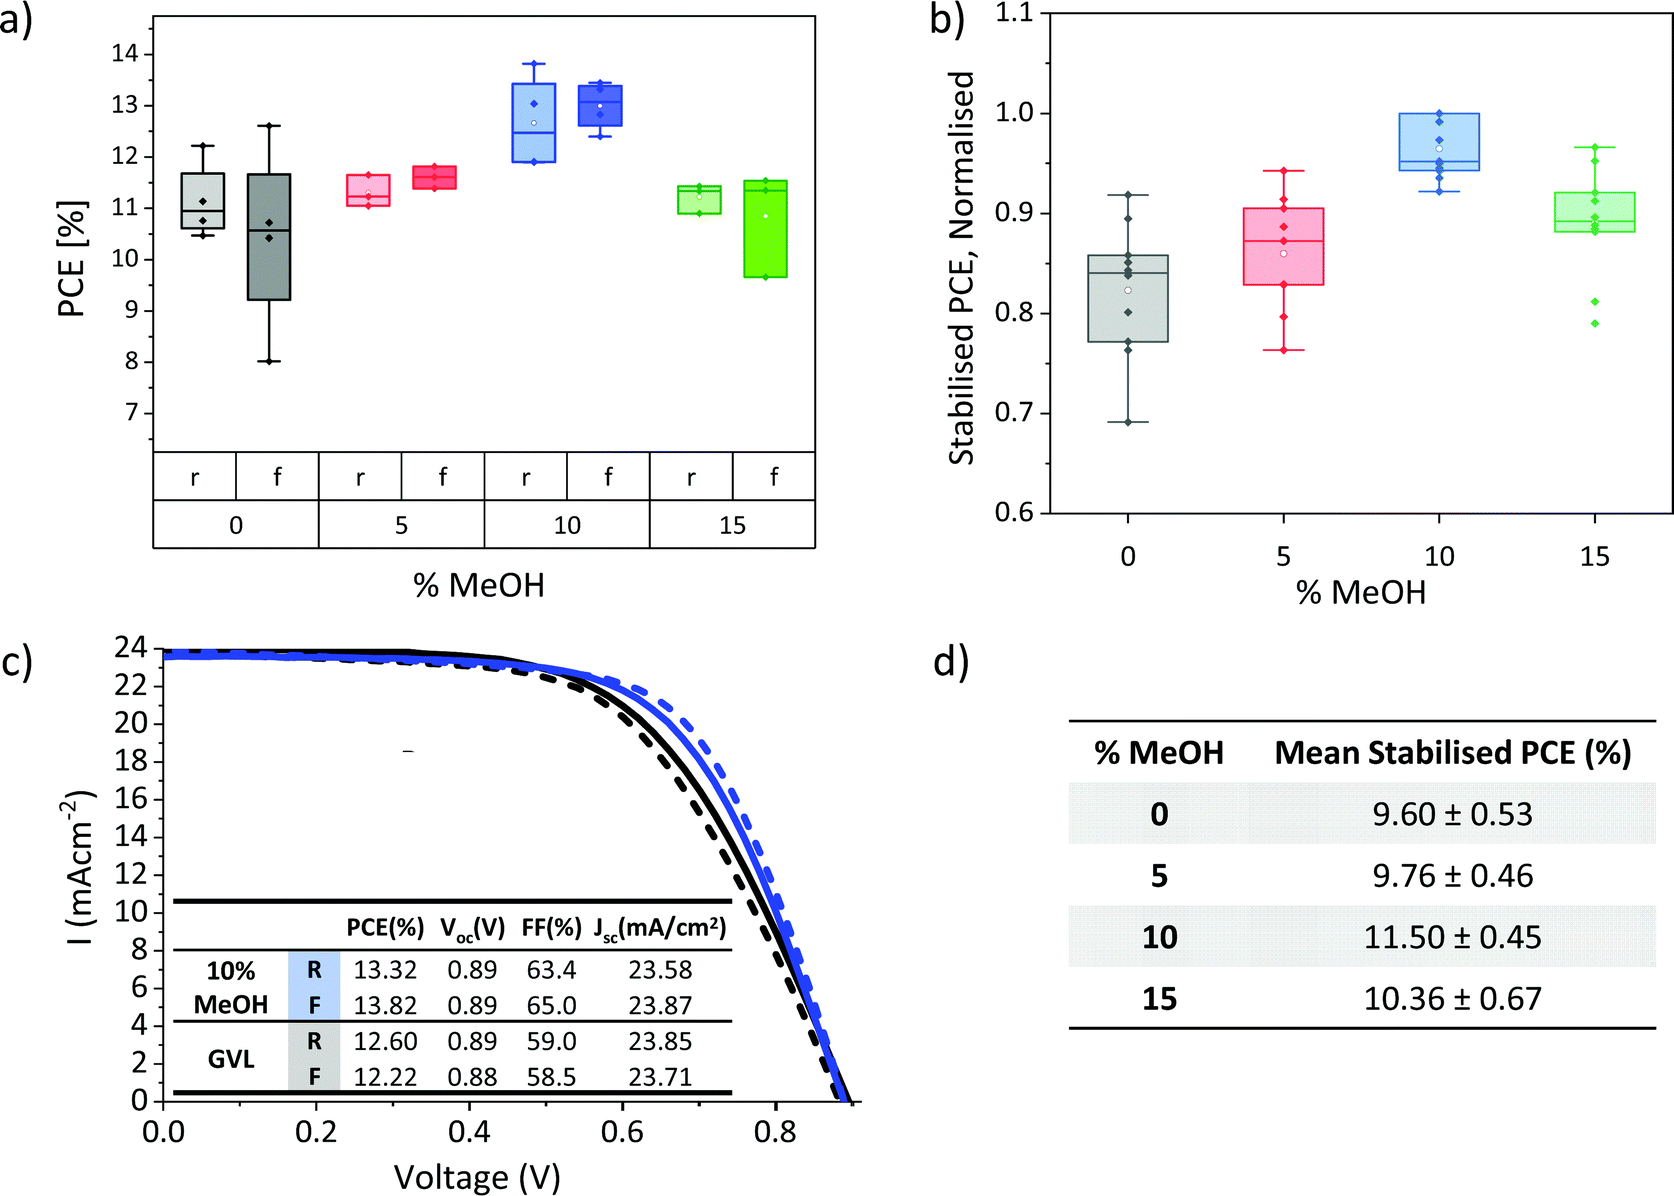 | ||
| Fig. 5 (a) Box plot of IV PCEs for GVL–MeOH devices with different % MeOH (four samples for each set), (b) box plot of normalised stabilised current PCEs from 3 batches (10–12 devices for each set), (c) IV curves of the champion GVL–10MeOH and GVL only devices with inlaid table showing IV parameters, (d) table showing average stabilised current PCEs obtained from the highest performing batch (four samples for each set). | ||
It should be noted that although the hysteresis in this set is flipped in GVL–MeOH devices, this was not the case in all batches. Differences between batches could have many contributing causes-slight variation in layer thicknesses, roughness and perovskite infiltration could all conceivably influence hysteresis and device performance. Optimisation tests should therefore always be carried out using devices infiltrated at the same time from the same print batch, to limit the impact of printing variations and maintain similar environmental conditions during infiltration and annealing.
Stabilised PCEs should also be obtained, as the removal of hysteresis can provide a clearer indication of trends in device performance. Stabilised current data for several different batches are presented in Fig. 5b and d. The normalised results from three separate batches give a clearer indication of performance trends and confirm that the GVL–10MeOH devices exhibit significantly improved performance and reproducibility. Average stabilised current data for devices from the best performing batch is presented in Fig. 5d).
Elucidating the reasons behind device performance enhancement can be difficult, as many different factors can concurrently contribute to a given performance increase. For example, the improvements in precursor wetting and perovskite crystallinity observed with MeOH addition could both separately improve performance, the former through improving stack infiltration and perovskite–electrode contacts and the latter via improving perovskite conductivity and reducing trap and defect associated losses.45,46
To visually gauge the quality of infiltration and the extent of perovskite filling deeper within the stack, cross sectional SEM images were taken (Fig. 6 and Fig. S4, S5, ESI†). As printing defects or thickness changes can significantly impact infiltration, devices were compared within the same printing batch to maintain similarity between stacks.47
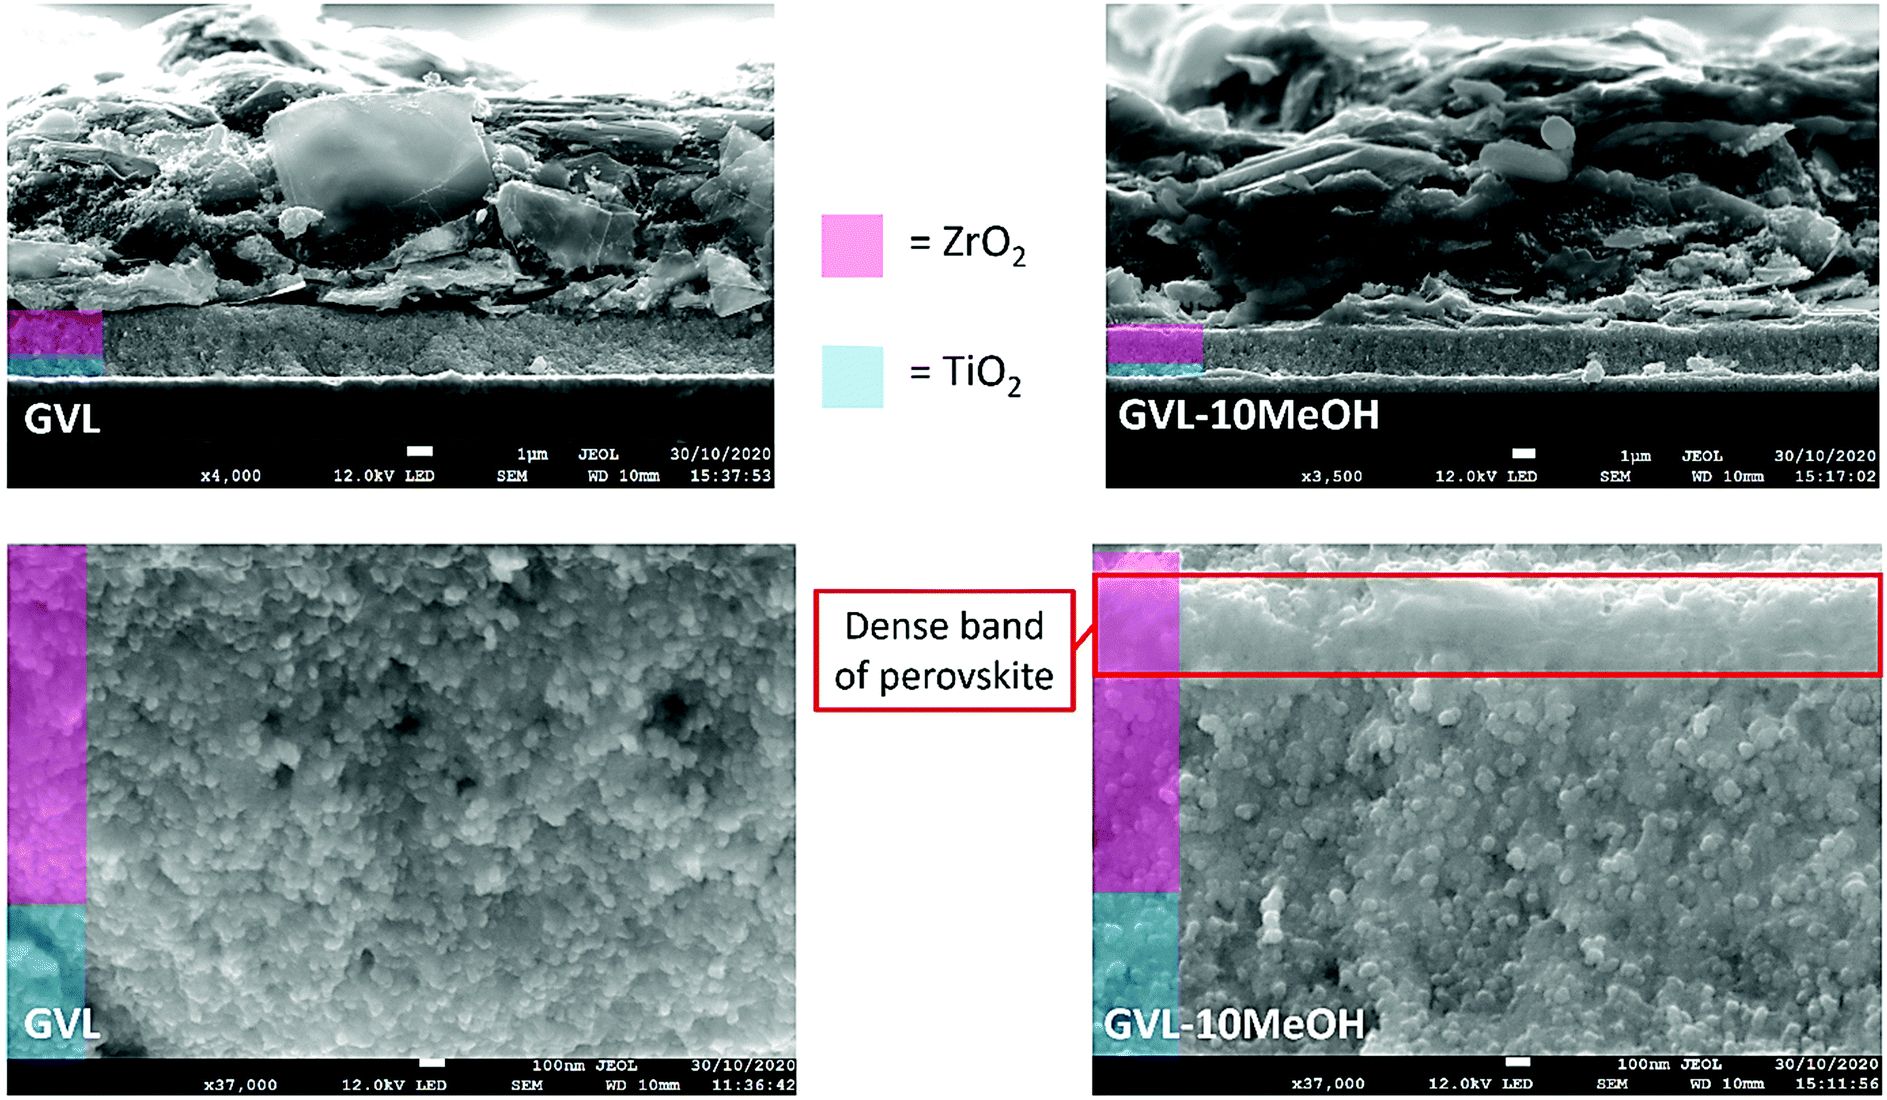 | ||
| Fig. 6 Cross sectional images of devices made using GVL only or GVL–10MeOH. A dense band of perovskite is present at the ZrO2/C interface in the 10% samples (red box). | ||
Two main types of infiltration issue can occur; large uninfiltrated areas of μm-scale caused by large horizontal graphite flakes in the carbon electrode blocking precursor and small voids where precursor has failed to enter small pores.47 Such problems in the TiO2 layer can impede charge extraction, while issues with ZrO2 filling can impact charge transport through the stack and increase recombination.47
Cross sectional imaging showed some areas with perovskite-free holes of similar size and distribution in all samples (Fig. 6 and Fig. S4, ESI†). However, a dense band of perovskite at the ZrO2/carbon interface was present in the GVL–10MeOH samples and GVL–10MeOH presented some areas of particularly dense ZrO2 and TiO2 infiltration (S5). Observed across the examined area, the band of dense perovskite could improve absorption of long-wave light deep in the ZrO2 layer, as well as increasing contact and charge extraction at the ZrO2/C interface.48 These, along with the areas of dense infiltration and improved electrode contact could explain the observed FF improvements in GVL–10MeOH samples. The lower viscosity and increased TiO2 wetting of GVL–10MeOH precursors may facilitate filling of such areas during percolation time.
Device infiltration can be more thoroughly compared through PL (photoluminescence) mapping. This technique provides a more accurate representation of PL behaviour in CPSCs than SSPL (steady state photoluminescence), as peak positions and signal intensity can vary significantly over the device area due to incomplete infiltration. While SSPL provides a snapshot of a single area, comparing the variation and intensity of PL signals across a given area with mapping can provide information on both infiltration and perovskite quality. In inert ZrO2 layers, well infiltrated areas with high quality crystalline MAPbI3 show increased PL intensities.47 Conversely, areas with reduced PL can therefore be indicative of either poor infiltration or, when accompanied by significant blue-shift and photodarkening, poor crystal quality.46,47 ZrO2/Carbon scaffolds on glass were therefore filled with GVL-only and GVL–10MeOH precursors for PL mapping.
As shown in Fig. 7a and b, the GVL–10MeOH sample exhibited a greater proportion of high intensity areas and fewer areas in the bottom 10% of the range. This decrease in the number and range of low intensity areas is evidence for superior infiltration at the base of the GVL–10MeOH infiltrated stacks. Additionally, the increased incidence of highly emissive areas suggests that the GVL–10MeOH precursors are forming higher quality perovskite.
 | ||
| Fig. 7 (a) 3D plots of mapped PL intensity of MAPbI3 crystallised from GVL only and GVL–10MeOH in ZrO2 films across a 200 μm2 area, (b) 2D maps, with adjacent black and white images highlighting pixels in the bottom 10% of the PL intensity range. The corresponding tables detail the quantity, average size and overall coverage of these poorly infiltrated low intensity regions, (c) 2D contour maps showing the direction and intensity of peak shifting across the area. | ||
This is corroborated when considering the peak position maps (Fig. 7c), where the GVL–10MeOH samples exhibit less peak shifting over the measured area. Compared to the GVL–10MeOH case, the GVL maps show a much greater range in peak shifts with a larger proportion of peaks moving to lower wavelengths. Such blue shifts have been associated with poorer crystal quality correspondingly higher defect concentrations, which introduce shallow traps near the band edge.46,49
These results indicate that GVL–10MeOH precursors produce better infiltrated perovskite layers of improved crystallinity: the decrease in the number of low intensity areas is typical of more consistent infiltration, while the increased frequency of high intensity areas and decreased peak shifting are suggestive of superior crystal quality.47,49
Improved infiltration and can also impact device EQE and EIS measurements. In CPSCs, EQE increases in the 300–450 nm range can be linked to improved infiltration at the base of the stack, as this is where the majority of short wavelength light is absorbed.48 Improved infiltration also results in enhanced perovskite–TiO2 contact, which can cause greater charge accumulation in the electrode and resultant increases in measured charge at each given Voc during EIS-although it should be noted that in the absence of improved device performance and PL increases this can also be indicative of increased trap density.50–52 Devices infiltrated with GVL only and GVL–MeOH mixed MAPbI3 precursors were therefore examined with EQE and EIS.
Shown in Fig. 8c, EQE increases in the 300–450 nm range for all the GVL–MeOH samples, especially once MeOH content exceeds 5%. EIS measurements then revealed increased charge accumulation in GVL–MeOH samples, which can be linked to improved charge extraction due to increased perovskite–TiO2 contact. This was observed as a clear increase in the chemical capacitance for GVL–MeOH devices. Many reports have shown that a chemical capacitance related to photogenerated charge accumulation is not commonly observed in perovskite devices.50–52 The presence of such a capacitance in these devices suggests charge is efficiently injected into the mesoporous TiO2 in which charges accumulate. Although such accumulation can also be indicative of increased trap density this was considered unlikely as GVL–MeOH samples also exhibited significantly increased charge carrier lifetimes. Coupled with increased PL intensity and more oriented crystal growth, this enhanced carrier lifetime suggests that the GVL–MeOH precursors form devices with higher quality perovskites of lower trap density. It could also explain the Voc enhancements observed in GVL–MeOH cells.
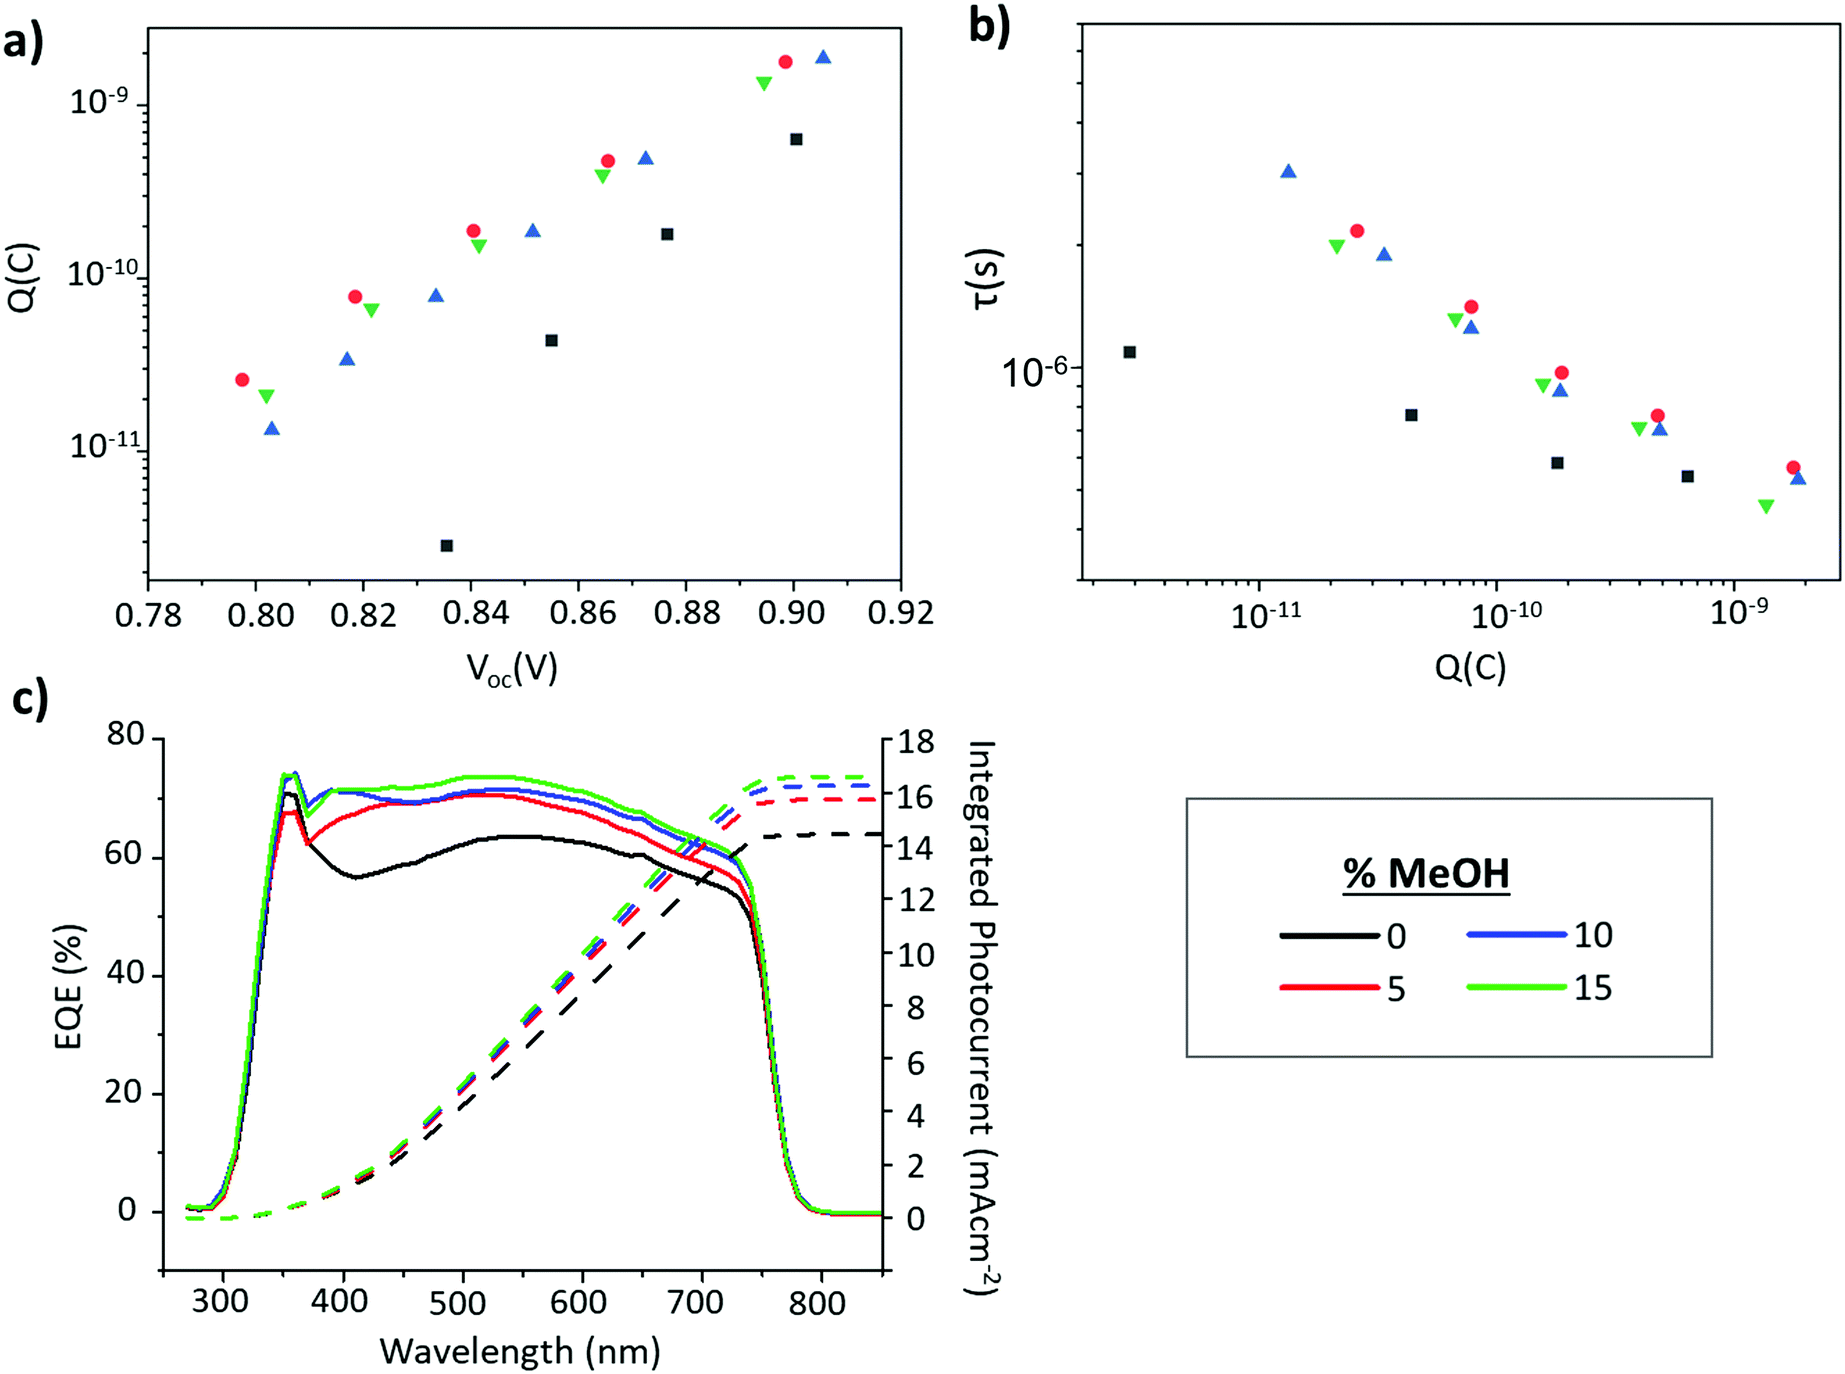 | ||
| Fig. 8 (a) EIS data showing variance of carrier lifetime with Q (b) variance in measured charge with applied voltage for GVL and GVL–MeOH devices, obtained from EIS measurements, (c) EQE plots from the highest performing device from each MeOH %. | ||
One of the major advantages of CPSCs is their inherent stability – the inorganic stack and hydrophobic carbon electrode mechanically stabilise the perovskite whilst limiting moisture and O2 access. Any new solvent systems must therefore produce highly stable devices to be considered a viable alternative. GVL-based MAPbI3 devices have already demonstrated stability when kept at Voc under illumination in ambient conditions.24 To be considered a viable replacement, devices fabricated using GVL–MeOH solvent mixes must demonstrate similar stability to GVL-only systems. Stability testing was therefore performed, wherein unencapsulated devices were placed under AM 1.5 illumination at 50 °C and ambient humidity, held at Voc and tested every four hours.
As shown in Fig. 9, two of three devices exhibited a T80 of >400 h, with the best performing device demonstrating a T80 of over 420 h. This significantly outperforms the GVL-only controls, which demonstrated a maximum T80 of ∼230 h and experienced more significant FF and J losses over the measurement period (S6). It should be noted that this method of stability measurement does not truly reflect working conditions.53 More robust methods such as maximum power point tracking (MPPT) may therefore more accurately represent the device behaviour over time.
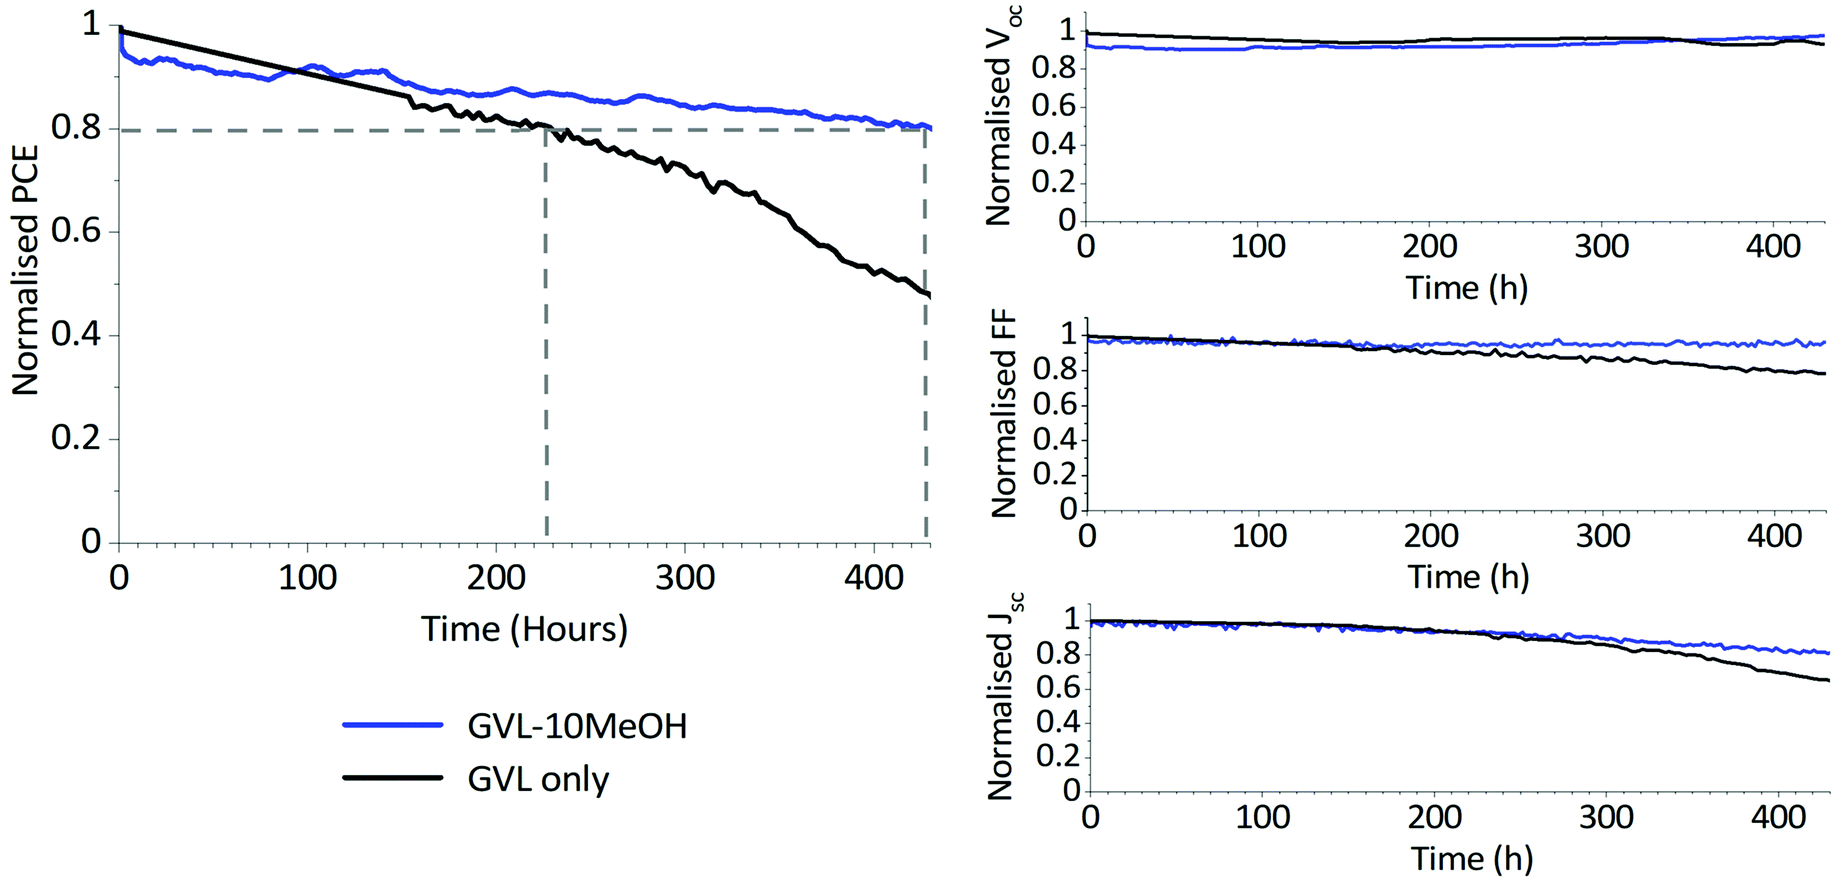 | ||
| Fig. 9 Normalised PV parameters of an unencapsulated GVL only and GVL–10MeOH device over 430 hours of stability testing. Devices were tested every four hours and held at Voc under AM1.5 illumination at 50 °C in ambient conditions for the duration. The dashed lines highlight device T80 lifetimes. | ||
Such enhanced stability can be a consequence of multiple factors. Better infiltration of GVL–10MeOH precursors will produce fewer unfilled voids within the stack, helping limit moisture and oxygen access and preventing the escape of volatile MA species at temperature. At the same time, GVL–10MeOH precursors may be producing more oriented, higher quality perovskite with fewer defects, which can enhance device lifetime through decreasing trap density and providing fewer sites for degradation.32
These stability enhancements, coupled with the improvements in device performance could make GVL–10MeOH precursors an even better candidate for scale-up than GVL only systems. However, precursor stability is also an important consideration: commercial precursors should ideally be stable in ambient storage to minimise storage costs. Any mixed solvent solutions should ideally exhibit similar stability to GVL only under ambient storage to be considered a commercially viable alternative. In a lab environment, CPSC precursors are generally made in small volumes and used within 3 days, which does not reflect what would occur during large-scale production. As both GVL and MeOH are hygroscopic solvents, precursors could feasibly incorporate some ambient water over time, as well as undergoing degradation processes such as I2 formation during storage.
A long-term experiment was therefore performed, wherein empty stacks from the same printing batch were periodically infiltrated with the same GVL only or GVL–10MeOH precursor over several weeks. Precursors were stored in sealed vials in ambient conditions between uses (18–19 °C, 30–40% RH). As presented in S7, no significant change in device performance was observed over time for either precursor, with no significant decrease in any photovoltaic parameter over time in either case. Indeed, the champion device for each precursor was achieved after 17 and 24 days storage for the GVL–10MeOH and GVL only solutions respectively. Additionally, both precursor formulations were stable towards room temperature precipitation during storage. This would be beneficial in a commercial setting and represents a significant advantage of these formulations over conventional GBL solutions, which undergo significant room temperature precipitation.24
Infiltration inconsistencies can result in significant performance loss on device scale-up, introducing poorly conductive areas of high recombination. For a stable, high performance module, all contributing devices must exhibit consistently high PCE across the active area. The improved infiltration and enhanced reproducibility of small scale GVL–10MeOH devices could therefore result in significant performance enhancement at module scale. (Fig. 10).13,54
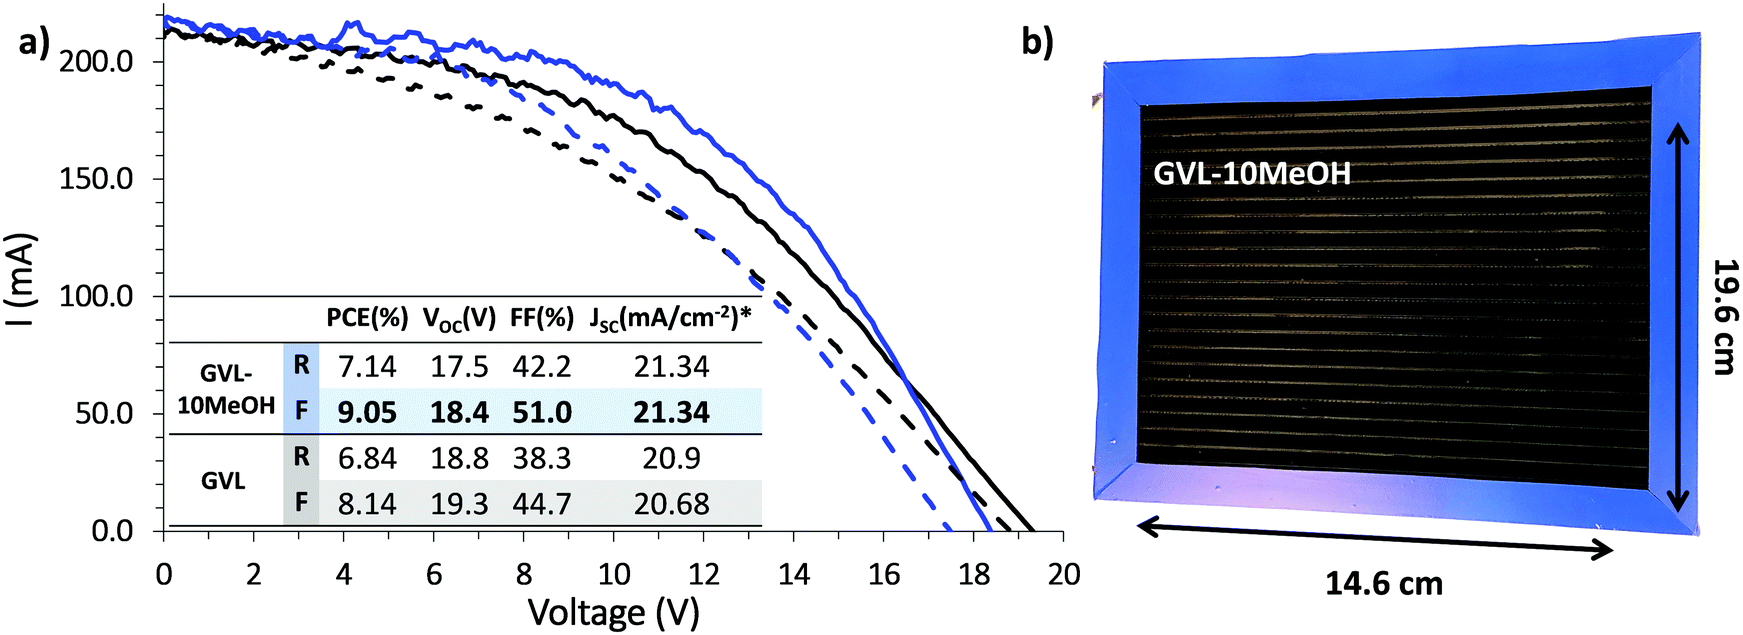 | ||
| Fig. 10 (a) IV curves of modules fabricated with GVL only and GVL–10MeOH precursors, with inlaid table showing measured photovoltaic parameters, (*Jsc as calculated for one cell of the module). (b) Photograph of the GVL–10MeOH module with dimensions labelled. | ||
Previous published works have cited a champion PCE of 6.6% for scribed modules of this size using GBL precursors.13 As shown in Fig. 10, both GVL–only and GVL–10MeOH precursors far outperformed this value, achieving PCEs of 8.14% and 9.05% respectively. Compared to previously published GBL data, the GVL and GVL–10MeOH modules both exhibited improved Isc and FF values.13 The greatest increase was observed with the GVL–10MeOH FF values, which rose from 44.7% with GVL only to 51.0% in the GVL–10MeOH system. This is likely a consequence of better, more reproducible infiltration across the active area, leading to improved perovskite–electrode contact and better charge extraction. This result confirms that green GVL–10MeOH precursors are well-suited to scale-up and proves that these green systems are a viable, superior alternative to GBL for CPSC module production.
3 Conclusion
Previous work has presented GVL as an alternative, non-toxic green solvent to GBL for CPSC fabrication. However, GVL precursors are highly viscous, which can limit device infiltration. In this work, MeOH is used as a solvent additive to improve the performance and reproducibility of CPSCs fabricated with GVL-based MAPbI3 precursors. Sustainable and mass-produced at low cost, MeOH maintains the sustainable, cheap, and biodegradable credentials of the GVL solvent system.An optimised 10% MeOH (GVL–10MeOH) is found to reduce precursor viscosity and improve wetting, as well as promoting more oriented perovskite growth and higher quality absorber layers. Resultant devices are more reproducible across multiple batches and present of higher PCE, Voc and Fill factor (FF), achieving a champion PCE of 13.8% in a 1 cm2 cell and over 9% in a 220 cm2 active area module. GVL–10MeOH devices also prove more stable, with an unencapsulated cell exhibiting a T80 of >420 hours at 50 °C in ambient humidity under AM1.5 illumination. This work could make green GVL-based precursors more commercially attractive and shows how green solvent engineering can be applied in the development, amelioration and scale-up of novel renewable technologies.
4. Experimental
4.1 Materials
PbI2 (99%, Sigma-Aldrich), MAI (CH3NH3I, anhydrous, Dyesol), 5-ammonium valeric acid iodide (5-AVAI, Dyesol), γ-butyrolactone (GBL, Sigma Aldrich), γ-valerolactone (GVL, Sigma Aldrich) and anhydrous MeOH were used as received.For device stacks, titanium diisopropoxide bis (acetylacetonate) (TAA, 75% in IPA, Sigma-Aldrich), anhydrous 2-propanol (IPA, 99.5%, Sigma Aldrich), TiO2 paste (30NR-D, GreatCell Solar), ZrO2 paste (GreatCell Solar), Carbon paste (Gwent electronic materials) and terpineol (95%, Sigma-Aldrich) were used as received.
4.2 Precursors
All precursors and solvent mixes were fabricated to a concentration of 1.1 M in an N2 glove box. To ensure comparable concentration between precursors of different solvent ratios, precursors were prepared by dilution of a 1.25 M MAPbI3/GVL stock solution with 5-aminovaleric acid in a 3% molar excess. The stock solution was stirred at room temperature overnight to ensure complete dissolution of the components before separation to different vials and dilution with the appropriate volumes of GVL and MeOH. Once fabricated, precursors were stored in dark ambient conditions (∼18 °C, 30–60% RH).4.3 Device and module fabrication
FTO substrates were patterned with a Nb:YVO4 laser (532 nm) before cleaning with ∼2% Hellmanex in deionised water, rinsing with acetone and IPA and drying with N2. Substrates were then placed in a Nano plasma system (Diener Electronics) and plasma cleaned for five minutes in an O2 environment. The substrate was heated to 300 °C on a hot plate and a compact TiO2 blocking layer deposited by spray pyrolysis of 0.2 M titanium di-isopropoxide-bis(acetylacetonate) in IPA.To form the mesoporous TiO2 layer, the titania paste (30NRD) was diluted 1![[thin space (1/6-em)]](https://www.rsc.org/images/entities/char_2009.gif) :1 by weight in terpineol, screen printed and sintered at 550 °C for 30 minutes after a slow ramp. Next, ZrO2 and carbon were printed and annealed at 400 °C for 30 minutes each. Layer thicknesses were 600–800 nm, ∼2.6 μm and ∼17 μm for TiO2, ZrO2 and carbon respectively. All layers were printed and annealed in ambient conditions.
:1 by weight in terpineol, screen printed and sintered at 550 °C for 30 minutes after a slow ramp. Next, ZrO2 and carbon were printed and annealed at 400 °C for 30 minutes each. Layer thicknesses were 600–800 nm, ∼2.6 μm and ∼17 μm for TiO2, ZrO2 and carbon respectively. All layers were printed and annealed in ambient conditions.
Devices were cooled to room temperature in ambient conditions (30–50% RH, 18–21 °C), before drop casting of 20 μl room temperature precursor onto the stack. Devices were left for fifteen minutes in ambient conditions after drop casting precursor to ensure adequate infiltration, before annealing on a hot plate for 1.5 h at 45 °C.
Contacts were applied with an ultrasonic solder at 180 °C before humidity treatment: 16 hours in a humidity oven at 25 °C and 70% RH and a subsequent 4–10 hours under vacuum.
Module fabrication was carried out following previously established scribe method1 with scribe widths of 50 nm, 0.60 mm and 0.20 mm for P1, P2 and P3, respectively, resulting in an active area of 220 cm2 over 22 cells and geometric fill factor of 80%. Scribe P1 was created via a Nd:YVO4 laser, and the triple mesoporous layers were deposited via screen printing. The measured mesoporous layer thicknesses were 0.8, 1.9 and 12 μm for TiO2, ZrO2 and carbon, respectively. P2 and P3 scribes were created mechanically with a steel blade under 0.54 N mm−1 pressure. The GVL and GVL MeOH solutions were deposited into the module shells via the Robotic Mesh (RbM) method2, using a 30 ga blunt end needle tip with a deposition speed of 12 m s−1. The wet devices were kept in a low humidity atmosphere for 10 minutes at room temperature prior to curing at 45 °C in a low humidity oven for 1 hour. Following previous work, the devices were then placed in a humidity oven at 70% R.H. at room temperature for 24 hours and then placed under vacuum for 8 hours.3
4.4 Preparation of XRD and PL samples
Glass substrates were first cleaned with ethanol and IPA before screen printing of ∼1.6 μm ZrO2 paste and subsequent annealing on a hot plate at 400 °C for 30 minutes. A carbon layer was then printed onto the cooled ZrO2 and annealed on a hot plate at 400 °C for 30 minutes.20 μl of the relevant precursor was drop cast onto the cooled substrates and left at room temperature for 15 minutes to maximise infiltration. Samples were annealed at 45 °C on a hot plate in ambient conditions for 1.5 h.
Samples were humidity treated as described above before undergoing tests.
5. Testing and characterisation
5.1 Contact angle testing
Samples were prepared by screen printing ∼600 nm TiO2 paste (Greatcell solar, 30 NRD, diluted 1:1 with terpineol) onto FTO. Layers were annealed at 550 °C for 30 minutes and cooled to room temperature in ambient conditions (20 °C, 30% RH) before contact angle testing.
A 1 ml syringe with a blunt end needle (Metcal 22-gauge precision dispenser needle) was used to drop cast one droplet of room temperature perovskite precursor in the relevant solvent mix onto the substrate. Dynamic contact angle measurements were taken using a Nikon camera and analysed using FTA-32 software, with images obtained every 0.1 s for the duration. Timing was started from t = 0, when the droplet first came into contact with the substrate. Spreading distance and droplet height were measured using FTA-32 software.
5.2 Viscosity measurements
1.25 ml of each precursor at the specified concentration and solvent mix was prepared for each sample. Measurements were performed at ∼18 °C on a Rheosense microvisc with an internal chip of 4–600 cP sensitivity. 10–12 measurements were obtained for each sample and a mean value calculated.5.3 XRD
Samples were prepared as described above. XRD traces were taken from the ZrO2 section of the prepared samples. A Bruker diffractometer with Bragg–Brentano geometry and a CuKα radiation X-ray source was used to obtain XRD (X-ray diffraction) data.For full scans of annealed perovskites, 2θ scans between 10° and 65° were collected using a step size of 0.03°.
The in situ measurements were carried out using a Bruker D8 Discover with a Cu (λ = 1.54 Å) source, in a divergent beam set-up with a Ni filter. An Anton-Paar DHS1100 thermal stage run using Nambicon software was used for temperature control. Empty stacks annealed and placed on a thermal stage at 25 °C in the XRD equipment directly after cooling to room temperature. 20 μl of the stated perovskite precursor was drop cast onto the stack and XRD measurements started immediately. Tests were conducted as a PSD fixed scan using a 2.26° opening on a Lynxeye 1D detector, covering the 2θ range of 13.00–15.26° with a time per step of 15 seconds. Samples were held at 25 °C for 15 minutes then heated to the desired temperature with a ramp rate of 15 °C min−1 and held for 40 minutes to 1 hour for complete crystallisation. XRD measurements were continued while samples cooled to room temperature (a further 5–10 minutes).
5.4 UV vis
UV Vis samples were prepared by diluting precursors to 250 mmol with GVL/MeOH in the appropriate solvent ratio (0, 5, 10 or 15% MeOH in GVL as specified).The diluted solution was well mixed and placed in a clean quartz cuvette of 1 cm path length for measurement. Samples were measured from 300–500 nm at a rate of 90 nm min−1 on a PerkinElmer Lambda 9 UV/VIS/NIR Spectrophotometer.
5.5 Device and module testing
Devices were unencapsulated during storage and testing, and stored in ambient conditions (18–20 °C, 30–60% RH) before and after all measurements.The 1 cm2 devices were masked to 0.49 cm2 and placed under a fan for testing. A Keithley 2400 source meter and class AAA solar simulator (Newport Oriel Sol3A) at 1 sun were used for J–V measurements (calibrated against a KG5 filtered silicon reference cell, Newport Oriel 91150-KG5). Devices were scanned at a rate of 0.126 V s−1 from Voc to Jsc and vice versa after a light soaking period of 180 s. For stabilised current measurements, devices were held at the maximum power point (as determined by the preceding IV scan) for a period of 200 s to account for slow device response times.
Stability measurements were carried out under 1 sun AM 1.5G illumination. The source was a plasma bulb in a Lumartix SA instrument (Luxim-S). The devices were masked at 0.49 cm2 and measured every 4 h with a Keithley 2400 source meter after a resting time in open circuit. The substrates were heated by the IR component of the light spectrum leading to a temperature of 50 °C.
Modules were tested using a Solaronix Solixon A-20 and a Keithley 2400 source meter, in tandem with in-house developed software under AM1.5 illuminations from a Lumixo-S lamp calibrated at 1 sun using a KG5 filtered silicon reference cell (Newport Oriel 91150-KG5). The devices were scanned at a rate of 70 mV s−1 between −0.1 V and 20 V in forward and reverse directions over the full device area.
5.6 SEM
Cross sectional samples were prepared by snapping fully fabricated devices. Each section was then sputtered with ∼5 nm Pt before mounting onto a conductive metal substrate with conductive carbon/silver tape. This was attached to the SEM stage using conductive carbon/silver tape and copper tape to ensure adequate contact. Images were obtained using a JSM-7800F Field Emission SEM at 12 kV (probe current 8) using secondary electron imaging.5.7 FTIR
ZrO2 layers were screen printed on glass and annealed at 400 °C for 30 minutes. Once cooled, 7 μl of the relevant precursor was drop cast onto the cooled layer. After ten minutes of percolation time, samples were annealed for one hour at 45 °C.Samples were scraped off onto the ATR crystal of a PerkinElement Frontier FTIR and spectra measured between 1000 and 4000 cm−1. Spectra were obtained and analysed using spectrum V10 software.
5.8 EQE
External quantum efficiency measurements were carried out using a custom-built system consisting of Xenon arc and Quartz halogen white light sources (Bentham) and a Bentham TMc300 monochromator controlled by Labview software. The cell photocurrent was measured using a transimpedance amplifier (Femto), with the incident light intensity calibrated using a silicon reference photodiode (Newport).5.9 Electrochemical impedance spectroscopy (EIS)
Measurements were performed on unmasked devices using a Zahner CIMPS-X photoelectrochemical workstation. Measurements were performed over the frequency range 10 MHz to 1 Hz at open circuit under illumination from a red LED (630 nm) at intensities from 1 to 0.01 Sun equivalent intensity.5.10 Photoluminescence (PL) mapping
Samples were prepared as described above.Photoluminescence mapping measurements were done using Renishaw InVia confocal Raman microscope. Light was shined from the glass side on to the directly mounted samples on an X–Y scanning stage with a minimum step size of 100 nm. Measurement was done using 532 nm laser excitation source, the power of the which was adjusted using 1 OD neutral density filter to 0.0075 μW. Photoluminescence spectra was recorded at every 250 μm step using 50× objective lens with an acquisition time of 25 ms.
Conflicts of interest
There are no conflicts to declare.Acknowledgements
This work was made possible by support from the UKRI Global Challenge Research Fund project SUNRISE (EP/P032591/1) and through the funding of the SPECIFIC Innovation and Knowledge Centre by the Engineering and Physical Science Research Council [EP/N020863/1], Innovate UK [920036], Newton fund, Royal Society and the European Regional Development Fund [c80892] through the Welsh Government. We would like to thank the Advanced Imaging of Materials (AIM) Facility at Swansea University for lending use of their equipment and expertise in obtaining cross sectional images for this manuscript. This work was also made possible by the support of a Royal Society International Collaboration award (ICA\R1\191321) and the Newton Fund Impact Scheme (541128962). AP and MC would like to thank the Welsh European Funding Office (SPARC II), EPSRC (EP/S017925/1, EP/R032750/1).References
- W. Rehman, D. P. McMeekin, J. B. Patel, R. L. Milot, M. B. Johnston, H. J. Snaith and L. M. Herz, Energy Environ. Sci., 2017, 10, 361–369 RSC.
- C. Wehrenfennig, G. E. Eperon, M. B. Johnston, H. J. Snaith and L. M. Herz, Adv. Mater., 2014, 26, 1584–1589 CrossRef CAS PubMed.
- H. Huang, M. I. Bodnarchuk, S. V. Kershaw, M. V. Kovalenko and A. L. Rogach, ACS Energy Lett., 2017, 2, 2071–2083 CrossRef CAS PubMed.
- H.-S. Kim, C.-R. Lee, J.-H. Im, K.-B. Lee, T. Moehl, A. Marchioro, S.-J. Moon, R. Humphry-Baker, J.-H. Yum, J. E. Moser, M. Grätzel and N.-G. Park, Sci. Rep., 2012, 2, 591 CrossRef PubMed.
- A. Mishra and Z. Ahmad, J. Mater. Sci.: Mater. Electron., 2019, 30, 20320–20329 CrossRef CAS.
- N. G. Park and K. Zhu, Nat. Rev. Mater., 2020, 1–18 Search PubMed.
- A. Mei, X. Li, L. Liu, Z. Ku, T. Liu, Y. Rong, M. Xu, M. Hu, J. Chen, Y. Yang, M. Gratzel and H. Han, Science, 2014, 345, 295–298 CrossRef CAS PubMed.
- S. M. P. Meroni, C. Worsley, D. Raptis and T. M. Watson, Energies, 2021, 14, 386 CrossRef CAS.
- S. Liu, W. Huang, P. Liao, N. Pootrakulchote, H. Li, J. Lu, J. Li, F. Huang, X. Shai, X. Zhao, Y. Shen, Y. B. Cheng and M. Wang, J. Mater. Chem. A, 2017, 5, 22952–22958 RSC.
- H. Li, K. Cao, J. Cui, S. Liu, X. Qiao, Y. Shen and M. Wang, Nanoscale, 2016, 8, 6379–6385 RSC.
- C. Liu, S. Liu, Y. Wang, Y. Chu, K. Yang, X. Wang, C. Gao, Q. Wang, J. Du, S. Li, Y. Hu, Y. Rong, L. Guo, A. Mei and H. Han, Adv. Funct. Mater., 2021, 2010603 CrossRef CAS.
- X. Chen, Y. Xia, Q. Huang, Z. Li, A. Mei, Y. Hu, T. Wang, R. Cheacharoen, Y. Rong and H. Han, Adv. Energy Mater., 2021, 2100292 CrossRef CAS.
- F. De Rossi, J. A. Baker, D. Beynon, K. E. A. Hooper, S. M. P. Meroni, D. Williams, Z. Wei, A. Yasin, C. Charbonneau, E. H. Jewell and T. M. Watson, Adv. Mater. Technol., 2018, 3, 1800156 CrossRef.
- A. Verma, D. Martineau, S. Abdolhosseinzadeh, J. Heier and F. Nüesch, Mater. Adv., 2020, 1, 153–160 RSC.
- J. Baker, K. Hooper, S. Meroni, A. Pockett, J. McGettrick, Z. Wei, R. Escalante, G. Oskam, M. Carnie and T. Watson, J. Mater. Chem. A, 2017, 5, 18643–18650 RSC.
- X. Li, M. Tschumi, H. Han, S. S. Babkair, R. A. Alzubaydi, A. A. Ansari, S. S. Habib, M. K. Nazeeruddin, S. M. Zakeeruddin and M. Grätzel, Energy Technol., 2015, 3, 551–555 CrossRef CAS.
- E. V. Péan, C. S. De Castro, S. Dimitrov, F. De Rossi, S. Meroni, J. Baker, T. Watson and M. L. Davies, Adv. Funct. Mater., 2020, 1909839 CrossRef.
- C.-T. Lin, F. De Rossi, J. Kim, J. Baker, J. Ngiam, B. Xu, S. Pont, N. Aristidou, S. A. Haque, T. Watson, M. A. McLachlan and J. R. Durrant, J. Mater. Chem. A, 2019, 7, 3006–3011 RSC.
- A. Mei, Y. Sheng, Y. Ming, Y. Hu, Y. Rong, W. Zhang, S. Luo, G. Na, C. Tian, X. Hou, Y. Xiong, Z. Zhang, S. Liu, S. Uchida, T.-W. Kim, Y. Yuan, L. Zhang, Y. Zhou and H. Han, Joule, 2020, 4, 2646–2660 CrossRef CAS.
- World Health Organisation, in 36th ECDD Agenda item 4.3, 2014.
- Q. Wang, W. Zhang, Z. Zhang, S. Liu, J. Wu, Y. Guan, A. Mei, Y. Rong, Y. Hu and H. Han, Adv. Energy Mater., 2020, 10, 1903092 CrossRef CAS.
- J. Liu, D. Wang, K. Chen, J. Kang, J. Yang, J. Zhang and H. Zhang, Sol. Energy, 2020, 206, 548–554 CrossRef CAS.
- A. J. Doolin, R. G. Charles, C. S. P. De Castro, R. G. Rodriguez, E. V. Péan, R. Patidar, T. Dunlop, C. Charbonneau, T. Watson and M. L. Davies, Green Chem., 2021, 23, 2471–2486 RSC.
- C. Worsley, D. Raptis, S. Meroni, A. Doolin, R. Garcia, M. Davies and T. Watson, Energy Technol., 2021, 9, 2100312 CrossRef CAS.
- GBL MSDS – B103608, https://www.sigmaaldrich.com/MSDS/MSDS/DisplayMSDSPage.do?country=GB&language=en&productNumber=B103608&brand=ALDRICH&PageToGoToURL=https%3A%2F%2Fwww.sigmaaldrich.com%2Fcatalog%2Fproduct%2Faldrich%2Fb103608%3Flang%3Den, accessed 16 March 2020.
- GVL MSDS, https://www.sigmaaldrich.com/MSDS/MSDS/DisplayMSDSPage.do?country=GB&language=en&productNumber=V403&brand=ALDRICH, accessed 14 January 2021.
- Y. Ming, M. Xu, S. Liu, D. Li, Q. Wang, X. Hou, Y. Hu, Y. Rong and H. Han, J. Power Sources, 2019, 424, 261–267 CrossRef CAS.
- J. C. Hamill, J. Schwartz and Y. L. Loo, ACS Energy Lett., 2018, 3, 92–97 CrossRef CAS.
- N. J. Jeon, J. H. Noh, Y. C. Kim, W. S. Yang, S. Ryu and S. Il Seok, Nat. Mater., 2014, 13, 897–903 CrossRef CAS PubMed.
- A. Kumar, A. Sharma, B. G. de la Torre and F. Albericio, Molecules, 2019, 24, 4004 CrossRef CAS PubMed.
- F. Kerkel, M. Markiewicz, S. Stolte, E. Müller and W. Kunz, Green Chem., 2021, 23, 2962–2976 RSC.
- J. Kim, B. W. Park, J. Baek, J. S. Yun, H. W. Kwon, J. Seidel, H. Min, S. Coelho, S. Lim, S. Huang, K. Gaus, M. A. Green, T. J. Shin, A. W. Y. Ho-Baillie, M. G. Kim and S. Il Seok, J. Am. Chem. Soc., 2020, 142, 6251–6260 CrossRef CAS PubMed.
- M. Xu, W. Ji, Y. Sheng, Y. Wu, H. Cheng, J. Meng, Z. Yan, J. Xu, A. Mei, Y. Hu, Y. Rong and H. Han, Nano Energy, 2020, 74, 104842 CrossRef CAS.
- S. M. P. Meroni, Y. Mouhamad, F. De Rossi, A. Pockett, J. Baker, R. Escalante, J. Searle, M. J. Carnie, E. Jewell, G. Oskam and T. M. Watson, Sci. Technol. Adv. Mater., 2018, 19, 1–9 CrossRef CAS.
- MeOH MSDS - 322415, https://www.sigmaaldrich.com/MSDS/MSDS/DisplayMSDSPage.do?country=GB&language=en&productNumber=322415&brand=SIAL&PageToGoToURL=https%3A%2F%2Fwww.sigmaaldrich.com%2Fcatalog%2Fproduct%2Fsial%2F322415%3Flang%<?pdb_no 3Den?>3Den<?pdb END?>, accessed 8 April 2021.
- J. C. Hamill, J. Schwartz and Y.-L. Loo, ACS Energy Lett., 2018, 3, 92–97 CrossRef CAS.
- K. Yan, M. Long, T. Zhang, Z. Wei, H. Chen, S. Yang and J. Xu, J. Am. Chem. Soc., 2015, 137, 4460–4468 CrossRef CAS PubMed.
- T. Du, J. Kim, J. Ngiam, S. Xu, P. R. F. Barnes, J. R. Durrant and M. A. McLachlan, Adv. Funct. Mater., 2018, 28, 1801808 CrossRef.
- G. Grancini, C. Roldán-Carmona, I. Zimmermann, E. Mosconi, X. Lee, D. Martineau, S. Narbey, F. Oswald, F. De Angelis, M. Graetzel and M. K. Nazeeruddin, Nat. Commun., 2017, 8, 15684 CrossRef CAS PubMed.
- K. Yan, M. Long, T. Zhang, Z. Wei, H. Chen, S. Yang and J. Xu, J. Am. Chem. Soc., 2015, 137, 4460–4468 CrossRef CAS PubMed.
- W. Rehman, D. P. McMeekin, J. B. Patel, R. L. Milot, M. B. Johnston, H. J. Snaith and L. M. Herz, Energy Environ. Sci., 2017, 10, 361–369 RSC.
- A. Schneider, S. Alon and L. Etgar, Energy Technol., 2019, 1900481 CrossRef.
- O. Filonik, M. E. Thordardottir, J. Lebert, S. Pröller, S. Weiß, L. J. Haur, A. Priyadarshi, P. Fontaine, P. Müller-Buschbaum, N. Mathews and E. M. Herzig, Energy Technol., 2019, 7, 1900343 CrossRef CAS.
- P. S. Whitfield, N. Herron, W. E. Guise, K. Page, Y. Q. Cheng, I. Milas and M. K. Crawford, Sci. Rep., 2016, 6, 1–16 CrossRef PubMed.
- H. Lakhiani, T. Dunlop, F. De Rossi, S. Dimitrov, R. Kerremans, C. Charbonneau, T. Watson, J. Barbé and W. C. Tsoi, Adv. Funct. Mater., 2019, 1900885 CrossRef.
- K. P. Goetz, A. D. Taylor, F. Paulus and Y. Vaynzof, Adv. Funct. Mater., 2020, 30, 1910004 CrossRef CAS.
- H. Lakhiani, T. Dunlop, F. De Rossi, S. Dimitrov, R. Kerremans, C. Charbonneau, T. Watson, J. Barbé and W. C. Tsoi, Adv. Funct. Mater., 2019, 29, 1900885 CrossRef.
- R. Kerremans, O. J. Sandberg, S. Meroni, T. Watson, A. Armin and P. Meredith, Sol. RRL, 2019, 1900221 Search PubMed.
- E. V. Péan, C. S. De Castro and M. L. Davies, Mater. Lett., 2019, 243, 191–194 CrossRef.
- A. Pockett, G. E. Eperon, T. Peltola, H. J. Snaith, A. Walker, L. M. Peter and P. J. Cameron, J. Phys. Chem. C, 2015, 119, 3456–3465 CrossRef CAS.
- A. Guerrero, G. Garcia-Belmonte, I. Mora-Sero, J. Bisquert, Y. S. Kang, T. J. Jacobsson, J. P. Correa-Baena and A. Hagfeldt, J. Phys. Chem. C, 2016, 120, 8023–8032 CrossRef CAS.
- A. Riquelme, L. J. Bennett, N. E. Courtier, M. J. Wolf, L. Contreras-Bernal, A. B. Walker, G. Richardson and J. A. Anta, Nanoscale, 2020, 12, 17385–17398 RSC.
- M. V. Khenkin, E. A. Katz, A. Abate, G. Bardizza, J. J. Berry, C. Brabec, F. Brunetti, V. Bulović, Q. Burlingame, A. Di Carlo, R. Cheacharoen, Y. B. Cheng, A. Colsmann, S. Cros, K. Domanski, M. Dusza, C. J. Fell, S. R. Forrest, Y. Galagan, D. Di Girolamo, M. Grätzel, A. Hagfeldt, E. von Hauff, H. Hoppe, J. Kettle, H. Köbler, M. S. Leite, S. (Frank) Liu, Y. L. Loo, J. M. Luther, C. Q. Ma, M. Madsen, M. Manceau, M. Matheron, M. McGehee, R. Meitzner, M. K. Nazeeruddin, A. F. Nogueira, Ç. Odabaşı, A. Osherov, N. G. Park, M. O. Reese, F. De Rossi, M. Saliba, U. S. Schubert, H. J. Snaith, S. D. Stranks, W. Tress, P. A. Troshin, V. Turkovic, S. Veenstra, I. Visoly-Fisher, A. Walsh, T. Watson, H. Xie, R. Yıldırım, S. M. Zakeeruddin, K. Zhu and M. Lira-Cantu, Nat. Energy, 2020, 5, 35–49 CrossRef.
- S. M. P. Meroni, K. E. A. Hooper, T. Dunlop, J. A. Baker, D. Worsley, C. Charbonneau and T. M. Watson, Energies, 2020, 13, 1589 CrossRef CAS.
Footnote |
| † Electronic supplementary information (ESI) available. See DOI: 10.1039/d1ma00975c |
| This journal is © The Royal Society of Chemistry 2022 |