
 Open Access Article
 This Open Access Article is licensed under a
 Creative Commons Attribution 3.0 Unported Licence
Proteinaceous microstructure in a capillary: a study of non-linear bending dynamics†
Mario
Marini‡
 a,
Amirbahador
Zeynali‡
a,
Maddalena
Collini
ac,
Margaux
Bouzin
a,
Laura
Sironi
ac,
Laura
D'Alfonso
ac,
Francesco
Mantegazza
bc,
Valeria
Cassina
bc and
Giuseppe
Chirico
*ac
a,
Amirbahador
Zeynali‡
a,
Maddalena
Collini
ac,
Margaux
Bouzin
a,
Laura
Sironi
ac,
Laura
D'Alfonso
ac,
Francesco
Mantegazza
bc,
Valeria
Cassina
bc and
Giuseppe
Chirico
*ac
aDipartimento di Fisica, Università degli Studi di Milano-Bicocca, Piazza della Scienza 3, 20126, Milano, Italy. E-mail: giuseppe.chirico@unimib.it
bDipartimento di Medicina e Chirurgia, Università degli Studi di Milano-Bicocca, Via Follereau 3, 20854, Vedano al Lambro, Italy
cBionanomedicine Center, BIONANOMIB, Via Follereau 3, 20854, Vedano al Lambro, Italy
First published on 4th November 2022
Abstract
The flap of bendable structures under continuous flow impacts a variety of fields, ranging from energy harvesting to active mixing in microfluidic devices. Similar physical principles determine the flapping dynamics in a variety of systems with different sizes, but a thorough investigation of the bending dynamics at the microscale is still lacking. We employ here two-photon laser polymerization to fabricate elongated proteinaceous flexible microstructures directly within a micro-capillary and we characterize their bending dynamics. The elastic properties of the microstructures with different (circular and square) cross-sections are tested by Atomic Force Microscopy and by studying the deflection-flow dependence in microfluidic experiments at intermediate Reynolds numbers (Rey ≲ 150). The retrieved Young's modulus of the fabricated matrix (100 kPa ≤ E ≤ 4 MPa) falls in the range of most typical biological tissues and solely depends on the laser fabrication intensity. The elastic constant of the microstructures falls in the range of 0.8 nN μm−1 ≤ k ≤ 50 nN μm−1, and fully agrees with the macroscopic Euler Bernoulli theory. For soft microstructures (0.8 nN μm−1 ≤ k ≤ 8 nN μm−1) we reveal undamped bending oscillations under continuous microfluidic flow, corresponding to ∼10% of the total structure deflection. This behavior is ascribed to the coupling of the viscoelasticity and non-linear elasticity of the polymer matrix with non-linear dynamics arising from the time-dependent friction coefficient of the bendable microstructures. We envision that similar instabilities may lead to the development of promising energy conversion nanoplatforms.
1. Introduction
Rapid advances in micro- and nano-technology are contributing to the development of new materials and technological solutions for biotechnology and nanomedicine. New methods in the 3D photo-polymerization of microstructures have recently found applications in sensing,1,2 single cell manipulation3,4 and tissue engineering.5–8 Indeed, 3D printed microfabricated structures can be endowed with physicochemical functions triggered by light,9–11 and these microstructures, which are rigid if written in silica based resists or semi-rigid if written in hydrogels, have direct application as micro-prostheses and medical devices for therapy12 and for cell guidance.13–15The interest in the fabrication of flexible microstructures is also increasing due to their application in shear stress sensing,16,17 energy harvesting18 and active micromixing.19 Microfluidic setups specifically aimed at the measurement of the rigidity of the fabricated polymers have been described,20 and energy harvesting microdevices are expected to fuel autonomous energy production for active implanted medical prostheses, with minimal environmental impact and high noise reduction. The laboratory use of such devices has already been proven,21,22 and their extension to the biotechnological and biomedical setting is under current active development. In the field of micromixing, intrinsic limitations are typically associated with the use of moderately low microfluidic flow speeds (≲ 1 m s−1).23 Flows are mainly laminar and confluent liquids tend to flow side by side unless Kelvin–Helmholtz instability arises.24 This demands for active mixing techniques where fluids are perturbed by an external energy source: magnetic,25 electro-hydrodynamic,26 electro-thermal27 and transverse electro-osmotic27 forces or acoustic vibrations have been used for this purpose. All these cases imply therefore the use of an external alternating source of energy and/or a complex fabrication method for the integration of microelectrodes on microfluidic chips. In this framework, passive methods capable of converting simple laminar flow into elastic energy and then (e.g., via piezo-electricity) into electrical power would be extremely valuable in both microfluidic devices and in microcirculatory vessels in vivo.
Turbulence can be regarded as a possible means of energy transfer in microchannels. For Reynolds numbers  (ηk, U∞ and w being the kinematic viscosity, the maximum flow speed and the size of the vessel respectively), turbulence appears in macroscopic unobstructed pipes.28 These values cannot be easily obtained in micro-capillaries (w ≅ 100–500 μm) or in venous capillaries (3 μm ≤ w ≤ 300 μm).29 However, for partially obstructed microchannels, even at relatively low Reynolds numbers Rey ≅ 200 vorticity is present,30 giving rise to vortices with characteristic frequency ≅100 Hz–1 kHz.30–32 If this incipient non-linearity could be coupled with the response of soft bendable microstructures to a stress, we could reproduce the basic principles of flapping dynamics33 at the microscopic level.
Along with turbulence, a source of non-linearity can be identified in the drag force acting on a deformable object. The force is characterized by a variable drag coefficient,34 since the shape of the object changes under the action of the flow in order to minimize the drag. This phenomenon, which is well known in plant biology,35 is also at work with synthetic deformable microstructures.36,37 We reason therefore that by coupling the elastic dynamics of a flexible microstructure with the vorticity rising at low Rey values, a non-linear response of the microstructures can be induced. This motion could be exploited to obtain sustained (undamped) oscillations under continuous flow, opening the door to applications in energy nano-generation and micro-mixing enhancement at small scales.
It is our purpose here to investigate under which conditions non-linear responses and sustained (un-damped) oscillations can be efficiently induced in the bending dynamics of microstructures under the action of continuous microfluidic flow. We take advantage of Two-Photon Absorption (TPA) Additive Optical Manufacturing9,38–40 (AOM) to fabricate micron-size structures of circular and square cross-sections in proteinaceous photo-resists. The non-linearity of TPA implies a highly localized (≅femtoliter size voxel) release of energy to the molecular system and provides the necessary high spatial resolution (≅300 nm) in the microfabrication of hydrogels.41 Since we are interested in soft microstructures capable of undergoing substantial (≥5%) bending motion under the action of fluid drag force, we opt for the use of hydrogels with Young's moduli in the MPa range,41 much softer than silica based resists characterized by a GPa Young's modulus.42 We rely on photo-resists based on bovine serum albumin (BSA), which is one of the most employed proteins in the field of AOM43,44 because of its well-studied functionalities, biocompatibility and low cost.45 Aiming at the development of an integrated experimental platform enabling both the structure manufacturing and the characterization of their bending dynamics, we demonstrate the direct fabrication of proteinaceous micro-structures within borosilicate microfluidic channels. By operating in an intermediate range of Reynolds numbers, 20 ≤ Rey ≤ 150, we are able to measure the Young's bending modulus 100 kPa ≤ E ≤ 4000 kPa and elastic constant 0.8 nN μm−1 ≤ k ≤ 50 nN μm−1 of the structures. For soft microstructures (k ≤ 8 nN μm−1), we further bring into evidence their sustained bending oscillations under continuous microfluidic flow, and we discuss the source of the observed non-linear dynamic response by combining experimental results with the detailed theoretical treatment of the bending dynamics based on the Langevin equation for viscoelastic and non-linear springs.
2. Materials and methods
2.1 BSA–rose bengal ink and photo-polymerization
50 mg mL−1 bovine serum albumin was dissolved in Milli-Q water. Rose bengal (Sigma-Aldrich, USA; dye content 95%) was added to the as-prepared protein solution to reach 2 mM concentration. Microstructures with circular, square and helicoidal cross-sections (see Table 1 for the geometrical specifications of the samples) were fabricated on the inner wall of square cross-section borosilicate capillaries (300 μm × 300 μm, wall thickness = 150 μm, CMScientific Ltd., UK). The photo-resist was inserted through a syringe in the capillary, which was connected by Teflon tubes to syringes actuated by an NE-300 pump (KF-technologies, I) and then clamped on the sample holder of the Additive Optical Manufacturing optical setup. A water immersion objective (Olympus LUMFI 60X, N.A. = 1.1, working distance WD = 1.5 mm; see section 2.2) was used for the photo-polymerization. The long working distance allows polymerization of 3D structures hanging from the top inner wall of the capillary with a top-bottom scanning configuration. After the polymerization, the capillaries were flushed extensively at low flow speed with Milli-Q water.| Hollow cylinders, circular section | |||
|---|---|---|---|
| Height | External radius, R | Internal radius, r | Sample |
| 50 | 5 | 3.5 | C1 |
| 50 | 4 | 2.5 | C2 |
| Hollow pillars, square section | |||
|---|---|---|---|
| Height | External size, D | Internal size, d | Sample |
| 50 | 8 | 5 | P1 |
| 50 | 6 | 3 | P2 |
| Helices (see the ESI†) | ||||
|---|---|---|---|---|
| Height | Pitch | External diameter | Thread diameter | Sample |
| 50 | 6 | 8 | 1 | H1 |
| 40 | 6 | 8 | 1 | H2 |
| 30 | 6 | 8 | 1 | H3 |
2.2 Direct laser writing optical setup and 3D scanning paths
Proteinaceous microstructures were fabricated by Two-Photon Absorption (TPA) Additive Optical Manufacturing (AOM). The AOM setup is based on a Ti![[thin space (1/6-em)]](https://www.rsc.org/images/entities/char_2009.gif) :Sa femtosecond laser source (wavelength λ = 800 nm, repetition rate R = 80 MHz and pulse width τP ≅ 250 fs, linearly polarized) focused using a water immersion microscope objective (Olympus LUMFI 60x, N.A. = 1.1, 1.5 mm WD) on the sample with a beam waist ω0 = 0.44 μm (see the ESI,† “Optical setup”). The sample is moved using a 3-axis piezo-driven stage (Hera P733 for xy scan, coupled to a Pifoc-P725, for z scan, Physik Instrument, D) mounted on an inverted microscope (Nikon TE300, Nikon, JP).
:Sa femtosecond laser source (wavelength λ = 800 nm, repetition rate R = 80 MHz and pulse width τP ≅ 250 fs, linearly polarized) focused using a water immersion microscope objective (Olympus LUMFI 60x, N.A. = 1.1, 1.5 mm WD) on the sample with a beam waist ω0 = 0.44 μm (see the ESI,† “Optical setup”). The sample is moved using a 3-axis piezo-driven stage (Hera P733 for xy scan, coupled to a Pifoc-P725, for z scan, Physik Instrument, D) mounted on an inverted microscope (Nikon TE300, Nikon, JP).
The micro-structures are drawn in Tinkercad (https://www.tinkercad.com/) (Fig. 1A) and the mesh files (in STL format) are sliced and rasterized by a custom Python code (Fig. 1B) providing a stack of Boolean matrices of x, y and z coordinates. The rasterization is performed with a pixel size dxy in the horizontal planes and a slice spacing dz along the axial direction. The resulting coordinates define the scan path, i.e. the locations in space where the laser scans with scanning speed vs and waist ω0 and irradiates the resist for a pixel dwell time  , sufficiently long to polymerize the resist. Depending on the structure shape and symmetry properties, the sequence of coordinates is sorted based on a Cartesian (x, y, z) or polar (ρ, θ, z) scan path (Fig. 1C). In both the coordinate systems, the z axis is perpendicular to the capillary wall and it is parallel to the microscope objective optical axis. In the Cartesian path, the coordinate values are sorted with increasing values of x and y and voxels are scanned along a conventional raster pattern. In the polar path, coordinates are sorted at increasing values of the radius ρ and azimuthal angle θ and pixels are scanned radially (Fig. 1C). The sorting procedure allows scanning each pixel only once, thereby avoiding the oversampling of the resist at small ρ values. The Boolean matrix of sorted coordinates is stored on a SD card and read by an Arduino Uno board, which converts coordinates into three analog DC voltage values (Vx, Vy, Vz) via dedicated DAC (digital-to-analog converter) shields (0–10 V range). 3D scanning is achieved by driving the x–y and z piezo-actuators and occurs in a top-bottom configuration (from the top inner silica wall of the capillary to the bottom, towards the microscope objective) to avoid the scattering (and aberration) of the laser beam by the voxels that have been already polymerized during the fabrication of a thick 3D structure.41
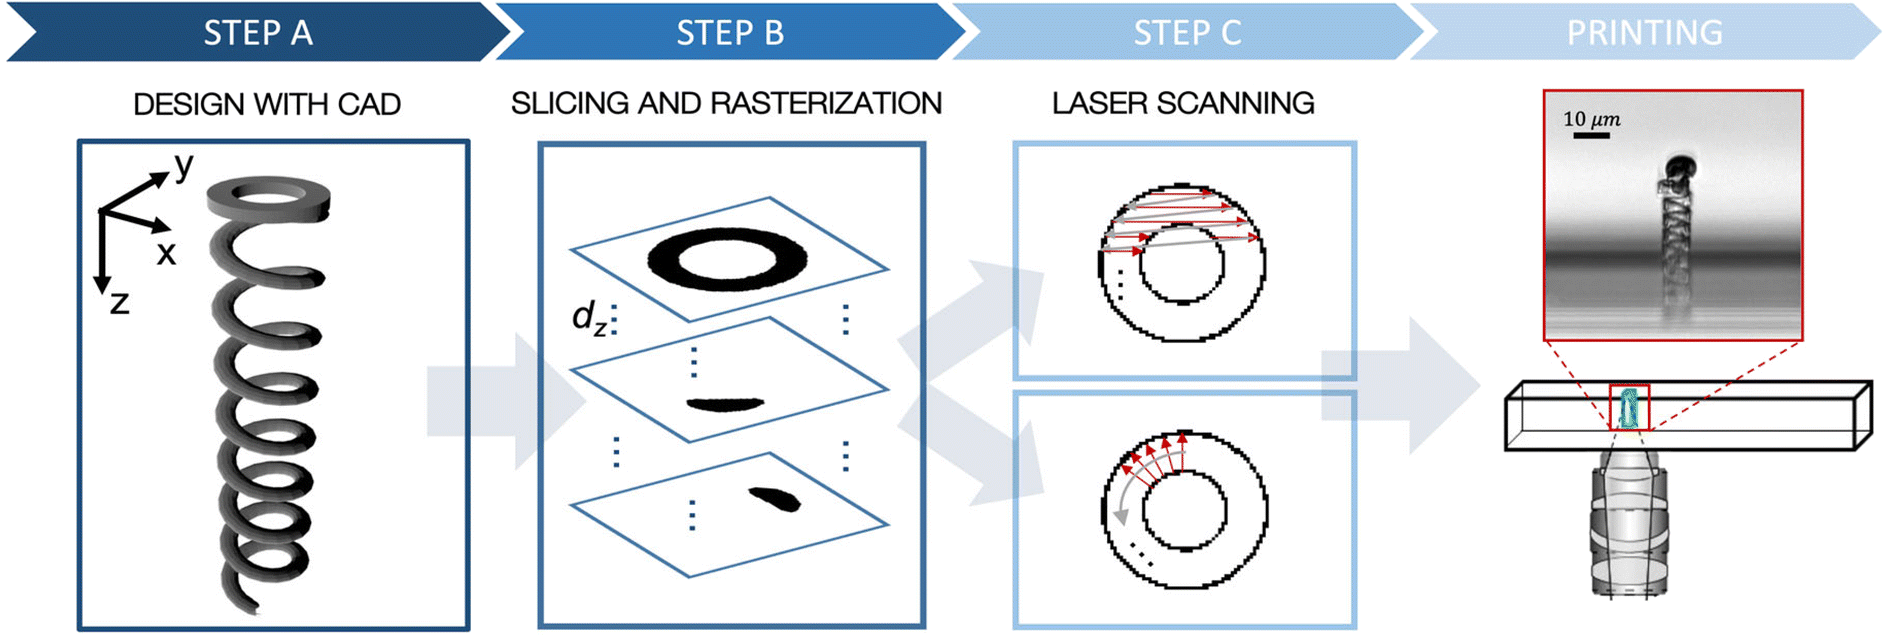 | ||
| Fig. 1 Fabrication pipeline. The structure is first drawn in a CAD software and exported as STL file (step A). Then the mesh file is sliced and rasterized with adjustable z-step dz and pixel size dxy in order to obtain a Boolean matrix stack (step B). Finally, the coordinate stack is sorted according to a Cartesian or polar system (step C) and sent to the electronic board to drive the laser scanning. The result of the printing procedure is exemplified on the right with the transmitted-light image of a helicoidal structure with a filled sphere on the tip. | ||
A scanning speed vS = 16 μm s−1 in the x–y plane and a resulting laser pixel dwell time τD ≅ 28 ms were used for all the microstructures exploited in the present work. Scan pixel sizes have been fixed to dxy = 100 nm and dz = 500 nm. Overall, at given laser intensity, the same deposited laser dose was employed for the Cartesian and polar scan paths; provided that the mechanical properties of the fabricated structures are expected to be especially affected by the employed laser dose,20 this choice allows comparing structures produced with different scan paths. A typical laser output power in the range P = 150–350 mW was employed for fabrication, corresponding to a laser peak intensity  ,40 where T is the overall transmittance of the optical elements between the laser and the sample plane (T = 0.33 in our setup).
The employed polarization of the laser beam is linear and orthogonal to the raster scanning x-direction. For the polar scan such a linear polarization implies a slight change in the fabrication resolution based on what has been recently pointed out and studied by Malinauskas and coworkers,46 who were able to measure a ±2.5% effect on the fabrication spatial resolution due to the polarization. For a typical fabrication feature size of about41 400–700 nm for our BSA-based resists, this translates into a 10–20 nm variability; considering a microstructure of 1.5 μm in thickness (as in the case of the wall of cylinders and pillars here), the expected overall width variability is about 1.3–2.6% and can be therefore neglected. At the same time, we do not expect a laser scanning induced orientation of the BSA monomer, since BSA is a small globular protein with an average hydrodynamic radius of ±10 nm.47 We have indeed previously performed non-linear imaging of our BSA micro-hydrogels without any indication of a second harmonic signal,41 which would arise instead in the presence of protein fibrils.
2.3 Flow measurements, tracking algorithm and digitalization
For the measurement of the structure deflection under continuous microfluidic flow, the micro-channel was clamped on the sample plate holder of a Leica TCS SP5 confocal fluorescence microscope (Leica Microsystems, D) and connected through an inlet Teflon tube to the syringe pump (NE-300, KF-technologies, I). The outlet tube was left open in air.We tested the continuity of the flow induced by the NE-300 pump (see the ESI,† “Test of the continuity of the flow induced by the microfluidic pump”) and calibrated the flow speed in the capillary by tracking 1 μm fluorescent beads as a function of the volumetric rate set on the pump (see the ESI,† “Calibration of the flow speed in the capillary”). The flow speed at the microstructure tip was quantified by taking into account both the flow speed profile in the square capillary48 (see section 3.2) and the ∼1500 time increase of the flow speed in the capillary due to the decrease of the cross-section area between the syringe piston (13 mm diameter) and the capillary itself (300 μm × 300 μm section). The microstructures, while subjected to microfluidic flow with typical flow rate Q = 0.2–2.4 mL min−1, were visualized by time-lapse imaging (2.73 frames per s frame rate) either in transmitted-light mode or by detecting the fluorescence signal (λexc = 561 nm, λdet = 570–600 nm) of the residual rose bengal used as a photo-initiator. The square capillary cross-section allows us to acquire images both in top and cross-sectional views, by simply rotating the capillary by 90°.
In order to track the shape and the position of the microstructures, transmitted-light image sequences were analysed by means of the Java tracking software VideoTracker (Open Source Physics project, https://www.compadre.org/osp, V.6.0.1), which provides the coordinate versus time plot of selected features of the microstructures. The software tracking accuracy has been tested by analysing the simulated dynamics of bending structures (see the ESI,† “Test of the tracking software”).
2.4 AFM measurements
The surface morphology (width and thickness) and the elasticity of the microstructures were examined on a Nanoscope II (JPK Instruments, Berlin) Atomic Force Microscope (AFM) equipped with a MLCT-BIO standard probe (BrukerProbes, 2.5–4.5 μm tip height, average tip angle = 35° ± 2°) for the liquid environment. In order to perform AFM measurements, microstructures were fabricated in a custom chamber made up of two coverslips separated by plastic O-rings by using the same top-bottom printing configuration exploited in the capillaries. The lower coverslip was subsequently removed to enable access to the structures during AFM experiments. Prior to each experiment, every cantilever (nominal spring constant for cantilever k = 0.1 N m−1) was individually calibrated in fluid using the Thermal Noise method49,50 in the JPK software.The elastic Young's modulus E of the fabricated microstructures was measured by means of force–indentation curves acquired at about 70 different positions on the upper surface of a rectangular parallelepiped (40 μm × 40 μm × 2.7 μm). The Young's modulus was measured by the second order fitting of the compression force (F(δ))–indentation (δ) relationship. From the fit curvature of this plot to the Hertz model function, 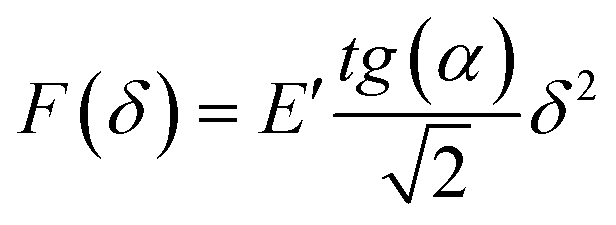 , and by assuming a tip aperture angle (four-sided pyramidal tip; α = 20°, producer data), we could estimate51 the reduced Young's modulus E′. E′ is related by the Poisson ratio of the tip (μtip) and of the material (μsample) to the Young's modulus of the tip, Etip, according to the relation:
 | (1) |
3. Theoretical background
3.1 Euler–Bernoulli theory
A prismatic beam of length L with uniform elastic modulus E under pure bending is bent into an arc. The shape of the bent beam is described by the displacement x(z) with respect to the straight configuration (Fig. 2A) as a function of the distance z of the cross-section from the constrained base of the beam. By denoting the momentum of the force (bending momentum) applied along the beam as M(z) and the area moment of inertia as I, the approximate differential equation for the shape of the beam under stress is: | (2) |
 and
and  respectively. R and r are the external and internal radii of the circular cross-section, while D and d are the external and internal sides of the square cross-section.
 | ||
Fig. 2 Sketch of the deflection of a microstructure under the effect of a hydrodynamic force in a microcapillary. (A) Deflection of a beam under the action of a force applied to the free tip. The boundary conditions are  . (B) Contour levels of the flow speed predicted in a rectangular cross-section capillary48 with height h and width w. . (B) Contour levels of the flow speed predicted in a rectangular cross-section capillary48 with height h and width w. | ||
Two configurations are typically analysed in the literature, corresponding to the cases where the force is distributed equally along the beam or applied only to the tip of the beam.53 Since the flow speed rapidly decreases to zero (sticky boundary condition assumption) in the 50 μm layer close to the glass wall of the capillary where the microstructures are fabricated, we assume that their bending is due only to the maximum force that acts on the microstructure tip, Ftip. In this case, the solution of eqn (2) gives (see the ESI,† “Euler–Bernoulli theory applied to hollow microstructures”) a total bending δxeq equal to
 | (3) |
 | (4) |
3.2 Drag force in microfluidic channels
Both the inertial and the viscous forces are needed to describe the displacement of a microstructure under the action of fluid flow. In our experiments, the microstructures are fabricated on the internal walls of a capillary, extend in the y–z plane (Fig. 2A), which is the cross-section plane of the microcapillary, and bend under the effect of the drag force acting along the x axis (Fig. 2A). The flow speed along the x-direction depends on the distance from the capillary walls in the yz plane and it is described, under the assumption of sticky boundary conditions, by:48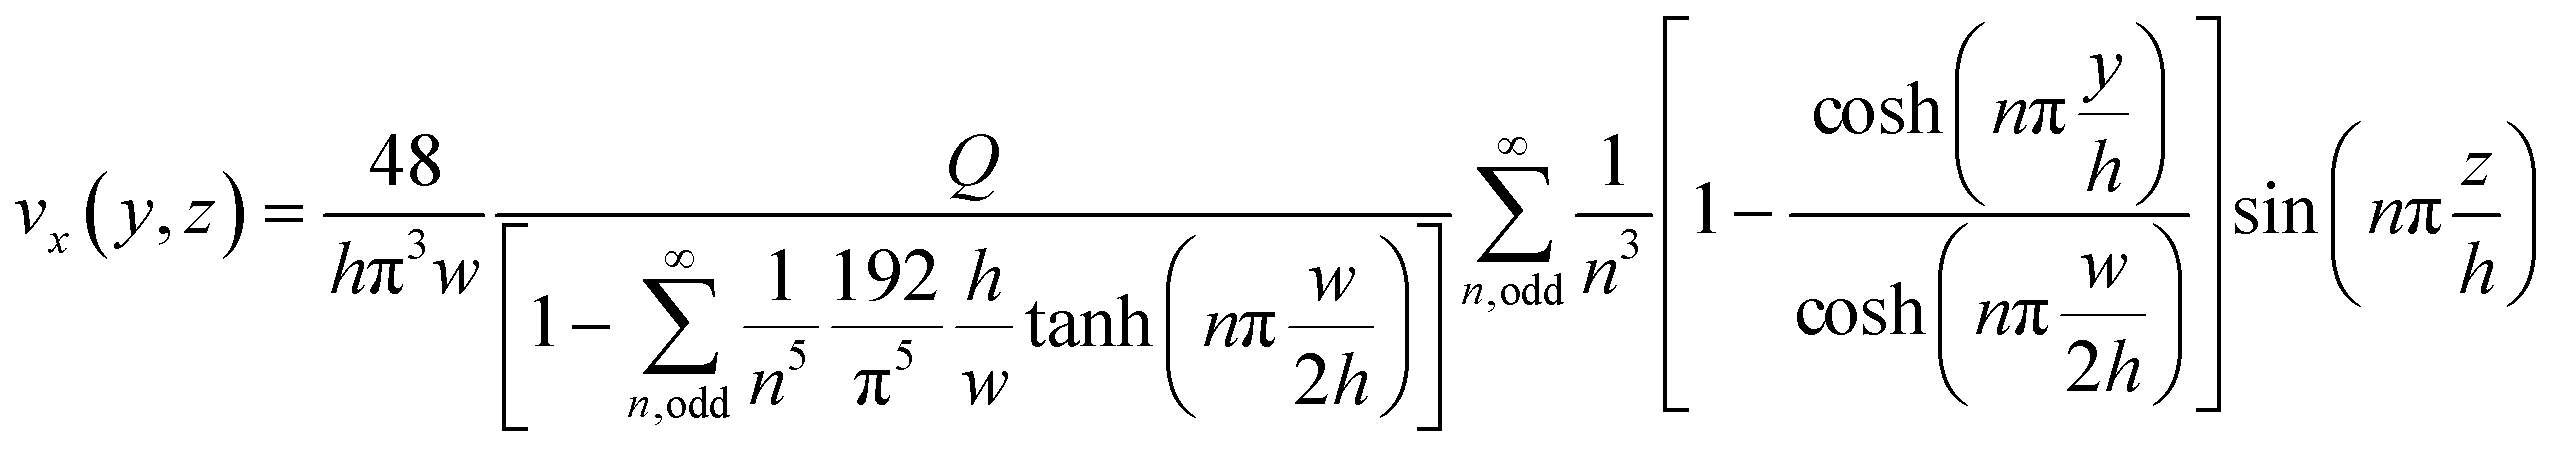 | (5) |
The limit of the fluid drag force in the creeping flow regime is the viscous force, Fη = fv, which is directly proportional to the viscous friction coefficient f and to the speed of the object relative to the medium (here, the flow speed value v acting at the structure tip along the x direction). The translational friction coefficient of a straight cylinder can be approximated according to the theoretical treatment developed by the Garcia de la Torre group54 as:
 | (6a) |
 | (6b) |
The flexibility and the proximity of the microstructure to the capillary wall may also have some effect on the friction factor. The cross-section of the structure against the flow changes with the bending and varies with time as for sessile organisms both in air and in water,34,37 and we will exploit this analogy in order to derive possible approaches to this problem (Discussion section). The friction coefficient of an object increases with the proximity to a wall due to hydrodynamic interactions.55 For a sphere with diameter D the correction to the friction coefficient increases as the inverse of the rescaled distance from the wall z/D and it is lower for motions parallel to the wall (this is the case here) than for motions perpendicular to it. We can estimate that a sphere with D ≃ 8 μm set at a distance z ≃ 50 μm from the capillary wall, which approximates the tip of the microstructures, would need a correction of about 4% to the friction factor (Fig. 3A in ref. 55). A better evaluation of the hydrodynamic interactions should resort to numerical simulations.
 | ||
| Fig. 3 Microscopy images and AFM indentation experiments on two-photon polymerized microstructures. (A) and (B) Confocal fluorescence images (green) and transmitted-light images (greyscale) for a uniform photo-polymerized thin parallelepiped with thickness 1 μm ≤ h ≤ 7 μm (A) and for a capped hollow cylinder of thickness 10 μm (B) both fabricated at 1.38 TW cm−2 laser intensity. (C) and (D) Representative Young's modulus measurement on a uniform photo-polymerized thin parallelepiped (h = 1.0 μm) (D), well correlated with the structure topography (C), i.e. with the height profile of the parallelepiped. The AFM images (C) and (D) represent an enlargement of the left upper corner of the photo-polymerized parallelepiped, together with the lateral glass substrate where the layer is fabricated. (E) Measurement of the compression Young's modulus derived from the analysis of the AFM indentation curves with the Hertz model (not shown) as a function of the thickness of the uniform layers (open squares) and capped cylinder (filled square, height h = 10 μm, radius = 5 μm; the hollow cylinder has been capped to enable the structure contact with the AFM tip). | ||
The inertial force Fρ, due to the fluid mass displacement, is the limit of the fluid drag force in the turbulent regime and is quadratic with the object-flow speed for rigid objects:37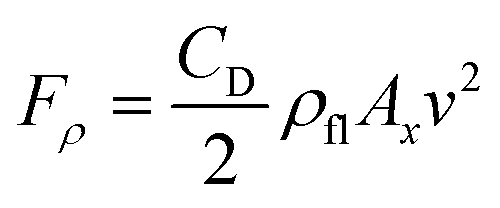 , where ρfl is the fluid (water) density, and Ax ≅ LD is the microstructure cross-section against the fluid. Again, we approximate the flow speed along the x axis v with its value at the structure tip. The drag coefficient CD can be obtained from studies of the flow past cylinders,56,57 and at low Reynolds number it lies in the range 0.9 ≤ CD ≤ 1.1.
We assume here that the force Ftip acting on the structure tip in eqn (3) is given by a linear superposition of the viscous and the inertial forces,  . As pointed out in the review process, this assumption cannot be taken for granted simply on the basis of the dimensional analysis of the Navier–Stokes equation (eqn (2.38) in ref. 48). However, it can be justified in analogy to the expansion58 of the drag force over the Reynolds number, valid for Rey ≤ 1, and on the basis of the experimental data of the friction factor over a wide range of Reynolds numbers (Rey ≤ 105, Fig. 6.3-1 of ref. 59). As discussed in detail in the ESI† (ESI, “The total fluid force acting on a sphere in intermediate Reynolds number regime”), the average discrepancy between the total force acting on a sphere in a viscous medium and the approximation Fη + Fρ amounts, for CD = 0.9, to ±14% in the range of Reynolds numbers 5 ≤ Rey ≤ 150 explored in the present work (see Fig. S17†). Therefore, we assume here that the simple superposition of the inertial and the viscous forces adequately describes in our experimental case the force that the fluid exerts on the tip of the micro-structure.
4. Results
4.1 AFM indentation experiments
Indentation experiments by Atomic Force Microscopy were exploited at first to characterize the Young's modulus E of the polymerized proteinaceous parallelepiped or cylindrical microstructures. To this aim, microstructures in the form of uniform thin layers were photo-polymerized on glass slides. Optical transmission and fluorescence measurements indicate that the layers are uniform (Fig. 3A) for a given value of the laser intensity and scanning speed. The Young's modulus, quantified by fitting the force-indentation curves measured by AFM to the Hertz model, is uniform over a single structure (Fig. 3D) and lies in the range 1.2 MPa ≤ E ≤ 1.8 MPa (Fig. 3E). The Young's modulus slightly increases for a thickness lower than 2 μm, as expected since the glass slide has, on average, a much higher E value (E ≅ 20 MPa, Fig. 3D). The average value of the modulus E for thickness values ≥4 μm is E = 1.4 ± 0.4 MPa. Similar results were obtained on capped hollow cylinders (Fig. 3B and E), leading to E = 1.3 ± 0.7 MPa.4.2 Non-equilibrium measurement of the Young's modulus
We assume (eqn (3) and (4)) that the elasticity of the microstructures can be described by an effective elastic constant that can be measured from the equilibrium bending under the action of the hydrodynamic force as . The effective elastic constant of the microstructures depends on the writing intensity, the scanning steps and the structure cross-section. The question arises whether we can describe all the geometrical embodiments of the microstructures (shape of the cross-section, length and diameter) with a single Young's modulus that depends only on the fabrication parameters, as typically done at the macroscopic level. A series of bending dynamic experiments were therefore performed on square cross-section hollow pillars and hollow cylinders (Table 1) fabricated with variable laser intensity in the range 0.8 TW cm−2 ≤ I ≤ 2 TW cm−2. Bending was induced by a microfluidic flow with speed values at the micro-structure tip lying in the range 0.02–0.9 m s−1. Examples of bending dynamics (for samples P1 and C2 in Table 1) derived by tracking the micro-structure tip on time-lapse transmitted-light acquisitions (Fig. 4A–D) reveal that the bending takes place on two time-scales: a first rapid bending occurs faster than the 0.37 s frame acquisition time, and a second one occurs on a much longer (≅10–50 s) time scale and accounts for the largest component of the total bending. Right after the flow is stopped, the structures slowly approach the original straight configuration with a long (≅50 s) relaxation decay time. The bending dynamics can be fit to a bimodal exponential growth with two characteristic exponential rise times. These are independent of the applied flow speed and can be derived by a global fit of the deflection curves quantified on the same microstructure at increasing flow rate (Fig. 4A–D). For both cylinders and pillars, the exponential rise times as well as the overall bending of the structures decrease with the increase of the polymerization laser intensity (Fig. 4A and Cversus B and D). Interestingly, an additional quasi-periodic dynamic component is present for the micro-structures fabricated at lower laser intensity (Fig. 4A and C).
 | ||
| Fig. 4 Non-equilibrium measurement of the Young's modulus. (A)–(D) Bending dynamics of cylinders (A and B) and square cross-section pillars (C and D) (samples P1 and C2 in Table 1) fabricated with laser intensity I = 0.88 TW cm−2 (A and C) and I = 1.65 TW cm−2 (B and D). The structure deflection δx is quantified in a microfluidic channel under the action of the hydrodynamic force; the flow speed is color-coded in the legend and increases in the direction of the arrows. Data are overlaid to the best global fit to a double-exponential growth δx = A1(1 − e−t/τfast) + A2(1 − e−t/τslow) with shared growth times for each fabrication laser intensity and structure geometry. The best-fit parameters are τfast ≅ 1.1 ± 0.2 s and τslow = 58 ± 14 s (cylinders, I = 0.88 TW cm−2), τfast ≅ 0.69 ± 0.04 s and τslow = 42 ± 1 s (cylinders, I = 1.65 TW cm−2), τfast ≅ 1.3 ± 0.2 s and τslow = 68 ± 24 s (pillars, I = 0.88 TW cm−2), τfast ≅ 1.1 ± 0.1 s and τslow ≅ 26 ± 2 s (pillars, I = 1.65 TW cm−2). For each bending curve, the equilibrium deflection δxeq is retrieved from best-fit amplitudes as δxeq = A1 + A2. Note that at low fabrication intensity the bending dynamics shows periodic oscillations. (E) Example of structure bending, reported with the superposition of two frames (right before flow activation and right before flow deactivation) of the time-lapse image sequence acquired on the laser scanning microscope in transmitted-light mode. | ||
We focus at first our analysis on the equilibrium total deflection of the microstructures. The maximum equilibrium deflection δxeq extracted from the double-exponential fit of deflection (δx vs. time) curves (Fig. 4A–D) scales with the flow speed according to a parabolic law δxeq = av(1 + bv), where v is the speed of the fluid at the tip of the microstructure (Fig. 5A and B). By substituting the explicit expression of the fluid viscous and inertial forces in eqn (3), the two fitting parameters have the following meaning (see sections 3.1 and 3.2): a = f/keff and b = CDρflAx/(2f), where keff is the bending elastic constant, f is the microstructure friction factor and CD ≅ 0.9–1.1 for an elongated rod.56,57 Once the friction factor is computed from the structure geometrical parameters (eqn (6a)), the best-fit linear coefficient, a, provides us with the bending elastic constant for the microstructure. This happens to fall in the range 0.8 nN μm−1 ≤ keff ≤ 50 nN μm−1. Even lower values of the elastic constants can be retrieved for micro-spirals (keff ≃ 0.005 nN μm−1; see the ESI,† “Elastic constant of micro-helices”). The second order coefficient b is independent on the microstructure elastic constant and depends only on the microstructure geometry. This parameter can therefore be evaluated from a global fit to a whole series of data acquired on microstructures with identical shapes fabricated at different laser intensities. For the structures exploited in Fig. 4 and 5, the friction coefficient is f ≅ 4.9 × 10⁻⁸ Ns m−1, CD ≅ 1 and the structure cross-section is Ax ≅ LD ≅ 4 × 10⁻¹⁰ m2, leading to an expected value b ≅ 4.1 s m−1. This predicted value can be compared with the experimental best fit value bpillars = 6 ± 2 s m−1 for pillars and bcylinders = 8 ± 2 s m−1 for cylinders (Fig. 5A and B). bpillars agrees with the expected value, whereas bcylinders appears to be overestimated. We reason that the discrepancy originates from the overestimate of the area Ax in the computation of the inertial force: differently from the case of pillars, for cylinders, the effective area that contributes to the drag is lower due to the curvature of the cylinder.
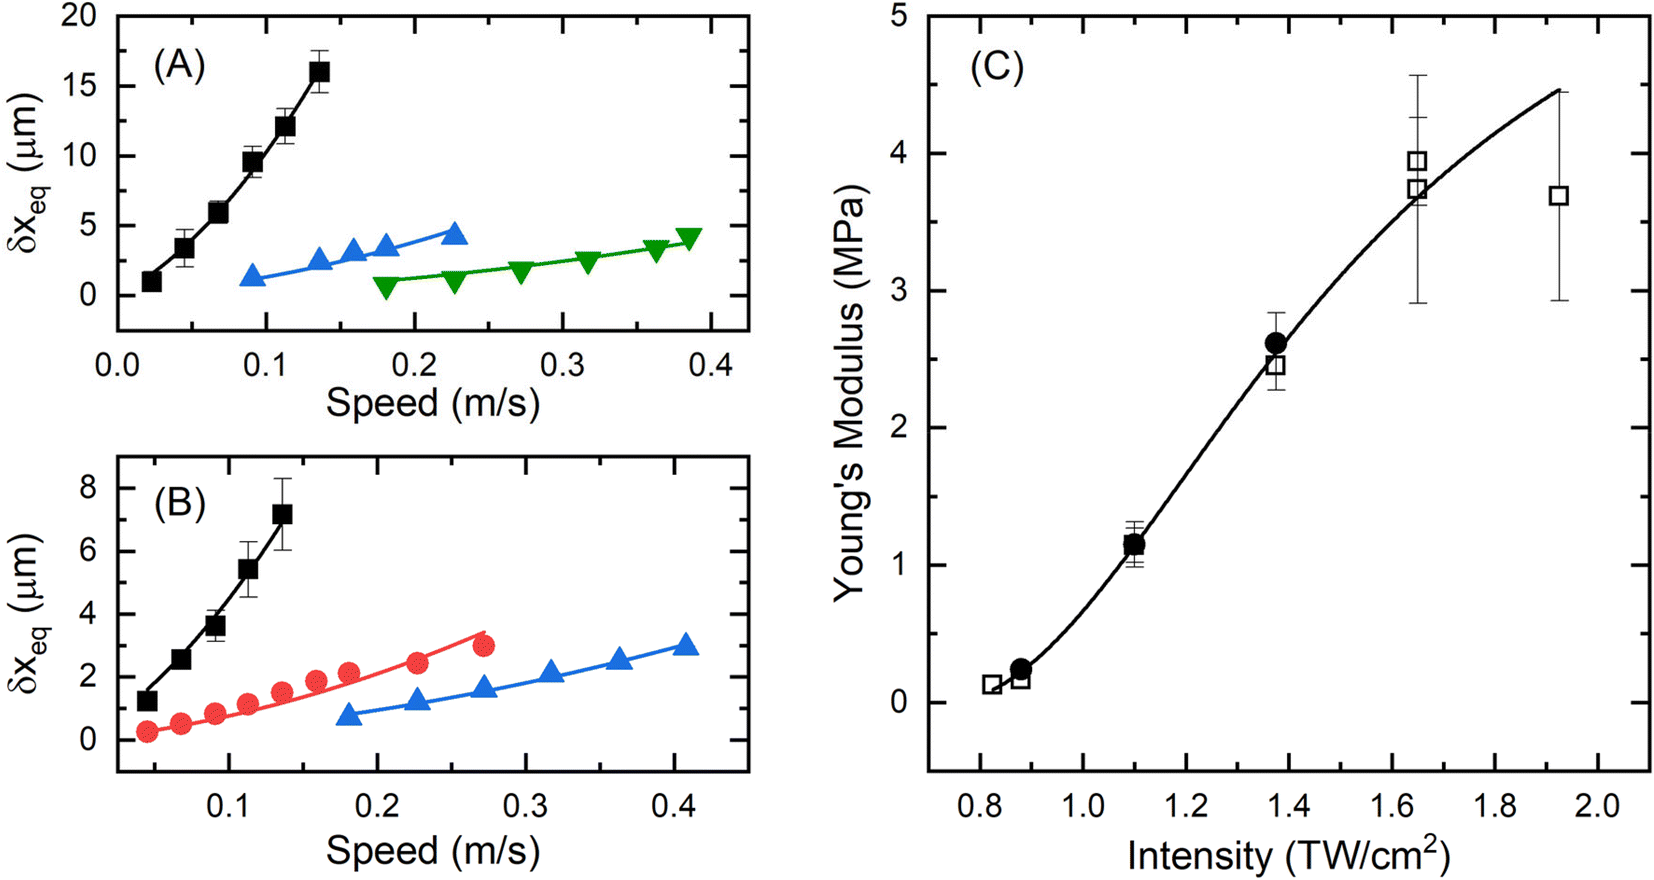 | ||
| Fig. 5 Young's modulus dependence on the fabrication laser intensity. (A and B) Equilibrium deflection δxeq of cylinders (C1 type in A) and pillars (P1 type in B) under microfluidic flow, as estimated from the two-component exponential fit of δx-versus-time plots (see Fig. 4A–D), as a function of the flow speed at the free tip of the structure. Symbol code for the fabrication intensity (I1 = 0.88 TW cm−2 squares, I2 = 1.10 TW cm−2 circles, I3 = 1.38 TW cm−2 up triangles, I4 = 1.65 TW cm−2 down triangles). Solid lines are the data best fit to a trial function δxeq = avx (1 + bvx), with best fit parameters aI1 = 58 ± 7 μs, aI3 = 7.5 ± 1.2 μs and aI4 = 2.5 ± 0.5 μs for cylinders and aI1 = 28 ± 4 μs, aI2 = 4.8 ± 0.9 μs and aI3 = 2.2 ± 0.5 μs for pillars. The curvature parameter b has been fit globally to the various intensity level data: bpillars = 6 ± 2 s m−1 for pillars and bcylinders = 8 ± 2 s m−1 for cylinders. (C) Young's modulus E measured on square cross-section pillars (filled circles) and cylinders (open squares). E values have been derived from eqn (3) and (4) in the presence of both the viscous force and the inertial force. The solid line is the best fit to the trial function E = E∞((I − Ith)/(Isat − Ith))2/[1 + ((I − Ith)/(Isat − Ith))2] with E∞ = (6.5 ± 0.9) MPa, Ith = (0.73 ± 0.02) TW cm−2 and Isat = (1.5 ± 0.1) TW cm−2. | ||
Once the effective elastic constant keff is retrieved from the best fit parameter a = f/keff, eqn (4) allows in turn deriving the Young's modulus. The resulting Young's modulus of microstructures with variable geometrical parameters (Table 1) polymerized with increasing laser intensity (0.8–2 TW cm−2) is reported in Fig. 5C and reveals that all the microstructures follow a similar curve which is well described by the trial function E = E∞((I − Ith)/(Isat − Ith))2/[1 + ((I − Ith)/(Isat − Ith))2], resembling the trend of the excited state population under two-photon excitation as found from fluorescence experiments.60–62 The writing threshold intensity,41Ith ≅ (0.73 ± 0.02) mW, depends on the photo-resist composition.40,63Fig. 5C shows that, by just changing the writing intensity in the 0.8–2 TW cm−2 range, we can increase the Young's modulus from ≈100 kPa to about 4 MPa. In principle, by further increasing the laser intensity I > 2 TW cm−2, we could approach values of the Young's modulus close to E∞ = 6.5 ± 0.9 MPa. However, micro-bubbles form in the resists for I ≥ 2.5 TW cm−2, preventing the fabrication above this laser intensity.
It is finally worth remarking that, while the dependence of the maximum deflection δxeq on the flow speed provides access to the Young's modulus E of the structures, the retrieval of E from the characteristic exponential rise times of deflection (δx vs. time) curves is not straightforward.
Having analyzed the maximum equilibrium deflection, δxeq, we now focus on the bending dynamics of the microstructures. As noted in the previous paragraph, depending on the structure elastic constant and the flow speed, the bending dynamics is characterized by an undamped oscillatory behavior occurring on top of the overall bending dynamics. The undamped character of the oscillations is contrary to what is expected for the dynamics of a purely elastic spring in a viscous medium at finite temperature.64,65 The oscillatory behavior is observed mostly on soft microstructures (keff ≅ 8 nN μm−1 or less), corresponding to fabrication intensity levels of about 0.80–1.38 TW cm−2. This oscillatory behavior cannot be ascribed to artefacts of the tracking algorithm, nor to pump-related oscillations of the flow speed (see the ESI,† “Test of the continuity of the flow induced by the microfluidic pump”). Moreover, the amplitude of the oscillations is higher than the pixel discretization (0.5–1.3 μm, to be compared to 0.2 μm as visible in Fig. 4). After the microfluidic flow stops, the structures slowly (relaxation times ≅10–50 s, Fig. 4) recover the original straight configuration. All these features suggest that the polymerized network has viscoelastic properties.66
The un-damped oscillatory behaviour can be characterized by means of Fourier analysis (see the ESI,† “Analysis of the bending oscillatory dynamics”). Examples of the Fourier spectra of the bending dynamics are reported (Fig. 6) for cylindrical hollow microstructures (sample C2, Table 1) polymerized at I = 0.88 TW cm−2 and I = 1.38 TW cm−2, and for square cross-section pillars (sample P2, Table 1) polymerized at I = 1.38 TW cm−2. In most cases, we observed a dominant component flanked by minor ones. Only in a few cases, overtones were clearly detected (Fig. 6A2).
 | ||
| Fig. 6 FFT analysis of the bending dynamics. Fourier spectra of the bending dynamics of microcylinders (sample C2 in Table 1) polymerized at I = 0.88 TW cm−2 (A1–A4) and I = 1.38 TW cm−2 (B1 and B2) and of micropillars (sample P2 in Table 1) polymerized at I = 1.38 TW cm−2 (C1 and C2) for increasing values of the flow speed. The values of the flow speed and keff are: v = 0.068 m s−1 (A1), v = 0.091 m s−1 (A2), v = 0.11 m s−1 (A3), v = 0.14 m s−1 (A4), keff = 0.8 nN μm−1 (A1–A4); v = 0.091 m s−1 (B1), v = 0.14 m s−1 (B2), keff = 4.5 nN μm−1 (B1 and B2); v = 0.16 m s−1 (C1), v = 0.18 m s−1 (C2), keff = 2.0 nN μm−1 (C1 and C2). Error bars are the standard deviations obtained by computing the FFT on different stretches of the same bending dynamics time trace. The solid red lines are the best multi-Gaussian fits to the data. The best fit Gaussian components have been used to compute the 〈f〉Th frequency and the FFT amplitude as described in the ESI† (“Analysis of the bending oscillatory dynamics”). Horizontal lines represent the values of 〈f〉 (thin gray line) and 〈f〉Th (thick black line): the length corresponds to the average ± standard deviation. | ||
The FFT spectra were then fit to a sum of Gaussian components. Based on this, we can directly assign to each microstructure and to each flow speed a characteristic frequency 〈f〉, measured as the average of the peak frequencies of the Gaussian components weighted over their amplitudes (see the ESI,† “Analysis of the bending oscillatory dynamics”). In order to evaluate the dominant frequency component, we refined the amplitude weighted average by limiting the average to the components with fractional amplitude larger than a predefined threshold, Th. The resulting characteristic frequency, referred to as 〈f〉Th, is considered in the following as a measure of the oscillation frequency of the spectra, without the effect of overtones. For threshold values Th = 10%, the difference between 〈f〉Th and 〈f〉 is limited, on average, to 17% (Fig. 6; see the ESI,† “Analysis of the bending oscillatory dynamics”), supporting the existence of a dominant component in the spectra.
The value of 〈f〉Th spans a range 0.3–1.5 Hz and is not markedly correlated with the flow speed in the capillary (Fig. 7A, inset). The sum of the amplitudes of the frequency components, FFTamp, is taken as a measure of the weight of the oscillatory behaviour with respect to the smooth bending relaxation growth. Differently from the average frequency 〈f〉Th, the value of the FFTamp parameter changes by about 30 times over the range of investigated flow speed and elastic constants, but again it does not show a simple dependence on the flow speed (Fig. 7B, inset).
 | ||
Fig. 7 Results of the FFT analysis of the bending dynamics. (A) Fourier frequency 〈f〉Th as a function of the rescaled flow speed vresc = vkαeff, for α = 0.35. The two dashed lines are the best linear fits to the frequency data below (black symbols) and above (red symbols) the threshold  for for 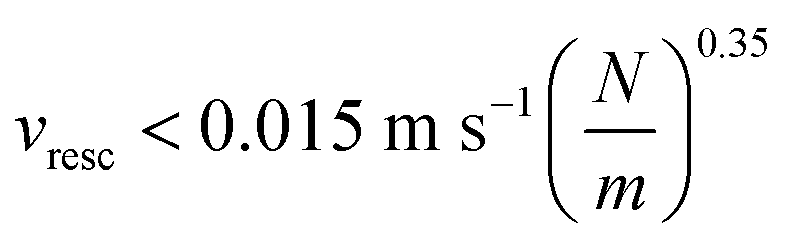 and 〈f〉Th ≅ (6.2 ± 0.5) vresc for and 〈f〉Th ≅ (6.2 ± 0.5) vresc for  , respectively. Inset: 〈f〉Th as a function of the flow speed at the tip of the structure. (B) FFT amplitudes for the same cases of panel (A). The dashed line is the best hyperbolic fit FFTamp ≅ vresc−2. Inset: FFTamp as a function of the flow speed. , respectively. Inset: 〈f〉Th as a function of the flow speed at the tip of the structure. (B) FFT amplitudes for the same cases of panel (A). The dashed line is the best hyperbolic fit FFTamp ≅ vresc−2. Inset: FFTamp as a function of the flow speed. | ||
The response of the microstructure to the bending should be clearly related to the effective spring constant: higher oscillation frequencies should correspond to higher elastic constants. Analogously, we expect that the amplitude of the FFT spectrum decreases with the oscillation frequency. We have then searched for a possible universal description of 〈f〉Th, and of FFTamp, as a function of a rescaled variable vresc = vkαeff, which takes into account both the effect of the drag force (through the flow speed v) and of the elastic force (through keff). As shown in Fig. 7, by an exponent α ≅ 0.35 we can indeed find universal fitting functions that describe the whole set of data, irrespective of the shape of the structure cross-section and of the fabrication intensity. The best value of the α exponent has been obtained by means of a global fit of the 〈f〉Th and FFTamp parameters to simple polynomial trial functions, as fully described in the ESI† (“Global fit of the frequency spectrum”).
The trend of the characteristic frequency 〈f〉Th with respect to the rescaled speed vresc seems to be described by a bimodal linear function with a discrete jump at about  . Indeed, the data appear to fall on two linear trends (Fig. 7A) with slopes that are in the ratio ≃3.0 ± 0.3. Such a behaviour is compatible with the onset of two normal modes of the microstructure oscillation. It is noteworthy that we cannot follow the increase of the characteristic frequency of the lower mode much above 1.5 Hz, due to the Nyquist limitation of our data (time resolution ≅ 0.36 s). The trend of the sum of the amplitudes of the frequency components, FFTamp, is clear and well described by a hyperbolic decrease FFT ≅ vresc−2 (Fig. 7B). This is expected since the motion amplitude of a harmonic oscillator scales with the square of the frequency, which scales here as vresc.
5. Discussion
5.1 Equilibrium conditions
The two-photon fabricated proteinaceous network has an elastic bending modulus that extends over a wide range of values, 0.02 MPa ≤ E ≤ 4 MPa, modulated by the laser fabrication intensity (Fig. 5C) and by other parameters, such as the raster scanning step and speed, characterized elsewhere.41 The measurement of the effective elastic constant from microfluidic experiments, which has been made possible here by the fabrication of the microstructures directly within microcapillaries, allowed us to evaluate the Young's modulus and verify the Euler–Bernoulli theory at the microscopic level. The retrieval of a single curve describing the trend of E as a function of the laser intensity (Fig. 5C), independent of the microstructure geometry (circular or square cross-section) and size, is an indication of the reproducibility of our fabrication method, irrespective of the Cartesian or polar scanning algorithms. It allows an independent and static evaluation of the Young's modulus of the proteinaceous cross-linked matrices with respect to the AFM experiments (Fig. 3). The bending elastic constant of the hollow microstructures spans a range of 0.8 nN μm−1 < keff < 50 nN μm−1. These values make the microstructures particularly suitable to study cellular mechanobiology.67–695.2 Bending dynamics
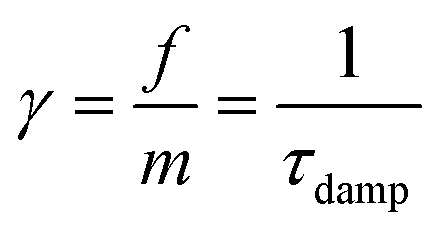
The dynamic experiments on the proteinaceous polymerized microstructures show evidence of bending with very slow relaxation times (τslow, see Fig. 4), of the order of tens of seconds. Such a slow relaxation is a clear indication of viscoelasticity.70Two characteristic times can be identified in the dynamics of a pure elastic beam under a sudden change of the flow: the elastic relaxation time of the bendable structures under the action of the viscous damping, τdamp, and the flow onset time in the capillary, τonset. The damping time for a deformable object of mass m with viscous friction factor f can be roughly estimated by  (see below for a more accurate estimate). From the mass of the hollow microstructures m ≅ 3 ng (we assume here a protein density ρp ≅ 1.4 g mL−1) and from the friction factor (see eqn (6a)) f ≅ 6 × 10⁻⁸ Ns m−1, we can compute a value τdamp ≅ 0.05 ms, which is much smaller than the observed relaxation bending time τslow. Similarly, the onset time of the flow in the capillary (of width w) occurs over a characteristic time48
 where ηk ≅ 10−6 m2 s−1 is the kinematic viscosity and γ1 = 2.4. In our case (w ≅ 300 μm) the flow onset time is τonset ≅ 15 ms, one order of magnitude lower than our 0.37 s image sampling time in bending experiments. The slow bending time, τslow, is then a clear indication of viscoelastic behaviour of the polymerized network,66 as also observed recently for nanowires fabricated by photo-polymerization in Ormocomp polymer-based resists.70 The viscoelastic behavior is further confirmed by the slow recovery of the initial straight conformation after the flow is stopped (see Fig. 4). The equilibrium bending analysis reported in previous paragraphs, relying on the Euler–Bernoulli theory that is valid for pure bending, should then be considered as an approximation, which only provides the low frequency value of the Young's modulus.
It is noteworthy that the lowest mode elastic frequency of the microstructures scales as the square root of the Young's modulus divided by the mass,  , and can be computed from the lowest eigenmode frequency of a clamped cantilever16 as
  (D and L are the cross-section size and the height of the microstructure, ρp is the polymer density). We find that fmech ≅ 4.5 kHz for E = 100 kPa and fmech ≅ 14.5 kHz for E = 1 MPa. For the softer microstructures, this corresponds to a radial frequency ω0 ≃ 28 kHz to be compared with the frictional damping frequency which is
 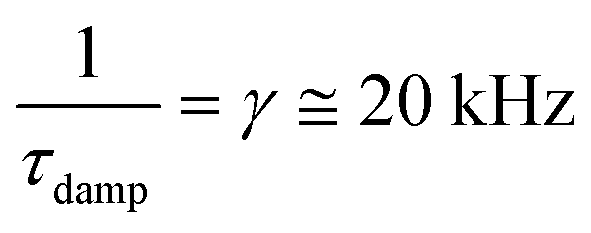 . If we compare our microstructures to a massive body moving in a viscous medium under the action of an elastic force,71 its dynamics should be in overdamped or underdamped regime according to whether
  or
or  , respectively. Therefore, the Young's modulus values of the microstructures fabricated here exactly fall on the edge of the damping regime, leaving the possibility for the bending dynamics to show oscillations. However, these oscillations should be exponentially damped as e−γt/2. The question arises on how the viscoelasticity of the network can account for the observed un-damped and apparently sustained oscillations (Fig. 4A and C). Furthermore, what is the origin of oscillations in the Hz range in a mechanical system for which the characteristic frequency lies in the kHz range?
We actively searched for possible artefacts giving rise to the observed oscillations. The oscillatory bending behaviour is observed over a wide range of flow speed values, preferentially in softer microstructures (Fig. 4). The characteristic frequencies fall in the range 0.3–1.6 Hz. For the hardest microstructures (keff > 8 nN μm−1) we could not put into evidence any oscillatory behaviour in the bending dynamics under the action of the capillary flow. We also checked the continuity of the flow actuated by the microfluidic pump by means of cross-correlation imaging on a suspension of 1 μm size beads (see the ESI,† “Test of the continuity of the flow induced by the microfluidic pump”). No oscillatory component in the flow was detected in the range of volumetric rates 0.1 ≤ Q ≤ 2.4 mL min−1 used here. The observed oscillations cannot be ascribed to spatial discretization in the tracking algorithm either, as can be observed in some of the monitored bending dynamics (Fig. 4B, for the highest flow rates). In fact, the spatial discretization is of the order of 200 nm, much lower than the typical oscillation amplitude, of about 1 μm. We reason therefore that the observed undamped oscillations can be the result of non-linearity entering the bending dynamics equation in combination with viscoelastic response or with stress-stiffening.72
5.3 Non-linear elastic response
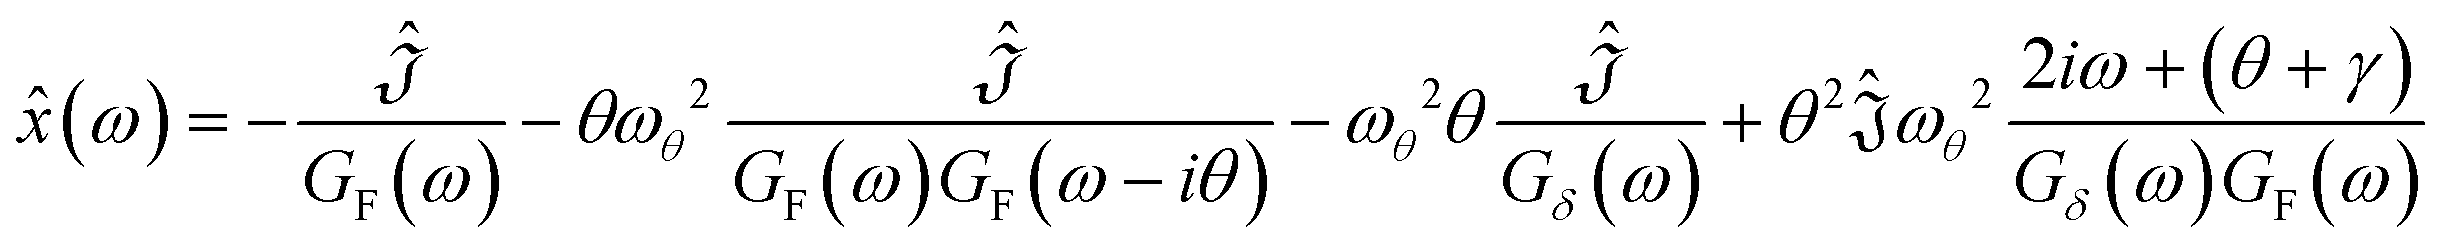
Cross-linked natural polymer networks exhibit stress-stiffening and viscoelasticity.72 In a viscoelastic system, the non-linearity comes in the dynamic equations through the time dependence of the complex modulus of rigidity. The elastic Young's modulus is related to the complex modulus of rigidity G(f) and to the Poisson ratio73μ by E = 2(1 + μ)G. For most polymers μ ≅ 0.3–0.5, and the approximation E ≅ 3G is often used. The simple Maxwell model of viscoelasticity gives the following frequency spectrum:74 | (7) |
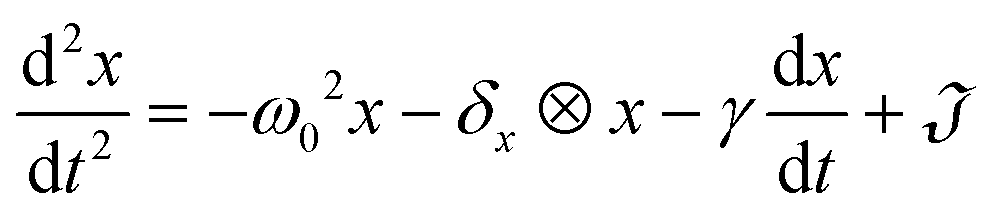
For the sake of simplicity we treat here only one non-linear component (the p pedix will be therefore omitted hereafter) and analyze the effect of the time dependence of the Young's modulus and the friction factor on the beam dynamics16 by mapping it to the case of a single mass constrained to a fixed point under the action of a constant drag force in a thermal bath (see the ESI,† “Langevin equation for a non-linear spring”). We assume that the time response of the Young's modulus is the same as the one of the shear modulus G (eqn (7)) and that, through eqn (4), this determines the functional form of the effective elastic constant. In this case, a simple dynamic equation can be written as
 | (8a) |
 | (8b) |
 and
and ![[Fraktur J]](https://www.rsc.org/images/entities/char_e187.gif) is the thermal (Gaussian) force defined by the first two momenta: 〈〉 = 0;
is the thermal (Gaussian) force defined by the first two momenta: 〈〉 = 0; 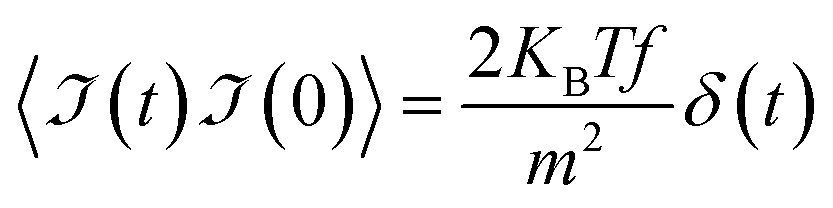 (ref. 65) and the symbol ⊗ indicates the convolution operator. In the case of a time-independent flow speed v, the position is measured in eqn (8a) and (8b) with respect to its equilibrium value xeq = γv/ω02. If, instead, the flow speed has time dependent components, v(t) = v0 + δv(t), an additional forcing term of the type γδv(t) appears in eqn (8a) and (8b). In any case, the second term on the right hand side of eqn (8a) and (8b) describes the time dependent part of the Young's modulus whose Fourier spectrum can be written as eqn (7). We will discuss in the following the effect of a single relaxation mode with rate θ and
  .
.
The solution of eqn (8a) and (8b) for the pure elastic spring (i.e. δx = 0) can be easily found by the time Fourier transform:
 | (9) |
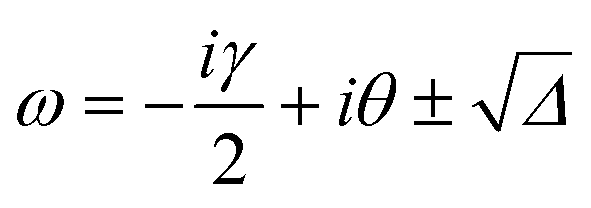
![[x with combining circumflex]](https://www.rsc.org/images/entities/i_char_0078_0302.gif) 0(ω) has two complex poles, ω±, and the correlation function of the bending displacement has components
0(ω) has two complex poles, ω±, and the correlation function of the bending displacement has components  , which represents a damped oscillatory behaviour with period
  . As we computed above, the microstructures fabricated here have
  , since the mechanical radial frequency ω0 = 2πfmech ≅ 28–90 kHz is larger than the damping rate γ ≅ 20 kHz. Therefore, we can have oscillations of the structure with a minimum frequency
 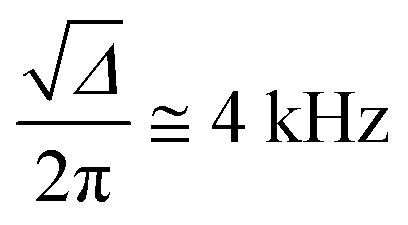 , much higher than the observed oscillations, and again damped in a few tens of milliseconds.
However, when we take into account the non-linear term ≈xδx in eqn (8a), the Fourier spectrum of the bending deflection becomes, to the first order, the following (see the ESI,† “Langevin equation for a non-linear spring”):
 | (10) |
 . Therefore, if for a specific viscoelastic relaxation component γ ≅ 2θ, the poles of Gδ(ω) become real,
  , and an un-damped oscillation component appears in the bending dynamics, as observed experimentally. On the other hand, if the microstructure displays a second viscoelastic relaxation component, θ′, such that
  , the corresponding correlation function decays slowly as ≅e−εt. Such a relaxation component can describe the slow bending dynamics with τslow ≅ 10–50 s.
As shown in the ESI† (“Langevin equation for a non-linear spring”), a similar conclusion cannot be reached with the pure viscoelastic dynamic equation, eqn (8b), at least for a stress-stiffening polymer. In this case, in fact the poles of the spectrum of the dynamics, (ω), become:
 | (11) |
 , is always positive.
We finally tackle the possible origin of oscillation frequencies in the Hz range for a mechanical micro-system with characteristic frequency lying in the kHz range. We argue in the following that this is due to other sources of non-linearity hidden in the dynamic equation (eqn (8a) and (8b)) leading to a beating phenomenon. Non-linearity may arise in eqn (8a) and (8b) also through a time dependence of the friction coefficient or through a forcing term arising from the onset of turbulence in the microfluidic flow.
5.4 Vortex shedding
The Reynolds number of water flowing in a capillary having size w ≅ 300 μm at the speed employed in the present work is 20 ≤ Rey ≤ 150. This value is at least one order of magnitude lower than the critical value for turbulence30 in macroscopic pipes, Rey ≅ 2300.28 This constraint is mitigated by the blockage effect of the microcapillary due to the comparable size of the microstructure (length ≅ 50 μm) and the capillary. As shown by Zhang et al.,30 the partial blockage of the capillary by the structure reduces significantly the value of the critical Rayleigh ratio down to Rey ≅ 100, which is of the same order of magnitude of the Reynolds number involved here. In particular, the increase of the axial ratio (the ratio of the structure diameter over the channel width) dramatically reduces the turbulence threshold value30 of the Reynolds number, defined as the value for which a component of the flow speed perpendicular to the flow stream appears (vy ≠ 0). Our microstructures extend for about 1/6 of the channel width, likely affecting the fluid velocity field in the proximity (downstream) of the structure. Shedding of vortices downstream of the structure were reported at higher values16,30 of Rey ≅ 300–400, giving rise to oscillatory components in the fluid speed at a frequency fS = Stfu. Various studies indicate a Strouhal number St ≅ 0.2–0.4 for vortices shedding from a cylinder in a flow.30,76 Under our experimental conditions the characteristic frequency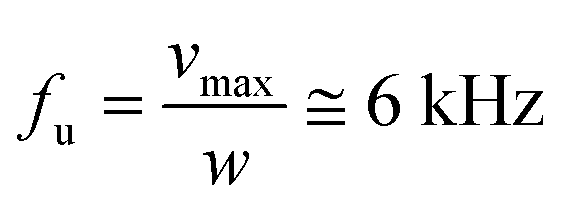 , which implies a vortex frequency fS ≅ 1.2–2.4 kHz, more than three orders of magnitude larger than those (≅1–3 Hz) of the oscillation frequencies of the microstructures observed here. Even by assuming some uncertainty in the parameters (for example the density of the polymerized material) and in the estimate of the vortex shedding frequency, it is unlikely that fS overlaps with the elastic frequency of the microstructures,16
 (for E = 100 kPa), to give rise to beating between the oscillation in the fluid speed and the mechanical oscillations of the microstructures.
5.5 Time dependence of the friction factor
We are left with the possibility that the non-linearity giving rise to low energy beatings comes from the position dependence of the micropillar friction factor. In fact, the cross-section area offered by the microstructure to the flow, LD, depends on bending and decreases approximately as L(1 − cos(θ))D, where θ(t) is the bending angle. This phenomenon is well known in sessile organisms, such as canes, leaves and trees77 or seaweeds,35,36 whose shape changes with the amplitude of the flow speed both in air (compressible, low density) and in water (uncompressible, high density). Excellent analyses of the effect of the flow-induced change of the shape of bendable objects have been reported,37,78 showing that the drag force acting on these bodies increases with the fluid speed with a slope instead of the normal s ≅ 2 dependence for a rigid object. This occurs at high Reynolds numbers, 2000 ≤ Rey ≤ 40000. However, even at lower Re the change of the cross-section offered to the flow could affect the dynamics through the time dependence of the friction factor; from the analytical point of view, the fluido-dynamic equations of the flexible micropillars become non-linear because the friction factor depends on the angle of bending (or the deformation in general) and therefore on time. Here two possibilities arise. In one case, the frequency spectrum of the friction factor contains frequency components overlapping with those of the time dependent part of the flow speed, δv(t), of the order of the vortex frequency fS. A direct “heterodyne” beating between the rising turbulence in the fluid flow and the friction factor dynamics would then take place through a term ≈f(t)δv(t). This could occur due to additional lower frequency components in the spectrum of the friction factor arising from the non-linear relationship between the friction factor and the bending of the microstructure, f(x(t)) ≈ L(1 − cos(θ(t))). A second possibility is a “homodyne” beating of the friction factor dynamics with the mechanical oscillations of the structure, through a term f(x(t)) ẋ(t), giving rise to beatings at a low frequency.
Conclusions
Protein-based photoresists can be used to fabricate elongated and flexible microstructures by two-photon polymerization. By means of a top-down fabrication protocol, we succeeded here in fabricating highly elongated microstructures directly within micro-capillaries for microfluidic experiments. By studying and comparing the bending dynamics of a series of prismatic hollow beams, we show that the Young's modulus of the fabricated polymer network follows a simple universal law (Fig. 5) determined by the laser fabrication intensity. This applies irrespective of the micro-structure shape and the writing algorithm, provided that the same deposited dose is exploited in the different scanning paths. The recovered intensity dependence is in agreement with previous detailed studies of the degree of conversion of acrylic resins on the fabrication laser intensity79 and confirms the homogeneity of the microfabrication method in proteinaceous photoresists. However, it is clear that the mechanical properties of the polymerized network depend on a few parameters other than the laser intensity, for example the laser scanning speed, the scan pixelation/voxelation and the laser polarization,46 which we have not explored here. The Young's modulus spans a wide range of values, 100 kPa ≤ E ≤ 4 MPa. The threshold intensity level is Ith ≅ (0.73 ± 0.02) TW cm−2 and the maximum value of the Young's modulus is obtained for I ≅ 2 TW cm−2. For I ≥ 2.5 TW cm−2 micro-bubbles form in the resists, preventing fabrication. By changing the cross-section of the hollow microstructures, we are able to fabricate objects with effective elastic constants spanning the wide range 0.8 nN μm−1 ≤ keff ≤ 50 nN μm−1. Three orders of magnitude lower elastic constants can be reached on spiral micro-structures.Interestingly, our initial hypothesis of a possible coupling between various sources of non-linearity in the bending dynamics of the microstructures is indeed confirmed by the observation of sustained bending oscillations under continuous microfluidic flow (Fig. 4). We are able to fully characterize them by Fourier analysis, showing that the spectrum is dominated by one component with a frequency 〈f〉Th that scales as vresc = vkαeff. Our best estimate of α ≅ 0.35 (Fig. 7) indicates a downscaling of the mechanical relation fmax ≈ k0.5eff. The reduction of the exponent from α = 0.5 to α = 0.35 suggests the downscaling observed for the drag force acting on deformable objects.34,37,78
It is clear that a full comprehension of the observations should exploit a more accurate modeling of the motion of flexible filaments, either with analytical models or by means of numerical simulations. Elegant examples of both approaches can be found for example in the work by D. Saintillan and co-workers for flexible filaments under the gravity field (sedimentation),80 under cellular flow,81 or in compressional flow,82 or in the work by Favier et al.83 for the case of a single filament with fixed upstream end flapping in a uniform flow field. None of these, however, treat the case investigated here. We therefore exploited a simple model for viscoelasticity and stress-stiffening of a deformable polymeric mesh, and based on it we point out that non-linear elasticity can give rise, to a first order approximation, to the presence of underdamped oscillations under continuous flow. However, these oscillations would fall at frequencies that are 2–3 orders of magnitude higher than those observed. From our simplified analysis of the possible non-linear terms in the dynamic equation, we suggest that a combination of the non-linear dependence of the friction factor on the bending angle with the non-linearity induced by the viscoelastic nature of the photo-polymerized material can rationalize the observed sustained oscillations at low frequency ≅1–3 Hz. The sustained oscillations observed in the microstructures under continuous flow could have a wide range of applications, ranging from the fabrication of nano-harvesting systems21,84 to enhanced micromixing in microfluidic channels for pharmaceutical and biomedical research.
Conflicts of interest
The authors declare no conflict of interest.Acknowledgements
We acknowledge the support of the University of Milano-Bicocca (ATE-2018 and ATE-2019). G. C. acknowledges the Horizon2020 FET project with G. A. n. 964481. G. C. and M. C. also acknowledge the support of the ISASI Department of CNR and of INFN.References
- T. Tičkūnas, M. Perrenoud, S. Butkus, R. Gadonas, S. Rekštytė, M. Malinauskas, D. Paipulas, Y. Bellouard and V. Sirutkaitis, Opt. Express, 2017, 25, 26280 CrossRef PubMed.
- S. Rekštytė, D. Paipulas, M. Malinauskas and V. Mizeikis, Nanotechnology, 2017, 28, 124001 CrossRef PubMed.
- S. Turunen, A. M. Haaparanta, R. Äänismaa and M. Kellomäki, J. Tissue Eng. Regener. Med., 2013, 7, 253–270 CrossRef CAS PubMed.
- H. Yamamoto, K. Okano, T. Demura, Y. Hosokawa, H. Masuhara, T. Tanii and S. Nakamura, Appl. Phys. Lett., 2011, 99, 1–3 Search PubMed.
- B. G. Munoz-Robles, I. Kopyeva and C. A. DeForest, Adv. Mater. Interfaces, 2020, 7, 1–25 Search PubMed.
- A. Urciuolo, I. Poli, L. Brandolino, P. Raffa, V. Scattolini, C. Laterza, G. G. Giobbe, E. Zambaiti, G. Selmin, M. Magnussen, L. Brigo, P. De Coppi, S. Salmaso, M. Giomo and N. Elvassore, Nat. Biomed. Eng., 2020, 4, 901–915 CrossRef CAS PubMed.
- M. Tromayer, A. Dobos, P. Gruber, A. Ajami, R. Dedic, A. Ovsianikov and R. Liska, Polym. Chem., 2018, 9, 3108–3117 RSC.
- I. Batalov, K. R. Stevens, C. A. Deforest and H. M. Blau, Proc. Natl. Acad. Sci. U. S. A., 2021, 118, 1–7 CrossRef PubMed.
- M. Bouzin, A. Zeynali, M. Marini, L. Sironi, R. Scodellaro, L. D'alfonso, M. Collini and G. Chirico, Sensors, 2021, 21(5891), 1–36 Search PubMed.
- C. A. DeForest and K. S. Anseth, Nat. Chem., 2011, 3, 925–931 CrossRef CAS PubMed.
- J. A. Shadish, G. M. Benuska and C. A. DeForest, Nat. Mater., 2019, 18, 1005–1014 CrossRef CAS PubMed.
- R. J. Narayan, A. Doraiswamy, D. B. Chrisey and B. N. Chichkov, Mater. Today, 2010, 13, 42–48 CrossRef CAS.
- Y. Zheng, J. Chen, M. Craven, N. W. Choi, S. Totorica, A. Diaz-Santana, P. Kermani, B. Hempstead, C. Fischbach-Teschl, J. A. López, A. D. Stroock and D. A. Weitz, Proc. Natl. Acad. Sci. U. S. A., 2012, 109, 9342–9347 CrossRef CAS PubMed.
- Y. Zheng, Z. Chen, Q. Jiang, J. Feng, S. Wu and A. Del Campo, Nanoscale, 2020, 12, 13654–13661 RSC.
- S. G. Rayner, C. C. Howard, C. J. Mandrycky, S. Stamenkovic, J. Himmelfarb, A. Y. Shih and Y. Zheng, Adv. Healthcare Mater., 2021, 2100031 CrossRef CAS PubMed.
- S. Große, T. Soodt and W. Schröder, Meas. Sci. Technol., 2008, 19(105201), 1–12 Search PubMed.
- S. Große and W. Schröder, Meas. Sci. Technol., 2008, 19(015403), 1–12 Search PubMed.
- J. J. Allen and A. J. Smits, J. Fluids Struct., 2001, 15, 629–640 CrossRef.
- X. Zhou, C. Chen, P. Zhu, S. Zhao, J. Shi, F. Yan, R. Shen and H. Xia, Energetic Materials Frontiers, 2020, 1, 186–194 CrossRef.
- C. Duprat, H. Berthet, J. S. Wexler, O. Du Roure and A. Lindner, Lab Chip, 2015, 15, 244–252 RSC.
- V. Sencadas, ACS Appl. Polym. Mater., 2020, 2, 2105–2110 CrossRef CAS.
- N. Sriplai, R. Mangayil, A. Pammo, V. Santala, S. Tuukkanen and S. Pinitsoontorn, Carbohydr. Polym., 2020, 231, 115730 CrossRef CAS PubMed.
- W. Guo, L. Tang, B. Zhou and Y. Fung, Micromachines, 2021, 12, 1–16 Search PubMed.
- D. Podbevšek, M. Petkovšek, C. D. Ohl and M. Dular, Int. J. Multiphase Flow, 2021, 142, 1–7 CrossRef.
- E. S. Shanko, Y. van de Burgt, P. D. Anderson and J. M. J. den Toonder, Micromachines, 2019, 10(731), 1–23 Search PubMed.
- A. M. Boymelgreen, G. Kunti, P. Garcia-Sanchez, A. Ramos, G. Yossifon and T. Miloh, J. Colloid Interface Sci., 2022, 616, 465–475 CrossRef PubMed.
- A. Salari, M. Navi, T. Lijnse and C. Dalton, Micromachines, 2019, 10, 1–27 Search PubMed.
- A. A. Draad, G. D. C. Kuiken and F. T. M. Nieuwstadt, J. Fluid Mech., 1998, 377, 267–312 CrossRef CAS.
- J. A. G. Rhodin, J. Ultrastruct. Res., 1968, 25, 452–500 CrossRef CAS PubMed.
- S. Zhang, N. Cagney, S. Balabani, C. P. Naveira-Cotta and M. K. Tiwari, Phys. Fluids, 2019, 31, 1–12 Search PubMed.
- S. T. Chan, J. T. Ault, S. J. Haward, E. Meiburg and A. Q. Shen, Phys. Rev. Fluids, 2019, 4(8), 1–19 Search PubMed.
- A. Renfer, M. K. Tiwari, F. Meyer, T. Brunschwiler, B. Michel and D. Poulikakos, Microfluid. Nanofluid., 2013, 15, 231–242 CrossRef CAS.
- J. Hapffner and Y. Naka, Phys. Rev. Lett., 2011, 107(194502), 1–4 Search PubMed.
- S. Alben, M. Shelley and J. Zhang, Nature, 2002, 420, 479–481 CrossRef CAS PubMed.
- H. L. Stewart, J. Exp. Biol., 2006, 209, 2170–2181 CrossRef PubMed.
- M. A. R. Koehl, Annu. Rev. Ecol. Syst., 1996, 27, 501–542 CrossRef.
- M. J. Shelley and J. Zhang, Annu. Rev. Fluid Mech., 2011, 43, 449–465 CrossRef.
- I. Sakellari, A. Gaidukeviciute, A. Giakoumaki, D. Gray, C. Fotakis, M. Farsari, M. Vamvakaki, C. Reinhardt, A. Ovsianikov and B. N. Chichkov, Appl. Phys. A: Mater. Sci. Process., 2010, 100, 359–364 CrossRef CAS.
- T. Zandrini, O. Shan, V. Parodi, G. Cerullo, M. T. Raimondi and R. Osellame, Sci. Rep., 2019, 9(11761), 1–9 CAS.
- E. Skliutas, M. Lebedevaite, E. Kabouraki, T. Baldacchini, J. Ostrauskaite, M. Vamvakaki, M. Farsari, S. Juodkazis and M. Malinauskas, NANO, 2021, 10, 1211–1242 CAS.
- A. Zeynali, M. Marini, G. Chirico, M. Bouzin, M. Borzenkov, L. Sironi, L. D'Alfonso, P. Pallavicini, V. Cassina, F. Mantegazza, F. Granucci, L. Marongiu, D. Polli, A. De la Cadena and M. Collini, Adv. Opt. Mater., 2020, 8(2000584), 1–11 Search PubMed.
- C. Conci, E. Jacchetti, L. Sironi, L. Gentili, G. Cerullo, R. Osellame, G. Chirico and M. T. Raimondi, Adv. Opt. Mater., 2022, 2101103, 1–12 Search PubMed.
- D. Serien and K. Sugioka, Opto-Electron. Adv., 2018, 1, 1–18 Search PubMed.
- J. D. Pitts, P. J. Campagnola, G. A. Epling and S. L. Goodman, Macromolecules, 2000, 33, 1514–1523 CrossRef CAS.
- S. Wei, J. Liu, Y. Zhao, T. Zhang, M. Zheng, F. Jin, X. Dong, J. Xing and X. Duan, ACS Appl. Mater. Interfaces, 2017, 9, 42247–42257 CrossRef CAS PubMed.
- S. Rekštytė, T. Jonavičius, D. Gailevičius, M. Malinauskas, V. Mizeikis, E. G. Gamaly and S. Juodkazis, Adv. Opt. Mater., 2016, 4, 1209–1214 CrossRef.
- H. T. M. Phan, S. Bartelt-Hunt, K. B. Rodenhausen, M. Schubert and J. C. Bartz, PLoS One, 2015, 10, e0141282 CrossRef PubMed.
- H. Bruus, Theoretical Microfluidics, Oxford University Press, New York, 2008 Search PubMed.
- J. L. Hutter and J. Bechhoefer, Rev. Sci. Instrum., 1993, 64, 1868–1873 CrossRef CAS.
- R. Lévy and M. Maaloum, Nanotechnology, 2002, 13, 33–37 CrossRef.
- D. C. Lin, E. K. Dimitriadis and F. Horkay, J. Biomech. Eng., 2007, 129, 430–440 CrossRef PubMed.
- A. Khan, J. Philip and P. Hess, J. Appl. Phys., 2004, 95, 1667–1672 CrossRef CAS.
- F. P. Beer, E. R. Johnston, J. T. DeWolf and D. F. Mazurek, Mechanics of Materials, McGraw Hill, 8th edn, 2020 Search PubMed.
- M. Mercedes Tirado, C. López Martínez and J. Garcia de la Torre, J. Chem. Phys., 1984, 81, 2047–2052 CrossRef CAS.
- J. T. Padding and W. J. Briels, J. Chem. Phys., 2010, 132, 054511 CrossRef CAS PubMed.
- M. M. Rahman, M. M. Karim and M. A. Alim, J. Nav. Archit. Mar. Eng., 2007, 4, 1813–8535 Search PubMed.
- F. Yan, H. Yang and L. Wang, Water, 2021, 13, 1–22 Search PubMed.
- I. Proudman and J. R. A. Pearson, J. Fluid Mech., 1957, 2, 237–262 CrossRef.
- R. B. Bird, E. N. Lightfoot and W. E. Stewart, Transport Phenomena, John Wiley & sons, New York, 2002 Search PubMed.
- K. Berland and G. Shen, Appl. Opt., 2003, 42, 5566–5576 CrossRef PubMed.
- A. Abbotto, G. Baldini, L. Beverina, G. Chirico, M. Collini, L. D'Alfonso, A. Diaspro, R. Magrassi, L. Nardo and G. A. Pagani, Biophys. Chem., 2005, 114, 35–41 CrossRef CAS PubMed.
- Z. Petrášek and P. Schwille, ChemPhysChem, 2008, 9, 147–158 CrossRef PubMed.
- M. Bouzin, A. Zeynali, M. Marini, L. Sironi, R. Scodellaro, L. D'alfonso, M. Collini and G. Chirico, Sensors, 2021, 21, 1–36 CrossRef PubMed.
- M. A. Despósito and A. D. Viñales, Phys. Rev. E: Stat., Nonlinear, Soft Matter Phys., 2009, 80(021111), 1–7 Search PubMed.
- M. Doi and S. F. Edwards, The theory of polymer dynamics, Clarendon Press, Oxford, 1986 Search PubMed.
- C. W. Macosko, Rheology: Principles, Measurements, and Applications, Wiley-VCH, 2nd edn, 1994 Search PubMed.
- T. E. Brown and K. S. Anseth, Chem. Soc. Rev., 2017, 46, 6532–6552 RSC.
- N. Huebsch, Acta Biomater., 2019, 94, 97–111 CrossRef CAS PubMed.
- C. Walker, E. Mojares and A. del Río Hernández, Int. J. Mol. Sci., 2018, 19, 3028 CrossRef PubMed.
- J. Kubacková, G. T. Iványi, V. Kaziková, A. Strejčková, A. Hovan, G. Zoldák, G. Vizsnyiczai, L. Kelemen, Z. Tomori and G. Bánó, Appl. Phys. Lett., 2020, 117, 1–5 CrossRef.
- W. Coffey and Y. P. Kalmykov, The Langevin equation : with applications to stochastic problems in physics, chemistry and electrical engineering, World Scientific Publishing Co. Pte. Ltd., Singapore, Hackensack, N.J., 2017, vol. 28 Search PubMed.
- F. Burla, Y. Mulla, B. E. Vos, A. Aufderhorst-Roberts and G. H. Koenderink, Nat. Rev. Phys., 2019, 1, 249–263 CrossRef.
- H. F. Brinson and L. C. Brinson, Polymer Engineering Science and Viscolelasticity, Springer, New york, 2015 Search PubMed.
- T. Hána, T. Janda, J. Schmidt, A. Zemanová, M. Šejnoha, M. Eliášová and M. Vokáč, Materials, 2019, 12(2241), 1–20 Search PubMed.
- M. L. Gardel, J. H. Shin, F. C. MacKintosh, L. Mahadevan, P. Matsudaira and D. A. Weitz, Science, 2004, 304, 1301–1305 CrossRef CAS PubMed.
- U. Fey, M. König and H. Eckelmann, Phys. Fluids, 1998, 10, 1547–1549 CrossRef CAS.
- K. J. Niklas, Rev. Palaeobot. Palynol., 1998, 102, 1–14 CrossRef CAS PubMed.
- S. Alben, M. Shelley and J. Zhang, Phys. Fluids, 2004, 16, 1694–1713 CrossRef CAS.
- L. J. Jiang, Y. S. Zhou, W. Xiong, Y. Gao, X. Huang, L. Jiang, T. Baldacchini, J.-F. Silvain and Y. F. Lu, Opt. Lett., 2014, 39, 3034 CrossRef PubMed.
- L. Li, H. Manikantan, D. Saintillan and S. E. Spagnolie, J. Fluid Mech., 2013, 735, 705–736 CrossRef.
- H. Manikantan and D. Saintillan, Phys. Fluids, 2013, 25, 073603 CrossRef.
- H. Manikantan and D. Saintillan, Phys. Rev. E: Stat., Nonlinear, Soft Matter Phys., 2015, E92, 041002(R) CrossRef PubMed.
- J. Favier, A. Revell and A. Pinelli, J. Fluids Struct., 2015, 53, 26–35 CrossRef.
- J. D. Phillips, Front. Nanotechnol., 2021, 3(633931), 1–6 Search PubMed.
Footnotes |
| † Electronic supplementary information (ESI) available. See DOI: https://doi.org/10.1039/d2lc00697a |
| ‡ These authors contributed equally to this work. |
| This journal is © The Royal Society of Chemistry 2022 |