
 Open Access Article
 This Open Access Article is licensed under a Creative Commons Attribution-Non Commercial 3.0 Unported Licence
Multiplexed microfluidic platform for stem-cell derived pancreatic islet β cells†
Ishan
Goswami
 ab,
Eleonora
de Klerk
c,
Phichitpol
Carnese
c,
Matthias
Hebrok‡
c and
Kevin E.
Healy
*ab
ab,
Eleonora
de Klerk
c,
Phichitpol
Carnese
c,
Matthias
Hebrok‡
c and
Kevin E.
Healy
*ab
aDepartment of Bioengineering and California Institute for Quantitative Biosciences (QB3), University of California Berkeley, Berkeley, CA 94720, USA. E-mail: kehealy@berkeley.edu
bDepartment of Materials Science and Engineering, University of California Berkeley, Berkeley, CA 94720, USA
cDiabetes Center, University of California San Francisco, San Francisco, CA 94143, USA
First published on 28th October 2022
Abstract
Stem cell-derived β cells offer an alternative to primary islets for biomedical discoveries as well as a potential surrogate for islet transplantation. The expense and challenge of obtaining and maintaining functional stem cell-derived β cells calls for a need to develop better high-content and high-throughput culture systems. Microphysiological systems (MPS) are promising high-content in vitro platforms, but scaling for high-throughput screening and discoveries remain a challenge. Traditionally, simultaneous multiplexing of liquid handling and cell loading poses a challenge in the design of high-throughput MPS. Furthermore, although MPS for islet β culture/testing have been developed, studies on multi-day culture of stem-cell derived β cells in MPS have been limited. We present a scalable, multiplexed islet β MPS device that incorporates microfluidic gradient generators to parallelize fluid handling for culture and test conditions. We demonstrated the viability and functionality of the stem cell-derived enriched β clusters (eBCs) for a week, as assessed by the ∼2 fold insulin release by the clusters to glucose challenge. To show the scalable multiplexing for drug testing, we demonstrated the loss of stimulation index after long-term exposure to logarithmic concentration range of glybenclamide. The MPS cultured eBCs also confirmed a glycolytic bottleneck as inferred by insulin secretion responses to metabolites methyl succinate and glyceric acid. Thus, we present an innovative culture platform for eBCs with a balance of high-content and high-throughput characteristics.
Introduction
The destruction or dysfunction of the insulin secreting pancreatic islet β cells lead to type 1 or type 2 diabetes, respectively. Exogenous insulin injection remains the gold-standard approach to alleviate patients with diabetes, while an alternative treatment for a select number of patients with type 1 diabetes is islet transplant.1 With the limited supply of cadaveric human islets versus the demand, stem cell-derived β cells offer an alternative as potential surrogates for islet transplantation. However, obtaining reliable functioning islets from pluripotent stem cells is challenging,1 albeit with some promising recent developments.2–4In vitro culture of stem cell-derived islets is necessary for developing a robust source of cells; however, their in vitro culture is extremely difficult beyond a week due to loss of viability, trans-differentiation, and loss of functionality.2,3,5,6 Furthermore, the process of obtaining and maintaining stem cell-derived β cells is expensive due to the costs of cell culture reagents. Coupled with the scarcity of primary islets, there is a need to develop better in vitro culture systems for high-throughput discoveries of biomaterials, drugs, and cryopreservative agents to optimize differentiation conditions and thus accelerate translating stem cell-derived islet transplantation.Microphysiological systems (MPS) have emerged as powerful in vitro platforms to study disease mechanisms and enable translational biomedical research. Advances in culture conditions now support viability and functionality of stem cell-derived or primary tissues representative of different organs for over a week in culture within the MPS.7–9 The MPS platform incorporates microfluidic flows to provide tissues with culture medium circulation at volumes that are computationally predictable and more physiological relevant than static well plate culture. The lower volume of culture media is more amenable for concentrating biomolecules that could be of interest for drug discovery, and large-scale testing of more expensive reagents and molecules within small volumes. Furthermore, intricate design of microfluidic channels upstream of the tissue culture allow for a gradient of biomolecules/drugs to be fed into tissues for high throughput screening. Thus, MPS provide a compelling reason for long-term culture and testing of stem cell-derived islet β cells.
There is a plethora of literature on using microfluidic devices for performing functionality tests on cadaveric islets, albeit largely with pseudo-, primary, or rodent islets.10–14 However, these studies are conducted either immediately or within a day of loading the islets into the device. A recent study demonstrates the utility of MPS for long-term (>1 week) culturing of primary islets. A continuous trickling fluid flow across the islet culture (∼8–25 μL h−1) prevents the loss of tight junctions in the islet clusters and improves the glucose stimulated insulin release when compared to static cultures.15 Fluid flow (∼30 μL min−1) across primary human islets organoids in a hybrid alginate-hydrogel-acrylic microfluidic device has been reported to be beneficial to relief hypoxic effects observed in static cultures within the same device, and allow culture of organoids between 5 to 10 days.16 Differentiation of induced pluripotent stem cells into islet β organoids has also been demonstrated in MPS.17 However, there is a gap in the literature demonstrating long-term culture of stem cell-derived islets within MPS platforms.
Here we present a multiplexed islet MPS device that incorporates microfluidic gradient generators for parallelizing the culture conditions for compound testing with minimal number of β clusters per condition (5 versus gold standard perifusion systems that use 50–100 islet clusters). The device consists of media channels and micro-well cell chambers for the β clusters separated via an isoporous membrane. The islet MPS chamber hence recapitulates the native physiological niche in which islet clusters can be protected from shear forces by an endothelial-like barrier, while still providing a trickling flow to support long-term culture. We interrogated the duration for which stem cell-derived islets may be cultured within the MPS without losing viability and the possibility of testing logarithmic ranges of drugs via multiplexing. Our data indicate that the novel MPS permits testing of metabolic agents with an order or two lower number of cells and volume of reagents (μL vs. mL in standard tissue culture plates/perifusion systems). The platform for eBCs provides a balance of high-content and high-throughput characteristics that will be valuable for developing protocols for optimized eBC function, leading to improved islets for transplantation.
Materials and methods
Fabrication of islet MPS chip
The Fig. 1 provides a schematic of the fabrication of the islet MPS chip. The multilayer Islet-chip consists of two patterned polydimethylsiloxane (PDMS, Sylgard 184) slabs sandwiching a polyethylene terephthalate (PET) membrane (average pore side rp = 3 μm; pore density ρp = 8 × 105 cm−2; measured permeability: 10−12 m2).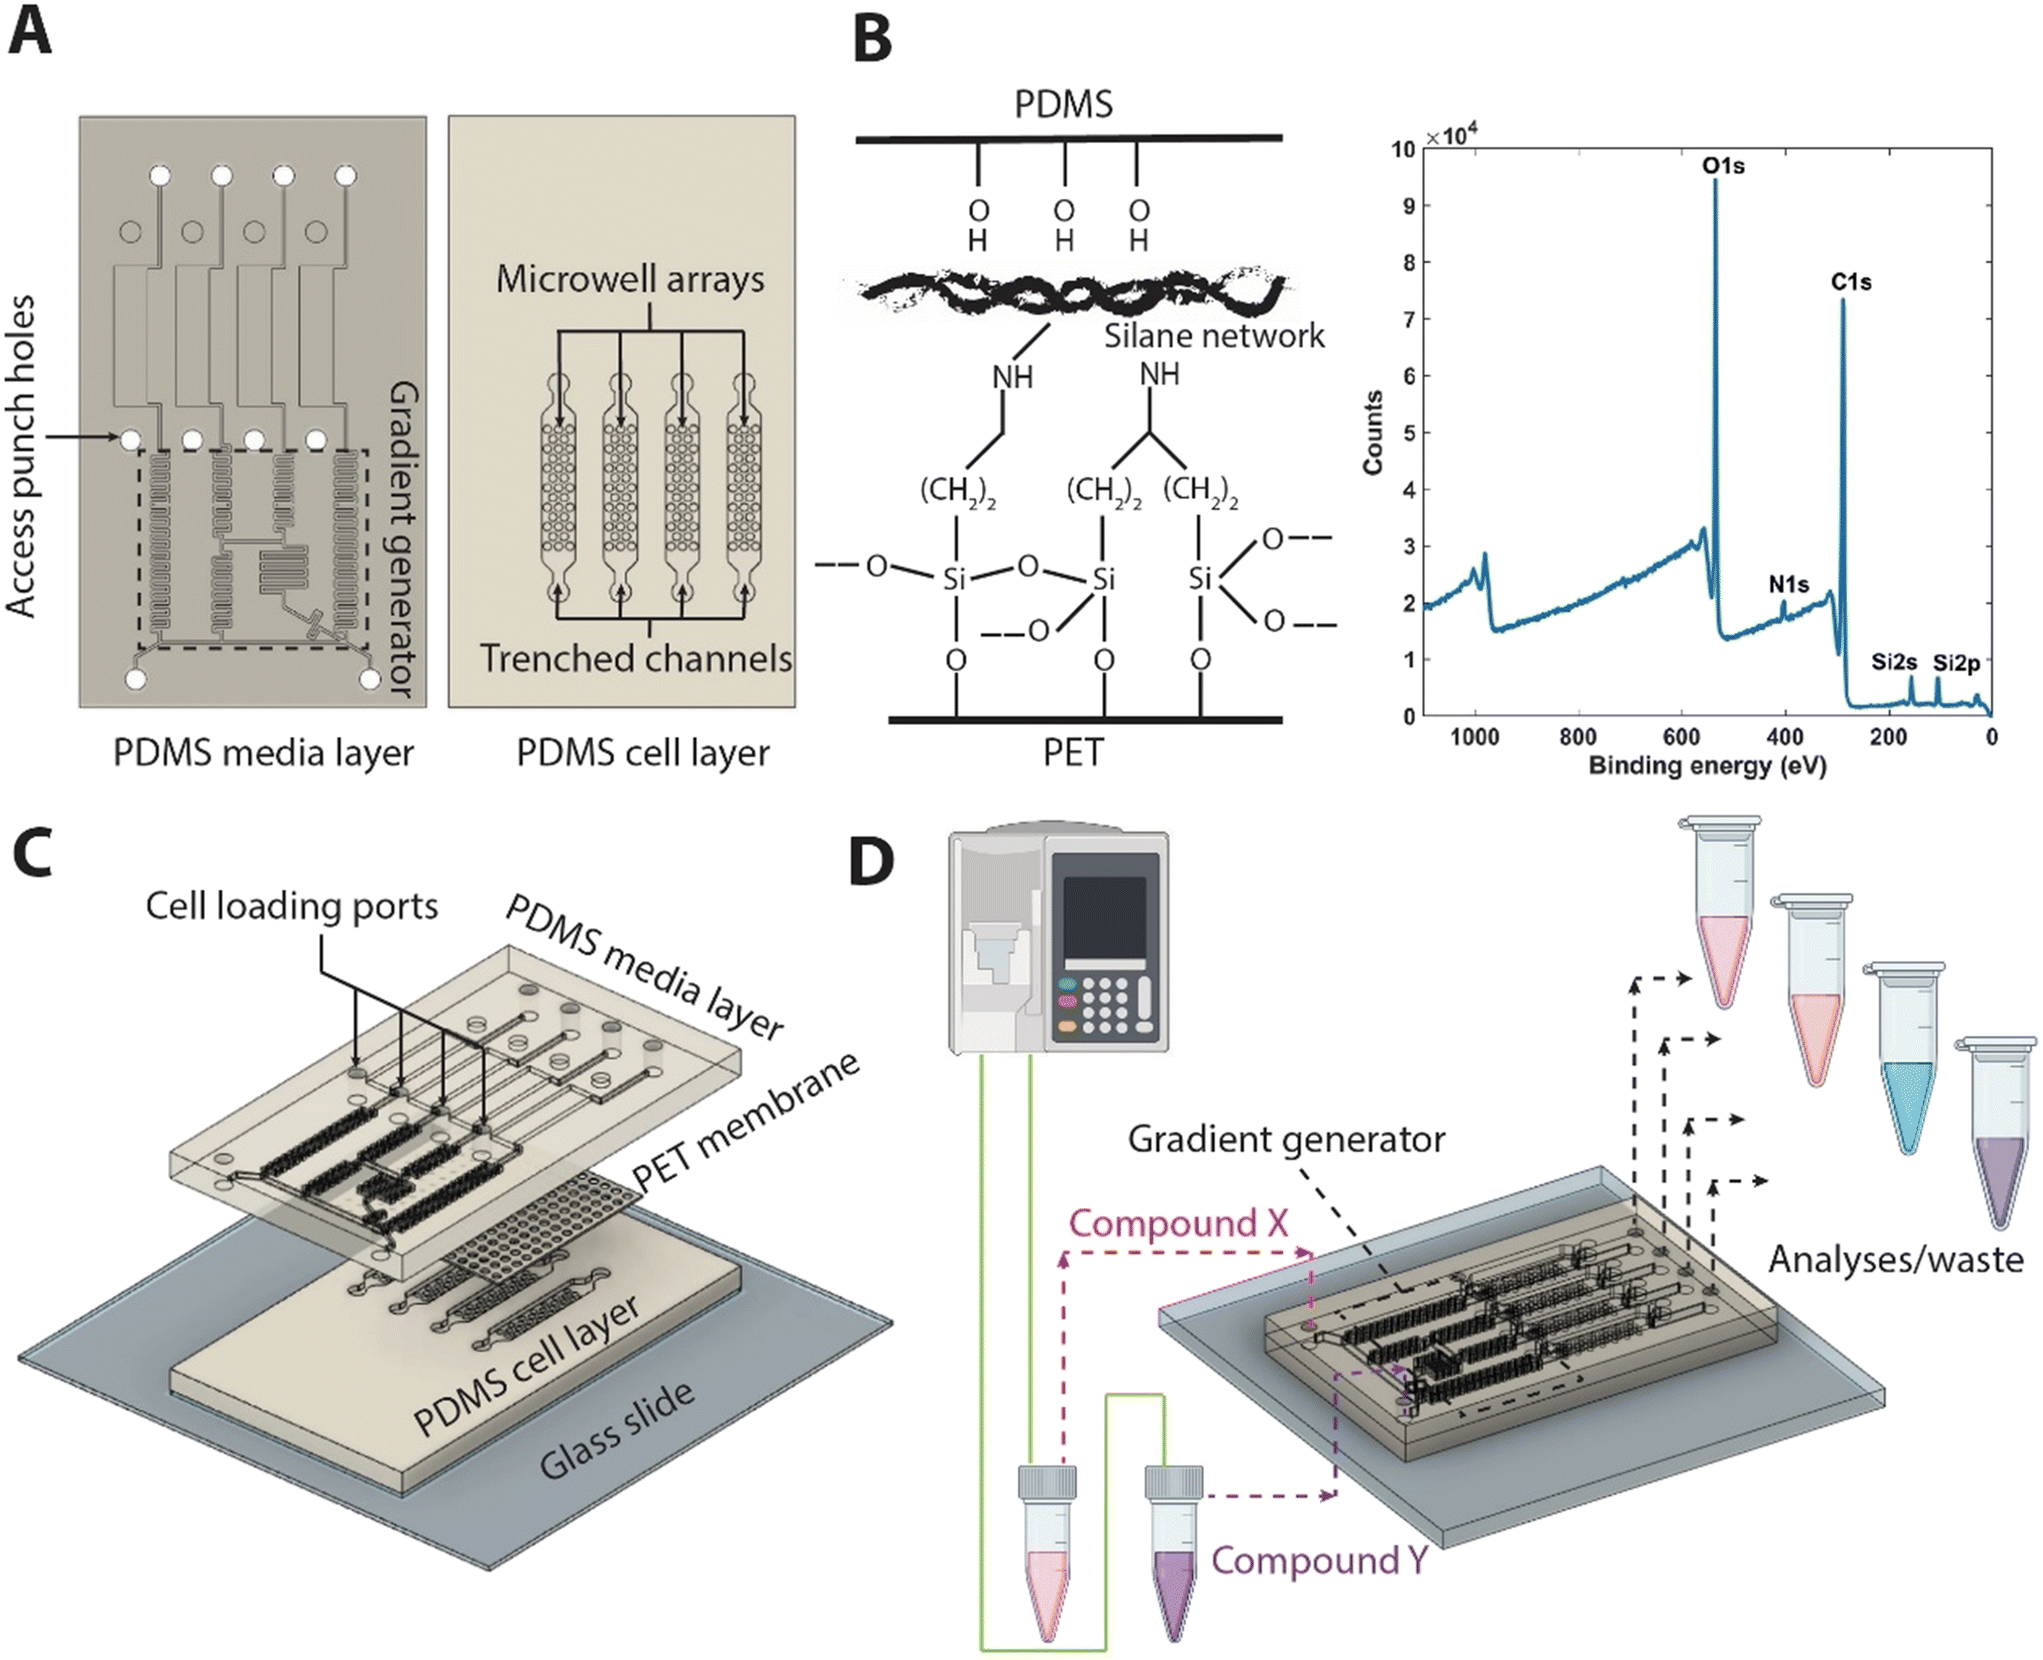 | ||
| Fig. 1 Concept and fabrication of the islet microphysiological system device. (A) Three main elements of the device: PDMS stamps obtained from soft-lithography sandwich. (B) Bis[3-(trimethoxysilyl)propyl]amine functionalized PET membrane. Representative XPS spectrum of the functionalized PET membrane. (C) An exploded assembly is shown. The PDMS media layer is separated from the cell layer by a porous PET membrane. (D) Islet β clusters cultured in parallel multiplexed trenched channels can be exposed to different concentrations of compounds, obtained via a gradient generator upstream. Shown is a gradient generated with compound X & Y. Supernatant flowing out of each multiplexed channel can be collected for analyses, such as measurement of C-peptide. | ||
To generate the PDMS slabs, patterned master-wafers are fabricated via standard photolithography onto a 100 mm diameter silicon wafers (University Wafer, Boston, MA). The masks for both wafers were designed in Autodesk® AutoCAD (Autodesk Inc., San Rafael, CA). For the cell layer master-wafer, SU-8 2100 (Kayakum) photoresist was used to generate microstructures of two levels via the use of alignment markers. This process involved spin coating, soft bake, exposure, and post-exposure bake of the two layers of SU8, followed by a development step at the end of the second post-exposure bake, as reported in the literature for multi-layered SU-8 microstructures.18 For the media layer master-wafer, SU-8 3050 (Kayakum) was used to create a single layered microstructure, following a standard process of spin coating, soft bake, exposure, and post-exposure bake. Both wafers were developed in SU-8 developer (Microchem Corp, Newton, MA), rinsed in 100% isopropanol, and blow dried with nitrogen. Following this, wafers were hard baked on a hot plate at 180 °C, and coated with trichloro[1H,1H,2H,2H-perfluorooctyl]silane (Sigma-Aldrich, catalog 448931).
PDMS slabs were then replica molded using uncured PDMS in a 10![[thin space (1/6-em)]](https://www.rsc.org/images/entities/char_2009.gif) :1 w/w ratio of prepolymer to curing agent. To mold the PDMS slabs, a total of 10 g and 20 g of PDMS was poured onto the cell-chamber wafer and media chamber wafer, respectively, and cured overnight at 70 °C. After peeling the molds from the wafers, inlet/outlet holes were punched in the cell chamber PDMS slab using a 0.75 mm biopsy punch (Ted Pella).
:1 w/w ratio of prepolymer to curing agent. To mold the PDMS slabs, a total of 10 g and 20 g of PDMS was poured onto the cell-chamber wafer and media chamber wafer, respectively, and cured overnight at 70 °C. After peeling the molds from the wafers, inlet/outlet holes were punched in the cell chamber PDMS slab using a 0.75 mm biopsy punch (Ted Pella).
PET membranes were cut to appropriate dimensions and functionalized with bis[3-(trimethoxysilyl)propyl]amine with a similar protocol as has been reported in the literature.19 Briefly, membranes were cleaned and soaked in isopropyl alcohol for 15 minutes. The membranes are secured by their edge using glass slides and treated with oxygen plasma (Plasma Equipment Technical Services, Livermore, CA) for 60 s (power: 20 W; flow: 98.8 sccm; pressure: 20 mTorr). The activated membranes were immediately submerged in a solution of 2% bis[3-(trimethoxysilyl)propyl]amine (Sigma-Aldrich) in 1% water and isopropyl alcohol. After treatment and curing (80 °C for 20 minutes), rinsing with isopropyl alcohol was performed. Functionalized membranes were dried at 80 °C for 30 minutes and stored in 70% ethanol for further use. Chemical composition of the functionalized membranes were validated using X-ray photoelectron spectroscopy (XPS) via the detection of N 1s and Si 2p peaks.
To assemble the multi-layer PET/PDMS hybrid device, the side of the PDMS slab featuring cell chamber without the patterns was bonded to a microscope glass slide after exposure to oxygen plasma at 20 W for 24 s (98.8 sccm; 15 mTorr). The patterned faces of both PDMS slabs were then exposed to oxygen plasma and sandwiched around the functionalized PET membrane, which was carefully blow-dried with N2. To ensure a proper alignment of media channel with cell chambers, the assembly was performed under a stereomicroscope. To stabilize bonding, the devices were subsequently baked for an hour at 70 °C, before sterilizing in an autoclave for further use.
Numerical modeling of transport in the MPS
The numerical analyses of the transport in the MPS are divided into two parts: validation of the upstream gradient generator and the transport in the micro-wells and cell chamber.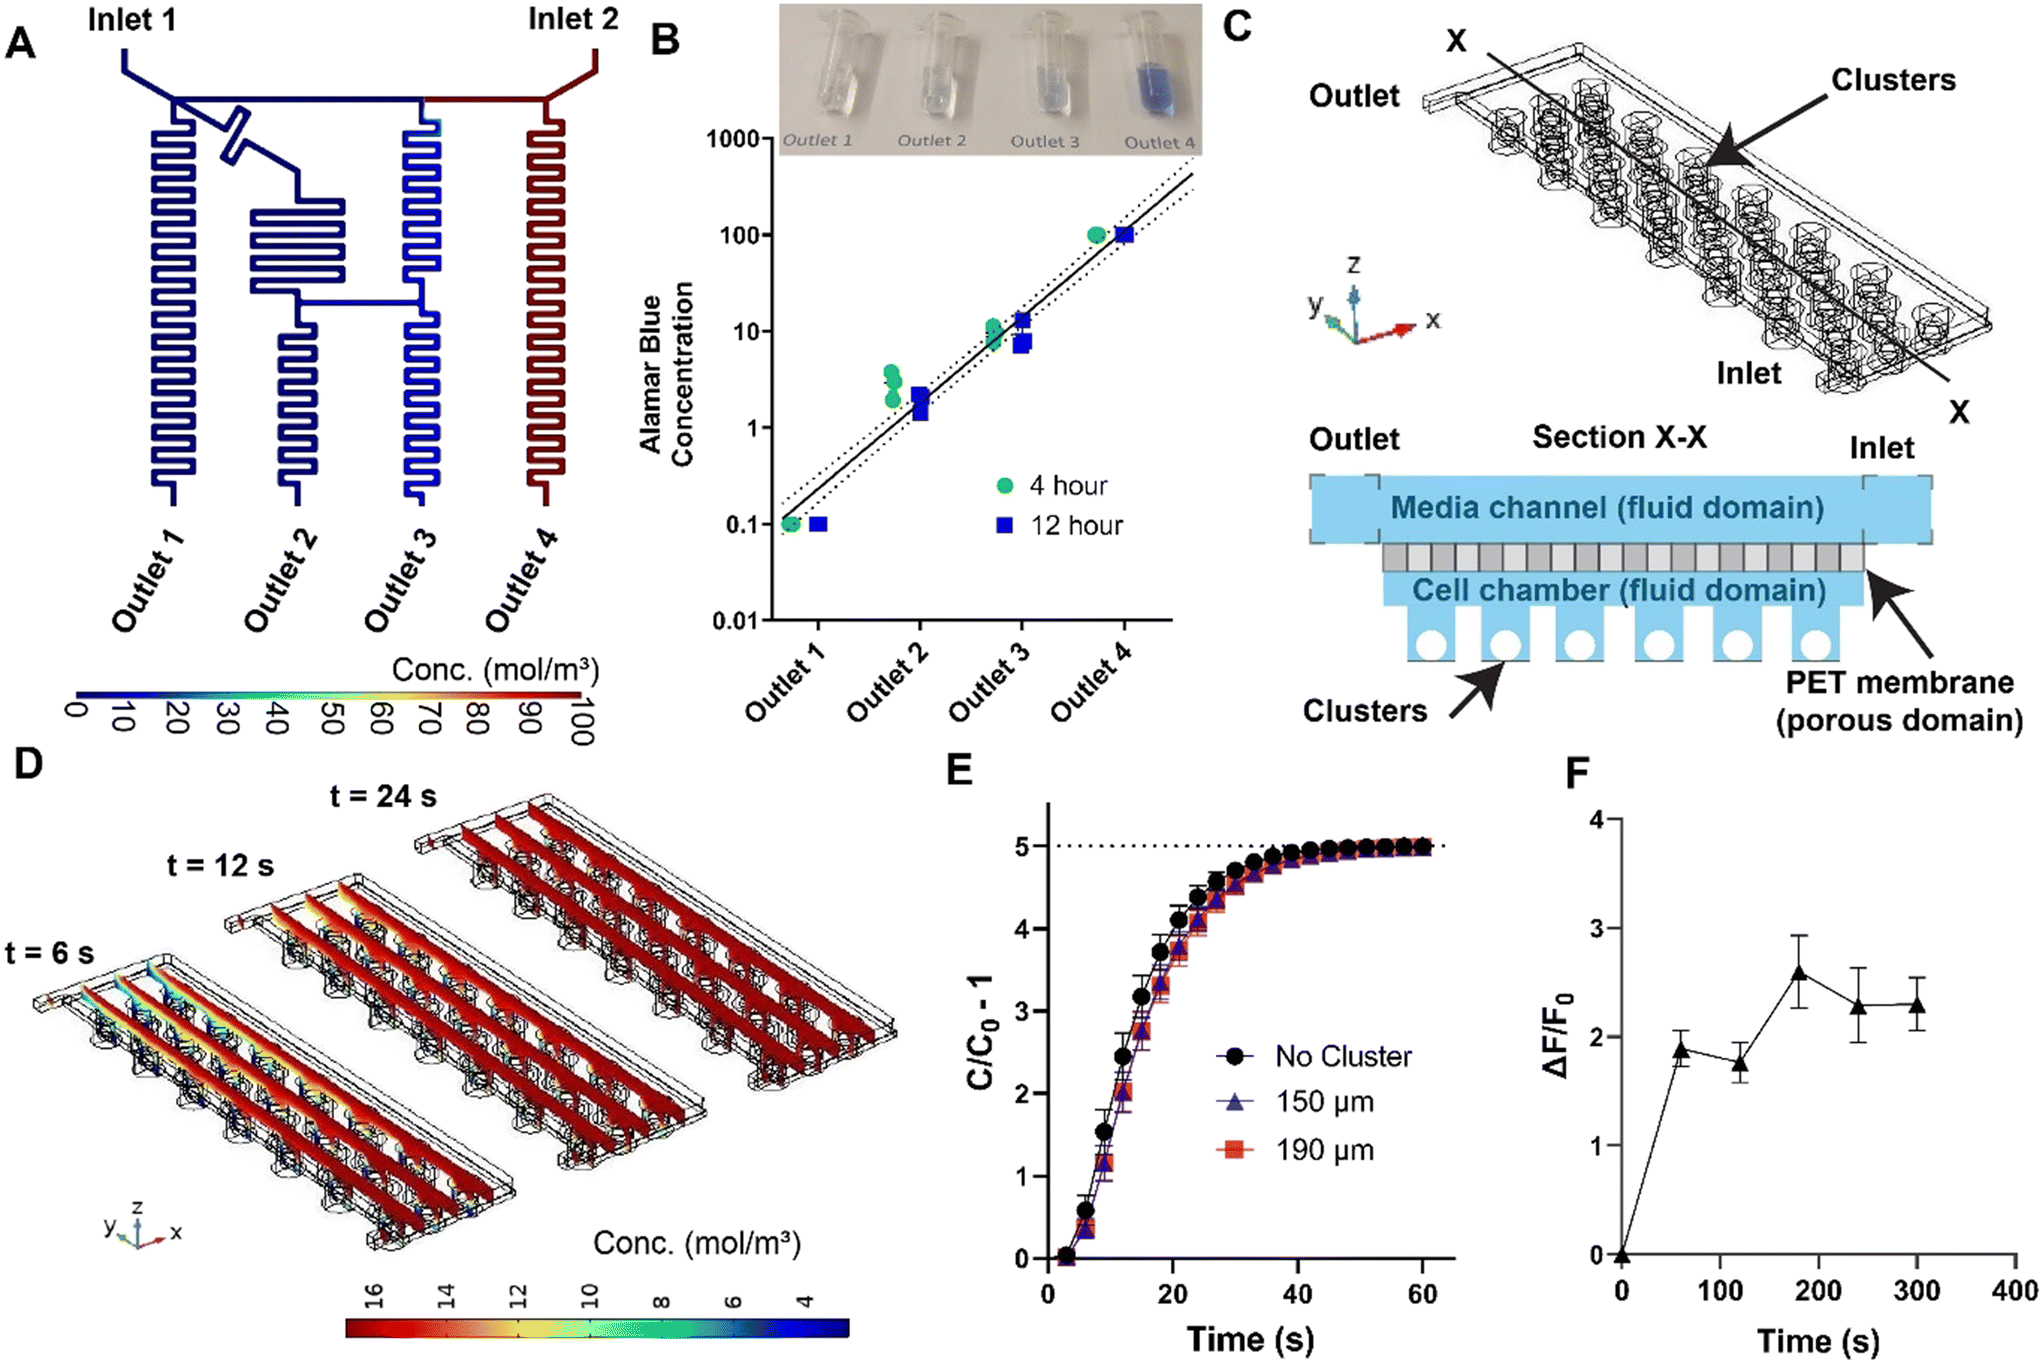 | ||
| Fig. 2 Characterization of transport within MPS. (A) Steady state prediction via finite element analysis confirms the generation of logarithmic dilutions via the cascaded mixing stages. (B) Experimental validation of the logarithmic generator via Alamar Blue concentration measurements at device outlet (flow rate of 0.83 μL min−1). (C) 3D computational domain for modeling fluid flow and mass transport of diluted species in the cell chamber, and a sectional view (X–X, not to scale) of the domain for clear illustration of fluid and porous domains. (D) Snapshots of the diffusion of small molecules from the media channel to the micro-wells with clusters of 190 μm at three representative timepoints. (E) Computational predictions of time required for the concentration within the micro-wells (C) to reach the changes at the inlet concentration (C0) at a flow rate of 20 μL min−1 with and without clusters. Each time point is a spatial average of all the micro-wells and error bars represent 95% confidence intervals. (F) Measurement of PEG-FITC dextran uptake in clusters within the microwells at a flow rate of 20 μL min−1. Traces represent mean and error bars represent SEM (n = 6). Equivalent measurements of diffusion shown in (D) and (E) for the flow rate of 0.83 μL min−1 is reported in ESI† Fig. S3. | ||
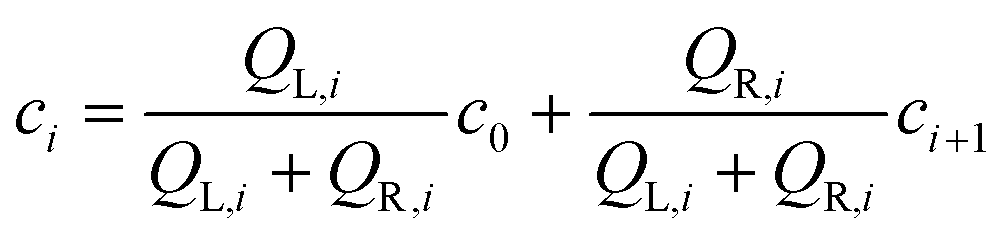
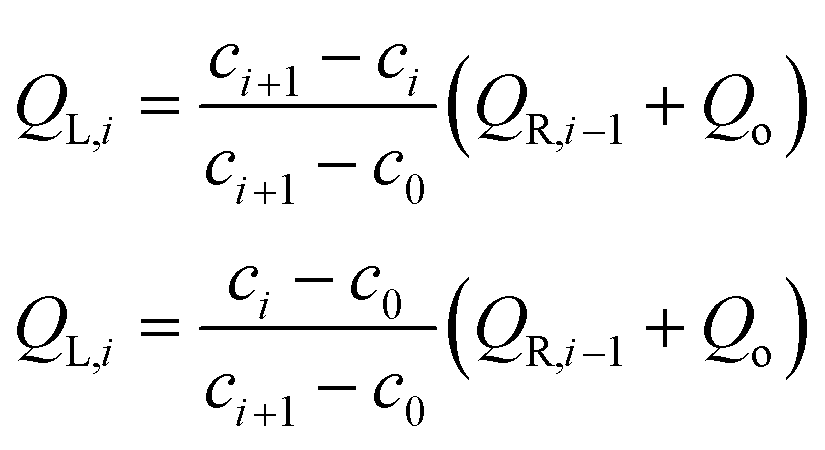
Transient and steady-state fluid flow profiles within the gradient generator were estimated through the solution of incompressible Navier–Stokes equation utilizing the laminar flow module. Similarly, transient and steady-state concentration profiles were estimated via the deployment of transport of diluted species module. The two module solvers were coupled via the Multiphysics solver reacting flow, diluted species. For the fluid flow solver, the boundary conditions were set as mass flow rate at the two inlets (ṁ1 = 4.02 × 10⁻⁸ kg s−1; ṁ2 = 1.54 × 10⁻⁸ kg s−1) and outlets were set as pressure outlet boundaries, while no-slip condition was set for rest of the boundaries on Ω1. For the calculation of concentration profiles, inlets were set at concentrations c1 = 0.1 mol m−3 and c2 = 100 mol m−3, outlets were set as outflow boundary conditions, while no-flux condition was set for the rest of the boundaries on Ω1.
Transient profiles of the concentration were obtained via the coupling of incompressible Navier–Stokes solver module free and porous media flow and transport of diluted species module for estimation of diffusion of diluted species. For the fluid flow solver, the boundary conditions were set as mass flow rate at the inlet (based of two different flow rates of 20 μL min−1 and 0.83 μL min−1), outlet set as pressure outlet boundary, while no-slip condition was set for rest of the boundaries on Ω2. The porous domain was modeled using Brinkman equation with Forchheimer correction. The porosity and permeability of the porous domain was set as 0.4 and 10−12 m2, respectively.
For the concentration profile estimations, inlet was set at concentrations cinlet = 16 mol m−3, outlet set as outflow boundary condition, while no-flux condition was set for the rest of the boundaries on Ω2. The initial concentration of Ω2 was set at c0 = 2.8 mol m−3.
Cell differentiation, loading, and culture
Differentiation protocol to generate islet β cell clusters from human embryonic stem cells was previously published (Nair et al.)3,20 Briefly, Mel1 INSGFP/W human embryonic stem cells (hESC, Monash Immunology and Stem Cell Laboratories, Australia) were first differentiated into insulin producing cells for 19–20 days. Using the green fluorescent protein (GFP) reporter fused to the endogenous insulin locus, INSGFP+ β-like cells were enriched through fluorescence activated cell sorting (FACS). These enriched β cells have been thoroughly characterized in previous work and demonstrate robust enrichment of C-peptide and key β cell markers.3Singularized enriched β cells were immediately loaded to the MPS cell chamber via centrifugation at 300 rcf for 3 minutes at a density of 15 million cells per mL in culture media (5 μL or approximately 75000 cells per chamber) with 10 μM ROCK inhibitor. Culture media composition was CMRL media containing 1:100 B27, 1:100 Glutamax (Gibco), 1:100 NEAA (Gibco), 10 μM ALKi II (Axxora), 500 nM LDN-193189 (Stemgent), 1 μM Xxi (Millipore), 1 μM T3 (Sigma-Aldrich), 0.5 mM vitamin C, 1 mM N-acetyl cysteine (Sigma-Aldrich), 10 μM zinc sulfate and 10 μg ml−1 of heparin sulfate. In situ clustering of enriched β cells to enriched β cell clusters (eBCs) occured within a 72-hour period in static culture within the MPS. Following the cluster formation, flow was introduced via a syringe pump (Harvard Apparatus) at a flow rate of 0.83 μL min−1.
Glucose stimulated insulin secretion
Krebs-Ringer buffer (KRB) solution (NaCl: 115 mM, NaHCO3: 24 mM, HEPES: 25 mM, KCl: 5 mM, CaCl2: 2.5 mM, MgCl2: 1 mM, bovine serum albumin: 0.1%) was used to prepare low glucose solution of 2.8 mM glucose. The eBCs were incubated in this low glucose solution for 2–4 hours. Post incubation, devices were perfused with syringe pump at a flow rate of 20 μL min−1 with low glucose, followed by a sequence of high glucose (16.8 mM), secretagogue and/or KCl (30 mM). Flow through each channel was collected in wells of a 96 well plate every 5 minutes. C-peptide was measured via STELLUX Chemi Human C-peptide ELISA kit (Alpco). Stimulation index (SI) was calculated as ratio of C-peptide secreted in response to high-glucose/secretagogue to low glucose per previously reported methodology.21 Inclusion criterion of SI greater than 1 was used to determine functionality of β clusters.Cell staining and immunofluorescence
The viability of eBCs was assessed within the MPS via the use of cell membrane permeable live-cell calcein violet AM dye (Invitrogen) and red dead-cell ethidium homodimer 1 (EthD-1; Invitrogen) dye. Briefly, eBCs were washed with PBS and incubated with 10 μM concentration of both dyes for an hour at 37 °C and 5% CO2. Following incubation, eBCs were washed and imaged by fluorescent microscopy. The immunostaining for synaptotagmin-4 is performed on fixed eBCs. The eBCs were fixed with 4% paraformaldehyde for 20 min at room temperature, permeabilized with 0.5% Triton X-100, and blocked with bovine serum albumin. Following this, eBCs were stained with polyclonal synaptotagmin-4 antibody (1:50; Invitrogen) and incubated at 4 °C overnight. eBCs were then washed and imaged using secondary Alexa Fluor 594 antibody with DAPI counterstain to mark nuclei. Potentiometric measurements were performed using previously described protocol with BerST-1 dye.22,23 Briefly, eBCs were incubated with 500 nM BerST-1 potentiometric dye for 3 hours before washing with PBS. Following this, MPS device was imaged under the microscope as bolus of low glucose (2.8 mM), high glucose (16.8 mM), and KCl (30 mM) was passed through the device using a pump at 20 μL min−1. Temporal profiles were then obtained from the imaging software.
Statistical analyses
The software GraphPad Prism (GraphPad Software, San Diego USA) was used for statistical analyses. The statistical differences between multiple groups were compared using one-way analysis of variance (ANOVA) followed by post hoc Tukey HSD to find means that were significantly different from each other. Difference between means of two sample data were tested by Student t-test.Results and discussion
Concept and fabrication of the microphysiological islet device
The islet microfluidic MPS device consists of three main elements: a media channel incorporating a logarithmic gradient generator upstream, a cell layer with multiplexed parallel cell culturing microwell array, and a functionalized porous membrane sandwiched between the cell layer and the media layer (Fig. 1). The media and cell layers were obtained using PDMS via standard soft-lithography procedure using SU-8 microstructures patterned on silicon wafers (Fig. 1A). The media layer consists of a gradient generator which mixes the fluids at the inlets with two different concentrations of soluble factors (e.g., drug compounds, cytokines) such that it generates logarithmic dilutions of the factors within the range of the two concentrations. These dilutions were passed into the feeder media channels and out through the four outlets. The cell layer consists of micro-well arrays of 33 wells per channel. Each well was 250 μm deep and 300 μm in diameter. The trenched channels were 50 μm deep. The dimensions of the microwells were based on the upper limit of the cluster sizes based on the literature (see Discussion in MPS culture and characterization of functional enriched β cell clusters), while the trenched channel depth was such that it is approximately 5 times the size of a single cell and prevent clogging with small cluster of cells that may not have been completely singularized during loading. Cells were loaded into the micro-well arrays via the access punch holes in the media layer. Media from the feeder media channels continuously transported fresh nutrients and soluble factors into the microwell arrays, as well as removed the metabolic waste and secreted factors from the cultured enriched β cell clusters (eBCs). To avoid direct shear stress on the eBCs within the micro-well arrays, the cell and the media layers were separated by a porous polyethylene terephthalate (PET) membrane. Coupling between the PET membrane and the PDMS stamps of the cell and media layers was achieved via a silane modification of the membrane (Fig. 1B). XPS elemental analysis of the functionalized membranes was performed to confirm the immobilization of the silane, where both silicon (Si2s, Si2p) and nitrogen (N1s) peaks were detected (Fig. 1B). The functionalized PET membrane was sandwiched between two PDMS slabs, which are activated via oxygen plasma. The components were then aligned, assembled, and cured resulting in a PDMS/PET system (Fig. 1C).The proposed device can be scaled for higher throughput applications, with both multiplexed loading of cells and fluid handling, allowing for temporal collection of the supernatant from each channel and subsequent analyses (Fig. 1D). The number of microwells per channel can be reduced to a number that allows for higher number of tests with the same number of total cells. The microliter order of volume per array allows for concentrating soluble factors collected from the microwells, as opposed to non-physiological volumes in standard cell-culturing platforms. The optical accessibility due to the PDMS/PET system enables the flexible use of high-resolution microscopy techniques for live cell imaging, as demonstrated by the tracking of transmembrane potential of the islet β clusters. It is noted that the device schematic is not limited to the number of inlets or outlets since the fluidics are designed based on simple theory that can be extended to more complex fluid handling as described below. Additionally, computational characterization of transport processes within the microwell array is reported in the next sub-section to demonstrate that the porous PET barrier provides protection to the eBCs against shear stress yet allows diffusion of nutrients and compounds, mimicking an artificial endothelial barrier whose diffusion properties may be altered via the choice of pore size and density.
Characterization of transport processes
 | (1) |
| QL = Qo + QL1 + QL2QR = Q3 + QR2 | (2) |
 | (3) |
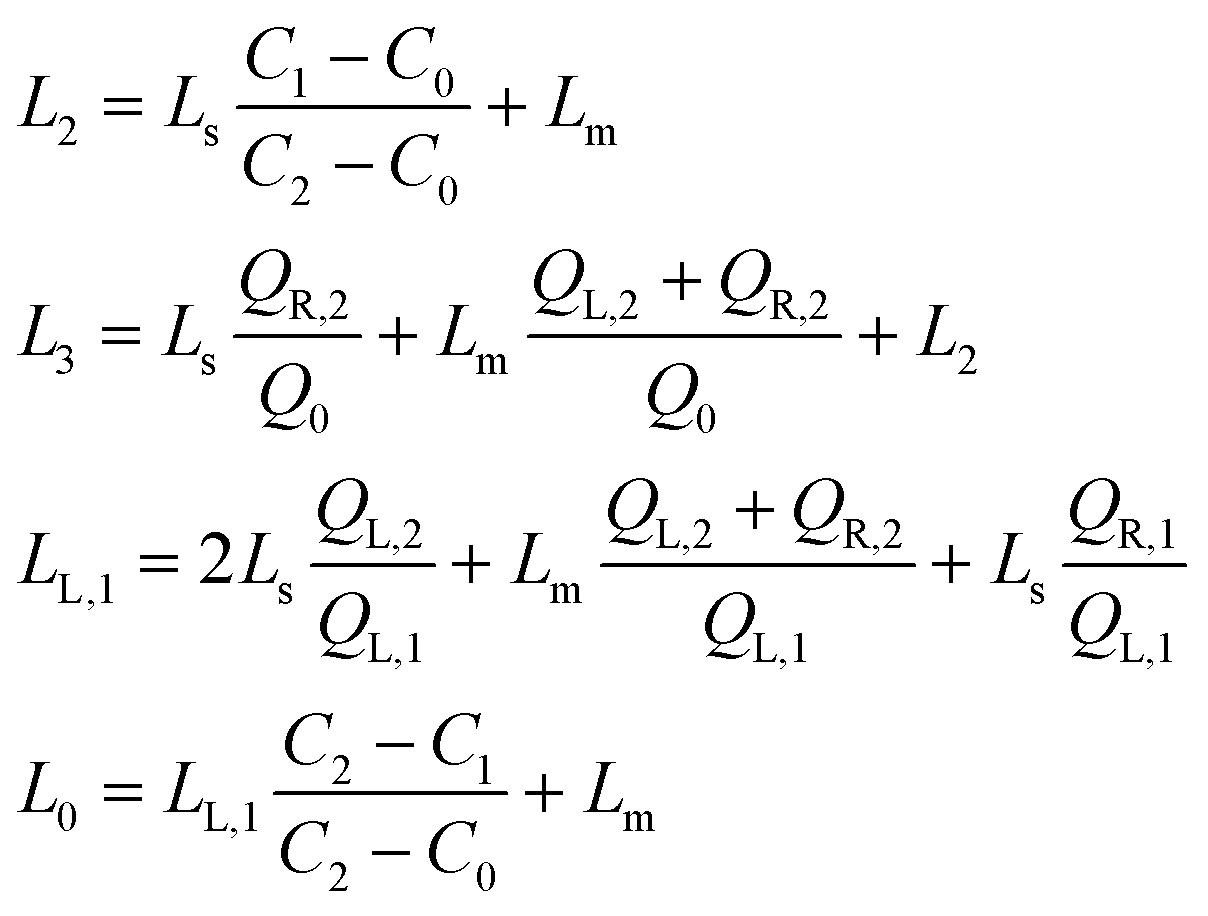 | (4) |
| Lengths (mm) | Flowrates | |||
|---|---|---|---|---|
| Parameters that are used as inputs are in bold. Outlet flowrates used in this study: 0.83 μL min−1 and 20 μL min−1. | ||||
| L M | 12.000 | Q R1/Qo | 0.091 |
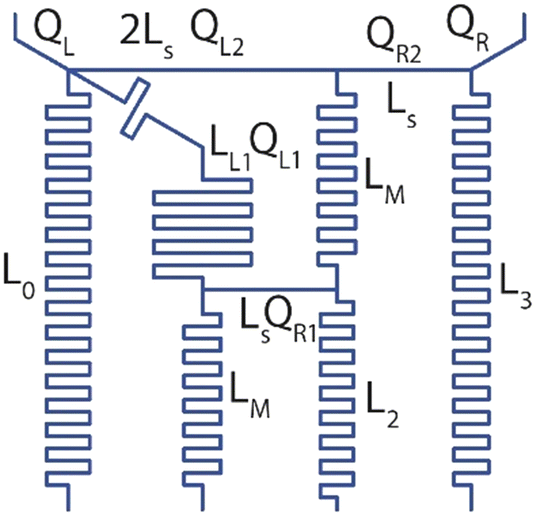
|
| L s | 02.200 | Q R2/Qo | 0.108 | |
| L 2 | 12.200 | Q L1/Qo | 0.909 | |
| L 3 | 25.529 | Q L2/Qo | 0.982 | |
| L L1 | 19.378 | Q R/Qo | 1.108 | |
| L 0 | 29.615 | Q L/Qo | 2.892 | |
Details of the computational model was provided in the Materials and methods section. Briefly, transient and steady-state fluid flow profiles within the gradient generator was estimated through the solution of incompressible Navier–Stokes equation utilizing the laminar flow module. Similarly, transient and steady-state concentration profiles were estimated via the deployment of transport of diluted species module. The two module solvers were coupled via the Multiphysics solver reacting flow, diluted species. Logarithmic concentrations at the outlets were observed in the steady state predictions by the computational model (Fig. 2A) with identical flowrates. Furthermore, at both the design flowrates (0.83 μL min−1 and 20 μL min−1), the gradients were achieved within orders of seconds (0.83 μL min−1: 60 s; 20 μL min−1: 4 s) as determined by the transient predictions by the computational model (Fig. S1†).
To further validate the robustness of the gradient generator, experimental verification of the concentrations of Alamar Blue at the outlets were conducted at timepoints of 4 hours and 12 hours from the beginning of the experiments. Briefly, completely reduced Alamar Blue was prepared via treatment to high temperature in an autoclave for 20 minutes. Reduced Alamar Blue was considered 100X and used in the gradient generator at inlet 2 (Fig. 2A) along with 0.1X Alamar Blue at inlet 1. Fluid collected at the four outlets at the two timepoints (4 and 12 hours) were compared against the standard curve of Alamar Blue in a spectrophotometer. Experiments revealed a near logarithmic dilution of the Alamar Blue obtained at the four outlets (Fig. 2B), with slight deviations attributed to tolerances in fabrication and flow field generated by the perfusion pump. The flow rate for this set of experiments was kept at the value used for drug exposure study and multi-day culture (0.83 μL min−1).
MPS culture and characterization of functional enriched β cell clusters
A schematic representation of the differentiation protocol to generate eBCs is shown in Fig. 3A. Briefly, differentiation of INSGFP/W hESC to immature C-peptide+ cells was achieved within 19–20 days.3 Our prior work has shown that isolation of insulin-positive cells (INSGFP/w) by fluorescence-activated cell sorting (FACS) followed by reaggregation stimulates maturation of β cells and results in enriched β-cell clusters (eBC).3 To recapitulate reaggregation into the MPS, enriched cells were loaded via the access punch holes into the pre-wetted MPS devices (Fig. 1A). The devices were then centrifuged at 300 rcf for 3 min to ensure optimal cell loading. Cells within the MPS form clusters in situ within a 72-hour period (Fig. 3A). The three dimensionality of the clusters was verified by high resolution confocal imaging by taking images at 0.5 μm slices in a Perkin Elmer Opera Phenix microscope (Fig. S4A, ESI† Video SV1). 3D images of the eBCs were reconstructed using Imaris software (Oxford Instrument group). These clusters resembled the enriched β cell clusters (eBCs) generated in suspension culture. Measurement of eBC diameters on days 3 through 7 after loading showed a distribution ranging from 80 to 190 μm (Fig. 3B) with a higher number of clusters with diameters in the 130–150 μm range. This size distribution is within the range reported in endogenous human islets.28,29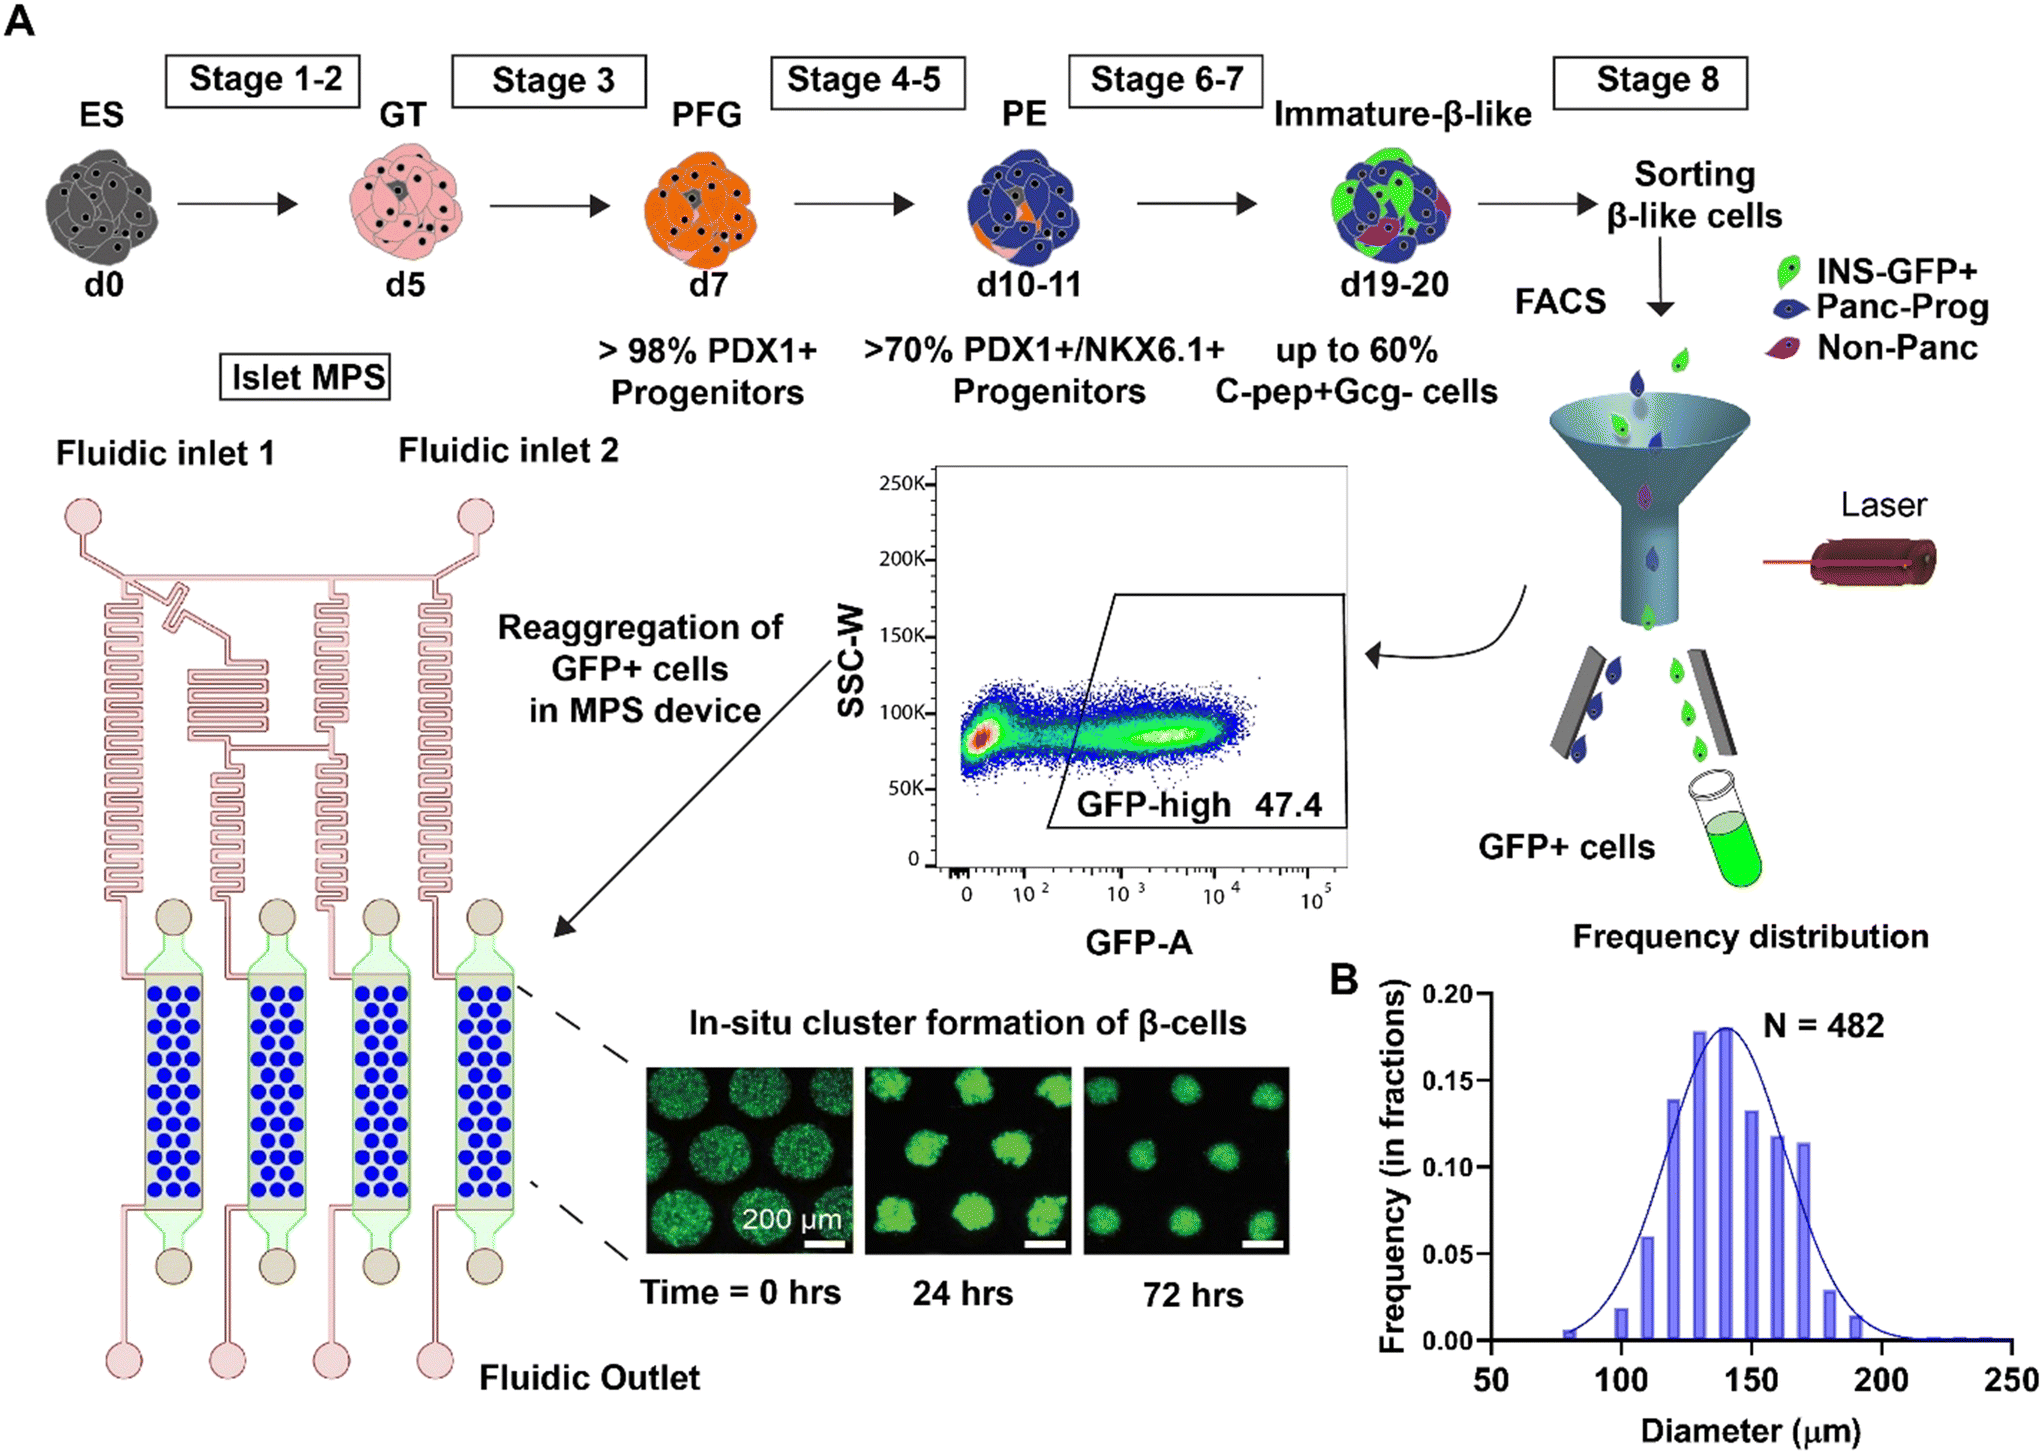 | ||
| Fig. 3 Schematic representation of eBC formation in the MPS. (A) Schematic of the differentiation and isolation of hESCs into immature insulin producing clusters from day 0 through day 20 is shown in the upper panel. INSGFP+ cells were isolated by FACS from day 20 clusters, and singularized INSGFP+ cells were introduced into the microwell arrays within the MPS via the cell loading access ports. In situ reaggregation of enriched β cell clusters (eBCs) was observed within a 72-hour period (GFP marks insulin producing cells). (B) Histogram of the cluster sizes measured in the MPS microwell arrays. | ||
An important qualification for the applicability of the islet-MPS for drug screening or disease modeling applications is the ability to keep the clusters viable and functional over longer time periods. Fig. 4A shows a representative image of eBCs on day 7 post-loading. Viability and functional assays were conducted to demonstrate the ability of the eBCs to be cultured long-term within the MPS. Viability of the eBCs on day 7 in the MPS evaluated via Live/Dead cytotoxicity staining assays (Fig. 4B upper panel) showed healthy morphology and GFP brightness, which is an indication of insulin transcription and translation. To further confirm that dead cell signal is not buried within the cluster, we performed confocal imaging of the eBCs (Fig. S4B†). Immunofluorescence staining of fixed eBCs in the MPS was performed to detect the presence of synaptotagmin-4 and insulin on day 7 (Fig. 4B lower panel). Synaptotagmins (Syt) are one of the calcium sensitive components of the SNARE (soluble N-ethylmaleimide-sensitive factor attachment protein receptor) fusion complex and reported to promote insulin secretion.30,31 Furthermore, β-cell sensitivity to cytoplasmic calcium, subsequent response to high glucose, and associated β-cell maturity have been correlated with Syt-4 expression.32
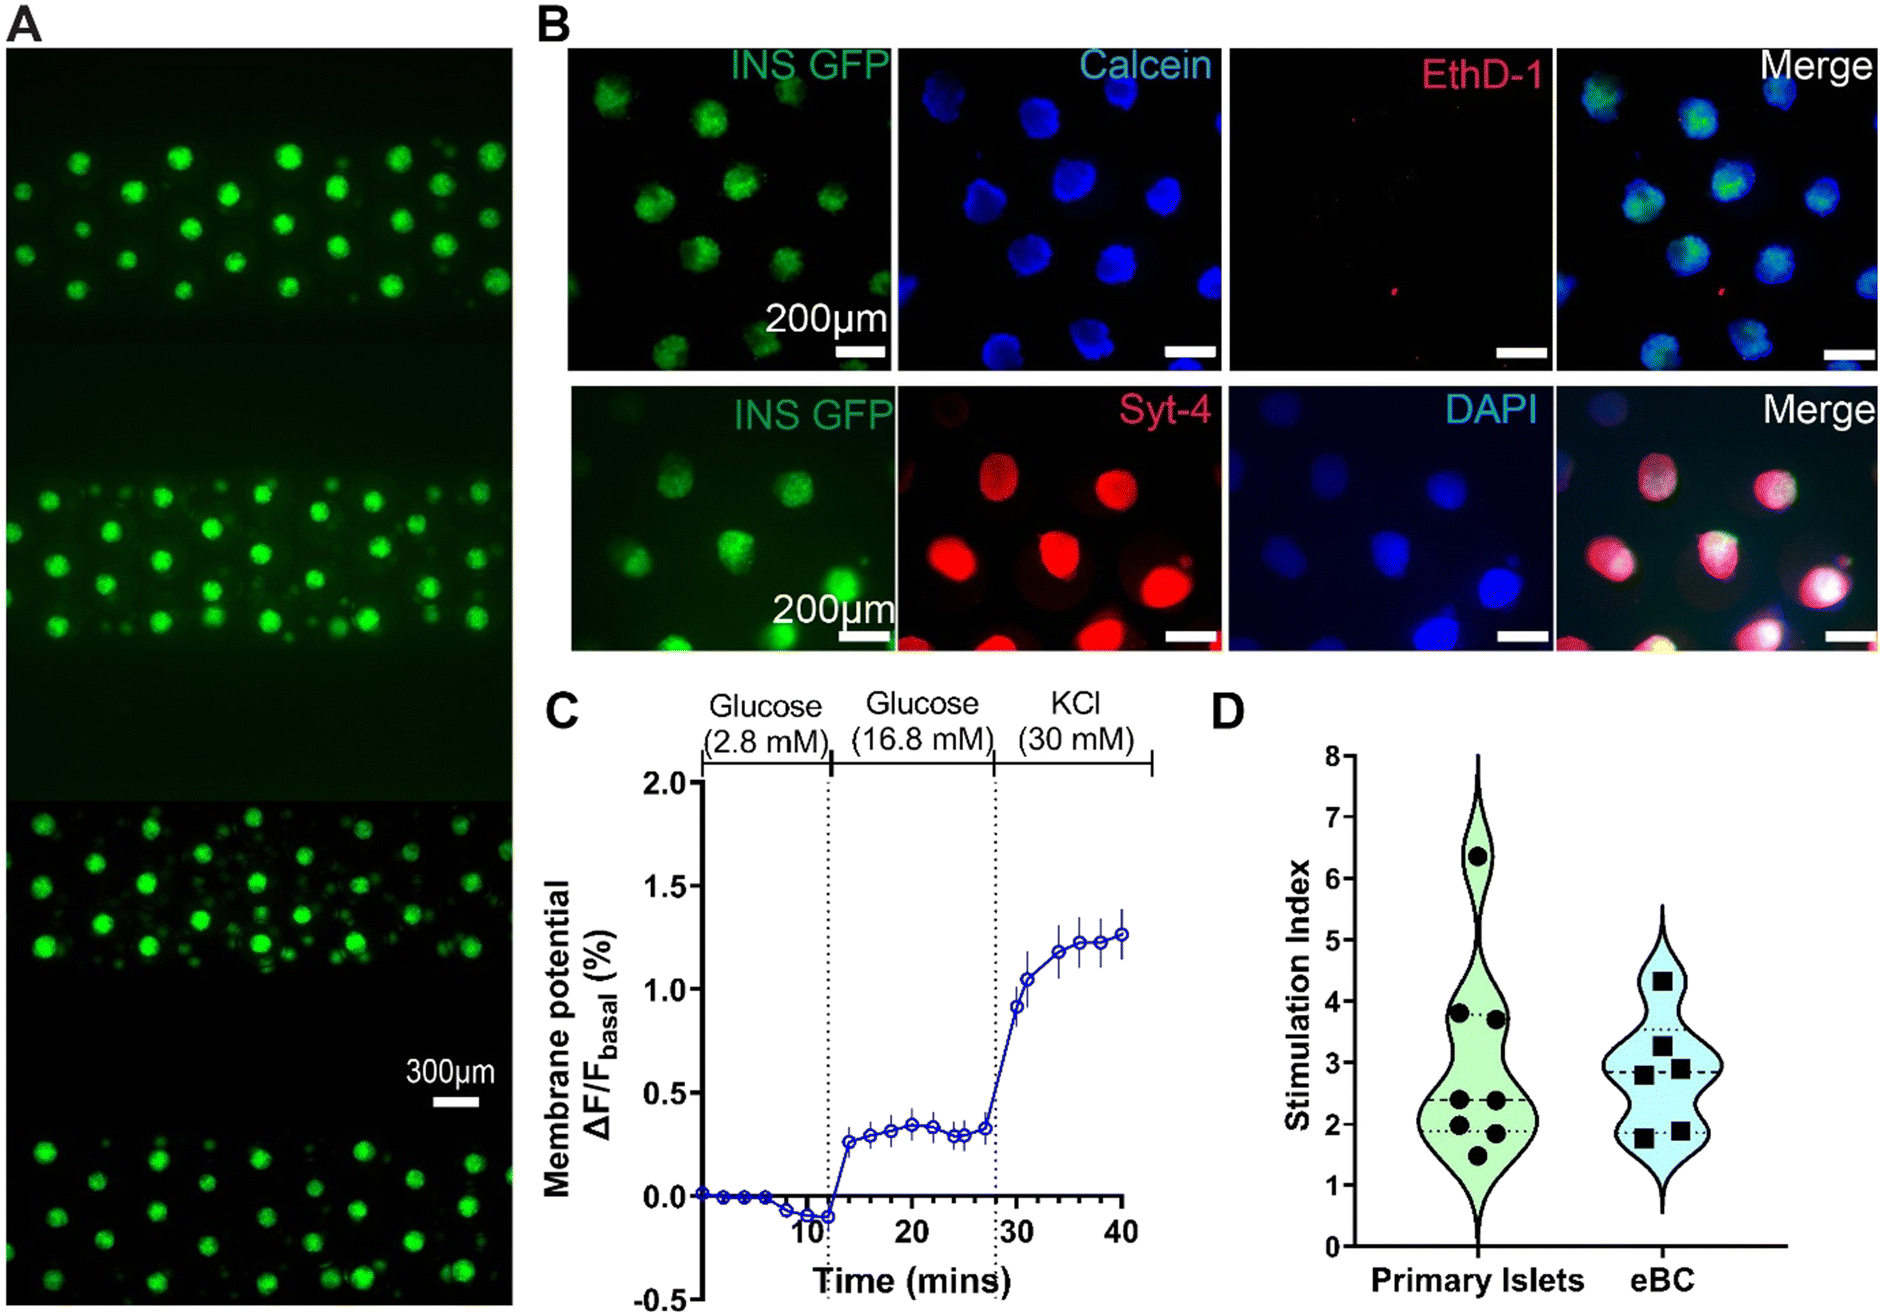 | ||
| Fig. 4 Culture and characterization of functional eBCs in MPS. (A) Multiplexed eBCs at day 7 after loading in the MPS device. Green: INS/GFP. (B) Immunofluorescence images at day 7: viability measurements (top panel), synaptotagmin-4 (Syt-4) and nuclear stain DAPI (bottom panel). (C) Transmembrane potential changes in eBCs as measured via BerST-1 potentiometric dye, when challenged with glucose and KCl (n = 10, error bars represent SEM). (D) Stimulation index (C-peptide release at 16.8 mM glucose over 2.8 mM glucose) from primary human islets compared to eBCs (p < 0.05). | ||
Functionality of the eBCs after 7 days of culturing within the MPS was determined via the glucose-stimulated-insulin-stimulation (GSIS) assay. To validate the computational predictions of the transport within the MPS arrays (Fig. 2E), eBCs were stained with potentiometric BerST-1 dye,22 and exposed to challenges of low glucose (2.8 mM), high glucose (16.8 mM), and KCl (30 mM) at a flowrate of 20 μL min−1. Change in the fluorescence of the BerST-1 dye from basal levels, indicative of membrane depolarization in the eBCs, is shown in Fig. 4C. These data showed that eBCs sense changes in glucose within a period comparable to those predicted by the computational model. Functionality of the eBCs is determined by calculating the ratio between the amount of C-peptide released at high glucose levels (16.8 mM) versus the amount released at basal low glucose levels (2.8 mM). This C-peptide ratio is referred as stimulation index (SI). Typical GSIS C-peptide trace is shown in Fig. S5.† Both human primary islet and eBCs demonstrated the ability to release insulin upon glucose challenge after 7 days in culture within the MPS (Fig. 4D). Comparison of stimulation index of eBCs reaggregated in standard wells vs. those cultured in device showed no statistical difference when from the same differentiation batch. eBCs retained GFP fluorescence and viability also after a month of culture in the MPS (Fig. S6†). Future studies will need to characterize these eBCs further, and optimize culture conditions, in a multi-week study. These data overall show that islet-MPS can maintain eBCs functional for at least 7 days and viable for over 30 days.
Drug testing and metabolic interrogation of eBCs in MPS
Since the destruction or dysfunction of pancreatic islet β cells is the main determinant for development of diabetes, we tested the suitability of the islet MPS for in vitro drug testing and/or screening for diabetogenic metabolic disruptors. To demonstrate the utility of the gradient generator, we tested the effect of long-term continuous (24 hour) exposure to glibenclamide. Glibenclamide is a sulfonylurea family drug that is known to stimulate insulin secretion in vitro upon acute exposure (exposure time ∼min). Unfortunately, sulfonylurea activate insulin secretion even at low glucose levels and prolonged treatment is associated with clinical hypoglycemia, hyperinsulinemia, long-term deleterious effect on the pancreas and kidneys, and a risk of cardiovascular disease mortality.33,34 Furthermore, glibenclamide is known to impair insulin secretion in islets upon chronic exposure in a time- and dose-dependent manner.35–37 Here we tested the effect of extended 24 hours exposure to glibenclamide at logarithmic concentrations (0.05, 0.5, 5, 50 μM) on eBC which were cultured in the MPS for 7 days. Post exposure to glibenclamide, eBCs were washed with PBS and GSIS assay was conducted per the protocol described in the Materials and methods section. eBCs exposed to 0.05–5 μM glibenclamide showed no significant change in the ability to secrete insulin in response to the glucose challenge in the GSIS assay when compared to controls (Fig. 5A). However, eBCs exposed to 50 μM glibenclamide display significantly reduced SI when compared to the controls. The controls consisted of eBCs in the device from the same batch of differentiations but exposed to the drug vehicle. Previous in vitro studies on endogenous human islets show over 2-fold increase in apoptosis when islets are cultured in glibenclamide for short periods of time (i.e., 4 hours) at concentrations of 0.1–10 μM.37 Reduced SI has been reported in rat β-cell exposed to 0.1 μM glibenclamide for 24 hours; with the effect reported to be reversible within the testing parameters when islets are placed back in glibenclamide-free media for 24 hours.35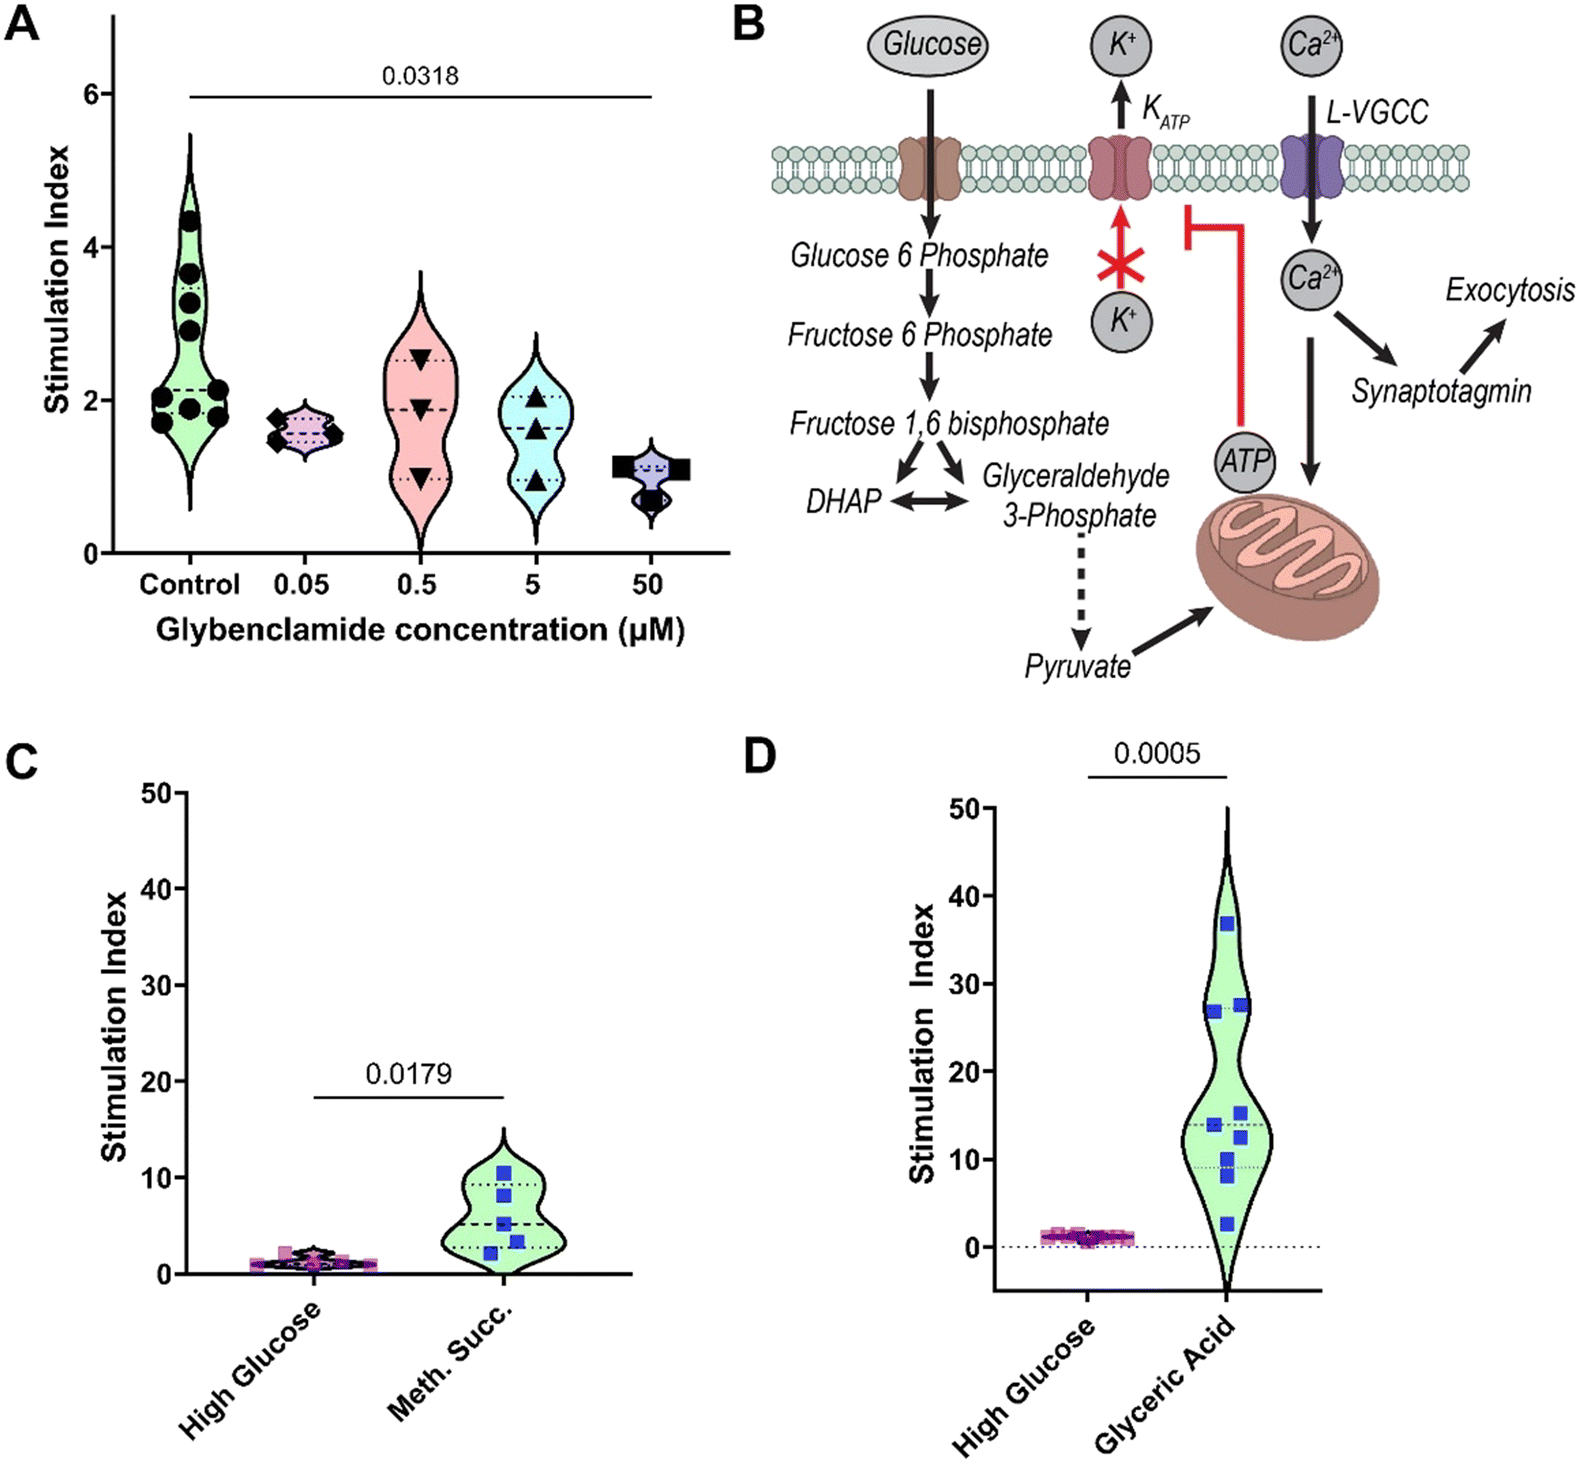 | ||
| Fig. 5 Use of islet MPS device for drug testing and biomolecular discovery. (A) Influence of chronic exposure to logarithmic dilutions of glybenclamide on eBCs' glucose-responsiveness. The statistically significant differences between groups were determined by one-way ANOVA followed by Tukey's HSD post-test. (B) Schematic representation of the metabolic circuit involved during glucose stimulated insulin secretion in pancreatic β cells. (C and D) Glycolytic bottleneck in stem cell-derived β cells detected in MPS device via acute exposure to secretagogues. The p-values calculated by unpaired Student's t-test. Stimulation index in response to methyl succinate (10 mM) (C) and glyceric acid (20 mM) (D) compared to glucose (16.8 mM). | ||
It is noted that glibenclamide has been shown to have differential effect on primary β-islets owing to functional heterogeneity.38 Furthermore, the human islets are composed of different cell types, including α-, β- δ-, pancreatic polypeptide (PP-), and ε-cells, as well as endothelial cells.29 Metabolic and ionic coupling of these cells may influence drug metabolism. Interestingly, differential effect of glibenclamide on glucagon secretion is reported in clusters of unsorted islets, 50:50 mixture of β- and α-islets, and pure α-islets.39 While stem-cell derived islets promise to be a novel platform for diabetes drug discovery, issues of functional immaturity and an evolving concept of characterization of islet heterogeneity provide challenges in extrapolating drug data from stem-cell derived islets to equivalent effects on human primary islets.40–42 In this manuscript, we demonstrate the utility of our MPS device in conducting wide range of drug concentrations. Mechanistic questions arising from the dynamic range of responses of islets to glibenclamide provide interesting topic for future investigations, but beyond the scope of current study. In future studies, our device can be used to answer fundamental biological questions at the heart of functional and electrophysiological heterogeneity. For example, fluidic coupling between MPS devices has been used to study metabolic interaction between endothelial cells and neural tissues, especially with respect to metabolism of psychoactive drug methamphetamine.43 The islet MPS reported here can be used to investigate nuanced metabolic coupling of different sub-sets of islet clusters via fluidic coupling and/or controlled variation of the cell ratios to generate datasets that may be coupled with mathematical predictions to understand ionic coupling.44 Thus, the islet MPS, when coupled with subset of islet partner and endothelial cells may recapitulate many of the characteristics of human islets,45 and is poised to be a reliable platform for generating valuable data for novel drugs.
In addition to drug screening, the islet MPS can be used as an efficient tool to optimize in situ stem cell differentiation conditions and culture media by testing known and novel compounds that modulate the pathways involved in metabolism, insulin production and secretion. A simplistic metabolic circuit involved in glucose stimulated insulin secretion is shown in Fig. 5B. Following an elevation in concentration of glucose in the extracellular space, glucose enters the cytoplasm, where it is phosphorylated to glucose 6-phosphate and passed into the mitochondrial electron chain transport via the pyruvate shuttle. As a result, cytoplasmic ATP concentration increases, which suppresses the ATP sensitive potassium channels and leads to cell depolarization. This in turn leads to elevation in cytoplasmic calcium levels in a feedback mechanism that involves calcium sensors and enzymes that leads to various signaling cascade, resulting in insulin secretion. Like any other stem cell-derived tissue, stem cell-derived β-cell display some immaturity compared to primary counterparts. This includes an inability to robustly respond to glucose via insulin secretion when compared to primary islets.4 Such lack of robustness was also observed in the eBCs cultured in the MPS and thus we hypothesized that our eBCs demonstrate a similar glycolytic bottleneck.4 To test this hypothesis, eBCs cultured in the MPS were acutely exposed to mono-methyl succinate to stimulate the TCA in the mitochondria per the GSIS assay protocol. Data showed an increase in stimulation index, corresponding to an increase in insulin secretion, when eBCs were acutely exposed to mono-methyl succinate (10 mM), compared to high glucose exposure (16.8 mM; Fig. 5C). An increase in insulin secretion was also observed when eBCs were exposed to 20 mM glyceric acid (Fig. 5D), a non-phosphorylated precursor to 2- and 3-phosphoglycerate and downstream metabolite from glyceraldehyde-3-phosphate (Fig. 5B). Collectively, these data suggested that eBCs used in this study demonstrated a similar glycolytic bottleneck as the one reported by Davis et al.4 This data overall highlights the potential of microfluidic platforms for high-throughput discoveries of biomaterials, drugs, and cryopreservative agents for translational impact.
While this MPS platform has been fabricated using soft lithography-based approach using PDMS, the use of PDMS for drug studies or discoveries could be a limiting factor. Depending on the partition coefficient of the molecule, hydrophobic drugs and biomolecules have varying amount of absorption into PDMS, showing as much as 40–60% absorption into the PDMS walls.9,46 Furthermore, kinetics of the absorption process is hugely dependent on flow regime within the fluidic channels. Thus, the present MPS device will either need characterization of drug absorption into the device for a wider regime of flow, use of other polymers such as cyclic olefin copolymers or polycarbonate, or appropriate surface modification.46 The current study shows functional maintenance of eBCs for 7 days in the MPS. However, further optimization of culture conditions is warranted for extended culture time within the MPS. This is not limited to co-culturing of the eBCs with partner cells to capture heterogeneity in the tissue that present a whole range of technical challenge. While we demonstrate the use of high-resolution confocal imaging for high-content usage, extracting the tissue for applications such as single cell RNA sequencing in future studies can allow the use of the MPS device for a one-stop platform for performing functionality and high-content measurements of the stem cell-derived pancreatic β cells. Lastly, metabolic and electrophysiological heterogeneity of β-cells is at the heart of the dynamic range of functional behavior that can be explored to design robust clusters via the integration of the high-content, high-throughput MPS device with sophisticated computational models.
Conclusion
The reported islet MPS provides a platform for multiplexing both cell loading and fluid handling, providing a balance of high-content and high-throughput characteristics. The MPS provides certain crucial features of in vivo physiology, such as continuous nutrient delivery, low solution to tissue volumes, and transport into the tissue that mimics diffusion via the vasculature. Potential of long-term culture of stem cell-derived islet β-cells is demonstrated, as has been the case made for the use of the islet MPS for drug screening and high-throughput discoveries. Furthermore, while we demonstrate the fabrication process using soft lithography, the design can be easily adapted for more scalable fabrication processes such as embossing methods using polymers such as polycarbonate or cyclic olefin copolymers.Conflicts of interest
There are no conflicts to declare.Acknowledgements
This research was supported by NIH grants UH3DK120004 and previous phase UG3DK120004 (K. E. H. & M. H.), and the NSF Engineering Research Center for Advanced Technologies for Preservation of Biological Systems (ATP-Bio) NSF EEC #1941543. MH is on the SAB of Encellin Inc. and Thymmune Therapeutics Inc, holds stocks in Encellin Inc, Thymmune Therapeutics Inc, and Viacyte Inc., and has received research support from Eli Lilly. He is the co-founder, and SAB member of Minutia Inc. and EndoCrine Biotherapeutics, and holds stocks and options in the companies.References
- E. de Klerk and M. Hebrok, Front. Endocrinol., 2021, 12 DOI:10.3389/fendo.2021.631463.
- J. R. Millman, C. Xie, A. Van Dervort, M. Gürtler, F. W. Pagliuca and D. A. Melton, Nat. Commun., 2016, 7, 11463 CrossRef CAS PubMed.
- G. G. Nair, J. S. Liu, H. A. Russ, S. Tran, M. S. Saxton, R. Chen, C. Juang, M. Li, V. Q. Nguyen, S. Giacometti, S. Puri, Y. Xing, Y. Wang, G. L. Szot, J. Oberholzer, A. Bhushan and M. Hebrok, Nat. Cell Biol., 2019, 21, 263–274 CrossRef CAS PubMed.
- J. C. Davis, T. C. Alves, A. Helman, J. C. Chen, J. H. Kenty, R. L. Cardone, D. R. Liu, R. G. Kibbey and D. A. Melton, Cell Rep., 2020, 31, 107623 CrossRef CAS PubMed.
- L. Velazco-Cruz, J. Song, K. G. Maxwell, M. M. Goedegebuure, P. Augsornworawat, N. J. Hogrebe and J. R. Millman, Stem Cell Rep., 2019, 12, 351–365 CrossRef CAS PubMed.
- N. J. Hogrebe, P. Augsornworawat, K. G. Maxwell, L. Velazco-Cruz and J. R. Millman, Nat. Biotechnol., 2020, 38, 460–470 CrossRef CAS PubMed.
- M. Kasendra, A. Tovaglieri, A. Sontheimer-Phelps, S. Jalili-Firoozinezhad, A. Bein, A. Chalkiadaki, W. Scholl, C. Zhang, H. Rickner, C. A. Richmond, H. Li, D. T. Breault and D. E. Ingber, Sci. Rep., 2018, 8, 2871 CrossRef PubMed.
- Y. Torisawa, C. S. Spina, T. Mammoto, A. Mammoto, J. C. Weaver, T. Tat, J. J. Collins and D. E. Ingber, Nat. Methods, 2014, 11, 663–669 CrossRef CAS PubMed.
- F. T. Lee-Montiel, A. Laemmle, V. Charwat, L. Dumont, C. S. Lee, N. Huebsch, H. Okochi, M. J. Hancock, B. Siemons, S. C. Boggess, I. Goswami, E. W. Miller, H. Willenbring and K. E. Healy, Front. Pharmacol., 2021, 12 DOI:10.3389/fphar.2021.667010.
- A. L. Glieberman, B. D. Pope, J. F. Zimmerman, Q. Liu, J. P. Ferrier, J. H. R. Kenty, A. M. Schrell, N. Mukhitov, K. L. Shores, A. B. Tepole, D. A. Melton, M. G. Roper and K. K. Parker, Lab Chip, 2019, 19, 2993–3010 RSC.
- J. V. Rocheleau, G. M. Walker, W. S. Head, O. P. McGuinness and D. W. Piston, Proc. Natl. Acad. Sci. U. S. A., 2004, 101, 12899–12903 CrossRef CAS PubMed.
- J. F. Dishinger, K. R. Reid and R. T. Kennedy, Anal. Chem., 2009, 81, 3119–3127 CrossRef CAS PubMed.
- M. Nourmohammadzadeh, Y. Xing, J. W. Lee, M. A. Bochenek, J. E. Mendoza-Elias, J. J. McGarrigle, E. Marchese, Y. Chun-Chieh, D. T. Eddington, J. Oberholzer and Y. Wang, Lab Chip, 2016, 16, 1466–1472 RSC.
- A. Zbinden, J. Marzi, K. Schlünder, C. Probst, M. Urbanczyk, S. Black, E. M. Brauchle, S. L. Layland, U. Kraushaar, G. Duffy, K. Schenke-Layland and P. Loskill, Matrix Biol., 2020, 85–86, 205–220 CrossRef CAS PubMed.
- Y. Jun, J. Lee, S. Choi, J. H. Yang, M. Sander, S. Chung and S.-H. Lee, Sci. Adv., 2019, 5, eaax4520 CrossRef CAS PubMed.
- S. N. Patel, M. Ishahak, D. Chaimov, A. Velraj, D. LaShoto, D. W. Hagan, P. Buchwald, E. A. Phelps, A. Agarwal and C. L. Stabler, Sci. Adv., 2021, 7, eaba5515 CrossRef CAS PubMed.
- T. Tao, Y. Wang, W. Chen, Z. Li, W. Su, Y. Guo, P. Deng and J. Qin, Lab Chip, 2019, 19, 948–958 RSC.
- A. Mata, A. J. Fleischman and S. Roy, J. Micromech. Microeng., 2006, 16, 276–284 CrossRef.
- C. G. Sip and A. Folch, Biomicrofluidics, 2014, 8, 036504 CrossRef PubMed.
- G. G. Nair, M. Hebrok and H. Russ, Protoc. Exch., 2019 DOI:10.1038/protex.2018.140.
- H. A. Russ, A. V. Parent, J. J. Ringler, T. G. Hennings, G. G. Nair, M. Shveygert, T. Guo, S. Puri, L. Haataja, V. Cirulli, R. Blelloch, G. L. Szot, P. Arvan and M. Hebrok, EMBO J., 2015, 34, 1759–1772 CrossRef CAS PubMed.
- Y.-L. Huang, A. S. Walker and E. W. Miller, J. Am. Chem. Soc., 2015, 137, 10767–10776 CrossRef CAS PubMed.
- B. Charrez, V. Charwat, B. A. Siemons, I. Goswami, C. Sakolish, Y.-S. Luo, H. Finsberg, A. G. Edwards, E. W. Miller, I. Rusyn and K. E. Healy, Front. Pharmacol., 2021, 12, 684252 CrossRef CAS PubMed.
- K. Lee, C. Kim, B. Ahn, R. Panchapakesan, A. R. Full, L. Nordee, J. Y. Kang and K. W. Oh, Lab Chip, 2009, 9, 709–717 RSC.
- M. Ebadi, K. Moshksayan, N. Kashaninejad, M. S. Saidi and N.-T. Nguyen, Chem. Eng. Sci., 2020, 212, 115339 CrossRef CAS.
- A. Mathur, P. Loskill, K. Shao, N. Huebsch, S. Hong, S. G. Marcus, N. Marks, M. Mandegar, B. R. Conklin, L. P. Lee and K. E. Healy, Sci. Rep., 2015, 5, 8883 CrossRef CAS PubMed.
- P. Loskill, T. Sezhian, K. M. Tharp, F. T. Lee-Montiel, S. Jeeawoody, W. M. Reese, P.-J. H. Zushin, A. Stahl and K. E. Healy, Lab Chip, 2017, 17, 1645–1654 RSC.
- C. Ionescu-Tirgoviste, P. A. Gagniuc, E. Gubceac, L. Mardare, I. Popescu, S. Dima and M. Militaru, Sci. Rep., 2015, 5, 14634 CrossRef CAS PubMed.
- D. Bosco, M. Armanet, P. Morel, N. Niclauss, A. Sgroi, Y. D. Muller, L. Giovannoni, G. Parnaud and T. Berney, Diabetes, 2010, 59, 1202–1210 CrossRef CAS PubMed.
- B. Wu, S. Wei, N. Petersen, Y. Ali, X. Wang, T. Bacaj, P. Rorsman, W. Hong, T. C. Südhof and W. Han, Proc. Natl. Acad. Sci. U. S. A., 2015, 112, 9996–10001 CrossRef CAS PubMed.
- S. Dolai, L. Xie, D. Zhu, T. Liang, T. Qin, H. Xie, Y. Kang, E. R. Chapman and H. Y. Gaisano, Diabetes, 2016, 65, 1962–1976 CrossRef CAS PubMed.
- C. Huang, E. M. Walker, P. K. Dadi, R. Hu, Y. Xu, W. Zhang, T. Sanavia, J. Mun, J. Liu, G. G. Nair, H. Y. A. Tan, S. Wang, M. A. Magnuson, C. J. Stoeckert, M. Hebrok, M. Gannon, W. Han, R. Stein, D. A. Jacobson and G. Gu, Dev. Cell, 2018, 45, 347–361.e5 CrossRef CAS PubMed.
- D. M. Nathan, J. B. Buse, M. B. Davidson, E. Ferrannini, R. R. Holman, R. Sherwin and B. Zinman, Diabetologia, 2008, 52, 17 CrossRef PubMed.
- F. J. Pasquel, M. C. Lansang, K. Dhatariya and G. E. Umpierrez, Lancet Diabetes Endocrinol., 2021, 9, 174–188 CrossRef CAS PubMed.
- D. Gullo, A. M. Rabuazzo, M. Vetri, C. Gatta, C. Vinci, M. Buscema, R. Vigneri and F. Purrello, J. Endocrinol. Invest., 1991, 14, 287–291 CrossRef CAS PubMed.
- M. S. Remedi and C. G. Nichols, PLoS Med., 2008, 5, e206 CrossRef PubMed.
- K. Maedler, R. D. Carr, D. Bosco, R. A. Zuellig, T. Berney and M. Y. Donath, J. Clin. Endocrinol. Metab., 2005, 90, 501–506 CrossRef CAS PubMed.
- Z. Ling, Q. Wang, G. Stangé, P. In't Veld and D. Pipeleers, Diabetes, 2006, 55, 78–85 CrossRef CAS PubMed.
- W. Liu, T. Kin, S. Ho, C. Dorrell, S. R. Campbell, P. Luo and X. Chen, EBioMedicine, 2019, 50, 306–316 CrossRef CAS PubMed.
- R. K. P. Benninger and V. Kravets, Nat. Rev. Endocrinol., 2022, 18, 9–22 CrossRef CAS PubMed.
- J. S. E. Liu and M. Hebrok, Genes Dev., 2017, 31, 228–240 CAS.
- S. S. Roscioni, A. Migliorini, M. Gegg and H. Lickert, Nat. Rev. Endocrinol., 2016, 12, 695–709 CrossRef CAS PubMed.
- B. M. Maoz, A. Herland, E. A. FitzGerald, T. Grevesse, C. Vidoudez, A. R. Pacheco, S. P. Sheehy, T.-E. Park, S. Dauth, R. Mannix, N. Budnik, K. Shores, A. Cho, J. C. Nawroth, D. Segrè, B. Budnik, D. E. Ingber and K. K. Parker, Nat. Biotechnol., 2018, 36, 865–874 CrossRef CAS PubMed.
- M. G. Pedersen, R. Bertram and A. Sherman, Biophys. J., 2005, 89, 107–119 CrossRef CAS PubMed.
- S. Browne, E. L. Gill, P. Schultheiss, I. Goswami and K. E. Healy, Stem Cell Rep., 2021, 16, 2058–2075 CrossRef CAS PubMed.
- W. M. Reese, P. Burch, A. B. Korpusik, S. E. Liu, P. Loskill, P. B. Messersmith and K. E. Healy, Adv. Funct. Mater., 2020, 30, 2001274 CrossRef CAS.
Footnotes |
| † Electronic supplementary information (ESI) available. See DOI: https://doi.org/10.1039/d2lc00468b |
| ‡ Current address: Center for Organoid Systems and Tissue Engineering (COS), Technical University Munich (TUM), 85748 Garching, Institute for Diabetes and Organoid Technology (IDOT), Helmholtz Center Munich, Helmholtz Diabetes Center (HDC), Ingolstädter Landstraße 1, 85764 Neuherberg, 85748 Garching, Germany. |
| This journal is © The Royal Society of Chemistry 2022 |