
 Open Access Article
 This Open Access Article is licensed under a
 Creative Commons Attribution 3.0 Unported Licence
Surfactant-laden droplet size prediction in a flow-focusing microchannel: a data-driven approach†
Loïc
Chagot‡
 *a,
César
Quilodrán-Casas‡
*bc,
Maria
Kalli‡
*a,
Nina M.
Kovalchuk
e,
Mark J. H.
Simmons
e,
Omar K.
Matar
d,
Rossella
Arcucci
bc and
Panagiota
Angeli
a
*a,
César
Quilodrán-Casas‡
*bc,
Maria
Kalli‡
*a,
Nina M.
Kovalchuk
e,
Mark J. H.
Simmons
e,
Omar K.
Matar
d,
Rossella
Arcucci
bc and
Panagiota
Angeli
a
aThAMeS Multiphase, Department of Chemical Engineering, University College London, UK. E-mail: l.chagot@ucl.ac.uk; maria.kalli.14@ucl.ac.uk
bData Science Institute, Imperial College London, UK. E-mail: c.quilodran@imperial.ac.uk
cDepartment of Earth Science and Engineering, Imperial College London, UK
dDepartment of Chemical Engineering, Imperial College London, UK
eSchool of Chemical Engineering, University of Birmingham, UK
First published on 6th September 2022
Abstract
The control of droplet formation and size using microfluidic devices is a critical operation for both laboratory and industrial applications, e.g. in micro-dosage. Surfactants can be added to improve the stability and control the size of the droplets by modifying their interfacial properties. In this study, a large-scale data set of droplet size was obtained from high-speed imaging experiments conducted on a flow-focusing microchannel where aqueous surfactant-laden droplets were generated in silicone oil. Three types of surfactants were used including anionic, cationic and non-ionic at concentrations below and above the critical micelle concentration (CMC). To predict the final droplet size as a function of flow rates, surfactant type and concentration of surfactant, two data-driven models were built. Using a Bayesian regularised artificial neural network and XGBoost, these models were initially based on four inputs (flow rates of the two phases, interfacial tension at equilibrium and the normalised surfactant concentration). The mean absolute percentage errors (MAPE) show that data-driven models are more accurate (MAPE = 3.9%) compared to semi-empirical models (MAPE = 11.4%). To overcome experimental difficulties in acquiring accurate interfacial tension values under some conditions, both models were also trained with reduced inputs by removing the interfacial tension. The results show again a very good prediction of the droplet diameter. Finally, over 10![[thin space (1/6-em)]](https://www.rsc.org/images/entities/char_2009.gif) 000 synthetic data were generated, based on the initial data set, with a Variational Autoencoder (VAE). The high-fidelity of the extended synthetic data set highlights that this method can be a quick and low-cost alternative to study microdroplet formation in future lab on a chip applications, where experimental data may not be readily available.
000 synthetic data were generated, based on the initial data set, with a Variational Autoencoder (VAE). The high-fidelity of the extended synthetic data set highlights that this method can be a quick and low-cost alternative to study microdroplet formation in future lab on a chip applications, where experimental data may not be readily available.
1 Introduction
The control of droplet formation and size using microfluidic devices is a major challenge for both laboratory and industrial applications (e.g. emulsification, encapsulation, ink-jet printing). Over the last few decades, numerous works have been done to produce droplets with a high-degree of monodispersity.1–4 Surfactants are often used to modify the interfacial properties of droplets and improve their stability.5–8 For example, Lawrence and Rees9 identified micro-emulsion-based formulations which are key to a better drug delivery process with an ability to control drug release and increase drug solubility.Nowadays, improvements in imaging techniques and in microfluidic devices enable collection of high-quality data to estimate the droplet parameters for various configurations.10–12 Roumpea et al.13 used a two-colourParticle Image Velocimetry setup to study the effect of surfactants during droplet formation in a flow-focusing microchannel. Recently, Kiratzis et al.14 studied the effect of surfactant addition in the aqueous dispersed phase during droplet generation using Ghost Particle Velocimetry (GPV). Such studies enable better understanding of surfactant transfer and adsorption. Usage of high-speed cameras with improved spatial and time resolution led to large data collections and development of semi-empiricalmodels. These models are based on physical parameters (e.g. capillary number, flow rates, channel size) and provide new data that can be used as droplet predictors (droplet size, formation time).15–17 Furthermore, improvements in algorithms and computational capacity now enable numerical simulations of drop formation inside microchannels in complex configurations. Kahouadji et al.18 presented a very accurate prediction of surfactant-free droplet formation in complex microchannel geometries using a front-tracking scheme. Using Lattice Boltzmann simulations, Riaud et al.19 studied the formation of water droplets inside octane with Span 80 and showed the non-uniformity of the interfacial distribution of surfactant.
This ease of accessing good experimental and/or numerical data coincides with the emergence of data-driven models for microfluidics. Mahdi and Daoud20 used artificial neural networks to predict the droplet size of a water-in-oil micro-emulsion. Khor et al.21 used the same method to predict the emulsion stability inside a microchannel. Deep neural networks were used to predict the flow rate or the concentration of isopropanol for different formation patterns of water–isopropanol droplets in silicone oil.22 Recently, machine learning was used to predict the performance of flow-focusing droplet generators.23
Whilst the aforementioned papers had access to a large data set of experimental data, it is crucial to perform data augmentation for small experimental data sets. The generation of high-quality synthetic data allows the augmentation of small-sample data sets,24,25 such as in healthcare to generate high-fidelity synthetic patient data.26 Though the use of synthetic data needs to be carefully developed and adapted for each case,27 it can be a powerful tool to increase the robustness and adaptability of data-driven models.28,29
This paper presents both physics-based and data-driven approaches to predict droplet size inside a flow-focusing microchannel in the presence of surfactants. A data set of 476 measurements was collected for different phase flow rates, surfactant types, including anionic, cationic, and non-ionic at several concentrations below and above the critical micelle concentration (CMC). An adaptation of the recent model of Kalli et al.17 was used as a benchmark, considering that this type of empirical models remains the principal approach for droplet size prediction in microfluidic configurations. For the first time, two predictive models for the surfactant-laden droplet size were built using a Bayesian regularised artificial neural network (BRANN) and the XGBoost regression. Additionally, a Variational Autoencoder (VAE) was used to generate synthetic data to enlarge the experimental data set, to access an unexplored part of the parameter space, and to decrease the uncertainty on the droplet size estimation. Finally, to quantify the effect of the data set on the final uncertainty of the prediction, a convergence analysis was performed. This aims to highlight the sensitivity on data of this type of prediction model and will help optimise further studies related to machine learning and microfluidics.
2 Materials and methods
In order to build large-scale sets of high quality data, experiments were conducted in parallel at laboratories in University College London (UCL) and the University of Birmingham (UoB). All experiments were focused on the dripping regime where the formed drops have spherical shape.30 This regime is very important for short time scale (high flow rate) applications, such as drug delivery, drop encapsulation or emulsification. The transition to drops with pancake shape5 was avoided to eliminate the effects of the channel walls. Machine learning models have been developed for both data augmentation, i.e. to generate realistic synthetic data and predict the diameter of the droplets.2.1 Droplet generation and data acquisition
The experiments were performed in an oval cross-section flow-focusing microchannel made with glass from Dolomite Microfluidics, which has already been used in previous works.5,13,17 At the cross-junction the inlet dimensions are equal to 195 μm × 190 μm (width × depth) and the dimensions of the wide channels are equal to 390 μm × 190 μm (width × depth). The continuous phase was introduced via the side channels and then the aqueous phase was introduced via the central channel of the junction (see Fig. 1a). For all configurations, silicone oil (density: ρc = 920 kg m−3, viscosity μc = 4.6 mPa s at 20 °C) was used as the continuous phase. To match the refractive index of the continuous phase and avoid optical distortions, a mixture of 52% w/w glycerol and 48% w/w water (density: ρd = 1132 kg m−3, viscosity μd = 6.8 mPa s at 20 °C) without and withsurfactant was selected as the dispersed phase. Syringe pumps were used to precisely deliver both dispersed and continuous phases at flow rates (Qd and Qc) respectively: KDS Scientific for UCL (±5 × 10⁻⁹ mL min−1) and World Precision Instruments for UoB (±1.7 × 10⁻⁸ mL min−1). | ||
| Fig. 1 a) Sketch of the microchannel during dripping regime. b) Sketch of the optical setup. | ||
63 measurements at different flow rates were obtained without surfactant. To observe the impact of surfactant composition on the droplet diameter, 5 different surfactants were dissolved in the aqueous phase which can be categorised into three groups: anionic, cationic, and non-ionic surfactants (see Table 1). A total of 468 different measurements (392 with surfactant) at various flow rates (Qc ∈ [0.012, 0.4] and Qd ∈ [0.001, 0.10]) and 34 different concentrations below the CMC and 43 above the CMC were obtained. As mentioned previously, this study focuses on spherical droplets, and all droplet diameters d are below the channel depth D (d < 195 μm). The full list of experimental parameters used in this paper is available in Zenodo open data file.
| Name | Type | ϕ CMC | ϕ/ϕCMC | M w | Q d | Q c | γ | Number of data |
|---|---|---|---|---|---|---|---|---|
| mM | — | g mol−1 | mL min−1 | mL min−1 | mN m−1 | — | ||
| ϕ is the surfactant concentration; ϕCMC, the critical micelle concentration; Mw, the molar mass; Qd and Qc the dispersed and continuous flow rates; γ, the equilibrium interfacial tension. Full name of the surfactants: sodium bis(2,6-dimethyl-4-heptyl)-2-sulfoglutarate (di-BC9SG), sodium dodecylsulfate (SDS), dodecyltrimethylammonium bromide (C12TAB), hexadecyltrimethylammonium bromide (C16TAB) and Triton X-100 (TX100). | ||||||||
| di-BC9SG | Anionic surfactant | 4.3 | [1.0…50.0] | 486.00 | [0.003…0.04] | [0.012…0.2] | [1.4…4.2] | 16 |
| SDS | Anionic surfactant | 11.0 | [0.2…5.0] | 288.38 | [0.003…0.06] | [0.040…0.4] | [10.0…18.0] | 178 |
| C12TAB | Cationic surfactant | 20.0 | [0.3…7.5] | 308.34 | [0.001…0.06] | [0.040…0.4] | [10.0…20.0] | 94 |
| C16TAB | Cationic surfactant | 2.0 | [0.2…2.5] | 364.45 | [0.001…0.04] | [0.040…0.2] | [7.3…20.0] | 30 |
| TX100 | Non-ionic surfactant | 3.5 | [1.0…8.6] | 646.85 | [0.010…0.02] | [0.040…0.4] | [2.8…8.7] | 87 |
| No surfactant | — | — | 0 | — | [0.001…0.10] | [0.080…0.4] | 32 | 63 |
All images were taken with a 12-bit high-speed camera (Phantom v1212 with a 1280 × 800 pixel resolution (UCL) and Photron SA5 with 1024 × 1024 pixels resolution (UoB)) both equipped with a Nivatar 12× zoom lens. A backlight system using LED ensured a homogeneous illumination of the main channel (see. Fig. 1b) and did not affect the properties of the fluid by minimising its heating. Due to the oval geometry of the channel, it is possible to accurately position the focal plan at the centreline of the channel where the sharpest image of the channel walls is obtained by the optical system. The measurement of the droplet size was directly performed on the 2D images using ImageJ and MATLAB (see ESI†). A minimum of 15 droplets was used to calculate the average size for each case with a droplet size polydispersity of <3%. According to Christopher and Anna,31 this is considered extremely accurate for microfluidic experiments. The spatial error is 3 μm per pixel (2.5% of the smallest drop diameter).
2.2 Modelling with machine learning
Recent advances in machine learning have shown strong predictive power that can determine complex correlations and find patterns between inputs and outputs.32 In this work two different machine learning approaches were used to predict the diameter of the droplets generated in the flow-focusing microchannel (see Fig. 1) obtained at different flow rates, surfactant type and surfactant concentration. In order to prevent overfitting, the experimental measurements were randomised and split into two distinct data sets: a training data set of 392 configurations used to train the machine learning models and a test data set of 76 configurations used to quantify the accuracy of the prediction. Different randomisations were tried and showed very similar results.Two predictive models were developed to use different numbers of features to predict the droplet size. The data ![[x with combining circumflex]](https://www.rsc.org/images/entities/b_char_0078_0302.gif) can then be split into predictive features predictors and the target diameter.Two regressors were trained to predict the droplet diameter size diameter, where f is a Bayesian regularised neural network or a XGBoost regressor. The predictions are then compared to the holdout test data set from real experimental data.
can then be split into predictive features predictors and the target diameter.Two regressors were trained to predict the droplet diameter size diameter, where f is a Bayesian regularised neural network or a XGBoost regressor. The predictions are then compared to the holdout test data set from real experimental data.
| F = βED + αEW, | (1) |
 | (2) |
Finally, another advantage of BRANN is that the model is robust and a validation process such as back propagation is unnecessary,37 which can save data for the training and test processes.
The simulation of the neural network model was performed on the MATLAB Statistics and Machine Learning Toolbox.
The objective function is the sum of loss function, which is evaluated across all predictions with a regularisation function for all j predictors. The prediction of the jth tree is defined as:
 | (3) |
For regression problems, like our case, XGBoost uses the mean squared error (MSE) as a performance metric. The XGBoost regressor was implemented in Python using the xgboost package.
Let ![[scr Q, script letter Q]](https://www.rsc.org/images/entities/char_e530.gif) and
and ![[scr P, script letter P]](https://www.rsc.org/images/entities/char_e52f.gif) be the encoder and decoder, respectively. Moreover, let q(z|x) and p(
be the encoder and decoder, respectively. Moreover, let q(z|x) and p(![[x with combining tilde]](https://www.rsc.org/images/entities/b_char_0078_0303.gif) |z) be the encoding and decoding distributions, respectively. Here, x is the vector of experimental data. As suggested by Makhzani et al.,41 a Gaussian posterior can be used assuming that q(z|x) is a Gaussian distribution, where its mean and variance are predicted by the encoder : z ∼
|z) be the encoding and decoding distributions, respectively. Here, x is the vector of experimental data. As suggested by Makhzani et al.,41 a Gaussian posterior can be used assuming that q(z|x) is a Gaussian distribution, where its mean and variance are predicted by the encoder : z ∼ ![[scr N, script letter N]](https://www.rsc.org/images/entities/char_e52d.gif) (μ(x), σ(x)). This is achieved by adding two dense layers of means μ and logσ to the final layer of the encoder , and return z as a vector of samples. To ensure that z ∼ q(z) = (μ, σ2), the aggregated posterior, the reparameterisation trick described by Kingma and Welling40 was used for backpropagation through the network z = μ + σ⊙ε, where ε is an auxiliary noise variable ε ∼ (0, I).
(μ(x), σ(x)). This is achieved by adding two dense layers of means μ and logσ to the final layer of the encoder , and return z as a vector of samples. To ensure that z ∼ q(z) = (μ, σ2), the aggregated posterior, the reparameterisation trick described by Kingma and Welling40 was used for backpropagation through the network z = μ + σ⊙ε, where ε is an auxiliary noise variable ε ∼ (0, I).
The minimisation of the Kullback–Leibler Divergence Score (KL) loss (![[script L]](https://www.rsc.org/images/entities/char_e144.gif) KL) quantifies how much the probability distribution a(x) differs from the probability distribution b(x) as:
KL) quantifies how much the probability distribution a(x) differs from the probability distribution b(x) as:
 | (4) |
(0, I), the arbitrary prior. The Nesterov Adam (Nadam) is used as the optimizer.42 The total loss θ is then defined as θ = KL + mse where the reconstruction error mse is the mean squared error defined as:| mse = argmin‖ − x‖2 | (5) |
is the reconstructed input of experimental data, defined as = ((x)) and the synthetic data generated by the VAE is then defined as , = (z), z ∼ (0, I), where I is the identity matrix defined by the number of inputs. The logarithms of the inputs were used and scaled between 0 and 1, to account for physical inaccuracies, i.e. none of the experimental features can be negative. The implementation of the VAE is in Python using tensorflow with the keras wrapper.
2.3 Statistical comparison with existing models
Many studies have used physics-based methods to find correlations for droplets in microfluidic devices, especially for T-junctions. In this case, to determine the droplet size, the models are mainly based on the dynamics of the break-up of the interface which is affected by the ratio Qd/Qc.43–45Xu et al.15 studied squeezing and dripping regimes in a T-junction and argued that the equilibrium between the shear forces from the continuous flow and the inertial force plays an important role in the drop formation process. The authors assume that the droplet size should be predicted by the generic equation:
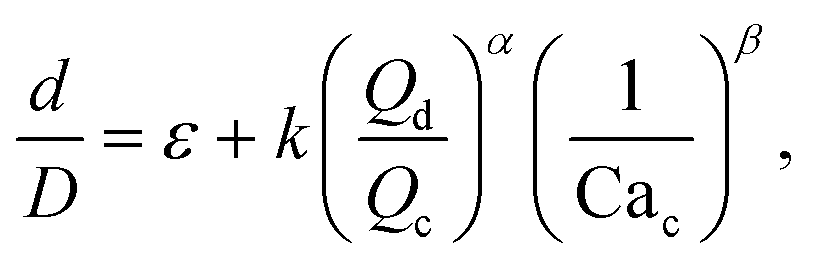 | (6) |
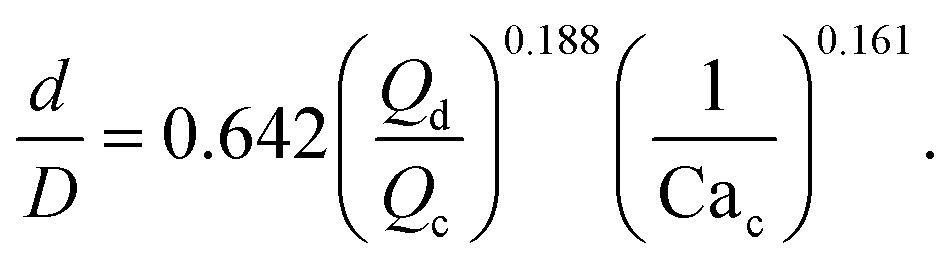 | (7) |
Using the same flow-focusing microchannel, eqn (7) was applied to the present data-sets. Fig. 2 compares the experimental test data with those calculated from the model using eqn (7), showing a mean absolute percentage error (or MAPE) of 11.4%. The MAPE is defined by:
 | (8) |
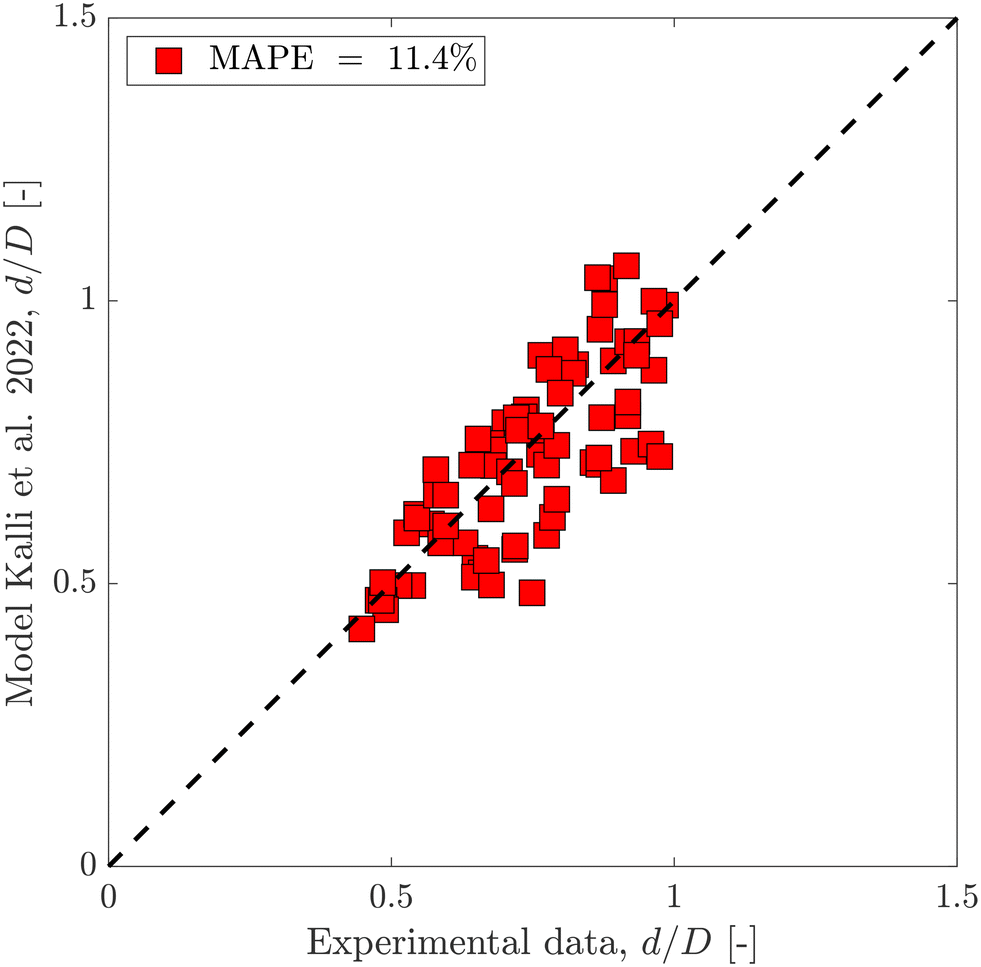 | ||
| Fig. 2 Predicted dimensionless droplet diameter using the semi-empirical equation eqn (7) compared to the experimental test data set. | ||
3 Results
3.1 Droplet size prediction
 | (9) |
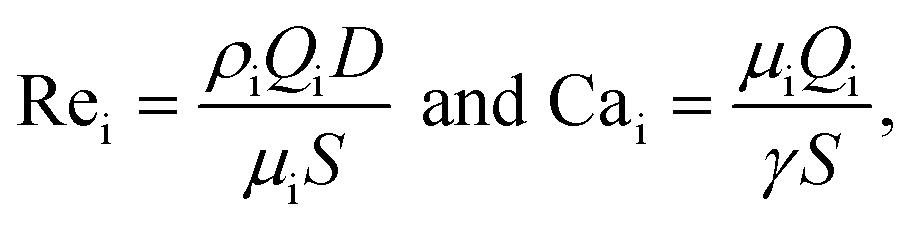
As the role of surfactants is central to the present study, the ratio ϕ/ϕCMC is used for their comparison, where ϕ is the surfactant concentration and ϕCMC is the critical micelle concentration. This is used in the data-driven model to improve the droplet size prediction. However, as described in section 2, all experiments were performed in the same channel with the same phases. As a result, the variation of the Reynolds numbers depends only on the flow rates while that of the capillary numbers on the flow rates and interfacial tension: Rei(ρi, μi, S, D, Qi) ≡ Rei(Qi) and Cai(μi, S, γ, Qi) ≡ Cai(γ, Qi). Finally, the model can be trained with the 4 following inputs: Qd, Qc, γ and ϕ/ϕCMC.
Fig. 3 shows dimensionless droplet diameter predictions with both BRANN and XGBoost trained using the test data set with these 4 inputs. To get robust predictions, both models were run 50 times and averaged. The standard errors are low (max(errors) < 1.6%) which highlights the excellent repeatability of the models. The MAPEs for the test data set are 3.9% for both data-driven models which highlight the good selection of the 4 inputs. Moreover, this result showsthe superior prediction of the dimensionless droplet diameter d/D by both BRANN and XGBoost to that of the semi-empirical model (with associated MAPE = 11.4%, as shown in Fig. 2).
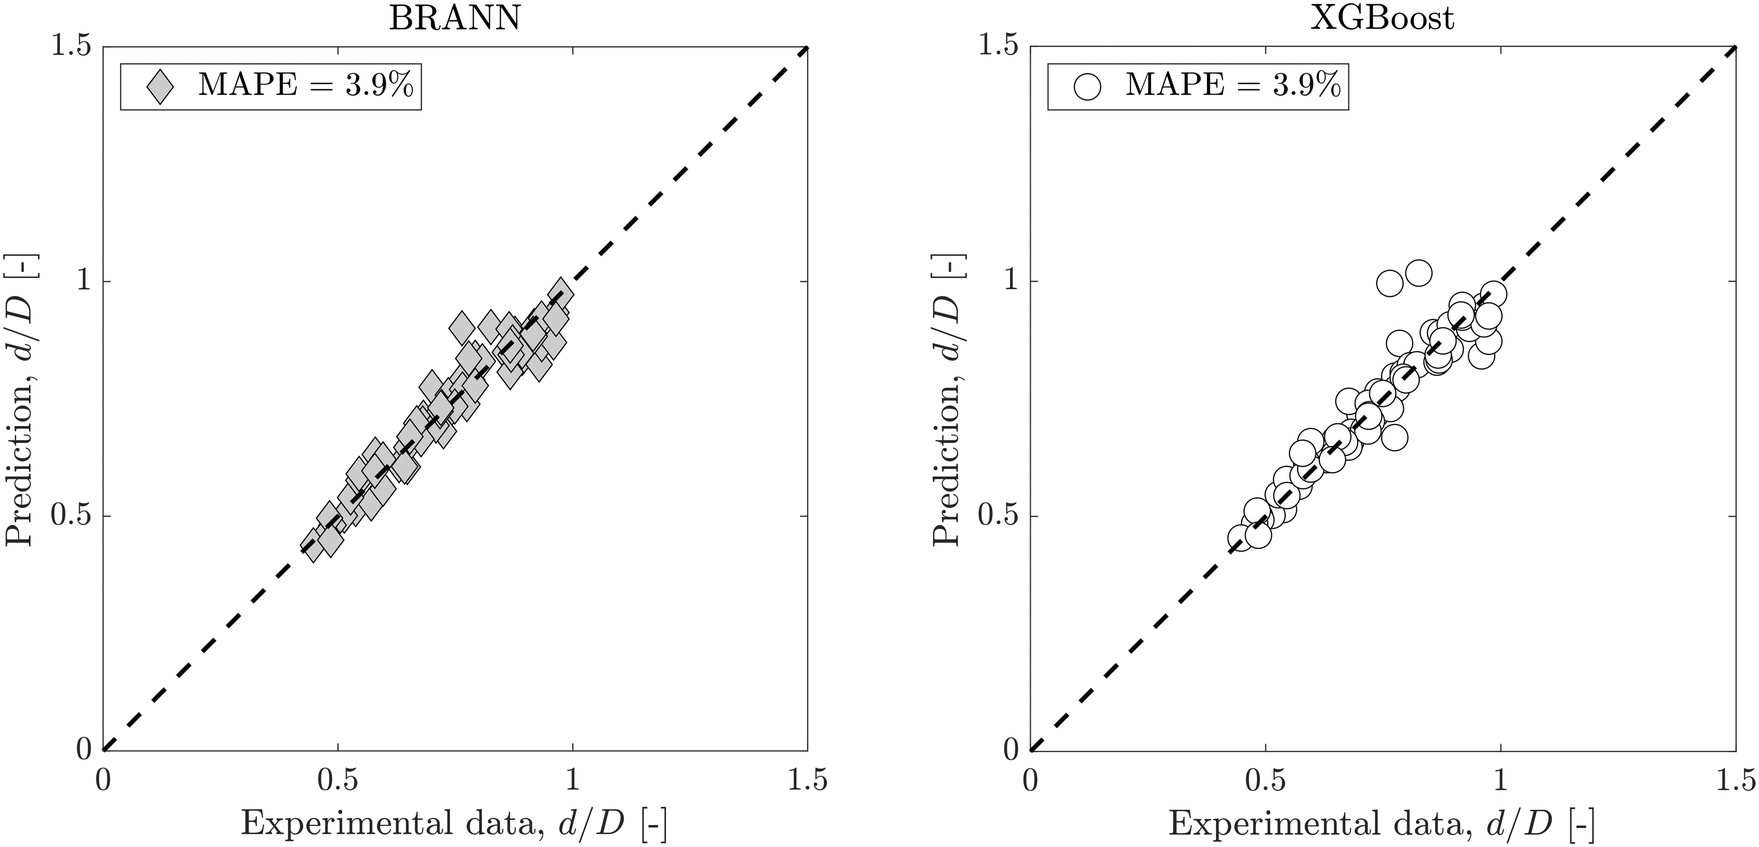 | ||
| Fig. 3 Predicted dimensionless droplet diameter using 4 inputs (Qc, Qd, γ, ϕ/ϕCMC) compared to the experimental test data set; (left) dimensionless droplet diameter prediction using BRANN, and (right) dimensionless droplet diameter prediction using XGBoost. | ||
As proposed by the Garson equation, the neural network weight matrix can be used to determine the relative importance of inputs20,46,47 using the following equation:
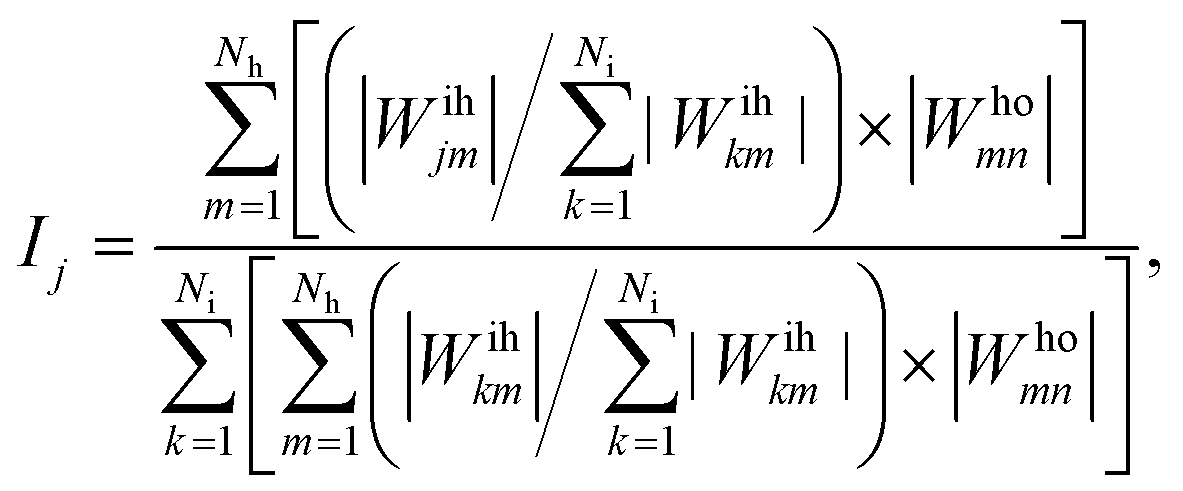 | (10) |
Fig. 4 shows a diagram of the relative importance of each input variable for both models. For the BRANN and the XGBoost, the flow rate of the continuous phase Qc has the most important effect on the dimensionless droplet size prediction at respectively 55.2% and 32.1%. This result confirms the strong impact of Qc on the droplet formation, already highlighted by the semi-empirical eqn (6), directly through the term Qc and indirectly through Cac(μc, S, γ, Qc). The flow rate of the dispersed phase Qd (BRANN: 18.8%, XGBoost: 17.7%) and the ratio ϕ/ϕCMC (BRANN: 17.3%, XGBoost: 29.2%) have a lower contribution but still a significant impact on this model. Although, the relative importance of the interfacial tension γ, is still significant for the XGBoost (21.0%), it become less crucial for the BRANN prediction (8.6%).
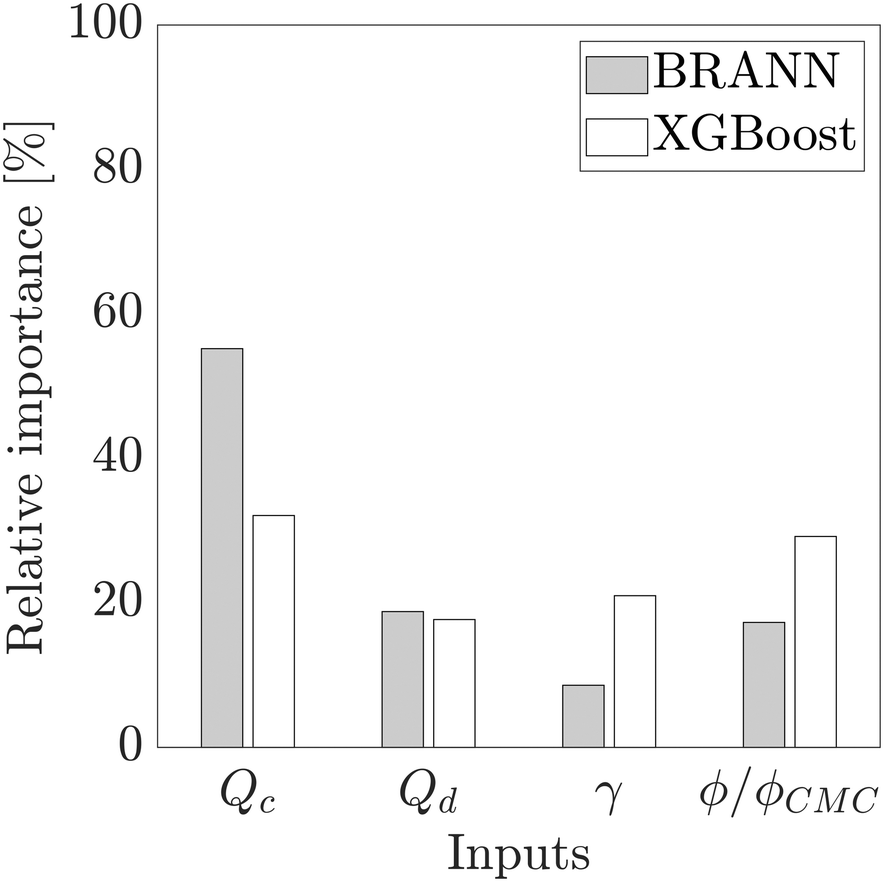 | ||
| Fig. 4 The relative importance (%) of neural network inputs (Qc, Qd, γ, ϕ/ϕCMC) on the output (d/D) of both the neural networks, BRANN (grey) and XGBoost (white). | ||
Fig. 5 shows the dimensionless droplet diameter predictions on the test data set for both BRANN and XGBoost trained with only 3 of the inputs: Qc, Qd and ϕ/ϕCMC. Although there is a small increase of the MAPE (6.4% for the BRANN and 5.2% for the XGBoost), these errors are smaller than the semi-empirical model eqn (7). This result highlights the accuracy of the data-driven models, especially when compared with the reference semi-empirical models, even with reduced inputs. However, for this case, XGBoost shows a significantly lower uncertainty than BRANN and demonstrates its usefulness when reduced inputs need to be used (e.g. inaccessibility of experimental data).
 | ||
| Fig. 5 Predicted dimensionless droplet diameter using 3 inputs (Qc, Qd, ϕ/ϕCMC) compared to the experimental test data set; (left) dimensionless droplet diameter prediction using BRANN, and (right) dimensionless droplet diameter prediction using XGBoost. | ||
These reduced input models with a low uncertainty can be key to predicting accurately the droplet size for low-cost or rapid measurements, with a limited number of parameters available.
3.2 Generation of a synthetic data set
Based on the full training data set, high-fidelity synthetic data were generated using VAE (see section 2.2.3). This technique enables experimental data sets, which can be costly and time-consuming to acquire, to be enlarged easily.
Fig. 6a, shows an example of the classic flow pattern map for the dripping regime, often used in droplet generation works with different microfluidic configurations. The colourmap corresponds to the droplet diameter. As the experimental measurement acquisition is a long process, the same flow rates were often used for the experiments with different surfactants and surfactant concentrations to enable comparison, resulting in an overlap of the experimental points and a large undefined zone in the parameter space. Fig. 6b, shows 10000 synthetic data generated in a random grid with all inputs (Qc, Qd, γ and ϕ/ϕCMC). In addition, the synthetic flow pattern map follows the exact shape of the real flow pattern map, while giving access to new information in the entire map and overcomes any experimental overlapping. Moreover, the synthetic data give access to a clear distribution of the droplet size in the flow pattern map. The excellent quality of these synthetic data can also be observed through Fig. 7. This figure shows the kernel density estimator (KDE) for the distributions of experimental against synthetic data for the four inputs and for the droplet diameter. For all cases, the synthetic data distribution is very similar to the experimental one which highlights the good mimicking capability of machine learning methods. Moreover, for 4 features, the KL divergence is 0.29, 0.62, 0.47, 1.49, and 0.04 for Qc, Qd, γ, ϕ/ϕCMC, and d/D, respectively.
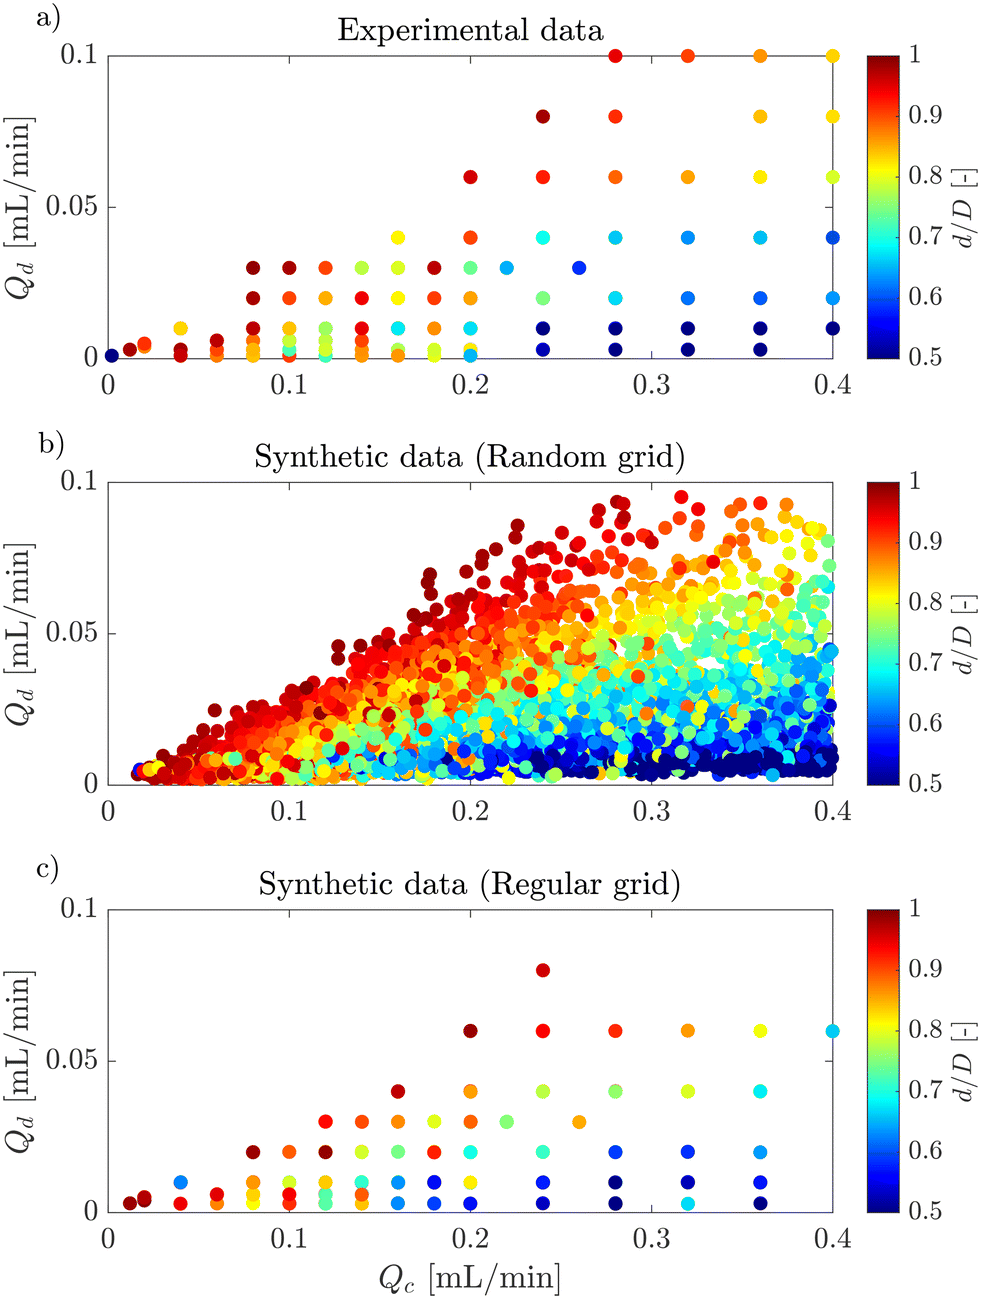 | ||
| Fig. 6 Flow pattern map of the dripping regime for: a) experimental data, b) 10000 random synthetic data, c) 10000 regular synthetic data. | ||
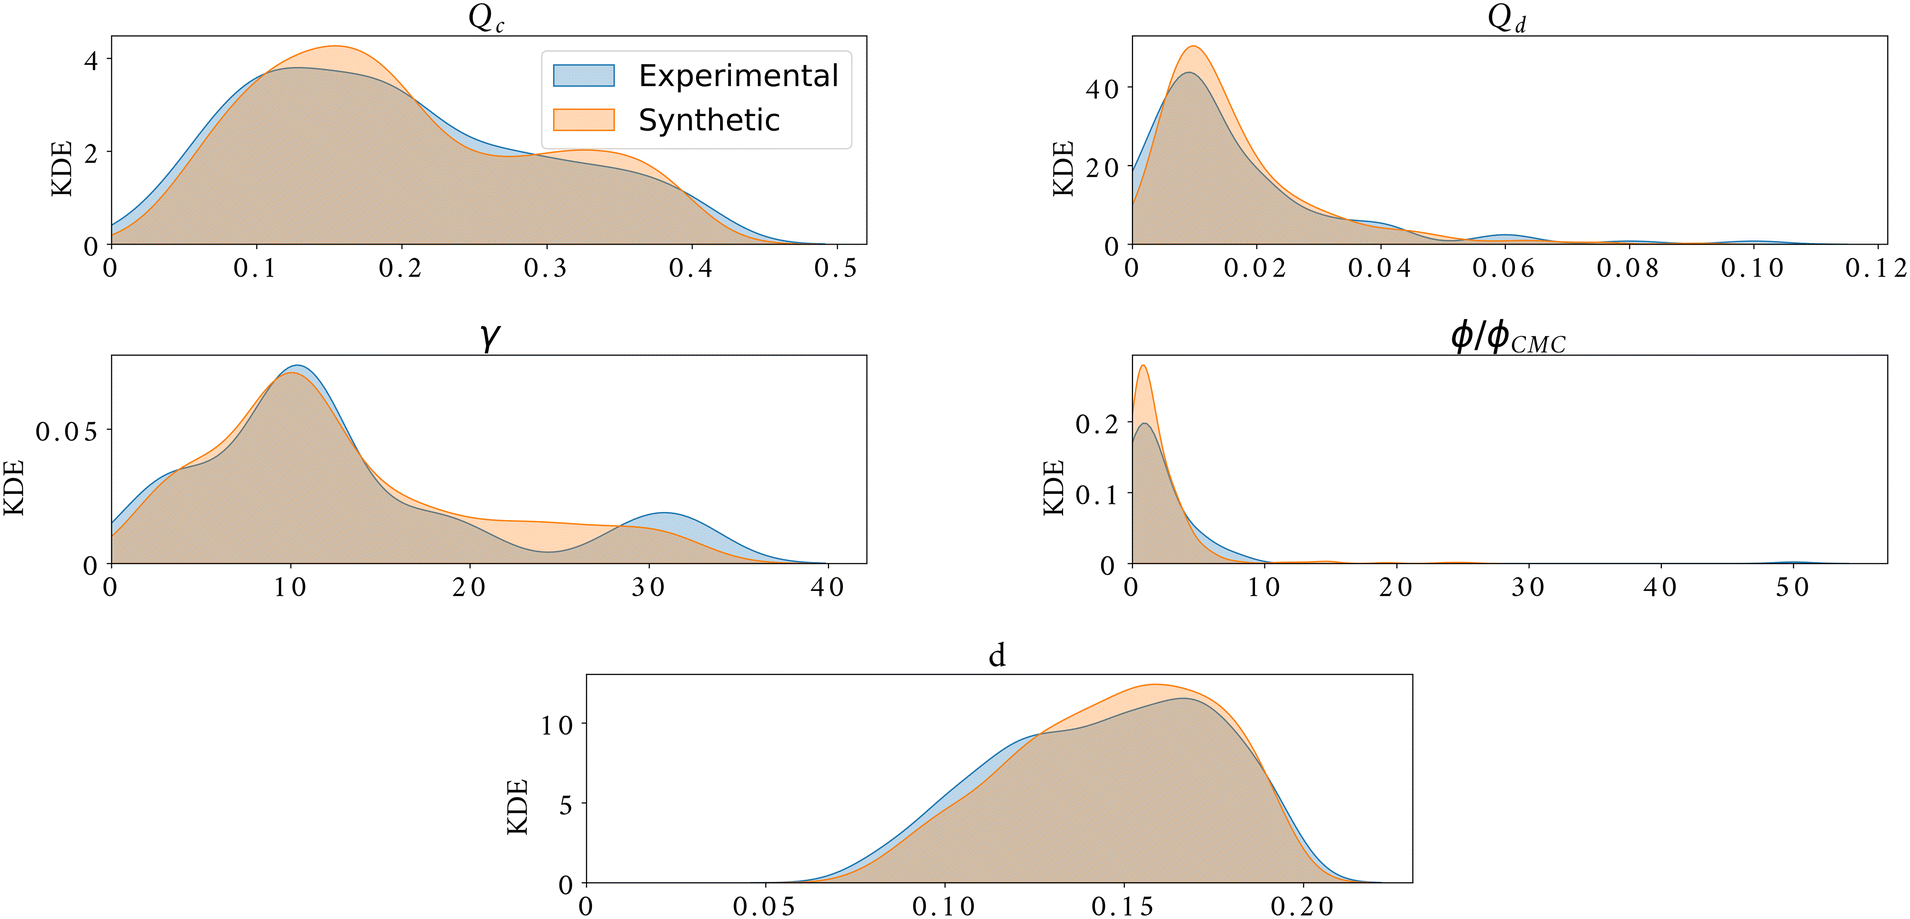 | ||
| Fig. 7 Kernel density estimator of experimental data (shaded blue) against synthetic data (shaded orange) for the generation of 4 features plus droplet diameter size. | ||
To challenge the synthetic data, they were used to train the BRANN and XGBoost models and predict the droplet size d/D of the test data set. Fig. 8a shows the MAPE of the test data set using different amounts of synthetic data between 10 and 10000. To be more robust, the figure shows the average of the MAPE for 50 different runs per point, where error bars of the standard error are smaller than the markers. When the BRANN model is trained with a small synthetic data set (<100), the MAPE is bigger than the semi-empirical model of eqn (7) (MAPE = 11.4%). However, both models converge respectively to a MAPE of 7.3% (BRANN) and 6.1% (XGBoost) after being trained with 250 synthetic data. To highlight the effect of the randomness of the data set on the droplet size prediction, 10000 new synthetic data following a regular grid in Qc and Qd were built to mimic classic experimental investigations (see Fig. 6c). Fig. 8b shows the MAPE of the test data set using different number of synthetic data with this new grid. Once again, for both models, the MAPE converge after 250 synthetic data. However, the droplet size prediction is more accurate with a regular grid than with a random grid (MAPE = 6.4% for BRANN and MAPE = 5.5% for XGBoost). These results define the minimum size of the training data set needed and provide a direction for future experimental studies. Coupled with design of experiment methods49 the synthetic data could be an excellent tool for elaborating strategies to sample complex experimental data sets.
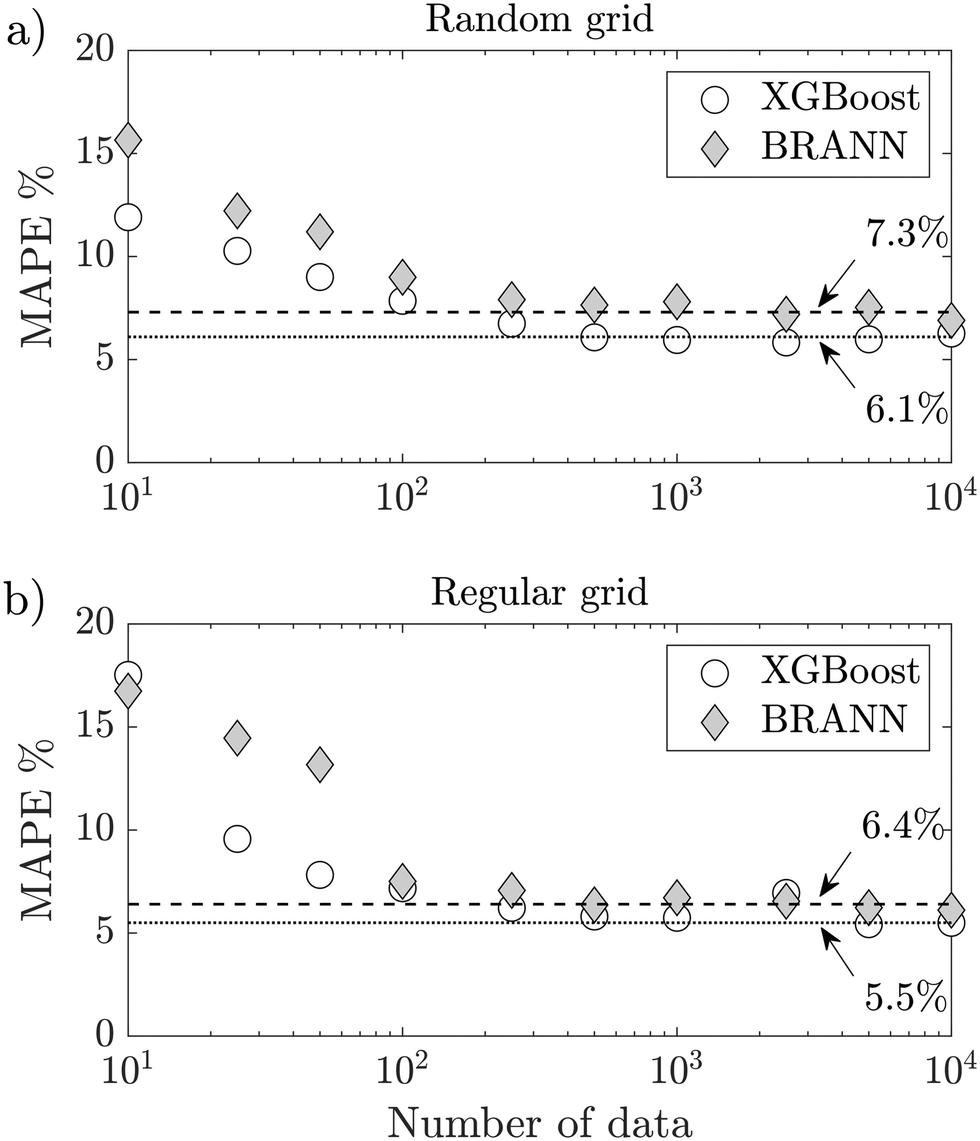 | ||
| Fig. 8 Evolution of the MAPE of the test data set with the number of synthetic data for both BRANN and XGBoost: a) using a random grid, b) using a regular grid. | ||
Estimations using the real data even with only 3 inputs are closer to the experiments compared to the empirical model. The MAPEs of all models are summarised in Table 2. The mean absolute percentage error (MAPE) of the test data set was calculated for BRANN and XGBoost, and compared with the semi-empirical prediction (MAPE = 11.4%). Using Qd, Qc, γ and ϕ/ϕCMC as inputs, both models give an excellent prediction of the dimensionless droplet diameter d/D (MAPE = 3.9%) and show a great potential in linking machine learning with microfluidics to improve current predictive capabilities. Although the MAPEs are higher for the synthetic data than for the real data, the results are still more accurate than those obtained by using the semi-empirical model to predict the dimensionless droplet diameter. Therefore, this approach provides a quick and low-cost alternative to study droplet generation in a specific region of the flow pattern map with an acceptable uncertainty.
3.3 Validation of synthetic data in the laboratory
In order to further validate the synthetic data against laboratory experiments, 10 new experiments were performed using surfactant free and surfactant-laden solutions. For the former, the absolute errors between synthetic and observed droplet diameter sizes range from 2.2% to 5.7%, while for the latter the range was 0.9% to 5.9% using C12TAB surfactant and 3.8% to 7.0% using TX100 surfactant. This shows good agreement with the synthetic data. For example, Lashkaripour et al.23 reports absolute errors of ∼1.6% to 10% between predicted and observed droplet diameter size after replicating surfactant free experiments in the laboratory.4 Summary, discussion and future work
Based on high-speed imaging measurements of surfactant-laden droplets generated in a flow-focusing microchannel, a large drop size data set was produced. To predict the dimensionless droplet diameter for various flow rates, surfactant type and surfactant concentration, two data-driven models (BRANN and XGBoost) were used and compared to a recent semi-empirical model (Table 3).17| Name | Hyperparameters |
|---|---|
| XGBoost | Number of estimators: 100 |
| Maximum depth: 3 | |
| Learning rate: 0.3 | |
| Random state: 42 |
| Name | Hyperparameters |
|---|---|
| BRANN | Number of hidden layers: 1 |
| Number of hidden nodes: 8 | |
| Optimisation: Bayesian regularisation | |
| Activation hidden layer: sigmoid | |
| Activation output layer: linear |
The mean absolute percentage error (MAPE) of the test data set was calculated for BRANN and XGBoost, and compared with the semi-empirical prediction. Using Qd, Qc, γ and ϕ/ϕCMC as inputs, both models give an excellent prediction of the dimensionless droplet diameter d/D and show a great potential in linking machine learning with microfluidics to improve current predictive capabilities. Moreover, as the experimental estimation of the interfacial tension can be subject to discussion48 and hard to collect for dynamic and fast processes, the models were also trained with reduced number of inputs (Qd, Qc, and ϕ/ϕCMC). The results show that even if the MAPE increases slightly, the estimation of d/D is still more accurate with machine learning techniques than with semi-empirical methods. However, in this case, XGBoost gives a better prediction than BRANN. Finally, as experimental data sets can be costly and time-consuming to enlarge them, asynthetic data set of 10000 new experiments was built using VAE with all available inputs. Training the BRANN and XGBoost models with this synthetic data set, the MAPEs still outperform the semi-empirical model (Table 4).
| Name network | Hyperparameters |
|---|---|
| 3Predictors | Number of features: 4 |
| Encoder | |
| Number of hidden nodes (layer 1): 512 | |
| Activation hidden layer 1: LeakyReLU | |
| Number of hidden nodes (layer 2): 512 | |
| Activation hidden layer 2: LeakyReLU | |
| Number of nodes latent layer: 4 | |
| Decoder | |
| Number of hidden nodes (layer 1): 512 | |
| Activation hidden layer 1: LeakyReLU | |
| Number of hidden nodes (layer 2): 512 | |
| Activation hidden layer 2: LeakyReLU | |
| Number of nodes output layer: 4 | |
| Activation output layer: sigmoid | |
| 4Predictors | Number of features: 5 |
| Encoder | |
| Number of hidden nodes (layer 1): 512 | |
| Activation hidden layer 1: LeakyReLU | |
| Number of hidden nodes (layer 2): 512 | |
| Activation hidden layer 2: LeakyReLU | |
| Number of nodes latent layer: 5 | |
| Decoder | |
| Number of hidden nodes (layer 1): 512 | |
| Activation hidden layer 1: LeakyReLU | |
| Number of hidden nodes (layer 2): 512 | |
| Activation hidden layer 2: LeakyReLU | |
| Number of nodes output layer: 5 | |
| Activation output layer: sigmoid | |
| Further hyperparameters | |
| Optimiser: Nadam | |
| Dropout of 0.5 between layers | |
| Epochs: 2000 | |
| Batch size: 512 | |
| Random state: 42 |
The real interest on synthetic data lies on gaining access to a part of the parameter space with a low uncertainty, where data is not available due to experimental difficulties. Experimental data often follow a discrete distribution and the synthetic data can transform this into a continuous distribution. In this way, the previous results can be seen as a tool to help experimentalists design their next experiments. For example, it can be an excellent strategy to improve the filling of flow pattern maps extensively used in microfluidics but extremely time-consuming to acquire. Future work includes the exploration of other generative networks like generative adversarial networks,50 diffusion models,51 or normalising flows.52 The latter could be of interest as they do not require a compression of the input data size via a bottleneck layer, but they rather work in the same input space which is advantageous if the number of features to generate synthetic data from is small.
Finally, while the purpose of this paper is to highlight the potential of data-driven models in predicting the droplet behaviour for a wide range of surfactants and surfactant concentrations, it remains focused on a specific regime and for the same fluid phases. Apart from dripping, however, other regimes of droplet generation (e.g. squeezing, jetting, tip-streaming) have been reported and have been extensively studied both experimentally and numerically in previous works.5,13,18,48,53 In addition, Kiratzis et al.14 showed the importance of the phase viscosity ratio on the drop formation process. This work aims to unravel the unexplored capabilities of data-driven-models for droplet microfluidics. The methodologies developed here can be extend to different regimes, fluid viscosity ratios or channel geometries, which will be the focus of our future work for building generalised models for droplet size prediction in microfluidic channels.
Appendix
A Predictive models
B Variational autoencoder architecture
Data and code availability
The code is available in https://github.com/c-quilo/premiereDroplets. The data are available in Zenodo: https://zenodo.org/record/7055018#.Yxh40LTMKUk.Author contributions
Loïc Chagot: conceptualization, methodology, software, writing – original draft preparation/reviewing and editing, visualization, investigation, project administration, formal analysis. César Quilodrán-Casas: methodology, software, data curation, writing – original draft preparation/reviewing and editing visualization, formal analysis. Maria Kalli: data curation, conceptualization, investigation, validation, software, writing – original draft preparation/reviewing and editing, visualization. Nina M. Kovalchuk: data curation, investigation, validation, writing – reviewing and editing. Mark J. H. Simmons: writing –reviewing and editing, supervision, funding acquisition, resources. Omar K. Matar: supervision, funding acquisition, writing – reviewing and editing. Rossella Arcucci: supervision, resources, writing – reviewing and editing. Panagiota Angeli: supervision, writing – reviewing and editing, funding acquisition, resources, conceptualization.Conflicts of interest
There are no conflicts to declare.Acknowledgements
The authors would like to acknowledge support from the UK Engineering and Physical Sciences Research Council (EPSRC) Programme Grant PREMIERE (EP/T000414/1) and by the EPSRC grant EP/T003189/1 Health assessment across biological length scales for personal pollution exposure and its mitigation (INHALE). M Kalli would also like to acknowledge the EPSRC Doctoral Training Programme (EP/R513143/1) for her studentship.Notes and references
- J. G. Kralj, H. R. Sahoo and K. F. Jensen, Integrated continuous microfluidic liquid–liquid extraction, Lab Chip, 2007, 7, 256–263 RSC.
- L. Yang, N. Kapur, Y. Wang, F. Fiesser, F. Bierbrauer, M. C. Wilson, T. Sabey and C. D. Bain, Drop-on-demand satellite-free drop formation for precision fluid delivery, Chem. Eng. Sci., 2018, 186, 102–115 CrossRef CAS.
- G. D. Martin, S. D. Hoath and I. M. Hutchings, Inkjet printing - the physics of manipulating liquid jets and drops, J. Phys.: Conf. Ser., 2008, 105, 012001 CrossRef.
- A. L. Dessimoz, L. Cavin, A. Renken and L. Kiwi-Minsker, Liquid-liquid two-phase flow patterns and mass transfer characteristics in rectangular glass microreactors, Chem. Eng. Sci., 2008, 63, 4035–4044 CrossRef CAS.
- N. M. Kovalchuk, E. Roumpea, E. Nowak, M. Chinaud, P. Angeli and M. J. Simmons, Effect of surfactant on emulsification in microchannels, Chem. Eng. Sci., 2018, 176, 139–152 CrossRef CAS.
- S. L. Anna, Droplets and Bubbles in Microfluidic Devices, Annu. Rev. Fluid Mech., 2016, 48, 285–309 CrossRef.
- K. Wang, Y. C. Lu, J. H. Xu and G. S. Luo, Determination of Dynamic Interfacial Tension and Its Effect on Droplet Formation in the T-Shaped Microdispersion Process, Langmuir, 2009, 25, 2153–2158 CrossRef CAS PubMed.
- J. Carneiro, J. Campos and J. Miranda, PDMS microparticles produced in PDMS microchannels under the jetting regime for optimal optical suspensions, Colloids Surf., A, 2019, 580, 123737 CrossRef CAS.
- M. J. Lawrence and G. D. Rees, Microemulsion-based media as novel drug delivery systems, Adv. Drug Delivery Rev., 2000, 45, 89–121 CrossRef CAS PubMed.
- S. T. Wereley and C. D. Meinhart, Recent advances in micro-particle image velocimetry, Annu. Rev. Fluid Mech., 2010, 42, 557–576 CrossRef.
- J. Wu, G. Zheng and L. M. Lee, Optical imaging techniques in microfluidics and their applications, Lab Chip, 2012, 12, 3566–3575 RSC.
- A. Jahanbakhsh, K. L. Wlodarczyk, D. P. Hand, R. R. Maier and M. M. Maroto-Valer, Review of microfluidic devices and imaging techniques for fluid flow study in porous geomaterials, Sensors, 2020, 20, 4030 CrossRef CAS PubMed.
- E. Roumpea, N. M. Kovalchuk, M. Chinaud, E. Nowak, M. J. Simmons and P. Angeli, Experimental studies on droplet formation in a flow-focusing microchannel in the presence of surfactants, Chem. Eng. Sci., 2019, 195, 507–518 CrossRef CAS.
- I. Kiratzis, N. M. Kovalchuk, M. J. Simmons and D. Vigolo, Effect of surfactant addition and viscosity of the continuous phase on flow fields and kinetics of drop formation in a flow-focusing microfluidic device, Chem. Eng. Sci., 2022, 248, 117183 CrossRef CAS.
- J. H. Xu, S. Li, J. Tan and G. Luo, Correlations of droplet formation in T-junction microfluidic devices: from squeezing to dripping, Microfluid. Nanofluid., 2008, 5, 711–717 CrossRef CAS.
- T. Cubaud and T. G. Mason, Capillary threads and viscous droplets in square microchannels, Phys. Fluids, 2008, 20, 053302 CrossRef.
- M. Kalli, L. Chagot and P. Angeli, Comparison of surfactant mass transfer with drop formation times from dynamic interfacial tension measurements in microchannels, J. Colloid Interface Sci., 2022, 605, 204–213 CrossRef CAS PubMed.
- L. Kahouadji, E. Nowak, N. Kovalchuk, J. Chergui, D. Juric, S. Shin, M. J. Simmons, R. V. Craster and O. K. Matar, Simulation of immiscible liquid–liquid flows in complex microchannel geometries using a front-tracking scheme, Microfluid. Nanofluid., 2018, 22, 1–12 CrossRef CAS PubMed.
- A. Riaud, H. Zhang, X. Wang, K. Wang and G. Luo, Numerical study of surfactant dynamics during emulsification in a T-junction microchannel, Langmuir, 2018, 34, 4980–4990 CrossRef CAS PubMed.
- Y. Mahdi and K. Daoud, Microdroplet size prediction in microfluidic systems via artificial neural network modeling for water-in-oil emulsion formulation, J. Dispersion Sci. Technol., 2017, 38, 1501–1508 CrossRef CAS.
- J. W. Khor, N. Jean, E. S. Luxenberg, S. Ermon and S. K. Tang, Using machine learning to discover shape descriptors for predicting emulsion stability in a microfluidic channel, Soft Matter, 2019, 15, 1361–1372 RSC.
- P. Hadikhani, N. Borhani, S. M. H. Hashemi and D. Psaltis, Learning from droplet flows in microfluidic channels using deep neural networks, Sci. Rep., 2019, 9, 1–7 CrossRef CAS PubMed.
- A. Lashkaripour, C. Rodriguez, N. Mehdipour, R. Mardian, D. McIntyre, L. Ortiz, J. Campbell and D. Densmore, Machine learning enables design automation of microfluidic flow-focusing droplet generation, Nat. Commun., 2021, 12, 1–14 CrossRef PubMed.
- G. Forestier, F. Petitjean, H. A. Dau, G. I. Webb and E. Keogh, 2017 Ieee International Conference On Data Mining, 2017, pp. 865–870 Search PubMed.
- J. Hoffmann, Y. Bar-Sinai, L. M. Lee, J. Andrejevic, S. Mishra, S. M. Rubinstein and C. H. Rycroft, Machine learning in a data-limited regime: Augmenting experiments with synthetic data uncovers order in crumpled sheets, Sci. Adv., 2019, 5, eaau6792 CrossRef.
- A. Tucker, Z. Wang, Y. Rotalinti and P. Myles, Generating high-fidelity synthetic patient data for assessing machine learning healthcare software, NPJ Digit. Med., 2020, 3, 1–13 CrossRef PubMed.
- R. J. Chen, M. Y. Lu, T. Y. Chen, D. F. Williamson and F. Mahmood, Synthetic data in machine learning for medicine and healthcare, Nat. Biomed. Eng., 2021, 1–5 Search PubMed.
- J. Yoon, J. Jordon and M. Schaar, International Conference on Machine Learning, 2018, pp. 5699–5707 Search PubMed.
- C. Quilodrán-Casas, R. Arcucci, L. Mottet, Y. Guo and C. Pain, Adversarial autoencoders and adversarial LSTM for improved forecasts of urban air pollution simulations, arXiv, 2021, preprint, arXiv:2104.06297v2, DOI:10.48550/arXiv.2104.06297.
- S. Zhao, A. Riaud, G. Luo, Y. Jin and Y. Cheng, Simulation of liquid mixing inside micro-droplets by a lattice Boltzmann method, Chem. Eng. Sci., 2015, 131, 118–128 CrossRef CAS.
- G. F. Christopher and S. L. Anna, Microfluidic methods for generating continuous droplet streams, J. Phys. D: Appl. Phys., 2007, 40, R319 CrossRef CAS.
- I. Goodfellow, Y. Bengio and A. Courville, Deep learning, MIT Press, 2016 Search PubMed.
- J. L. Ticknor, A Bayesian regularized artificial neural network for stock market forecasting, Expert Syst. Appl., 2013, 40, 5501–5506 CrossRef.
- J. Shi, Y. Zhu, F. Khan and G. Chen, Application of Bayesian Regularization Artificial Neural Network in explosion risk analysis of fixed offshore platform, J. Loss Prev. Process Ind., 2019, 57, 131–141 CrossRef.
- Y. Zhou, L. You, H. Zi, Y. Lan, Y. Cui, J. Xu, X. Fan and G. Wang, Determination of pore size distribution in tight gas sandstones based on Bayesian regularization neural network with MICP, NMR and petrophysical logs, J. Nat. Gas Sci. Eng., 2022, 104468 CrossRef.
- D. J. MacKay, A practical Bayesian framework for backpropagation networks, Neural Comput., 1992, 4, 448–472 CrossRef.
- D. J. Livingstone, Artificial neural networks: methods and applications, Springer, 2008 Search PubMed.
- T. Chen and C. Guestrin, Proceedings of the 22nd acm sigkdd international conference on knowledge discovery and data mining, 2016, pp. 785–794 Search PubMed.
- D. E. Rumelhart, G. E. Hinton and R. J. Williams, Learning internal representations by error propagation, California univ san diego la jolla inst for cognitive science technical report, 1985 Search PubMed.
- D. P. Kingma and M. Welling, Auto-encoding variational bayes, arXiv, 2013, preprint, arXiv:1312.6114, DOI:10.48550/arXiv.1312.6114.
- A. Makhzani, J. Shlens, N. Jaitly, I. Goodfellow and B. Frey, Adversarial autoencoders, arXiv, 2015, preprint, arXiv:1511.05644, DOI:10.48550/arXiv.1511.05644.
- T. Dozat, Incorporating nesterov momentum into adam, 2016 Search PubMed.
- J. D. Tice, H. Song, A. D. Lyon and R. F. Ismagilov, Formation of droplets and mixing in multiphase microfluidics at low values of the Reynolds and the capillary numbers, Langmuir, 2003, 19, 9127–9133 CrossRef CAS.
- P. Garstecki, M. J. Fuerstman, H. A. Stone and G. M. Whitesides, Formation of droplets and bubbles in a microfluidic T-junction–scaling and mechanism of break-up, Lab Chip, 2006, 6, 437–446 RSC.
- J. Xu, S. Li, Y. Wang and G. Luo, Controllable gas-liquid phase flow patterns and monodisperse microbubbles in a microfluidic T-junction device, Appl. Phys. Lett., 2006, 88, 133506 CrossRef.
- D. G. Garson, Interpreting neural network connection weights, 1991 Search PubMed.
- E. S. Elmolla, M. Chaudhuri and M. M. Eltoukhy, The use of artificial neural network (ANN) for modeling of COD removal from antibiotic aqueous solution by the Fenton process, J. Hazard. Mater., 2010, 179, 127–134 CrossRef CAS PubMed.
- M. Kalli and P. Angeli, Effect of surfactants on drop formation flow patterns in a flow-focusing microchannel, Chem. Eng. Sci., 2022, 253, 117517 CrossRef CAS.
- J. Ledolter and R. H. Kardon, Focus on data: statistical design of experiments and sample size selection using power analysis, Invest. Ophthalmol. Visual Sci., 2020, 61, 11 CrossRef PubMed.
- I. Goodfellow, J. Pouget-Abadie, M. Mirza, B. Xu, D. Warde-Farley, S. Ozair, A. Courville and Y. Bengio, Generative adversarial nets, Adv. Neural. Inf. Process. Syst., 2014, 27, 139–144 Search PubMed.
- J. Sohl-Dickstein, E. Weiss, N. Maheswaranathan and S. Ganguli, International Conference on Machine Learning, 2015, pp. 2256–2265 Search PubMed.
- L. Dinh, D. Krueger and Y. Bengio, Nice: Non-linear independent components estimation, arXiv, 2014, preprint, arXiv:1410.8516, DOI:10.48550/arXiv.1410.8516.
- N. M. Kovalchuk, M. Sagisaka, K. Steponavicius, D. Vigolo and M. J. H. Simmons, Drop formation in microfluidic cross-junction: jetting to dripping to jetting transition, Microfluid. Nanofluid., 2019, 23, 1–14 CrossRef.
Footnotes |
| † Electronic supplementary information (ESI) available. See DOI: https://doi.org/10.1039/d2lc00416j |
| ‡ Equal contribution. |
| This journal is © The Royal Society of Chemistry 2022 |