
 Open Access Article
 This Open Access Article is licensed under a Creative Commons Attribution-Non Commercial 3.0 Unported Licence
Adipose microtissue-on-chip: a 3D cell culture platform for differentiation, stimulation, and proteomic analysis of human adipocytes
Nina
Compera
a,
Scott
Atwell
a,
Johannes
Wirth
 a,
Christine
von Törne
b,
Stefanie M.
Hauck
b and
Matthias
Meier
*ac
a,
Christine
von Törne
b,
Stefanie M.
Hauck
b and
Matthias
Meier
*ac
aHelmholtz Pioneer Campus, Helmholtz Zentrum München, Munich, Germany. E-mail: matthias.meier@helmholtz-muenchen.de
bMetabolomics and Proteomics Core, Helmholtz Zentrum München, Munich, Germany
cTUM School of Medicine, Technical University of Munich, Munich, Germany
First published on 25th July 2022
Abstract
Human fat tissue has evolved to serve as a major energy reserve. An imbalance between energy intake and expenditure leads to an expansion of adipose tissue. Maintenance of this energy imbalance over long periods leads to obesity and metabolic disorders such as type 2 diabetes, for which a clinical cure is not yet available. In this study, we developed a microfluidic large-scale integration chip platform to automate the formation, long-term culture, and retrieval of 3D adipose microtissues to enable longitudinal studies of adipose tissue in vitro. The chip was produced from soft-lithography molds generated by 3D-printing, which allowed scaling of pneumatic membrane valves for parallel fluid routing and thus incorporated microchannels with variable dimensions to handle 3D cell cultures with diameters of several hundred micrometers. In 32 individual fluidically accessible cell culture chambers, designed to enable the self-aggregation process of three microtissues, human adipose stem cells differentiated into mature adipocytes over a period of two weeks. Coupling mass spectrometry to the cell culture platform, we determined the minimum cell numbers required to obtain robust and complex proteomes with over 1800 identified proteins. The adipose microtissues on the chip platform were then used to periodically simulate food intake by alternating the glucose level in the cell-feeding media every 6 h over the course of one week. The proteomes of adipocytes under low/high glucose conditions exhibited unique protein profiles, confirming the technical functionality and applicability of the chip platform. Thus, our adipose tissue-on-chip in vitro model may prove useful for elucidating the molecular and functional mechanisms of adipose tissue in normal and pathological conditions, such as obesity.
Introduction
Adipose tissue is linked to a multitude of metabolic and endocrine functions in both healthy and diseased states, including adipokine and cytokine secretion, and lipid storage and release. In obesity, adipocyte hypertrophy and hyperplasia are the main drivers for the expansion of white adipose tissue, which leads to alterations in adipokine secretion and eventually disrupts the whole-body metabolism.1,2 However, the underlying molecular and functional mechanisms of adipose tissue in normal and pathological conditions are still a matter of debate. For longitudinal studies, it would be of substantial interest to engineer in vitro adipose tissues to model patient intervention studies. The murine preadipocyte cell line 3T3-L1,3 primary adipocytes,4,5 and human adipose tissue-derived stem cells (hASCs)6,7 have been used to replicate the physiology of fat tissue in vitro. hASCs are a convenient choice, as they are easy to maintain in routine cell culture formats, are proliferative, model depot-specific subtypes of adipocytes, and provide good translatability.5,8 To obtain mature fat tissue, hASCs must be differentiated into adipocytes before they display the phenotypic characteristics of their in vivo counterparts. Notably, in vitro-generated adipocytes resemble a premature adipose cell type, as indicated by their multilocularity, smaller lipid droplet diameters, and lower adipokine secretion.5 However, this cell type is preferred for in vitro engineering because of the obstacles encountered in handling mature primary adipocytes with their high buoyancy and mechanical fragility.9 3D cell culture formats, instead of traditional monolayer cultures10–12 have been suggested to enhance the maturation and differentiation of hASCs.7,13,14 Compared with monolayer culture formats, 3D cell cultures represent the organotypic microenvironment of native adipose tissue.6 For 3D culture, approaches such as embedding hASCs in Matrigel15 or other hydrogels,5,7 low-attachment well plates,6 hanging drops,16 magnetic levitation systems,17 permeable membranes,18 and microfluidic systems4,19 have all been exploited.Microfluidic techniques for modeling adipose tissue physiology in vitro have recently gained attention as they offer dynamic control of chemicals in the cell microenvironment during long-term differentiation,4 a reduced surface-to-volume ratio, and the possibility of automation of complex culture conditions. The integration of functional adipocytes or adipose microtissue-on-chip allows to assay insulin response,20,21 glycerol secretion at high temporal resolution,22,23 and the mimicking of interstitial flow conditions.7 The majority of on-chip integrated adipose tissues use scaffolding hydrogels, which closely mimic the native extracellular matrix (ECM) environment8 but generally lack chemically defined conditions.6 Furthermore, hydrogel microenvironments complicate downstream analysis because of the high background signals generated by the scaffolds.24 The presence of confounding proteins in scaffolding hydrogels together with low levels of analyte are the main reasons why mass spectrometry analysis of organ-on-chip platforms is underrepresented. However, increasing the sensitivity of mass spectrometry brings proteome, secretome, and metabolome analysis of organ-on-chip models within reach, as recently demonstrated for a liver-on-a-chip25 but also first adipocyte cultures.26 The demand for high sample numbers comes with the trade-off of requiring higher multiplexing degrees.
Microfluidic large-scale integration (mLSI) technology is considered an enabling platform for cell culture processes with high levels of automation and multiplexing capabilities. To date, mLSI platforms have mainly been integrated into 2D cell culture formats including adipocyte cultures.27 Only recently mLSI technologies for automated 3D cell culture and analysis became available.28–30 While a dimensional incompatibility of traditional mLSI fabrication techniques and 3D cell cultures has hampered progression of the technology, a 3D-printing-based fabrication approach overcomes this problem.30 3D printing fabrication enable unit operations for handling 3D cell cultures on-chip as for example sample retrieval without destruction. However, the throughput of the platform is far below that required for high-throughput proteomic studies of adipose tissue in vitro.
Here, we address this shortcoming by exploiting a previously developed fabrication protocol30 for the development of a higher-throughput mLSI platform for 3D cell culture formats. By integrating traditional and upscaled pneumatic membrane valves (PMVs), the core functional unit of the mLSI technique, an mLSI platform comprising 32 fluidically individually addressable cell culture chambers enabled the formation, long-term culture, and nondestructive retrieval of 96 3D cell cultures in a highly controllable manner. Furthermore, scaffold-free 3D on-chip adipogenesis of hASCs was conducted in an automated and reproducible manner. The generated adipocyte 3D cell cultures resembled phenotypically mature adipocytes, which was confirmed by lipid droplet staining of cryo-sectioned aggregates and detection of upregulated key adipocyte markers by proteomic analysis. To investigate whether differentiated adipocytes in a 3D cell culture format could serve as an in vitro adipose tissue-on-chip model, we subjected them to glucose restriction post-differentiation by decreasing the concentration of glucose in the maintenance medium, and then analyzed the induced changes at the proteome level. We also retrieved minimal cell sample volumes from the mLSI chip and acquired unbiased proteomes using mass spectrometry. We successfully investigated different glucose feeding regimes in parallel on a single platform and characterized the phenotype of the differentiated adipose aggregates in detail.
Experimental section
Master mold and polydimethylsiloxane (PDMS) chip fabrication
The master mold for the mLSI flow layer was designed in SolidWorks (version 2018-2019; Dassault Systèmes, France) and 3D-printed using a DLP stereolithography printer (Pico2HD, Asiga, Australia). The mold was printed as a negative using PlasGRAY resin (Asiga). The thickness of the printed layer was 10 μm. All other printing parameters (e.g., light intensity and exposure time) were kept at their default values according to the manufacturer's instructions. After printing, the flow mold was cleaned with isopropyl alcohol, flash-cured (Otoflash G171; NK-Optik, Germany) with 2000 flashes on each side, and then coated with a 2% solution of CYTOP™ (CTL-809M; AGC Chemicals, Japan), in accordance with the previously developed protocol,30 to prevent adhesion of PDMS. A negative control layer was fabricated according to the standard SU-8 (SU-8 3050; Microresist Technology, Germany) photolithography protocols.31 Similar to the flow mold, the control mold was permanently coated with CYTOP™ to facilitate PDMS release. For this, a thin film of CYTOP™ was spin-coated on the wafer (20 s at 500 rpm, then 30 s at 3000 rpm) and incubated for 1 h at 160 °C to evaporate the CYTOP™ solvent. The first PDMS cast from the CYTOP-coated molds was discarded to ensure proper bonding of the succeeding PDMS casts.The mLSI platform was fabricated by multilayer soft lithography31 using a 3D-printed flow and an SU-8 silicon control mold. In short, the upper flow layer was manufactured by casting a thick layer (approx. 5 mm) of PDMS (ratio 5![[thin space (1/6-em)]](https://www.rsc.org/images/entities/char_2009.gif) :1 of base material to curing agent; Sylgard® 184, Dow Corning, MI, USA) onto the flow mold, while for the lower control layer, PDMS (20:1 ratio) was spin-coated onto the wafer at 500 rpm for 15 s (acceleration 518 ms), followed by spinning at 1250 rpm for 30 s (acceleration 2220 ms). Both layers were partially cured for 20–25 min at 80 °C and the flow layer was released from the mold and aligned with the control layer. The assembly was again incubated for 45 min at 80 °C to enable off-ratio PDMS bonding. Next, the inlet and outlet ports for both layers were punched using a 20 gauge and 14 gauge needle, respectively. Finally, the mLSI device was sealed with a cover glass after oxygen plasma activation (20 W at 0.9 mbar for 25 s) and incubated for a further 60 min at 80 °C.
:1 of base material to curing agent; Sylgard® 184, Dow Corning, MI, USA) onto the flow mold, while for the lower control layer, PDMS (20:1 ratio) was spin-coated onto the wafer at 500 rpm for 15 s (acceleration 518 ms), followed by spinning at 1250 rpm for 30 s (acceleration 2220 ms). Both layers were partially cured for 20–25 min at 80 °C and the flow layer was released from the mold and aligned with the control layer. The assembly was again incubated for 45 min at 80 °C to enable off-ratio PDMS bonding. Next, the inlet and outlet ports for both layers were punched using a 20 gauge and 14 gauge needle, respectively. Finally, the mLSI device was sealed with a cover glass after oxygen plasma activation (20 W at 0.9 mbar for 25 s) and incubated for a further 60 min at 80 °C.
Flow characterization of the cell culture chamber
To analyze fluid flow within the cell culture chamber, a particle-tracking experiment was conducted. To achieve this, 2.55 μm polystyrene beads (PS-F-B237-1; microParticles GmbH, Germany) were flushed through the cell culture chambers of the mLSI chip. The actuation pressure of the trapping PMVs was increased incrementally in steps of 0.7 bar (10 psi), and the particle flow was recorded on an AxioObserver (Zeiss, Germany) with a frame rate of 300 fps. Prior to each measurement, the trapping PMVs were opened and closed at least once to avoid error due to the residual pressure in the system. During the measurement, constant fluid forward pressures of 35, 50, 100, and 125 mbar were applied. Recorded data from the five culture chambers were subsequently analyzed in ImageJ (v1.53f51) using the TrackMate32 plugin and exported to a custom-written MATLAB (version R2019a; MathWorks, MA, USA) script for visualization and flow rate calculations.Chip preparation for cell experiments
The control lines of the mLSI chip were directly connected to the solenoid valves (LMV155RHY-5A-Q; SMC, Japan) with Tygon tubing (ND 100-80; Proliquid, Germany) and operated using a custom-written MATLAB script. The control lines for the trapping PMVs were operated by a separate manual pressure regulator (LRP-1/4-4; Festo, Germany) to regulate the regulation of their actuation pressure independent of the other valves on-chip. All other valves on the mLSI platform were operated at a control pressure of 2.2 bar. Reagents were filled in gas-tight, light-proof bottles and connected to the flow inlet ports through the Tygon tubing. The forward fluid pressure used to pressurize the bottles was controlled by a flow control unit (Flow EZ™; Fluigent, France). The outlet ports were connected to the Tygon tubing and maintained at atmospheric pressure. The mLSI chip was placed in a microscope stage-top incubator (STX; Tokai Hit®, Japan) to ensure a constant humidified atmosphere of 37 °C and 5% CO2. Prior to seeding the cells on the chip, the fluidic network was coated with 10% Pluronic® F127 (Sigma-Aldrich, MO, USA) in phosphate-buffered saline (PBS; Sigma-Aldrich) for a minimum of 20 h to reduce cell attachment to the PDMS. The chip was rinsed with PBS to remove the Pluronic® and then pre-incubated with the cell culture medium for 30–60 min to equilibrate.3D cell culture and adipogenic differentiation on-chip
Human adipose tissue-derived stem cells (hASCs; ASC-F-ZB) were purchased from ZenBio (NC, USA) and maintained in routine 2D cell culture using subcutaneous preadipocyte growth medium (PM-1; ZenBio) according to the supplier's protocol. hASCs at passages 6–8 were used for the experiments. To seed cells on-chip, hASCs were detached from the culture flask using 0.25% trypsin-EDTA (Sigma-Aldrich), centrifuged at 280 × g for 5 min, and resuspended at a concentration of approximately 3.5 × 10⁵ in 30 μL of PM-1. Using Tygon tubing, the single-cell suspension was then transferred on-chip, where we filled four chambers simultaneously until all on-chip chambers were visually seeded with an equal number of cells. The actuation pressure of the trapping PMVs was then slowly increased at a rate of approximately 1 psi s−1, up to a closing pressure of 32 psi. Non-trapped cells were then safely rinsed from the fluidic network with at a fluid forward pressure of 25 mbar. The trapped cells were undisturbed for 4 h before the first feeding cycle. The trapping valve and fluid forward pressures varied between 25–28 psi and 35–50 mbar, respectively. Pressures were kept constant throughout the experiment, and cells were automatically fed every 4 h for 15 s, unless otherwise stated, using a custom-written MATLAB script.Differentiation of hASCs was initiated on day 1, 24 h after seeding when aggregates had formed, by switching from the standard growth medium to the commercially available differentiation induction medium DM-2 (ZenBio). On day 8, the medium was changed to adipocyte maintenance medium (AM-1; ZenBio) and the cultures were maintained until day 15 to obtain fully matured adipocytes. Aggregates fed only PM-1 were used as the non-differentiated controls (Ctrl). Media bottles were maintained at room temperature (RT) and replenished every 3–4 days.
Glucose treatment of differentiated adipocyte aggregates on-chip
For the glucose treatment experiments, we prepared a customized maintenance medium of which the basal media constituted a 1:1 mixture of DMEM without glucose (Thermo Fisher Scientific, MA, USA) and Ham's F-12 Nutrient Mix (Thermo Fisher Scientific) supplemented with 10% fetal bovine serum (FBS; Corning, NY, USA) and 1% penicillin–streptomycin. Depending on the required composition, glucose (Thermo Fisher Scientific) and human insulin (Sigma-Aldrich) were added to the basal medium to complement the customized maturation media. The low-glucose (LoGlu) medium contained a basal glucose concentration of 5 mM, and was supplemented with insulin to a final concentration of 20 nM. High-glucose (HiGlu) medium was supplemented with both glucose and insulin to a final concentration of 25 mM and 1.7 μM, respectively.
Before glucose treatment, 3D cell cultures of hASCs underwent adipogenic differentiation for 14 days as described previously. Matured adipocyte aggregates on-chip were then either fed permanently or intermittently with customized maintenance media for a further 7 days, forming three sample groups: 1) feeding with HiGlu medium only (serving as the control), 2) feeding with LoGlu medium only, and 3) alternating feeding with HiGlu and LoGlu media. All of the sample groups were perfused every 6 h for 15 s at a fluid pressure of 50 mbar. The trapping valves were actuated at a controlled pressure of 28 psi.
Aggregate retrieval off-chip
To retrieve 3D aggregates from the mLSI chip, a pipette tip was connected to the outlet port, and the medium was directed to flow from the inlet port through the multiplexer into the culture chamber and out via the outlet. Before retrieval, the aggregates were extensively washed on-chip with PBS. To release trapped aggregates, the trapping PMVs were slowly deactivated at a rate of approximately 10 psi min−1 to minimize the movement of aggregates within the other culture chambers. Once the aggregates were flushed out of the chamber into the pipette tip, the activation of the trapping PMVs was restored to their previous control pressure. Retrieved aggregates were then transferred from the pipette tip into V-bottom 96-well plates (Santa Cruz Biotechnology, TX, USA) for cryosectioning, or into 1.5 mL Eppendorf tubes for mass spectrometry. Occasionally, a few aggregates were attached to the PDMS; these were detached using trypsin and retrieved as single cells.Depending on the downstream analysis requirements, aggregates from at least four chambers on-chip (technical replicates) were retrieved at the following time points: for cryosections on days 1, 8, and 15, and for mass spectrometry on days 1, 15, and 22 (14 days differentiation + 7 days treatment).
Cryosections and immunofluorescent analysis
The aggregates were washed with PBS twice before fixing for 1 h at RT using 4% (w/v) paraformaldehyde (PFA). Next, the aggregates were dehydrated at RT using a sucrose gradient of between 10% (w/v) and 30% (w/v) for 2 h, followed by an overnight incubation in a 1:1 mixture of 30% sucrose and tissue freezing medium (Leica, Germany) at 4 °C. The next day, the aggregates were transferred to cryomolds and embedded in tissue freezing medium on dry ice. The frozen aggregates were stored at −80 °C until cryosectioning, for which they were cut into 10 μm slices on a cryostat at −30 °C.
For immunofluorescent staining of aggregate cryosections, frozen slices were pre-warmed to RT and washed in a Coplin jar containing PBS. After washing, they were permeabilized with 0.1% Triton™ X-100 (Sigma-Aldrich) in PBS for 30 min at RT, followed by incubation in blocking buffer (PBS, 0.2% Tween 20 (Carl Roth, Germany) and 10% donkey serum (Abcam, UK)) for 1 h at RT. The slides were then incubated for 2 h in the dark at RT with DAPI (1:500; Sigma-Aldrich) and BODIPY 493/503 (10 μg mL−1; Thermo Fisher Scientific) diluted in blocking buffer. Subsequently, the slides were washed extensively with 0.2% Tween 20 in PBS and mounted using Vectashield (Vector Laboratories, CA, USA).
Microscopy and image analysis
Bright-field images of the 3D aggregates on-chip were acquired with 2.5× and 10× objectives (Plan-Apochromat) on an Axiovert inverted microscope (Zeiss). A confocal microscope (LSM-880, Zeiss) and a 20× objective were used to record immunofluorescent and bright-field images of the stained cryosections. Image analysis and statistical evaluation were performed using custom-written macros and scripts in ImageJ and MATLAB software, respectively.Sample preparation for mass spectrometry
After the retrieval of aggregates, as much PBS as possible was aspirated from the Eppendorf tubes before freezing the samples at −80 °C until further processing. The whole aggregate pellets were processed by tryptic digestion using the PreOmics iST Kit (Preomics GmbH, Martinsried, Germany) according to the manufacturer's specifications. After drying, the resulting peptides were resuspended in 2% acetonitrile (ACN) and 0.5% trifluoroacetic acid.Mass spectrometric measurements
Liquid chromatography-tandem mass spectrometry (LC-MS/MS) analysis was performed in data-dependent acquisition (DDA) mode. MS data were acquired on a Q-Exactive HF-X mass spectrometer (Thermo Scientific), coupled online to a nano-RSLC (Ultimate 3000 RSLC; Dionex). Tryptic peptides were automatically loaded onto a C18 trap column (Acclaim PepMap100 C18, 300 μm inner diameter (ID) × 5 mm, 5 μm, 100 Å, LC Packings) at a flow rate of 30 μL min−1. For chromatography, a C18 reversed-phase analytical column (nanoEase MZ HSS T3 column, 100 Å, 1.8 μm, 75 μm × 250 mm, Waters) at 250 nL min−1 flow rate in a 95 min non-linear acetonitrile gradient from 3–40% in 0.1% formic acid was used. The high-resolution (60000 full width at half-maximum) MS spectrum was acquired with a mass range from 300 to 1500 m/z with an automatic gain control target set to 3 × 10⁶ and a maximum injection time of 30 ms. From the MS prescan, the 15 most abundant peptide ions were selected for fragmentation (MS/MS) if at least doubly charged, with a dynamic exclusion of 30 s. MS/MS spectra were recorded at 15000 resolution with an automatic gain control target set to 5 × 10² and a maximum injection time of 50 ms. The normalized collision energy was 28, and the spectra were recorded in profile mode.
Data processing – protein identification
Proteome Discoverer 2.5 software (Thermo Fisher Scientific; version 2.5.0.400) was used for peptide and protein identification via a database search (Sequest HT search engine) against the SwissProt human database (release 2020_02, 20432 sequences), considering full tryptic specificity, allowing for one missed tryptic cleavage site, precursor mass tolerance of 10 ppm, and fragment mass tolerance of 0.02 Da. Carbamidomethylation of Cys was used as a static modification. Dynamic modifications included deamidation of Asn and Gln, oxidation of Met, and a combination of Met loss with acetylation on the protein N-terminus. Percolator algorithm was used to validate peptide spectrum matches and peptides, accepting only the top-scoring hit for each spectrum and satisfying the cutoff values for FDR <1% and posterior error probability <0.05. The Sequest HT Xcorr filter was set to 1, removing identifications below this threshold. The final list of proteins complied strictly with the parsimony principle.
Data processing – label-free quantification
Protein quantification was based on the abundance values of unique peptides. Abundance values were normalized to the total peptide amount to account for sample loading errors. Protein abundances were calculated by summing the abundance values for admissible peptides. Proteins identified in only one replicate of a sample group, as well as contaminants from Bos taurus and keratin proteins, were excluded from the analysis. Differential protein expression analysis was performed using the DEP Bioconductor package33 in R (RStudio version 1.4.1717; MA, USA). Subsequent functional enrichment analysis and visualization were performed using the STRING database34 and customized Python (version 3.9) scripts.Statistical analysis
Experiments were conducted at least twice (n = 2) with a minimum of four independent on-chip chambers as technical replicates, unless otherwise stated. Extracted quantitative data (e.g., flow rate, equivalent diameter, and retrieval rate) are represented as the mean ± SD unless otherwise stated. Statistical significance was set at p < 0.05. Normal distribution was tested using the Shapiro–Wilk test35 in MATLAB R2019a.Results
3D-printing enables the integration of upscaled and standard sized PMVs on an mLSI chip
Non-destructive and automated handling of 3D cell cultures on mLSI platforms is required to enable the use of chip technology for higher-throughput applications. In general, pneumatic membrane valves (PMVs), the central functional element for controlling fluid flow on mLSI chips, can close microchannels with a semi-round channel geometry and dimensions of 2–50 μm in height.31 We have recently shown that PMVs can be scaled to close fluidic channels, with heights of up to hundreds of micrometers, by using a 3D-printing approach for the production of soft-lithography molds.30 This enabled the successful integration of 3D cell cultures on mLSI chips. The work presented here builds on this advance and exploits the high level of design flexibility of the 3D printing process to fabricate an mLSI chip for cultivating 96 3D cell cultures within 32 fluidically individually addressable unit cells (Fig. 1A). The arrayed unit cell (Fig. 1B) was designed to facilitate 3D cell culture formation via self-aggregation from a single cell suspension, automated medium exchange for long-term culture, and retrieval of the 3D cell culture sample. While the central region of the cell culture chamber exhibited a height and width of 200 μm and 300 μm, respectively (Fig. 1C), the two bypassing channels bifurcating at the entry of the cell culture chamber had a cross-section of 30 μm × 100 μm. Bypassing channels are required to rinse the fluidic network of the non-trapped cells. Each cell culture chamber could be compartmentalized into three consecutive regions by actuation of PMVs designed as a push-up configuration and herein termed trapping PMVs (Fig. 1D). These were operated in one of the following three pressure states (Fig. 1E): i) a fully closed state to trap a single cell suspension, ii) a sieve state for perfusion of 3D cell cultures after formation, and iii) an open state for retrieval of the cell material. The sieve state was achieved by making use of the 3D-printing-induced staircase effect on the fluidic channel profile.30 Within the pressure regime, states between 0.5 bar and 2.0 bar caused the deflected PDMS membrane to close the half-rounded channel imperfectly such that small gaps on the staircase profile remained open. Larger objects, including 3D cell cultures or single cells, were trapped and could not pass through the trapping valve in the sieve state (Fig. 1E). Flow channels upstream and downstream of the cell culture chamber had heights of 40 and 200 μm, respectively (Fig. 1C). The lower height of the upstream channels was chosen to minimize the dead volume of the channel network and to ensure the fully closed state of the PMVs at an actuation pressure of 2 bar, despite the staircase effect. This concomitantly reduced the number of cells required to fill the cell culture chambers during the cell-seeding process (see below). Since cells were seeded as a single-cell solution, they could be routed through 40 μm high channels without affecting cell integrity. Non-destructive retrieval of 3D cell cultures from the cell culture chambers required the downstream channels towards the outlet port to be at least equally high as the 3D cell culture chamber. To address the cell culture chambers individually, a standard 2log2N-multiplexer was included. The multiplexer divided the cell culture chamber area into two blocks of 16 chambers each. All PMVs were controlled with an actuation pressure of 2.2 bar, with the exception of the trapping PMVs, since they require adjustable pressure application to achieve the sieve state.
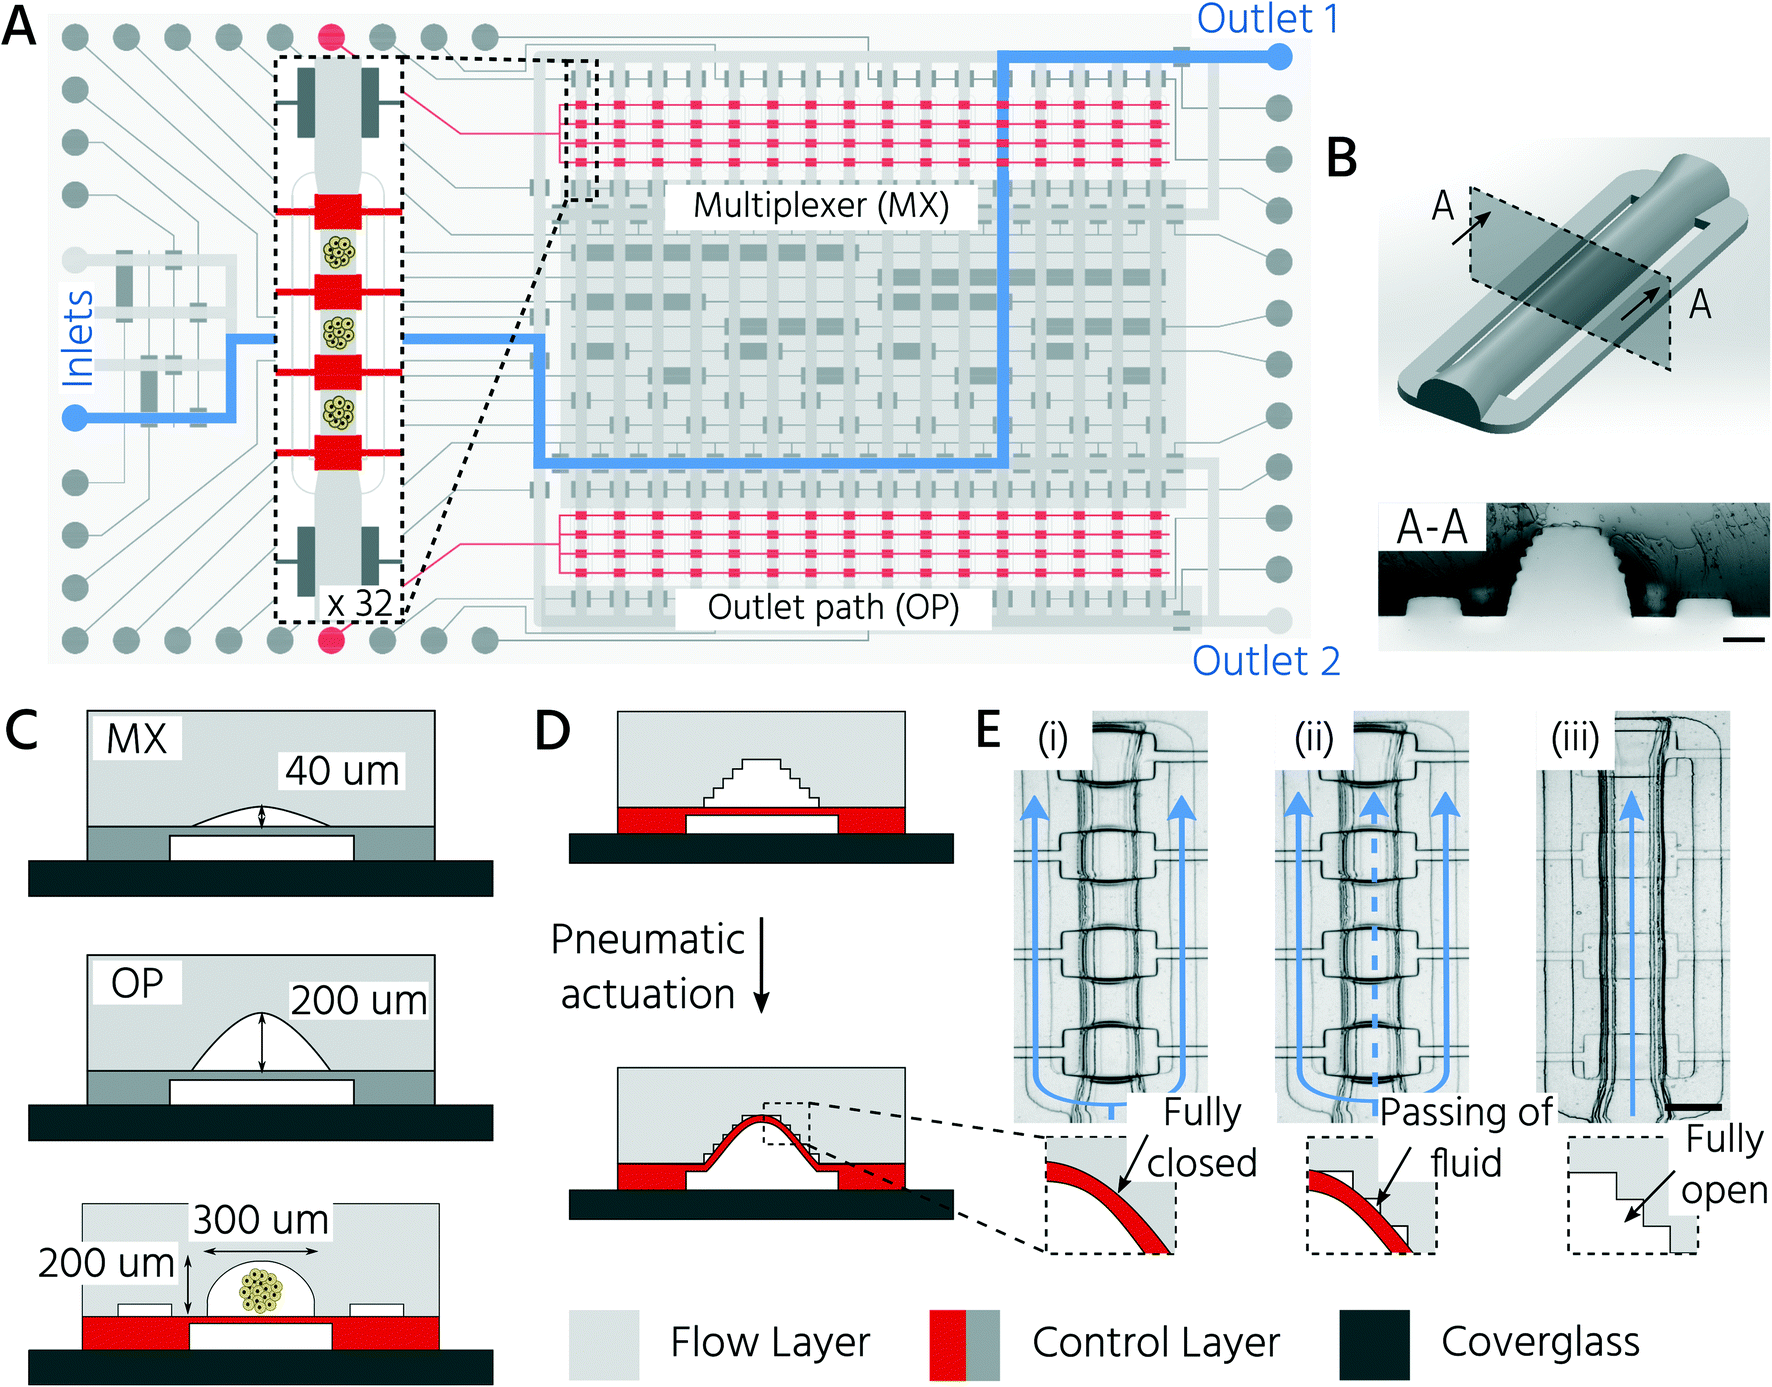 | ||
| Fig. 1 Microfluidic large-scale integration platform for the automated formation of 3D cell cultures, long-term parallel culturing process, and individual retrieval of cell cultures. A) Schematic layout of the two-layer mLSI chip design. Flow channels up and down stream of the cell culture chamber are shown (multiplexer (MX) and outlet path (OP)). Inset shows in detail one unit cell of the 32 culture chambers. B) 3D model (top) and cross-section of the PDMS layer (bottom) of the cell culture chamber. Scale bar: 100 μm. C) Schematic cross-section of different chip areas with indicated flow channel heights. D) Operating principle of the trapping PMVs (highlighted in red) by pneumatic actuation. E) Operating states of the trapping PMVs. The main paths of fluid flow are indicated in blue. (i) Closed state: cells are introduced as single-cell suspensions and safely confined at respective sites upon fully closing the trapping PMVs. (ii) Sieve state: perfusion of self-aggregated 3D cell cultures. Due to the staircase effect on the 3D-printed flow master mold, trapping PMVs allow for the passing of fluid while safely keeping the 3D aggregates in place. (iii) Open state: 3D aggregates can be retrieved by deactivation of the trapping PMVs. Scale bar: 250 μm. | ||
First, we aimed to characterize the fluid flow within the cell culture chamber, depending on the actuation state of the trapping PMVs, to prove the functionality of the unit cell for cell trapping. In the open state of the trapping PMVs (Fig. 2A top), the flow velocity in the main channel was 0.21 μL s−1 at a constant fluid forward pressure of 100 mbar (Fig. 2A and B). The flow velocity in the side channels was 7.0 nL s−1, demonstrating that approximately 94% of the volumetric flow passed through the main channel (Fig. 2A and C) of the cell culture unit cell. This was expected because of the channel size difference, where the theoretical fluidic resistance based on the Hagen–Poiseuille approximation was approximately three orders of magnitude larger in the side channels than in the main channel. Upon increasing the actuation pressure of the trapping valves, the flow velocity decreased in the main channel and increased in the side channels. At an actuation pressure of 2 bar, the mean flow velocity in the main channel was 0.014 μL s−1 (for a fluid forward pressure of 100 mbar), which is 15-fold lower than that of the open trapping valve state and is defined as the closed state (Fig. 2B). Conversely, the mean flow rate in the side channels increased from 7.0 nL s−1 to 0.11 μL s−1 at a PMV actuation pressure from 0 to 2 bar, respectively. The same trend was observed upon decreasing the forward fluid pressure (Fig. 2B and C). In summary, it was demonstrated that the flow rate inside the trapping site could be adjusted by both the fluid forward pressure and the control pressure of the trapping PMVs.
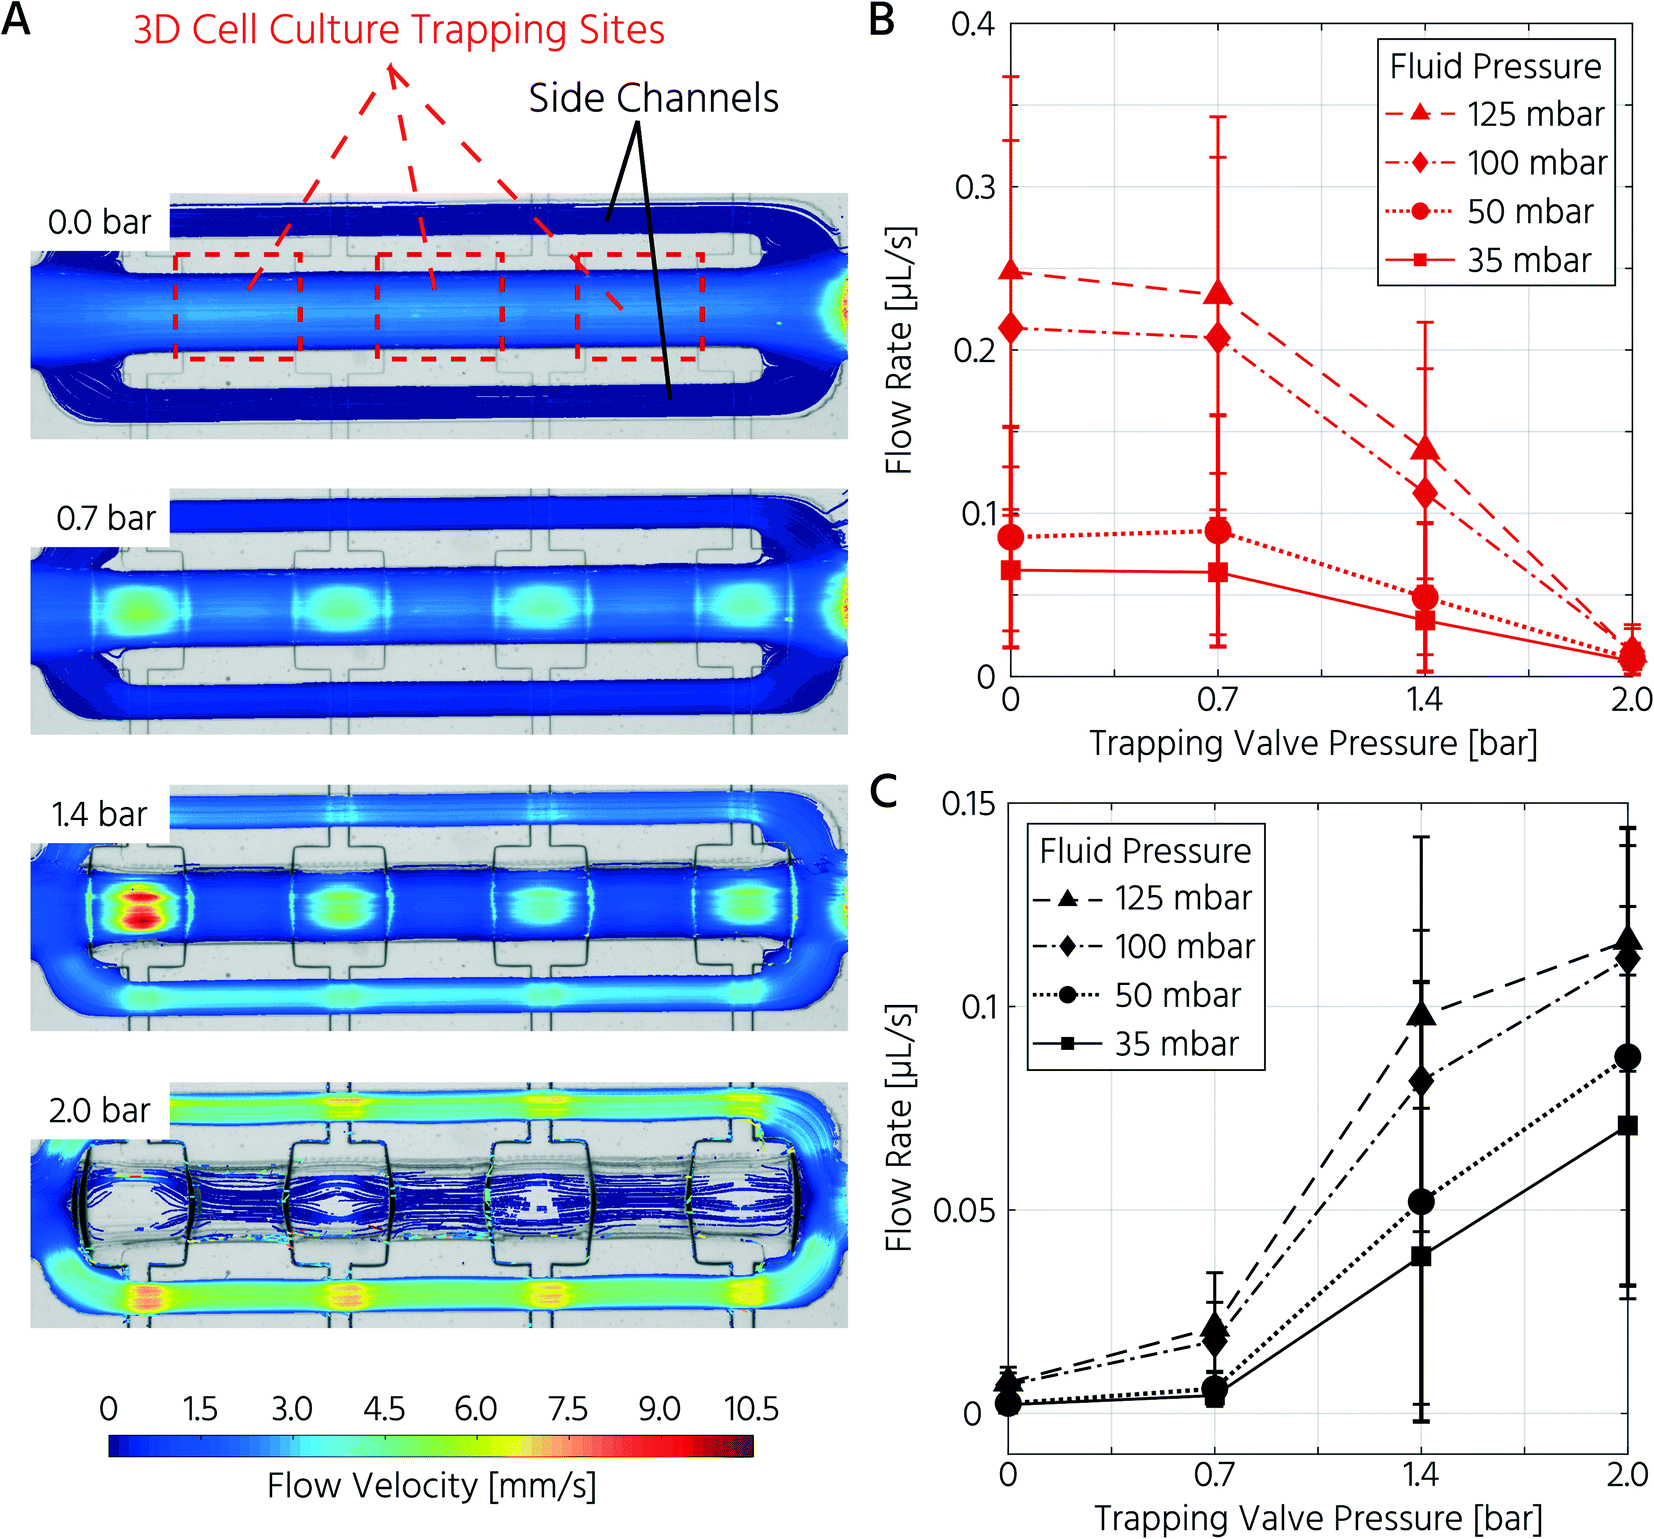 | ||
| Fig. 2 The actuation pressure of the trapping valve controls the flow path and rate in the cell culture chamber of the mLSI chip. A) Actuation of the trapping PMV leads to a change of flow velocity and path from the main to the side channels at a constant fluid forward pressure of 100 mbar. B and C) Plots show the mean (± SD) flow velocities inside the trapping region (B) and the side channels (C) relative to the fluid forward and actuation pressure of the trapping PMVs. n = 5 chambers on one chip. | ||
Formation, long-term culture, and scaffold-free 3D differentiation of hASCs into adipocytes on the mLSI platform
To test whether our platform allows for robust and reproducible formation, maintenance, and retrieval of 3D cell cultures, we first investigated the homogeneity of the self-aggregation process of hASCs. For this, a single-cell suspension with a cell concentration of 3.5 × 10⁵ in 30 μL was seeded into the cell culture chambers, where the trapping valves were set to their open state. Subsequently, the cells were trapped by setting the trapping PMV to the closed state, and the remaining cells in the fluidic network were rinsed through the side channels towards the outlet (Fig. 3A). Self-aggregation of hASCs was observed within the first 4 h. At this time point, the trapping valves were set to the sieve state, and feeding was initiated by exchanging the medium solution in the cell culture chamber for 15 s at a flow rate of 1.5 μL min−1 every 4 h. In the next 24 h, further compaction of the cell clusters to round hASC 3D cell cultures occurred, with only a few single cells remaining in the trapping areas. To quantitatively evaluate the 3D cell culture formation and growth, we measured its equivalent diameter, which is the diameter of a circle with an area equivalent to that of the 3D cell culture. On average, the 96 hASC 3D cell cultures formed on the mLSI chip exhibited an equivalent diameter of 143 ± 5 μm at 24 h after seeding (Fig. 3B). The chip-to-chip variability of the 3D cell culture formation process across six independent repeats was low (Fig. 3C). Their mean equivalent diameters varied by 14% compared with the overall mean, thus yielding high reproducibility. The 3D cell cultures were stable for 15 days on-chip, and their average size varied only minimally (Fig. 3D). During the cultivation period, the hASC 3D cell cultures did not show any signs of diminished cellular viability, such as disaggregation or necrosis. Nevertheless, the aggregates were, on average, 7% smaller than their initial size on day 1, suggesting that compaction occurred, as observed previously.6,36 Next, we determined the retrieval efficiency of 3D cell cultures with preserved spatial integrity for further off-chip analyses. For this purpose, the trapping valves were set to the open state and fluidically-addressed chamber by chamber. Overall, 88.6% of 3D cell cultures were recovered through the outlet port (Fig. 3E). During the retrieval process, the micro–macro connection at the outlet port was the main source of cell loss (Fig. 3E). In summary, our results highlight the suitability of the developed mLSI chip for automated formation, long-term culture, and non-destructive retrieval of 3D hASC aggregates in a reproducible and highly parallel manner.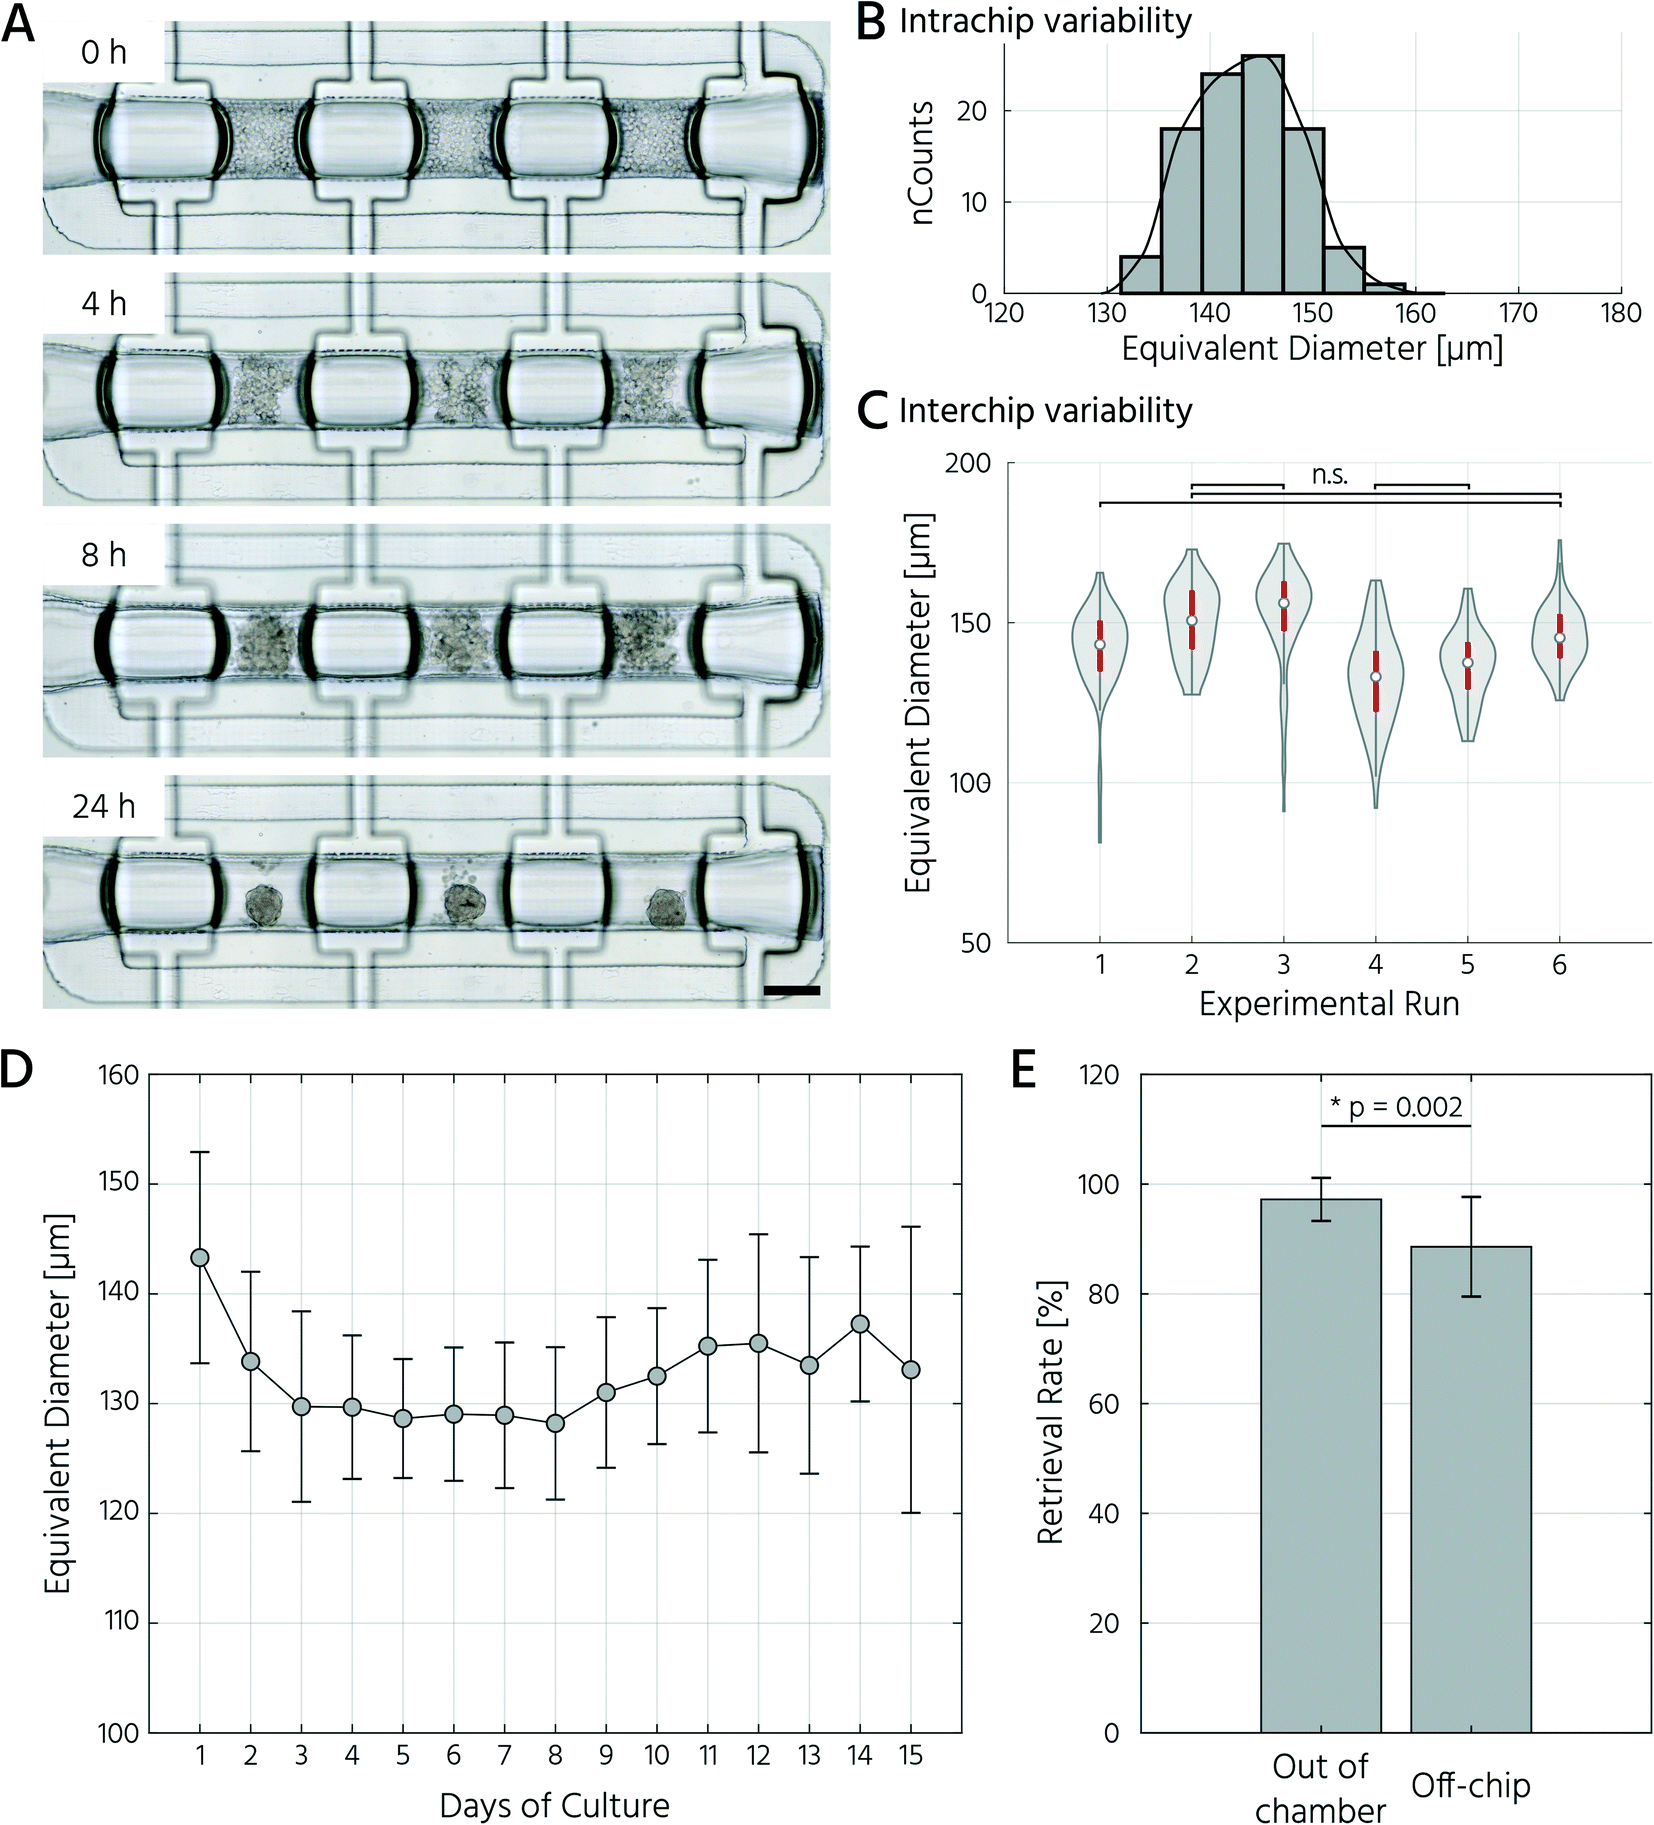 | ||
| Fig. 3 Parallel formation and cultivation of human adipose tissue-derived adult stem cells in 3D on-chip. A) Timeline of hASC self-aggregation in the cell culture chamber. Scale bar: 250 μm. B) Intrachip variability of the equivalent diameter of the 3D cell cultures. n = 6 biological repeats. C) Interchip variability of the equivalent diameter of formed hASC 3D cell cultures. n = 96 technical replicates per chip, all comparisons exhibited a p < 0.05 (one-way ANOVA) except for n.s. = not significant. D) Equivalent diameter of the hASC 3D cell cultures during on-chip culture. n = 4–12 technical replicates. E) Rates of successful retrieval of the hASC 3D cell cultures from the cell culture chambers. n = 3 biological replicates, *p < 0.05 (one-way ANOVA). | ||
Next, we sought to apply the developed mLSI platform to differentiate hASCs into adipocytes in a 3D culture format. For this, 96 hASC 3D cell cultures were formed under the above described conditions within 24 h on-chip. On the first day after seeding, the cell cultures were perfused with adipocyte induction medium, followed by maturation medium for 7 days (Fig. 4A). During the differentiation phase, we observed progressive darkening of the 3D cell cultures (Fig. 4B), indicating accumulation of lipid droplets.37,38 This assumption was confirmed by immunofluorescent staining of lipid droplets in the retrieved 3D cell cultures on days 1, 8, and 15 (Fig. 4C). The mean equivalent diameter of the 3D cell cultures during adipogenesis was constant, with increasing variation at later time points across the six independent experiments (Fig. 4D). Nuclei counts of hASCs, preadipocytes, and adipocyte 3D cell cultures confirmed this trend (Fig. 4E), where the average number of nuclei in the center region of a 3D cell culture varied non-significantly between 35 ± 14, 56 ± 18, and 50 ± 11 on days 1, 8, and 15, respectively. While the number of nuclei per 3D cell culture was constant during differentiation, the number of lipid droplets increased significantly as the cells within the 3D cell culture matured into adipocytes. Along with the number of lipid droplets, the lipid droplet volume increased from the preadipocyte to adipocyte stage (Fig. 4C).
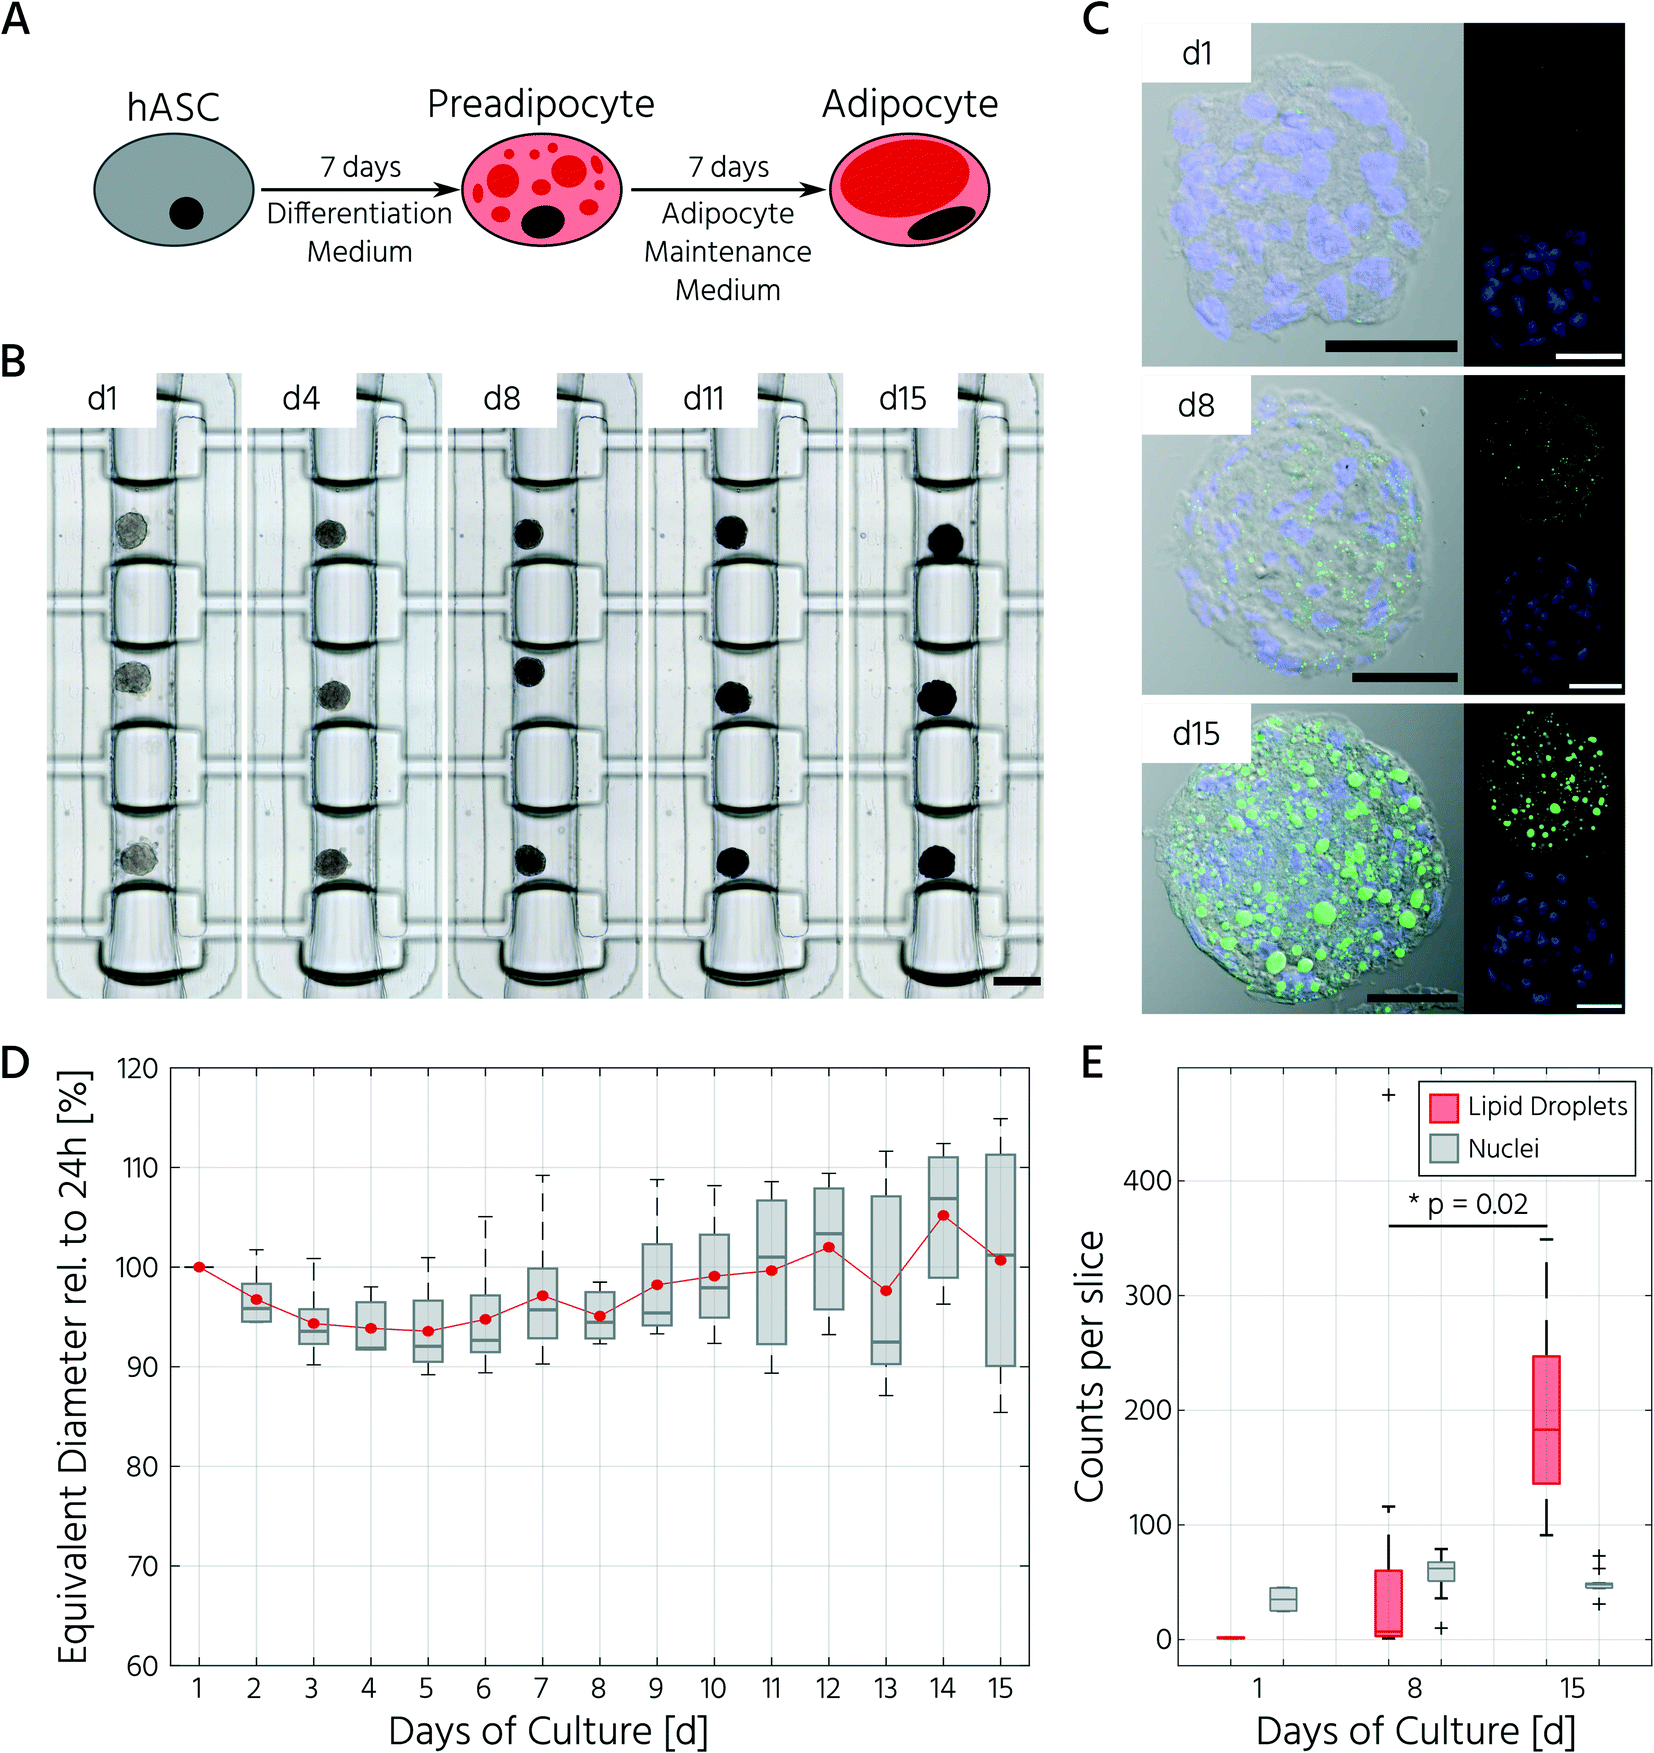 | ||
| Fig. 4 Adipocyte 3D cell cultures derived by scaffold-free differentiation of hASCs on-chip exhibit mature adipocyte characteristics. A) Overview of the experimental setup for the differentiation of hASCs towards adipocytes. B) Brightfield images of one representative cell culture chamber along the adipogenic differentiation pulse fed every 4 h. Scale bar: 250 μm. C) Validation of adipogenic maturation by lipid droplet staining (BODIPY, green) of cryosections prepared after retrieval of the 3D cell cultures from the chip. Nuclei were counterstained with DAPI (blue). Scale bars: 50 μm. D) Equivalent diameter of the 3D cell culture during the adipogenic differentiation relative to the aggregate size on day 1. n = 4 biological replicates. E) Lipid droplet and nuclei counts over the course of differentiation quantified from the middle section of the 3D cell cultures. n = 2 for day 1, n = 12 for day 8, n = 10 for day 15, *p < 0.05 (one-way ANOVA). | ||
Proteomic landscape of differentiated adipocyte aggregates changes upon glucose stimulation
In this experiment, we retrieved conditioned 3D cell cultures and determined the proteomes of the on-chip-differentiated adipocytes by mass spectrometry. Before comparing the proteomic landscapes of hASCs and differentiated adipocytes, we quantified the number of 3D cell cultures required to obtain comparable proteomic readouts (Fig. 5A, Exp1). For this, we pooled the cell material from two, four, and eight chambers, which corresponded to 6, 12, and 24 3D cell cultures (Fig. 5B). Following cell lysis and protein digestion, for the three samples, average peptide concentrations of 0.29, 0.32, and 0.33 μg μL−1, respectively, were obtained. Upon pooling the cell material from four or eight cell culture chambers, the proteome quantification became comparable, with approximately 2600 proteins across 2–3 technical replicates (Fig. 5B, n = 2 for eight chambers, n = 3 for four chambers). The proteome of hASC material pooled from only two chambers showed a lower count, with an average of 1731 proteins. Although the peptide concentration was similar in all three samples, the proteome complexity clearly differed. Based on these results, subsequent mass spectrometry experiments were performed with the material pooled from four cell culture chambers of the mLSI chip. Next, we investigated proteomic differences between the start and end points of the hASC differentiation on-chip as described above. Principal component analysis of the proteomes revealed distinct profiles in both sample groups (Fig. 5C). Interestingly, the two biological replicates of the differentiated sample clustered apart in the second principal component, but this was not observed in the non-differentiated group. This suggests that differentiation results in heterogeneity between the generated adipocytes (PC2 is 7.0%, compared to 91.8% in PC1). Analysis of the expression patterns of significantly up- and down-regulated proteins (p < 0.05) across both conditions highlighted their overall distinct protein expression profiles (Fig. 5D). Among the most significantly upregulated proteins in the differentiated adipocytes in 3D cell culture were well-known adipocyte marker proteins, including fatty acid binding protein 4 (FABP4), perilipin (PLIN4), adiponectin (ADIPOQ), and fatty acid synthase (FASN) (Fig. 5E and F). In contrast, pre-adipocyte protein markers, including platelet-derived growth factor receptors alpha and beta (PDGFRα and PDGFRβ), were significantly downregulated in adipocytes and highly expressed in hASCs. Taken together, the proteomic profiles confirmed successful adipocyte differentiation on-chip.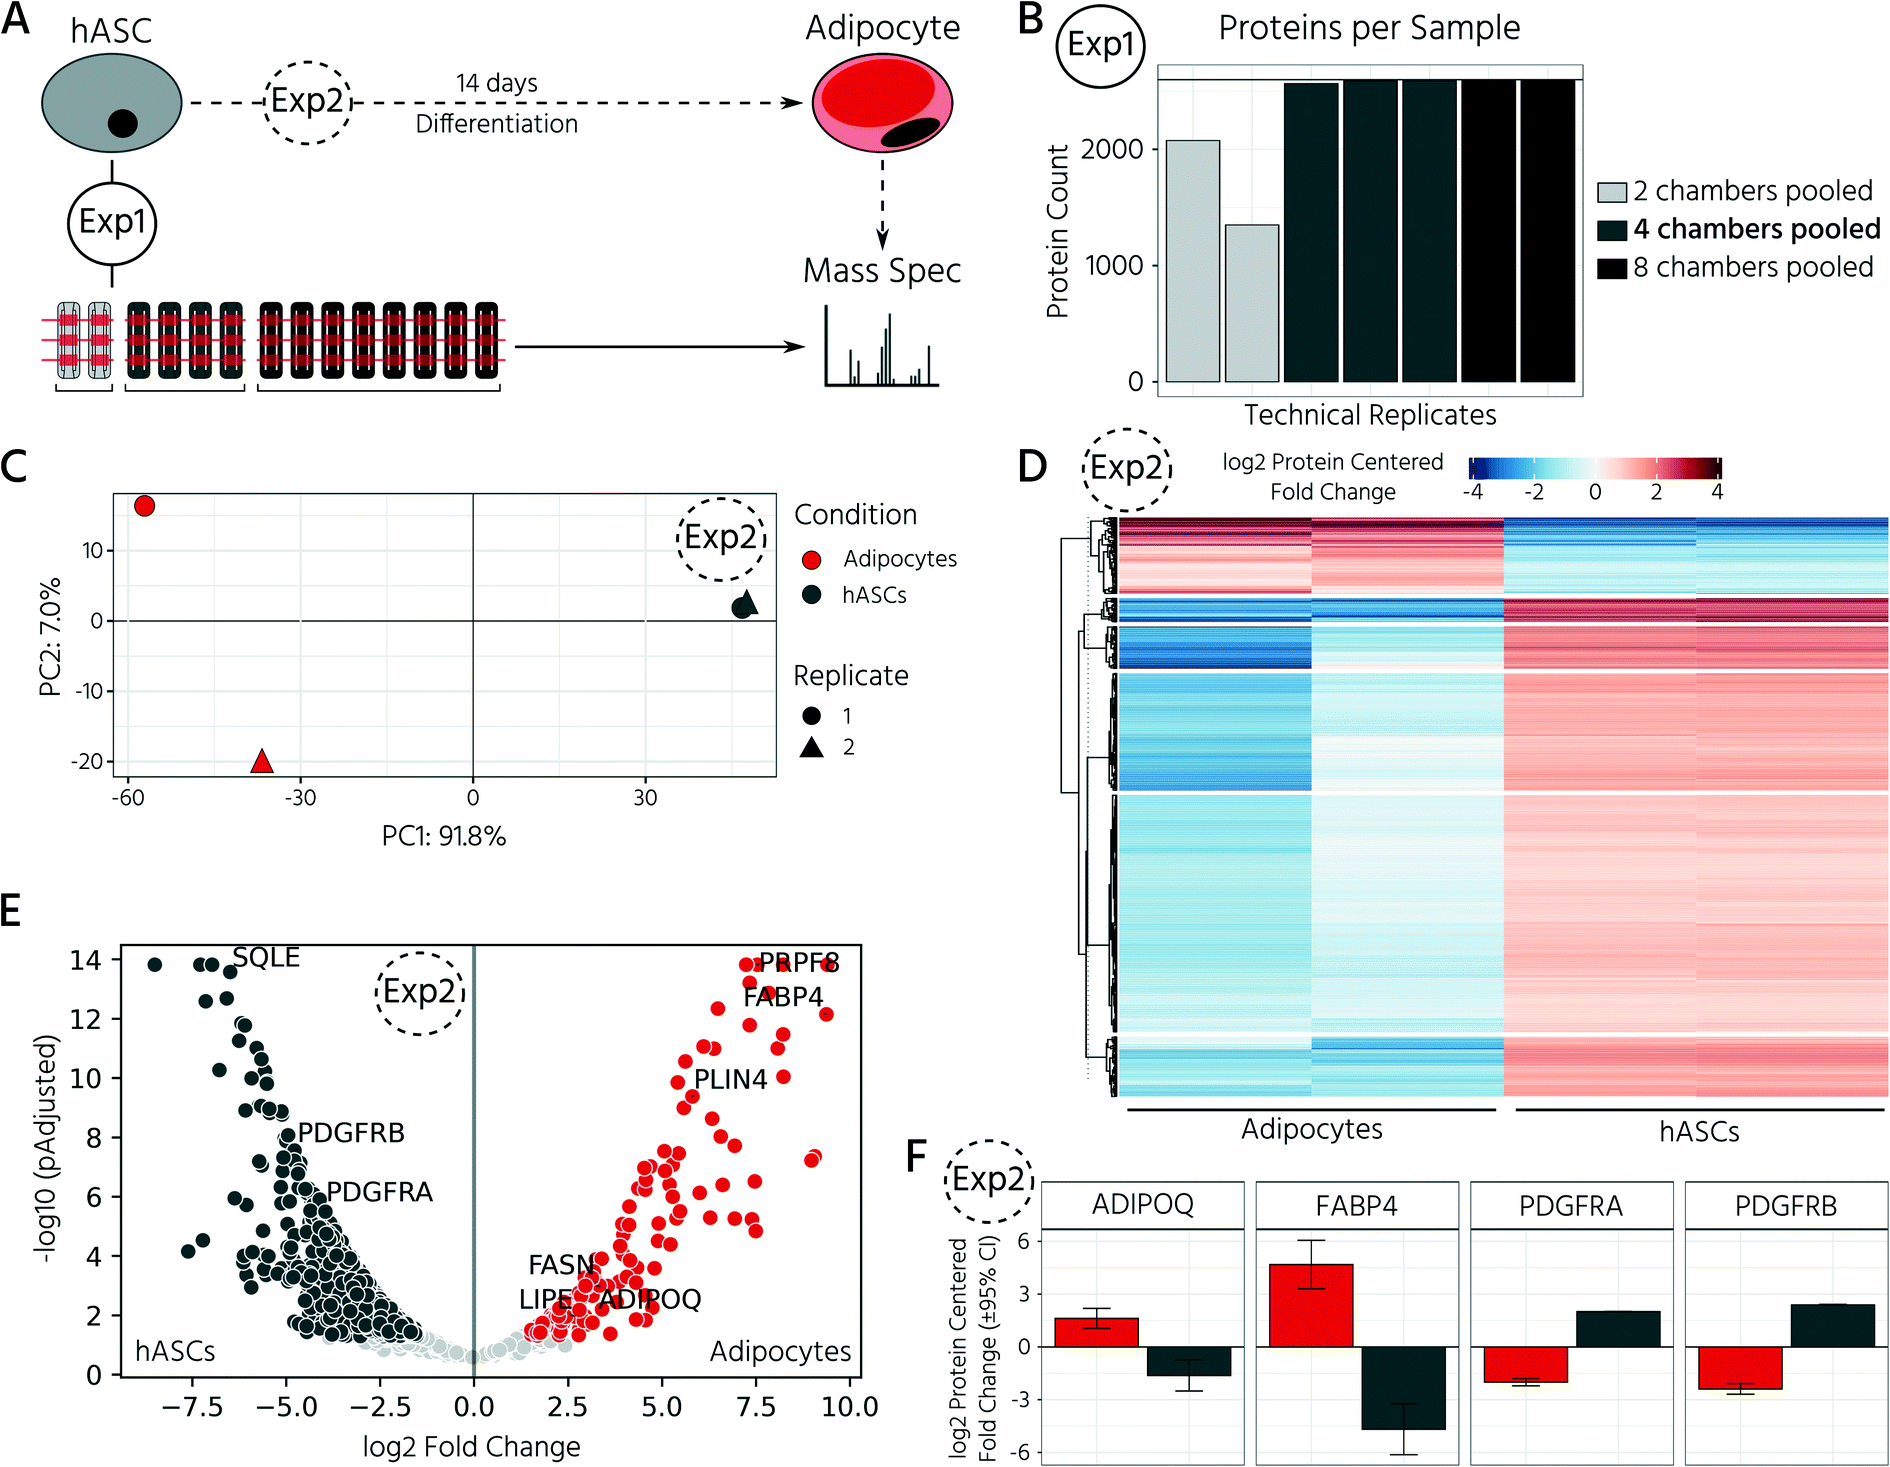 | ||
| Fig. 5 Proteomic mass spectrometry analysis of 3D hASC and differentiated adipocyte cell cultures on-chip. A) Overview of the experimental setup. During differentiation 3D cell cultures were pulse fed every 4 h. (1) For determining the required quantity of cell sample material for robust preparation of proteomes by mass spectrometry different numbers of 3D cell cultures were pooled as indicated. (2) Proteome analysis of hASC differentiation into adipocytes. B) Number of proteins identified per technical replicate of hASC cell material pooled from either 2, 4, or 8 cell culture chambers. C) Principal components analysis of normalized protein abundances of adipocytes and hASCs. n = 2 biological replicates. D) Heatmap representation of k-means clustering of all significant differentially expressed proteins. E) Volcano plot of differentially expressed proteins for hASCs and adipocytes. Proteins with p < 0.05 and fold change >1.5 are highlighted in respective colors: dark gray for the hASCs, red for the adipocytes. F) Mean expression levels of adipocyte and pre-adipocyte protein markers. | ||
In the last step, we exploited our mLSI chip platform to investigate proteomic changes in adipocyte 3D cell cultures in response to different nutritional culture conditions induced by defined long-term feeding protocols. Therefore, hASCs were first differentiated over a time course of 14 days on the chip, as described above. Subsequently, the adipocyte 3D cell cultures within the cell chambers were fed every 6 h with a maintenance medium containing either (i) a high glucose concentration of 25 mM, (ii) a low glucose concentration of 5 mM, or (iii) alternating between (i) and (ii) (Fig. 6A). For comparison, 25 mM is the glucose concentration contained in the maturation media during the second week of adipocyte differentiation, and thus, the basal medium for the cell type. After being subjected to the glucose regimes for seven days, the conditioned 3D cell cultures were retrieved from the chip and analyzed by mass spectrometry following the same procedure as described previously. Adipocyte proteomes exhibited a total of 1844 proteins, of which 92.6% of the measured proteins were identified in all three sample groups and 6.2% in at least two of the three conditions (Fig. 6B). Under all three conditions, we observed a differentially expressed protein pattern (Fig. 6C).
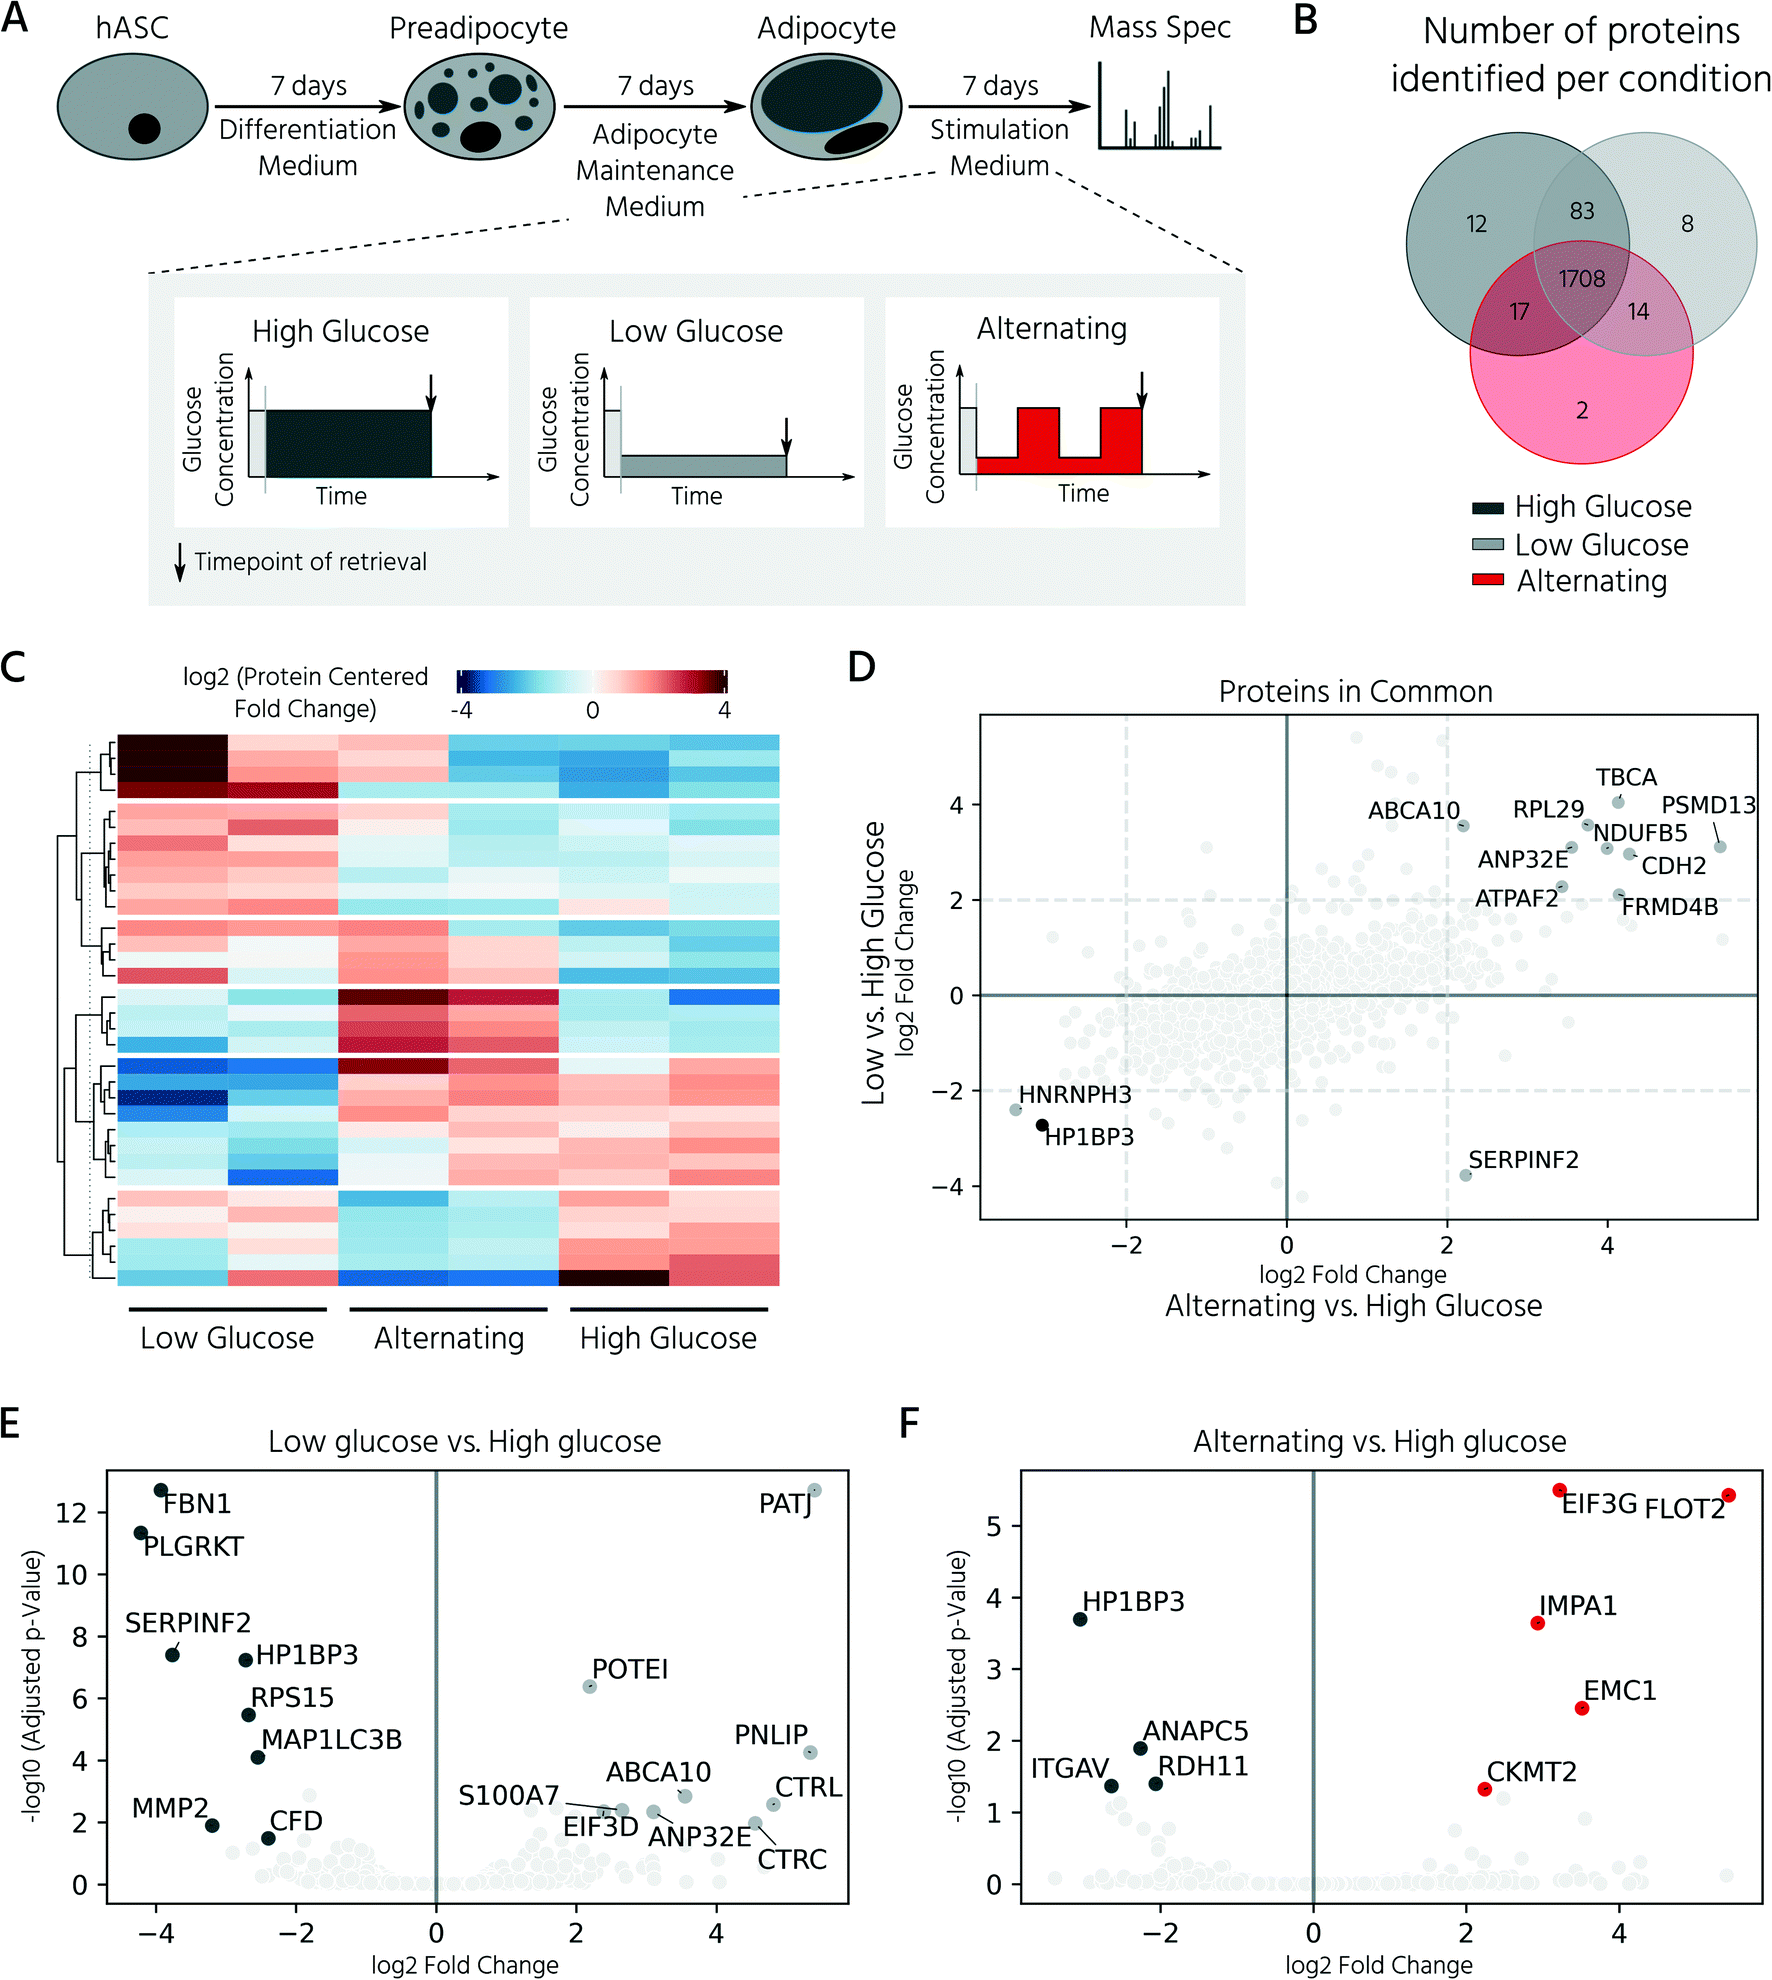 | ||
| Fig. 6 Proteomic changes of differentiated adipocytes upon prolonged exposure to varying levels of glucose concentration. A) Experimental setup of the glucose treatment study. After differentiation (14 days), adipocytes were treated for an additional 7 days with either constant or alternating levels of glucose in the maintenance medium (high concentration: 25 mM, low concentration: 5 mM). B) Venn diagram of identified proteins per condition. The majority of identified proteins (92.6%) were shared among all tested conditions. C) Heatmap representation of significant (p < 0.05) proteins among all conditions. n = 2 biological replicates. D) Comparison of log2 (fold-change) of proteins shared between the low glucose and alternating condition, both with respect to the high glucose condition. Statistical significance (p < 0.05) of a protein in both contrasts is indicated by a black dot. E and F) Volcano plots of differentially expressed proteins for low glucose (E) and alternating (F) vs. high glucose treated adipocytes. Proteins with p < 0.05 and fold change >2 are highlighted in respective colors: dark gray for the high glucose, light gray for the low glucose, red for the alternating condition. | ||
To investigate the influence of glucose concentration on the adipocyte proteome, we calculated the protein fold-changes in the low and alternating conditions, as compared to those in the high glucose condition. The most significantly upregulated proteins under the low glucose conditions are shown in Fig. 6E and included hydrolases such as pancreatic triglyceride lipase (PNLIP), chymotrypsin-C (CTRC), and chymotrypsin-like protein (CTRL). The activity of PNLIP and other lipases has been shown to continuously hydrolyze adipose triglycerides and generate free fatty acids, even under adverse environmental conditions such as long-term nutritional deficiency39 and ongoing inflammation.40 Proteins known to be involved in the dysregulation of inflammatory signals including ABCA1041 and S100A7 were also upregulated. Upregulated proteins identified in the alternating feeding regime included the mitochondrial creatine kinase CKMT2, which is highly expressed in tissues with large fluctuating energy demands, and inositol monophosphatase 1 (IMPA1), which protects the cells from osmotic stress induced by the highly osmotic glucose-6-phosphatase.42 A direct comparison of the adipocyte proteomes under alternating and low-glucose conditions (both plotted versus the high-glucose condition) showed that they shared the majority of differentially regulated proteins (Fig. 6D). For example, the nucleosome-binding protein, HP1BP3, which regulates cell survival and proliferation, was downregulated under both conditions (Fig. 6F). In summary, the analysis showed that reduction of glucose, either long-term or alternating, led to a similar cellular proteomic phenotype, with only minor differences between the respective conditions.
Discussion
This work presents an mLSI chip platform for automated and multiplexed formation, long-term culture, adipogenesis, and retrieval of 3D cell cultures of human ASCs in a parallel manner. The mLSI chips were produced from 3D-printed soft-lithography molds,30 where the footprint of the mLSI chip was 29 mm × 52 mm, and could hold 32 individual fluidically addressable cell culture chambers. The parallelization degree on the mLSI chips produced remains limited because of the relatively small building platform of available high-resolution 3D printers. To increase the parallelization degree by an order of magnitude, as achieved for 2D cell cultures43–46 on mLSI chips, a new 3D printer generation is required. Despite the current limitations, we exploited the design flexibility of 3D printers to integrate microsystem design features to handle 3D cell culture within channel networks with heights of several hundred microns. The PMVs for fluid routing can be scaled to their corresponding channel dimensions. Although all flow channels exhibited a channel profile with a staircase effect resulting from the layer-by-layer curing process of 3D printers, all of the PMVs could be fully closed at 2.2 bars of actuation pressure. Indeed, the staircase effect on a microchannel with a height of over a hundred microns could be used as a functional sieve feature at intermediate closing pressures, facilitating the reversible trapping and precise perfusion of 3D cell cultures on mLSI chips. With the assisted self-aggregation mechanism in the cell culture chamber and retrieval of 3D cell cultures in a non-destructive manner, we added two new features to the mLSI design toolbox.29,30 While the success rate for the formation of 96 3D cell culture processes was over 95%, the recovery rates for 3D cell cultures were 89% and thus similar to other, non-mLSI-based, microfluidic platforms.47 hASCs formed highly reproducible 3D cell cultures on the chip, with a standard deviation of an equivalent diameter of 8 μm across six chip repeats. Notably, this size deviation was explained by minor differences in cell seeding density.The scaled number of cell cultures on the mLSI chip platform requires bioanalytical workflows to subject complex tissue mimetics. Fluorescence imaging is a state-of-the-art method for analyzing 3D cell cultures on mLSI chips. The option for sample retrieval enabled the acquisition of complete proteomic information using mass spectrometry analysis. In contrast to DNA sequencing-based analytics, where signal amplification overcomes sensitivity thresholds for analytes, the required proteomic analysis required that we pooled four cell culture chambers, each with three 3D cell cultures, to obtain complex proteomes. These results are in line with the reported sensitivity thresholds. To minimize the cell samples required for individual 3D cell cultures to empower the mLSI chip fully, a mass spectrometric sample preparation workflow, including cell lysis and digestion, will need to be integrated onto the chip, similarly to immunofluorescence sample preparation. The achieved proteomic resolution proved that on-chip differentiation of hASCs into adipocytes was successful. Adipocytes expressed adipogenic markers such as ADIPOQ, FABP4, PLIN4, and FASN, and downregulated preadipocyte markers (PDGFRα and PDGFRβ). Transcription factors such as PPARγ and CEBPα could not be detected; however, their concentrations are approximately 1000-fold lower than that of other markers.48
To simulate blood glucose oscillations following periodic food intake, dynamically controlled cell culture methods are required. Using an adipose tissue-on-chip model, we investigated the proteomic response to oscillating glucose levels in the feeding media. Glucose oscillations with a frequency of 12 h over longer periods have been poorly investigated, and no studies exploring these oscillations at a 6 h frequency have been performed thus far. In our study, adipocytes under low glucose conditions showed upregulation of proteins associated with overcoming energy restriction and dysregulation of inflammatory signals. Downregulation of FBN1, the precursor protein for the adipokine asprosin, and of complement factor D has also been reported in this and other studies investigating nutritional restrictions;49–51 our findings thus concur with those previously noted. The proteome acquired for adipocytes in the alternating high/low glucose perfusion regime correlated closer to the high-glucose regime (Pearson correlation of r between 0.68 and 0.87) than to the low-glucose regime (r between 0.38 and 0.66), showing that the high glucose interval partly compensated the 6 h of low glucose concentration. The alternating glucose concentration upregulates metabolic turnover, as indicated by the upregulation of CKMT2, a protein typically expressed at higher levels in beige- and brown-fat mitochondria.52,53 The closest in vitro references to our work investigated the effect of oscillating glucose at high and low glucose concentrations in conjunction with saturated fatty acid.54 While the study found a sustained inflammatory effect even once the treatment was halted, this effect was attributed to saturated fatty acid treatment rather than the oscillating glucose concentration. Notably, the basal cell culture media contained an insulin concentration higher than under physiological conditions in order to maintain cell viability. Our current study shows that adipocytes change their proteomes in response to glucose availability. These proof-of-principle experiments must be extended to simulate adipose disease conditions; however, the technical framework is laid out herein with the presented analytical workflow.
In summary, we have developed a platform for the automated generation of an adipose tissue model upon the integration of scaffold-free 3D differentiation of hASCs on an mLSI chip with appropriate imaging. Our adipose tissue-on-chip model can help unravel the molecular and functional mechanisms of this tissue in normal and pathological conditions such as obesity.
Author contributions
Conceptualization: NC, SA, MM; investigation: NC, CT; formal analysis: NC, SA, JW, CT; writing: NC, MM; supervision: SMH, and MM. All authors have approved the final manuscript.Conflicts of interest
There are no conflicts of interest to declare.Acknowledgements
This work was supported by the Helmholtz Pioneer Campus and the ERC Consolidator Grant (Number 772646). Further, we would like to thank Nina Spielmann for the help with the protocol for cryo embedding of the aggregates.References
- Z. Wu, et al., CD146 is a Novel ANGPTL2 Receptor that Promotes Obesity by Manipulating Lipid Metabolism and Energy Expenditure, Adv. Sci., 2021, 2004032, 1–17, DOI:10.1002/advs.202004032.
- J. Renes, A. Rosenow, N. Roumans, J.-P. Noben and E. C. M. Mariman, Calorie restriction-induced changes in the secretome of human adipocytes, comparison with resveratrol-induced secretome effects, Biochim. Biophys. Acta, Proteins Proteomics, 2014, 1844(9), 1511–1522, DOI:10.1016/j.bbapap.2014.04.023.
- H. Kugo, W. Sukketsiri, K. Iwamoto, S. Suihara, T. Moriyama and N. Zaima, Low glucose and serum levels cause an increased inflammatory factor in 3T3-L1 cell through Akt, MAPKs and NF-κB activation, Adipocyte, 2021, 10(1), 232–241, DOI:10.1080/21623945.2021.1914420.
- J. Rogal, et al., WAT-on-a-chip integrating human mature white adipocytes for mechanistic research and pharmaceutical applications, Sci. Rep., 2020, 10(1), 1–12, DOI:10.1038/s41598-020-63710-4.
- A.-C. Volz, B. Omengo, S. Gehrke and P. J. Kluger, Comparing the use of differentiated adipose-derived stem cells and mature adipocytes to model adipose tissue in vitro, Differentiation, 2019, 110, 19–28, DOI:10.1016/j.diff.2019.09.002.
- J. X. Shen, et al., 3D Adipose Tissue Culture Links the Organotypic Microenvironment to Improved Adipogenesis, Adv. Sci., 2021, 8(16), 2100106, DOI:10.1002/advs.202100106.
- F. Yang, et al., A 3D human adipose tissue model within a microfluidic device, Lab Chip, 2021, 21(2), 435–446, 10.1039/d0lc00981d.
- G. Grandl, S. Müller, H. Moest, C. Moser, B. Wollscheid and C. Wolfrum, Depot specific differences in the adipogenic potential of precursors are mediated by collagenous extracellular matrix and Flotillin 2 dependent signaling, Mol. Metab., 2016, 5(10), 937–947, DOI:10.1016/j.molmet.2016.07.008.
- M. McCarthy, et al., Fat-on-a-Chip models for research and discovery in obesity and its metabolic co-morbidities, Tissue Eng., Part B, 2020, 26(6), 586–595, DOI:10.1089/ten.TEB.2019.0261.
- Y. Liu, et al., Adipose-on-a-chip: a dynamic microphysiological in vitro model of the human adipose for immune-metabolic analysis in type II diabetes, Lab Chip, 2019, 19(2), 241–253, 10.1039/C8LC00481A.
- V. L. Slaughter, et al., Validation of an adipose-liver human-on-a-chip model of NAFLD for preclinical therapeutic efficacy evaluation, Sci. Rep., 2021, 11(1), 13159, DOI:10.1038/s41598-021-92264-2.
- B. D. Pope, C. R. Warren, K. K. Parker and C. A. Cowan, Microenvironmental Control of Adipocyte Fate and Function, Trends Cell Biol., 2016, 26(10), 745–755, DOI:10.1016/j.tcb.2016.05.005.
- P. Gibler, et al., Human Adipose-Derived Stromal/Stem Cell Culture and Analysis Methods for Adipose Tissue Modeling In Vitro: A Systematic Review, Cell, 2021, 10(6), 1378, DOI:10.3390/cells10061378.
- R. Bender, et al., Human Adipose Derived Cells in Two- and Three-Dimensional Cultures: Functional Validation of an In Vitro Fat Construct, Stem Cells Int., 2020, 2020, 1–14, DOI:10.1155/2020/4242130.
- A. Ioannidou, S. Alatar, M. Åhlander, A. Hornell, M. Rachel and C. E. Hagberg, Hypertrophied human adipocyte spheroids as in vitro model of weight gain and adipose tissue dysfunction, bioRxiv, 2021, DOI:10.1101/2021.01.06.425629.
- A. J. Klingelhutz, et al., Scaffold-free generation of uniform adipose spheroids for metabolism research and drug discovery, Sci. Rep., 2018, 8(1), 1–12, DOI:10.1038/s41598-017-19024-z.
- A. C. Daquinag, G. R. Souza and M. G. Kolonin, Adipose Tissue Engineering in Three-Dimensional Levitation Tissue Culture System Based on Magnetic Nanoparticles, Tissue Eng., Part C, 2013, 19(5), 336–344, DOI:10.1089/ten.tec.2012.0198.
- M. J. Harms, et al., Mature Human White Adipocytes Cultured under Membranes Maintain Identity, Function, and Can Transdifferentiate into Brown-like Adipocytes, Cell Rep., 2019, 27(1), 213–225.e5, DOI:10.1016/j.celrep.2019.03.026.
- X. Li and C. J. Easley, Microfluidic systems for studying dynamic function of adipocytes and adipose tissue, Anal. Bioanal. Chem., 2018, 410(3), 791–800, DOI:10.1007/s00216-017-0741-8.
- X. Li, J. C. Brooks, J. Hu, K. I. Ford and C. J. Easley, 3D-templated, fully automated microfluidic input/output multiplexer for endocrine tissue culture and secretion sampling, Lab Chip, 2017, 17(2), 341–349, 10.1039/c6lc01201a.
- A. Zambon, et al., High Temporal Resolution Detection of Patient-Specific Glucose Uptake from Human ex Vivo Adipose Tissue On-Chip, Anal. Chem., 2015, 87(13), 6535–6543 CrossRef CAS PubMed.
- J. Hu, X. Li, R. L. Judd and C. J. Easley, Rapid lipolytic oscillations in ex vivo adipose tissue explants revealed through microfluidic droplet sampling at high temporal resolution, Lab Chip, 2020, 20(8), 1503–1512, 10.1039/D0LC00103A.
- C. E. Dugan, W. P. Cawthorn, O. A. MacDougald and R. T. Kennedy, Multiplexed microfluidic enzyme assays for simultaneous detection of lipolysis products from adipocytes, Anal. Bioanal. Chem., 2014, 406(20), 4851–4859, DOI:10.1007/s00216-014-7894-5.
- Y. R. Devaud, et al., Label-Free Quantification Proteomics for the Identification of Mesenchymal Stromal Cell Matrisome Inside 3D Poly(Ethylene Glycol) Hydrogels, Adv. Healthcare Mater., 2018, 7(21), 1800534, DOI:10.1002/ADHM.201800534.
- F. Michielin, et al., The Microfluidic Environment Reveals a Hidden Role of Self-Organizing Extracellular Matrix in Hepatic Commitment and Organoid Formation of hiPSCs, Cell Rep., 2020, 33(9), 108453, DOI:10.1016/j.celrep.2020.108453.
- C. E. Dugan, J. P. Grinias, S. D. Parlee, M. El-Azzouny, C. R. Evans and R. T. Kennedy, Monitoring cell secretions on microfluidic chips using solid-phase extraction with mass spectrometry, Anal. Bioanal. Chem., 2017, 409(1), 169–178, DOI:10.1007/s00216-016-9983-0.
- X. Wu, et al., In situ characterization of the mTORC1 during adipogenesis of human adult stem cells on chip, Proc. Natl. Acad. Sci. U. S. A., 2016, 113(29), E4143–E4150, DOI:10.1073/pnas.1601207113.
- T. Silva Santisteban, O. Rabajania, I. Kalinina, S. Robinson and M. Meier, Rapid spheroid clearing on a microfluidic chip, Lab Chip, 2018, 18(1), 153–161, 10.1039/C7LC01114H.
- J. C. Ardila Riveros, et al., Automated optimization of endoderm differentiation on chip, Lab Chip, 2021, 21(23), 4685–4695, 10.1039/D1LC00565K.
- N. Compera, S. Atwell, J. Wirth, B. Wolfrum and M. Meier, Upscaling of pneumatic membrane valves for the integration of 3D cell cultures on chip, Lab Chip, 2021, 21(15), 2986–2996, 10.1039/D1LC00194A.
- M. A. Unger, H.-P. Chou, T. Thorsen, A. Scherer and S. R. Quake, Monolithic microfabricated valves and pumps by multilayer soft lithography, Science, 2000, 288(5463), 113–116 CrossRef CAS PubMed.
- J. Y. Tinevez, et al., TrackMate: An open and extensible platform for single-particle tracking, Methods, 2017, 115, 80–90, DOI:10.1016/j.ymeth.2016.09.016.
- X. Zhang, A. H. Smits, G. B. van Tilburg, H. Ovaa, W. Huber and M. Vermeulen, Proteome-wide identification of ubiquitin interactions using UbIA-MS, Nat. Protoc., 2018, 13(3), 530–550, DOI:10.1038/nprot.2017.147.
- D. Szklarczyk, et al., STRING v11: protein–protein association networks with increased coverage, supporting functional discovery in genome-wide experimental datasets, Nucleic Acids Res., 2019, 47(D1), D607–D613, DOI:10.1093/nar/gky1131.
- A. BenSaïda, Shapiro-Wilk and Shapiro-Fancia normality tests, MATLAB Central File Exchange, 2021, Available: https://www.mathworks.com/matlabcentral/fileexchange/13964-shapiro-wilk-and-shapiro-francia-normality-tests.
- A.-C. Tsai, Y. Liu, X. Yuan and T. Ma, Compaction, Fusion, and Functional Activation of Three-Dimensional Human Mesenchymal Stem Cell Aggregate, Tissue Eng., Part A, 2015, 21(9–10), 1705–1719, DOI:10.1089/ten.tea.2014.0314.
- P. A. Sandoz, Label free 3D analysis of organelles in living cells by refractive index shows pre-mitotic organelle spinning in mammalian stem cells, bioRxiv, 2018, p. 407239, DOI:10.1101/407239.
- M. Schürmann, J. Scholze, P. Müller, J. Guck and C. J. Chan, Cell nuclei have lower refractive index and mass density than cytoplasm, J. Biophotonics, 2016, 9(10), 1068–1076, DOI:10.1002/jbio.201500273.
- T. Inagaki, et al., Endocrine Regulation of the Fasting Response by PPARα-Mediated Induction of Fibroblast Growth Factor 21, Cell Metab., 2007, 5(6), 415–425, DOI:10.1016/j.cmet.2007.05.003.
- C. de Oliveira, et al., Pancreatic triglyceride lipase mediates lipotoxic systemic inflammation, J. Clin. Invest., 2020, 130(4), 1931–1947, DOI:10.1172/JCI132767.
- J. J. Wenzel, W. E. Kaminski, A. Piehler, S. Heimerl, T. Langmann and G. Schmitz, ABCA10, a novel cholesterol-regulated ABCA6-like ABC transporter, Biochem. Biophys. Res. Commun., 2003, 306(4), 1089–1098, DOI:10.1016/S0006-291X(03)01097-0.
- A. M. Gardell, J. Yang, R. Sacchi, N. A. Fangue, B. D. Hammock and D. Kltz, Tilapia (Oreochromis mossambicus) brain cells respond to hyperosmotic challenge by inducing myo-inositol biosynthesis, J. Exp. Biol., 2013, 216(24), 4615–4625, DOI:10.1242/jeb.088906.
- A. R. Vollertsen, et al., Highly parallelized human embryonic stem cell differentiation to cardiac mesoderm in nanoliter chambers on a microfluidic chip, Biomed. Microdevices, 2021, 23(2), 3, DOI:10.1007/s10544-021-00556-1.
- T. Frank and S. Tay, Flow-switching allows independently programmable, extremely stable, high-throughput diffusion-based gradients, Lab Chip, 2013, 13(7), 1273–1281, 10.1039/c3lc41076e.
- M. Blazek, X. Wu, R. Zengerle and M. Meier, Analysis of fast protein phosphorylation kinetics in single cells on a microfluidic chip, in 18th International Conference on Miniaturized Systems for Chemistry and Life Sciences, MicroTAS 2014, 2014, vol. 15, 3, pp. 267–269, 10.1039/c4lc00797b.
- T. Thorsen, S. J. Maerkl and S. R. Quake, Microfluidic large-scale integration, Science, 2002, 298(5593), 580–584 CrossRef CAS PubMed.
- W. Liu, J.-C. Wang and J. Wang, Controllable organization and high throughput production of recoverable 3D tumors using pneumatic microfluidics, Lab Chip, 2015, 15(4), 1195–1204, 10.1039/c4lc01242a.
- M. A. Ambele, C. Dessels, C. Durandt and M. S. Pepper, Genome-wide analysis of gene expression during adipogenesis in human adipose-derived stromal cells reveals novel patterns of gene expression during adipocyte differentiation, Stem Cell Res., 2016, 16(3), 725–734, DOI:10.1016/J.SCR.2016.04.011.
- W. R. Swindell, Genes regulated by caloric restriction have unique roles within transcriptional networks, Mech. Ageing Dev., 2008, 129(10), 580–592, DOI:10.1016/J.MAD.2008.06.001.
- J. M. Dhahbi, T. Tsuchiya, H. J. Kim, P. L. Mote and S. R. Spindler, Gene Expression and Physiologic Responses of the Heart to the Initiation and Withdrawal of Caloric Restriction, J. Gerontol., Ser. A, 2006, 61(3), 218–231, DOI:10.1093/GERONA/61.3.218.
- Q. Qiao, F. G. Bouwman, M. A. Van Baak, J. Renes and E. C. M. Mariman, Glucose Restriction Plus Refeeding in Vitro Induce Changes of the Human Adipocyte Secretome with an Impact on Complement Factors and Cathepsins, Int. J. Mol. Sci., 2019, 20(16), 4055, DOI:10.3390/IJMS20164055.
- Á. Klusóczki, et al., Differentiating SGBS adipocytes respond to PPARγ stimulation, irisin and BMP7 by functional browning and beige characteristics, Sci. Rep., 2019, 9(1), 5823, DOI:10.1038/s41598-019-42256-0.
- S. Müller, et al., Proteomic Analysis of Human Brown Adipose Tissue Reveals Utilization of Coupled and Uncoupled Energy Expenditure Pathways, Sci. Rep., 2016, 6(1), 1–9, DOI:10.1038/srep30030.
- E. M. Youssef-Elabd, et al., Acute and chronic saturated fatty acid treatment as a key instigator of the TLR-mediated inflammatory response in human adipose tissue, in vitro, J. Nutr. Biochem., 2012, 23(1), 39–50, DOI:10.1016/j.jnutbio.2010.11.003.
| This journal is © The Royal Society of Chemistry 2022 |