 Open Access Article
Creative Commons Attribution 3.0 Unported Licence
Horseshoe lamination mixer (HLM) sets new standards in the production of monodisperse lipid nanoparticles†
Peer
Erfle
 *ab,
Juliane
Riewe
 bc,
Songtao
Cai
 a,
Heike
Bunjes
 bc and
Andreas
Dietzel
 *ab
*ab
aInstitut für Mikrotechnik, Technische Universität Braunschweig, Alte Salzdahlumer Str. 203, 38124 Braunschweig, Germany. E-mail: p.erfle@tu-braunschweig.de; a.dietzel@tu-braunschweig.de
bZentrum für Pharmaverfahrenstechnik (PVZ), Technische Universität Braunschweig, Franz-Liszt-Str. 35a, 38106 Braunschweig, Germany
cInstitut für Pharmazeutische Technologie und Biopharmazie, Technische Universität Braunschweig, Mendelssohnstr. 1, 38106 Braunschweig, Germany
First published on 6th July 2022
Abstract
Microfluidic mixers promise unique conditions for the controlled and continuous preparation of nanoparticles by antisolvent precipitation. Nanoparticles may enable encapsulation of drug or mRNA molecules in the form of carrier nanoparticles or can provide higher bioavailability in the form of drug nanoparticles. The ultimate goal in microfluidic approaches is the production of nanoparticles with narrow size distributions while avoiding contaminations and achieving sufficiently high throughput. To achieve this, a novel microfluidic precipitation device was developed and realized by two-photon polymerization: mixing elements were designed in such a way that the liquids undergo a repeated Smale horseshoe transformation resulting in an increased interfacial area and mixing times of less than 10 ms. These elements and an additional 3D flow focusing ensure that no organic phase is exposed to the channel walls. The integration of a fluidic shield layer in the flow focusing proved to be useful to delay the precipitation process until reaching a sufficient distance to the injection nozzle. Lipid nanoparticle preparation with different concentrations of castor oil or the hard fat Softisan® 100 were performed at different flow rates and mixing ratios with and without a shield layer. Flow rates of up to 800 μl min−1 and organic phase mixing ratios of up to 20% resulted in particle sizes ranging from 42 nm to 166 nm with polydispersity indices from 0.04 to 0.11, indicating very narrowly distributed, and in most cases even monodisperse, nanoparticles. The occurrence of fouling can be completely suppressed with this new type of mixing elements, as long as Dean vortices are prevented. Moreover, this parameter range in the horseshoe lamination mixer provided a stable and continuous process, which enables a scalable production.
1 Introduction
Micromixers play an important role in biomedical diagnostics or in the microscale production of nanomedicines. Mixing can be accelerated in microscopic channels due to the large surface-to-volume ratio of the liquids involved, making the mixing time identical or even smaller than the reaction time of chemical or physical processes (e.g., precipitation) and thereby allowing better control of the products.1–3 However, laminar flow conditions are maintained in most microflows. In the absence of turbulence, diffusion transport is the dominant factor for mixing.2,4 Design configurations of the microchannels can reduce diffusion paths by creating liquid lamellae through advection or distributive mixing. Such mixing processes are either actively supported by an external energy input or passively supported by static geometric features that manipulate the streamlines upstream or in the mixing channel.1,5Passive micromixers have become increasingly popular in the field of nanoparticle preparation in the last decades and were used for the production of polymeric nanoparticles,6,7 drug nanoparticles,8,9 liposomes10,11 or lipid nanoparticles (LNPs).12,13 The formulation of drug nanoparticles or nanoparticulate drug carrier systems represents a common pharmaceutical approach for improving the bioavailability of poorly soluble drugs after oral administration or to process them into injectable products.14–17 Moreover, drug carrier nanoparticles are under intensive investigation with regard to site-specific drug delivery (drug targeting) after intravenous injection, e.g. for the treatment of cancer cells.14,18–20 Nucleic acids encapsulated in cationic lipid-containing nanoparticles can be applied for vaccination (a prominent example being the mRNA-based COVID-19 vaccines) and are being intensively explored for a wide range of therapeutic applications such as the treatment of cancer, infections, or hereditary diseases.21 Microfluidic systems are a good option for the production of such nanoparticle formulations.22–24 The particle size and particle size distribution width are important quality criteria of pharmaceutical nanoparticles, e.g., with regard to the dissolution rate of drug nanoparticles or the biodistribution of nanoparticulate drug carriers. While the dissolution rate of drug nanoparticles always benefits from the smallest possible particle size,16,17 the pharmacokinetic behavior of intravenously injected nanoparticles is often considered optimal for drug targeting in a size range between 70 nm or 100 nm to 200 nm.25,26
Pharmaceutical nanoparticles can be prepared in micromixers using the bottom-up method of antisolvent precipitation. Nanoparticle-forming constituents (carrier materials and/or drugs) are dissolved in an appropriate solvent and then thoroughly mixed with an antisolvent, typically water.16,27 With progressing diffusion, the solutes in the ternary mixture exceed a critical concentration and spontaneous nucleation starts. As nucleation proceeds, the concentration of the substance in the solvent falls below the threshold for nucleation, but growth of nucleated particles can continue to occur. Homogeneous and rapid mixing of the liquids involved in the precipitation process is crucial for producing small particles with a narrow size distribution.28 The latter is of particular importance for nanoparticle dispersions that are prone to Ostwald ripening (such as many drug nanosuspensions) as it counteracts the ripening process.29,30
The ultrafast mixing in microfluidic systems provides optimal conditions for antisolvent precipitation.8,31–33 While several microfluidic systems already produced LNPs with sizes below 200 nm and allowed to control particle sizes by adjusting process and formulation parameters, the achievement of narrow size distributions appeared to be more challenging.13,34–36 Another issue with almost all microfluidic precipitation processes is material accumulation at the channel walls, known as fouling, which becomes a serious disadvantage with increasing microchannel surface-to-volume ratio. Material can attach to the channel wall and continue to grow into microparticles. This ongoing process can lead to changes in the streamlines or even to complete clogging of the system. Microparticles detaching from the channel wall are carried into the nanodispersion and must be filtered out afterwards.37 Furthermore, microparticles being a thousand times bigger than a single nanoparticle reduce the precipitation yield.
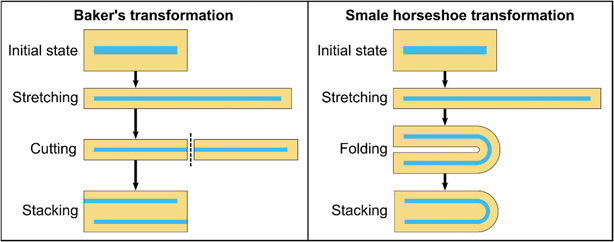
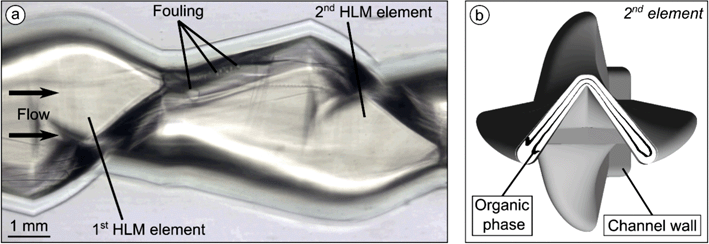
Different strategies to minimize fouling have been reported, such as the use of integrated cleaning techniques employing ultrasound,38 the use of high pressure mixers to generate large shear stresses,39–41 tailored surface properties of the channel walls,39,42–44 or adapted composition of the solutions involved.40,41,45 Nozzle configurations with 3D hydrodynamic flow focusing reduce material–wall interactions, while abrupt path and cross-section changes should be minimized.41,46 An additional protective separation layer through an additional stream47,48 or mixing by 3D emulsification8 can create a sufficient distance between particles and channel surfaces and improve the quality of the product. Ideal mixing conditions can be achieved with the baker's transformation, in which a high number of layers – adding up to a chaotic distribution of all particles – is achieved by repeated stretching, cutting, and stacking of the solutions.49–52 However, if the wall contact of a phase is to be avoided, cutting as required for the baker's transformation is not feasible in a microfluidic mixer (Fig. 1). Recently, a concept of a microfluidic mixer based on the Smale horseshoe transformation,50 where the cutting is replaced by folding, was introduced, but wall contacts of both phases still occur in the described geometry.53
We recently reported on a coaxial lamination mixer (CLM) with channel geometries preventing material–wall interactions while ensuring efficient and fast mixing.54 This unique micromixer, fabricated using two-photon polymerization (2PP), includes inlet filters, a nozzle for coaxial injection, and a series of coaxial lamination elements that increase the interfacial area and reduce the layer thickness of the organic phase. Nanodispersions with castor oil and the hard fat Softisan® 100 with particle sizes between 56 nm and 115 nm and polydispersity indices between 0.04 and 0.12 can be prepared with the CLM system. Fouling can be completely prevented by the CLM system within a wider range of flow conditions, but can still occur at high flow rates above 200 μl min−1 and at flow ratios of organic phase to total flow rate above 15%. Processing hard fat at a concentration of 5 mg ml−1 produced material deposits growing at the injection nozzle.
To solve the remaining limitations in microfluidic nanoparticle precipitation and to fully exploit the potential of microfluidics, the present work is based on a completely novel micromixer concept that appears to be feasible by means of 2PP. 3D mixing elements inducing Smale horseshoe transformation offer the possibility of extending the operating window for stable high throughput production of LNPs without sacrificing the major advantage of CLM, which is that wall contacts for the organic lipid solution are avoided. Moreover, a protective fluidic shield layer promises to prevent even the initial contact with the nozzle outlet that was previously identified as the critical area for fouling.
2 Materials and methods
2.1 Femtosecond laser ablation and two-photon polymerization
Borofloat® 33 borosilicate glass (Schott, Mainz, Germany) in the form of 4-inch wafers, was used as the base substrate for the 3D printed channel system. A femtosecond laser system (microSTRUCT c, 3D Micromac AG, Chemnitz, Germany) was used to subdivide the wafer into individual chips after the surface was partially roughened, through holes were created and alignment marks for the 2PP were engraved. Roughening of the glass surface was found necessary for good adhesion of 2PP printed structures. A 2PP system (Photonic Professional GT1, Nanoscribe GmbH, Eggenstein-Leopoldshafen, Germany) equipped with a 25× magnification objective lens (LCI “Plan-Neofluar” 25×/0.8 Imm Korr Ph2, Zeiss, Jena, Germany) was used to 3D print the channel system by dip-in lithography, in which the objective lens is immersed in the resist.IP-S (Nanoscribe GmbH), a negative-tone resist developed for 2PP, was chosen as the print material, which had a high transparency and hydrophobic surface properties after polymerization. Printing time of a channel system ranged from 14 to 17 hours, depending on the channel design but can in future be reduced with the installation of the next generation of the 2PP device (Photonic Professional GT2, Nanoscribe GmbH). After 2PP printing was complete, any remaining resist on the substrate was removed in a 70 °C developer bath (mr-Dev 600, micro resist technology GmbH, Berlin, Germany), while any remaining resist in the channel system was flushed out by forcing the developer through the substrate inlets. Using a hotplate, the channel system was dried and post-cured at 190 °C for 10 min. Lastly, a UV adhesive (Blufixx PW, Blufixx GmbH, Wesseling, Germany) was cast over the channel system and cured to stabilize and protect the microchannel system from external mechanical stresses or impacts. A more detailed description is given in our previous work.54
2.2 Design of the horseshoe lamination mixers
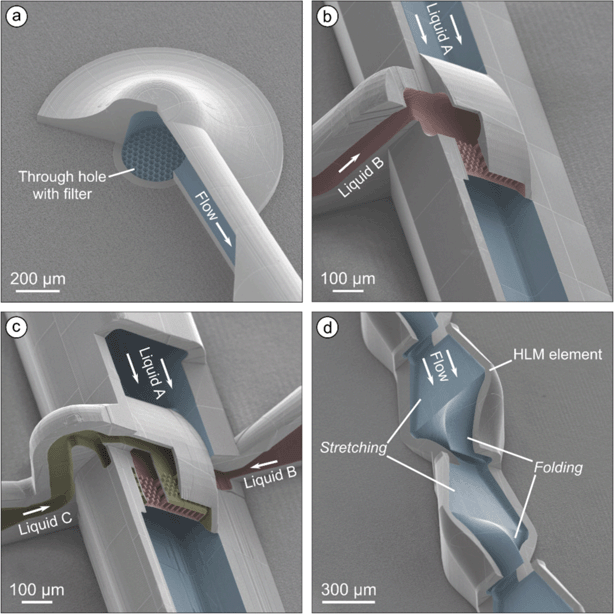
The coaxial lamination mixer (CLM) in the previous work54 allowed fouling-free precipitation at flow rates not exceeding 200 μl min−1. This limited the throughput of the system. The stretching and folding occurs simultaneously in the CLM making the shape and position of the organic phase lamellae not ideally controllable. This resulted in non-uniform diffusion lengths and a closer approach to the channel walls. The horseshoe lamination mixer is therefore designed to separate the stretch and fold processes in time and space.The horseshoe lamination mixers (HLM) consist of a main channel between the through glass inlet and outlet holes. The inlets are equipped with 2PP printed filter discs with a pore diameter of 20 μm (Fig. 2a) providing protection against particles that can cause clogging of the system.54 The channel initially has a round cross-sectional shape with an inner diameter of 200 μm and changes into a rectangular shape after 1 mm. Two systems, A (ESI:† system A view) and B (ESI:† system B view), were designed with slightly different flow focusing sections.
In system A, the rectangular main channel has cross-sectional dimensions in height and width of 200 μm × 250 μm and holds a wing-shaped nozzle, which is supplied through a single side channel (Fig. 2b; ESI:† Video S1). For injecting the organic phase (liquid B), the nozzle with a rectangular opening in height and width of 30 × 200 μm contains a grid of pillars each with a size of 5 μm × 10 μm arranged with a distance of 13.6 μm to each other. The pillars act both as a support structure for the thin wall of the nozzle and as a diffuser to homogenize hydrodynamic pressure and flow velocity, thus achieving a symmetric injection of the organic phase into the main channel.
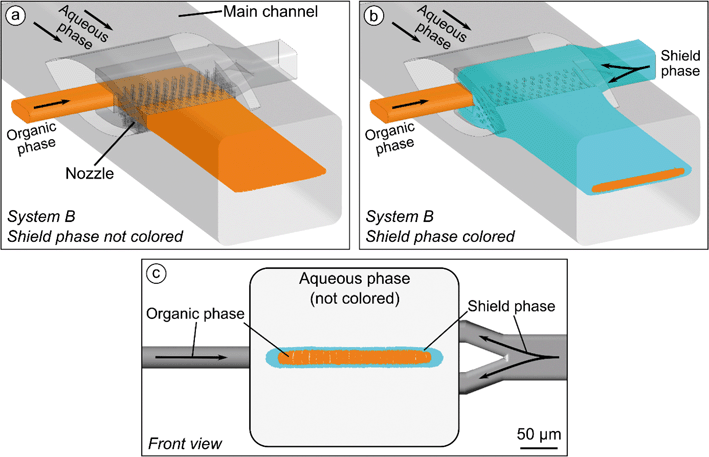
System B has a main channel with a cross-sectional dimension in height and width of 240 × 280 μm (Fig. 2c). The organic phase (liquid B) enters the system through an inlet from one side and is injected through a wing-shaped nozzle with a rectangular opening in height and width of 30 × 200 μm. An additional shield phase (fluidic shield layer, liquid C) comes from the opposite side and is injected to the main channel through a 15 μm wide opening, which completely encloses the injection region of the organic phase. The ring-nozzle for this shield phase contains homogenization pillars of the same geometry and spacing as in the organic phase nozzle.
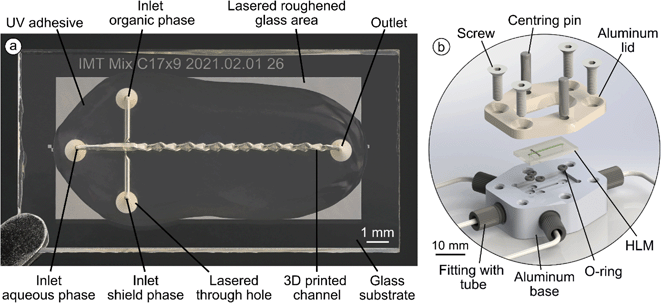
In both systems, a series of thirteen consecutive horseshoe lamination mixing (HLM) elements, each with a length of 650 μm, is located behind the flow focusing section (Fig. 2d). In the first part of these elements, the stretching of the liquid takes place by a transition of channel geometry from a rectangular shape of 250 × 100 μm (width and height), to an hourglass shape with a width of 500 μm and a height of 47.5 μm at the sides and 25 μm in the center. In the second part, the channel is folded and assumes a rectangular shape with the same dimensions as at the beginning of the HLM element. The repetitive stretching and folding achieves a continuous increase in surface area between the organic and aqueous phase while simultaneously decreasing the layer thickness of the organic phase. This results in intensified diffusion, and thus, faster mixing. The developed HLM design provides very smooth 3D transition geometries and enables mixing in a very compact format but suitable for increased throughput. The borofloat silicate glass with through holes for the inlets and outlet secures the necessary stability of the 3D printed system (Fig. 3a). The holes of the main channel inlet and the outlet are positioned at a distance of 11.6 mm to each other.
2.3 Flow characterization
∇·![[u with combining right harpoon above (vector)]](https://www.rsc.org/images/entities/i_char_0075_20d1.gif) = 0 = 0 | (2.1) |
ρ![[u with combining right harpoon above (vector)]](https://www.rsc.org/images/entities/i_char_0075_20d1.gif) ·∇ ·∇![[u with combining right harpoon above (vector)]](https://www.rsc.org/images/entities/i_char_0075_20d1.gif) = −∇p + μ∇2 = −∇p + μ∇2![[u with combining right harpoon above (vector)]](https://www.rsc.org/images/entities/i_char_0075_20d1.gif) | (2.2) |
![[u with combining right harpoon above (vector)]](https://www.rsc.org/images/entities/i_char_0075_20d1.gif) denotes the velocity vector, ρ the fluid density, μ the dynamic viscosity, p the pressure. Mixing of fluids is assumed to be an isothermal process which is analyzed by determining the solute concentration c in the system based on the convection–diffusion eqn (2.3).55
denotes the velocity vector, ρ the fluid density, μ the dynamic viscosity, p the pressure. Mixing of fluids is assumed to be an isothermal process which is analyzed by determining the solute concentration c in the system based on the convection–diffusion eqn (2.3).55![[u with combining right harpoon above (vector)]](https://www.rsc.org/images/entities/i_char_0075_20d1.gif) ·∇c = D∇2c ·∇c = D∇2c | (2.3) |
The computer-aided design of the HLM was discretized by 3D tetrahedral elements with inflation layers. The mesh size was confirmed by mesh convergence observed behind the first two HLM elements (ESI:† Mesh Benchmark and validation for the simulation of concentration distribution, Table S1). The calculation of the numerical analysis was carried out in double precision mode. For the solution methods, the algorithm SIMPLEC (semi implicit pressure linked equation-consistent) was selected coupling pressure and velocity fields. For the calculation the Green-Gauss node mode was used for the gradient discretization, the spatial discretization PRESTO! (PREssure STaggering Option) scheme for the spatial pressure discretization and the third-order MUSCL (Monotonic Upstream-centered Scheme for Conservation Laws) scheme for the momentum equation were used.
The mixing quality was quantitatively determined at cross-sectional planes normal to the flow direction between the HLM elements using the mixing index:56,57
 | (2.4) |
 | (2.5) |
![[C with combining macron]](https://www.rsc.org/images/entities/i_char_0043_0304.gif) the concentration averaged over the cross-section. σmax is the maximal standard deviation of the concentration at the specified cross-section along the channel:57
the concentration averaged over the cross-section. σmax is the maximal standard deviation of the concentration at the specified cross-section along the channel:57σmax = ![[C with combining macron]](https://www.rsc.org/images/entities/i_char_0043_0304.gif) (1 − (1 − ![[C with combining macron]](https://www.rsc.org/images/entities/i_char_0043_0304.gif) ) ) | (2.6) |
 | (2.7) |
 | (2.8) |
2.4 Preparation of nanoparticles
| Ethanolic castor oil solution | Ethanolic Softisan® 100 solution | ||
|---|---|---|---|
| Castor oil | Polysorbate 80 | Softisan® 100 | Polysorbate 80 |
| 5 mg ml−1 | 2.5 mg ml−1 | 2 mg ml−1 | 1 mg ml−1 |
| 10 mg ml−1 | 5 mg ml−1 | 5 mg ml−1 | 2.5 mg ml−1 |
| 20 mg ml−1 | 10 mg ml−1 | ||
| 40 mg ml−1 | 20 mg ml−1 | ||
The ethanolic solutions and the purified water were filtered with a 0.2 μm syringe filter Puradisc 25 TF (WhatmanTM, 0.2 μm polytetrafluoroethylene, GE Healthcare UK) prior to use. The precipitation of Softisan® 100 nanoparticles leads to nanodispersions in which the particles are present as a supercooled melt.60 For this reason, the systems are referred to here as nanodispersions rather than solid lipid nanoparticles. The nanodispersions were stored in the dark at room temperature.
For nanoparticle preparation with system A and different lipid solutions, the total flow rates QT of 100 μl min−1, 200 μl min−1, 400 μl min−1, 800 μl min−1, and 1600 μl min−1 as well as the flow rate ratios φOP of 5%, 10%, and 20% were used. At higher φOP, the nanodispersion may become unstable due to the resulting high content of solvent.34
With system B, QT and φOP were fixed at 100 μl min−1 and 10%, respectively, while flow rate ratios of the shield phase φSP of 1%, 3%, 5%, and 7% were used. The resulting flow rates for each phase can be obtained from the ESI† (Table S2). The increase of φSP causes an increase of the overall ethanol concentration in the nanodispersions. φOP was kept fixed to keep the inflow of the organic phase and thus its layer thickness constant. In a second experiment, φOP was fixed at 10% and flow rates QT of 100 μl min−1, 200 μl min−1, 400 μl min−1, and 800 μl min−1 were set. φSP of 3% and 5% were used for 2 mg ml−1 and 5 mg ml−1 Softisan® 100, respectively.
2.5 Dynamic light scattering (DLS)
The z-average value and polydispersity index (PDI) of the nanodispersions were determined by dynamic light scattering using a Nanoseries ZS Zetasizer (Malvern Instruments, Malvern, United Kingdom). The z-average represents the intensity-weighted hydrodynamic diameter of the particles. Prior to the measurements, the nanodispersions were diluted with purified water, which had been filtered with a 0.2 μm syringe filter (Whatman® Puradisc 25). The dilution of the samples was adjusted according to the used flow rate ratios φOP and φSP. This ensured that a constant concentration of solvent was present in all cuvette samples. A polystyrene cuvette (Omnilab GmbH, Bremen, Germany) contained 1 ml of sample, which was initially equilibrated in the Zetasizer for 5 minutes at 25 °C and then measured three times at a backscatter angle of 173° for 120 s. Particle size parameters were calculated assuming a dynamic viscosity of 0.8872 mPas and a refractive index of 1.330 for water at 25 °C. The obtained z-average values are expected to be slightly underestimated when the influence of the solvent on the viscosity is neglegted.45 The samples were measured within two days of their preparation. For comparison with the results from cryo-SEM, the number-weighted diameter was calculated in the Zetasizer on the basis of the Mie theory,61 assuming a refractive index of 1.46 representative for triglyceride particles (imaginary part 0.01).62For samples prepared with system A at the flow rate ratios φOP of 5%, 10%, and 20%, the cuvette was loaded with 400 μl, 200 μl, and 100 μl of nanodispersion, respectively, and filled up to 1 ml with purified water. For samples from system B and with both used lipids, the cuvette was loaded with 182 μl, 154 μl, 133 μl, and 118 μl for the flow rate ratios (φOP + φSP) 11%, 13%, 15%, and 17%, respectively, and filled up to 1 ml with purified water.
2.6 Electron microscopy
The microchannel components were coated with a thin gold layer before they were imaged by scanning electron microscopy (SEM; Phenom XL, LOT-QuantumDesign GmbH, Darmstadt, Germany) at 10 kV accelerating voltage using the backscattered electron detector.Nanodispersions were investigated with cryo-SEM. The samples were frozen using a high-pressure freezer (Leica EM ICE, Leica Microsystems GmbH, Wetzlar, Germany) with liquid nitrogen at 2 × 10⁸ Pa. In a high-vacuum coater (Leica EM ACE600, Leica Microsystems GmbH, Wetzlar, Germany) at −150 °C, the samples were freeze-fractured with a knife and partially sublimated to remove the water–ethanol mixture in order to expose the emulsion droplets. The surface was sputtered with a 4 nm platinum layer. The micrographs were taken in cracks of the platinum layer, as better particle imaging was observed in these areas. The freeze-fractured nanodispersions were imaged by Cryo-SEM (Helios G4 CX, Thermo Fisher Scientific, Waltham, USA) at 2 kV accelerating voltage using the immersion mode. Nanodispersions were investigated after three weeks of preparation.
3 Results and discussion
3.1 Characterization of two-phase flow (system A)
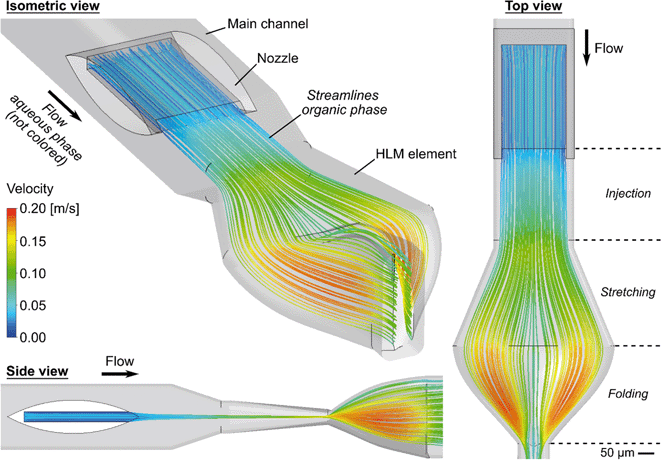
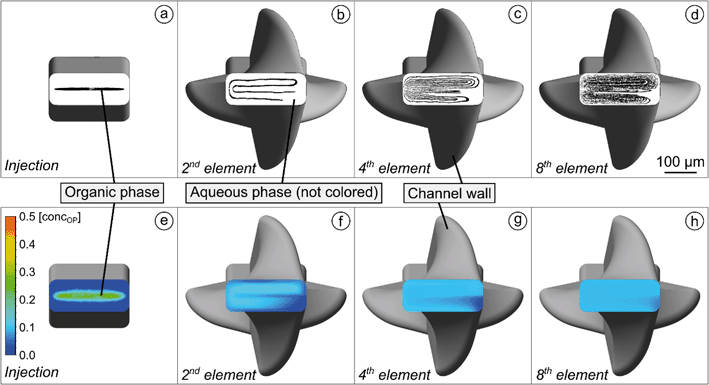
To ensure accurate results in the simulation of the concentration distribution based on the convection–diffusion eqn (2.3) a meshing convergence analysis and a validation by a simplified experiment were performed (ESI:† Mesh Benchmark and validation for the simulation of concentration distribution). Fig. 5e–h illustrate simulations of the organic phase concentration distributions in system A, taking interdiffusion into account. In Fig. 5e, the position of the cross-sectional image was set right before the first HLM element. The concentration of the organic phase in its core has reduced to below 0.4. The homogenization increases with each element, and after eight elements, a practically uniform distribution of the organic phase is reached.
However, a small area with lower concentration of the organic phase can still be observed in the channel, which remains even after the eighth HLM element. In the lower right corner of the channel in Fig. 5b, the region is not occupied by the streamlines of the organic phase, and this corner is not reached by diffusion as can be seen in Fig. 5f. The HLM elements that force the folding each have a symmetrical structure, but after the first folding the cross sectional loop is closed on one side and open at the other. As a consequence, these ends of the organic phase experience a slightly different local volume flow (ESI:† Video S2). This repeats for each element and leads to this small area that the organic phase reaches in a delayed manner and that will probably not contribute to precipitation. Nevertheless, the uniform concentration for a large part of the cross-section proves that mixing is mainly determined by the stretching and folding of the organic phase.
The simulation reveals that the undiluted organic phase does not touch the channel walls during the stretching or folding process. The layer of organic phase and the wall only get closer with each pass through an HLM element (ESI:† Video S2). As long as precipitation of LNPs consumes the lipid content before diffusion reaches the walls, no fouling should be expected.
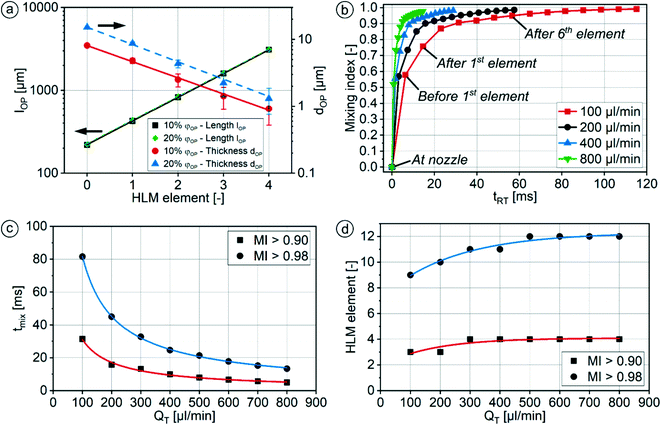
Fig. 6b shows the mixing index in dependence on the influence of the elapsed residence time tRT for different QT. The data points in the curves indicate a cross-sectional plane after each HLM element. MI = 0 is obtained when the mixing has not started, while MI = 1 means the absence of any concentration gradients in the cross-sectional plane. The mixing increases steadily, but the progression of mixing slows down with each element. On one hand, the nozzle with its high aspect ratio and the HLM elements are designed to promote initially fast diffusion between the phases, which decreases with the reduction of concentration gradient in time.66 On the other hand, the HLM elements prevent early contact of the organic phase with the channel wall. Additionally, only a small spot with a lower concentration of the organic phase remains even after the eighth element (Fig. 5d). It is located where the folded lines do not reach.
At higher QT, a smaller mixing index is achieved after the same number of HLM elements, because less time is given for diffusion. As a result, more elements have to be passed before mixing is completed. However, this is compensated by the shorter elapsed residence time tRT of the solutions in the channel at higher QT, and results in a shorter mixing time nevertheless (Fig. 6c). The simulations show that good mixing (MI > 0.9) is obtained after 31 ms, 16 ms, 10 ms and 5 ms for the flow rates 100 μl min−1, 200 μl min−1, 400 μl min−1 and 800 ml min−1, respectively. Lower flow rate ratios φOP would further reduce the mixing time due to the lower thickness of the organic phase layer.
The number of HLM elements required to reach mixing indices higher than 0.90 or 0.98 (saturation value for MI) in dependence on QT is given in Fig. 6d (detailed values in ESI:† Table S3). It can be obtained, regardless of QT, good mixing (MI > 0.9) can already be achieved with only four elements, while nearly perfect mixing can be reached with all thirteen HLM elements. This applies with φOP of 10%, and with the flow conditions considered in the simulations, i.e., without formation of secondary flows at high Reynolds numbers.
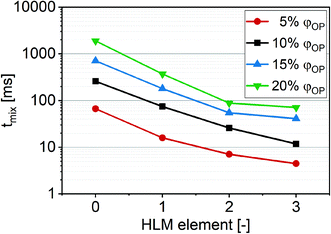 | ||
| Fig. 7 Mixing time tmix experimentally observed with iodine solution in sodium thiosulfate solution depending on the number of HLM elements inside a channel. φOP were set at 5%, 10%, 15% and 20%. | ||
During the folding process, parts of the organic phase layer at the folding point remained thicker than the average. These thicker parts were more expressed at higher φOP in the simulations (data not shown) and showed in the microscope in the form of stripe-like streams of the iodine solution at higher QT, where diffusion at the observation point was not completed. The resulting slower diffusion explains why the decrease in mixing time was lower at the ratios φOP of 15% and 20% from the transition of a system of two to three HLM elements.
While tmix obtained from simulations indicates good mixing after 10 ms (MI > 0.9) at a φOP of 10% with QT of 400 μl min−1 after the third HLM element (Fig. 6b–d, ESI:† Table S3), the experiment revealed complete mixing at 13 ms at a φOP of 10% with QT of 410 μl min−1 after the third HLM element (Fig. 7, ESI:† Table S4).
3.2 Lipid nanoparticle preparation in two-phase flow (system A)
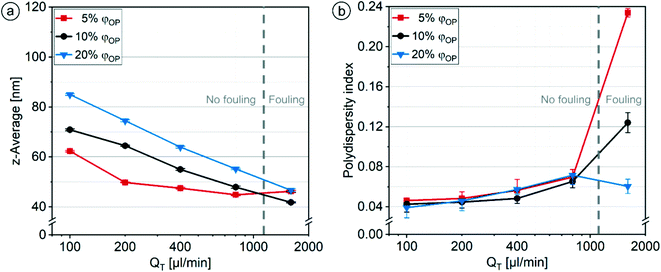
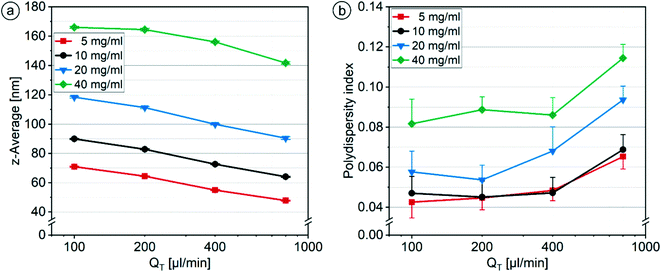
The standard deviations obtained through n = 3 experiments for the particle sizes (0.1–0.5 nm) and the PDI values (0.003–0.010) were very small. A respective doubling of φOP from 5% to 10% and to 20% led to a stepwise increase in particle size by an average factor of 1.17 for all QT below 800 μl min−1 (Fig. 8a). Due to the increasing layer thickness dOP with increasing φOP, the concentration of solvent and lipid in the channel increases, and longer diffusion and mixing times are required. This leads to a slower supersaturation of the lipid, a lower nucleation rate and thus a stronger growth phase causing the formation of larger particles.68
The PDI values increased slightly and steadily with increasing QT until they varied strongly between different φOP at a QT of 1600 μl min−1 (Fig. 8b). At and below 800 μl min−1, the PDI values did not differ significantly between the ratios φOP. Different effects could be responsible for the slow increase of PDI values with increasing QT. At higher QT, the organic phase flows through more HLM elements before reaching complete diffusion. The simulations reveal a decreasing distance of the organic phase from the wall surfaces with each additional HLM element, causing parts of the organic solution to flow more slowly through the channel because of non-slip conditions at the wall. Additionally, the variance in the layer thickness of the organic phase increases with each element due to accumulations of the organic phase at the folding points (section 3.1.1). Both effects lead to higher variance in the speed of mixing and a broader particle size distribution.69
Compared to our previous work,54 the HLM system offers the possibility of using higher lipid concentrations while achieving smaller particle sizes and more narrow size distributions. Calculating the production efficiency of the HLM system in the form of lipid processing per hour with the consideration that the PDI should be below 0.07 for monodisperse spherical particles and assuming that all lipid precipitates as nanodroplets with a size below 200 nm, this new mixer can process 48 mg h−1 (ESI:† Table S5). Compared to our previous work with the CLM and under identical conditions, this results in a 4-fold increase in productivity.
The simulation shows that at a QT of 1600 μl min−1, the organic phase at the folded open ends appears slightly bent over and is in contact with the channel wall (Fig. 10b). The design of the HLM elements causes a helical rotation of the fluids. In the elements at the open ends, centrifugal forces may cause a Dean effect during the folding at sufficiently high flow rates, forming a secondary flow.4,71,72 The dimensionless Dean number can be used to characterize the strength of the secondary flow in the curved channel and is defined as,  where Re is the Reynolds number (Re = u·dhydr/ν), u the average velocity of the liquids, dhydr the hydraulic diameter of the channel, R the radius of curvature, and ν the kinematic viscosity. The lateral ends of the channel lie on a helical path whose radius varies, and locally reaches a minimum value of R = 300 μm. For QT = 1600 μl min−1, this results in a Reynolds number of 102 with νWater = 1 mm2 s−1, u = 1.48 m s−1, dhydr = 68.8 μm and a Dean number of 35. In the literature, a formation of secondary vortices in the channel with a Reynolds number and a Dean number in this range is described.73,74 The centrifugal forces start to affect the streamlines of the organic phase above 100 μl min−1, while at 100 μl min−1 and below the streamlines remain unchanged (ESI:† Fig. S5).
To avoid such secondary vortices, either the width of the nozzle can be reduced to avoid the organic phase approaching the channel ends, or the HLM element must be redesigned with a larger radius of curvature during the folding. Simulations with an adapted nozzle and an HLM element, whose folding section was extended by a factor of 4 in distance, show improved flow conditions without contact of the organic phase with the channel wall at QT of 3200 μl min−1 and φOP of 5% (ESI:† Video S3). By this extension of the folding section in the HLM element, the Dean number is reduced by a factor of 3.3. Nanoparticle preparations were not performed using the system with extended HLM element, but all following results were still obtained with the HLM element from section 2.2.
While fouling was very clearly pronounced at a φOP of 5%, only minor fouling with larger isolated microdroplets was observed at a φOP of 20%. The dynamic viscosity of an ethanol–water mixture with 20 vol% ethanol is around 1.6 times higher than of water.75 This provides a more stable laminar flow characterized by a lower Reynolds number and thus a lower Dean effect. The simulations show that the contact of the organic phase with the channel wall is slightly lower at a φOP of 20% than with 5% (data not shown). However, since in the simulations the viscosity of the mixed fluid is linearly interpolated between the values of the pure phases, it is difficult to assess how strong this trend is in reality.
When preparing nanodispersions with castor oil at a concentration of 10 mg ml−1 and above, fouling accumulated slightly on the injection nozzle (Fig. 11a). First deposits formed at the lateral ends of the nozzle, which grew over time. The processing of solid lipids poses an even higher risk of fouling since solid deposits on channel walls will be more stable. Nanoprecipitation with Softisan® 100 revealed fouling directly at the nozzle but not at any of the HLM elements when QT was smaller than 1600 μl min−1 (Fig. 11b; ESI:† Video S5). Fouling started at the nozzle edge and grew along the interface between the aqueous and organic phases. As growth continued, a tubular structure with decreasing diameter formed, which strongly influenced the mixing process. To prevent the accumulation of fouling on the nozzle, a nozzle with a fluidic shield layer (system B) was developed to enclose the organic phase.
3.3 Microfluidic characterization of three-phase flow (system B)
Simulation of the injection of three phases in system B confirms a complete enclosure of the organic phase by the shield phase (Fig. 12a and b). The thickness of the enclosing shield phase depends on the flow rate ratio φSP of the shield phase. The lateral ends of the shield phase reveal a greater thickness than its upper and lower sides (Fig. 12c). When the shield phase is injected into the main channel, its width is increased due to height compression by the surrounding aqueous phase. While the uniform distribution of the shield phase decreases if the pillar density in the nozzle is too low, a too high density runs the risk of not being able to clean the channel from the residual photoresist when the system is printed with 2PP. The number and distribution of pillars in the nozzle was chosen to ensure a sufficiently uniform distribution of the shield phase around the organic phase. Simulations showed that the patterns of the subsequent stretching and folding by the HLM elements did not show any obvious differences compared to system A.3.4 Comparison of two-phase flow (system A) with three-phase flow (system B)
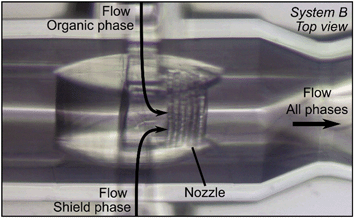 | ||
| Fig. 13 Microscopic image of the nozzle of system B during the precipitation process of 5 mg ml−1 Softisan® 100 after 9 min operation. The total flow rate QT was set to 100 μl min−1 and the flow rate ratios φOP and φSP were set to 10% and 5%, respectively. No fouling was visible in contrast to system A (Fig. 11b). | ||
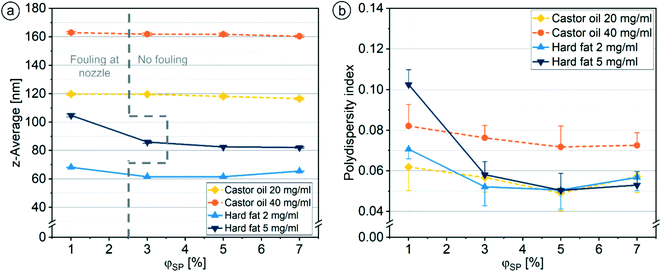
The additional shield phase will slightly slow down the mixing with the aqueous phase and will cause an increase of the total concentration of solvent in the nanodispersion. A too high solvent fraction may reduce long-term stability of the nanodispersion. Therefore, the addition of shield phase should be kept to the minimum necessary to prevent fouling in the channel system. The flow rate ratio φSP of the shield phase was varied to determine the limit of fouling suppression. The risk of fouling increases with higher lipid concentration in the organic phase. The intensity of fouling decreased rapidly with increasing φSP, until at φSP of 3%, no fouling could be detected using 20 mg ml−1 and 40 mg ml−1 castor oil solutions and with 2 mg ml−1 Softisan® 100 solution. φSP of 5% was necessary to prevent fouling when using the 5 mg ml−1 Softisan® 100 solution. Interestingly, fouling, at too low φSP, formed only on one side of the nozzle, specifically on the opposite side of the inlet for the shield phase. This implies that the organic or shield phase did not flow into the main channel with a perfectly uniform distribution (as predicted by the simulation), but rather followed the path of least resistance from the inlet to the opening of the nozzle. In the simulation, the velocity distributions in the nozzle show that the organic and shield phases leave the nozzle 7% and 2% faster on the side of their respective inlets. Optimizations of the pillar arrangement in the nozzle and the nozzle ring opening could improve the distribution of the shield phase around the organic phase and, thus, fouling might be prevented even at smaller φSP.
The results show that the shield phase further improved the performance of the HLM system, especially when solid lipids were precipitated. The suppression of fouling and improved quality of the nanoparticle dispersions demonstrate that flow focusing is a crucial factor for the stable production of lipid nanoparticles with narrow size distribution.
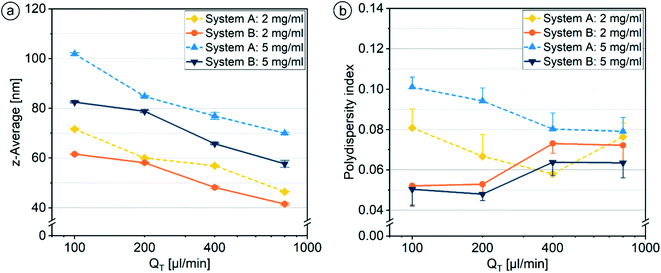
For both systems under investigation, the z-average values continuously decreased with increasing QT for all Softisan® 100 concentrations (Fig. 15a), while the nanoparticles without using a shield phase were up to 19 nm larger. For both Softisan® 100 concentrations and with increasing QT, PDI values decreased with system A and increased with system B. Fouling was observed to be lower when higher flow rates were used in system A, possibly due to higher shear stress at the nozzle and thus less change in flow conditions. The increase of the PDI with increasing QT for system B with Softisan® 100 showed a similar trend as the increase of the PDI for system A with castor oil (section 3.2.1), but was a bit stronger (Fig. 15b). The additional fluidic shield layer surrounding the organic phase acts as an additional barrier through which the organic and aqueous phase must diffuse. If the enclosure of the organic phase is not uniform, this variance can add to the variance caused by the stretching and folding process (section 3.1.2) when more HLM elements must be passed as QT increases, resulting in a higher PDI at higher QT.
3.5 Electron microscopic evaluation of cryo-stabilized nanodispersions
Fig. 16 presents the cryo-SEM images of a castor oil (Fig. 16a) and a Softisan® 100 nanodispersion (Fig. 16b). In addition to clearly (almost fully) visible emulsion droplets, some droplets protrude partially out of the surface only with their crests and appear to have a diameter of a few nanometers. During sublimation of the aqueous phase, individual emulsion droplets penetrate the surface until they are completely exposed. Additionally, larger clusters of agglomerates with lengths of up to 300 nm can be seen in the images. Intensity-weighted particle size distributions from DLS measurements that are especially appropriate to detect larger particle size fractions gave no hint for the presence of agglomerates with sizes around 300 nm. Previous work proved short-term stability of comparable nanodispersions.34,54 Thus, agglomerates may have formed during sample preparation. Cryo-TEM, which uses a different sample preparation technique, could be helpful to clarify whether such nanodispersions contain agglomerates or not.79The nanodroplets appear to be homogeneous in size with a roundish shape. The evaluation of 160 castor oil droplets and 100 Softisan droplets from several micrographs (disregarding still embedded particles and agglomerates) reveals diameters of 52 ± 7 nm for castor oil and 69 ± 9 nm for Softisan® 100 nanodroplets. Compared to the DLS results discussed above, the castor oil (Fig. 8a) and Softisan® 100 particles (Fig. 15a) are 10 nm and 14 nm smaller, respectively, according to cryo-SEM. In the routine evaluation of the DLS measurements, the intensity-weighted hydrodynamic diameter of the particles was obtained, while the evaluation of the cryo-SEM images yielded a number-weighted distribution. Thus, the measured z-average values may be slightly larger.80 When the number-weighted hydrodynamic diameter is calculated for the respective DLS measurements, a mean particle size of 48 nm is obtained for the castor oil and 64 nm for the Softisan® 100 nanoparticles. As described in section 2.5, a slight underestimation of the particle size measured by DLS is to be expected for the samples examined here since the presence of ethanol was neglected in the evaluation. Overall, the particle sizes from cryo-SEM and DLS can thus be considered as in good consistence.
4 Conclusions and outlook
A novel horseshoe lamination mixer (HLM) was designed and 3D printed on a glass substrate by two-photon polymerization, which offers the necessary 3D resolution to realize such complex 3D structures of the injection and HLM elements. Typical printing times of several hours per system, depending on the resolution and scanning strategy, currently make mass production impractical. But there is currently no other manufacturing technology for such small 3D structures. The complexity of the 3D structures does not allow microfabrication by injection molding, conventional lithographic or by soft-lithography. However, improving the speed of 2PP processing is an active field in the further industrial development of this technology. The performance of the HLM was demonstrated for antisolvent precipitation to produce lipid nanodispersions containing either castor oil or Softisan® 100 as potential drug carrier material. The central injection of the organic phase, leading to a thin layer, ensures a large contact interface between the liquid phases, while avoiding contact of the organic phase with the channel wall. Subsequently, HLM elements further enlarge the contact interface and enhance diffusive mixing between organic and aqueous phase. Each HLM element consists of a stretching section and a folding section. When passing a series of thirteen HLM elements in one mixing channel, the organic solution is folded into layers, the number of which doubles with each HLM element. The HLM system results in mixing times below 10 ms after three HLM elements. Moreover, the contact of the organic phase with the channel walls is completely prevented within a range of flow conditions. By the introduction of an additional phase via a second nozzle, the organic lipid phase is completely enclosed with a fluidic shield layer before contact with the aqueous phase. A minimum flow rate ratio of this shield phase is necessary for a complete enclosure of the organic phase and successful prevention of fouling on the nozzle surface. This enables the fouling-free use of castor oil and Softisan® 100 in a wider operational window including higher lipid concentrations. In the case of Softisan® 100, use of the shield phase further reduces the particle size compared to the system without the shield phase. Castor oil or Softisan® 100 nanoparticles can be obtained with the HLM system with particle sizes ranging from 42 nm to 166 nm within the optimal flow conditions and without fouling. PDI values between 0.04 to 0.11 indicate narrow up to monodisperse particle size distributions.Higher flow rate ratios do not widen the particle size distribution. Additionally, the repeated production of samples displays excellent reproducibility. The, in part, extraordinarily small particle sizes obtained suggest that the use of even higher lipid concentrations may also result in particle sizes below 200 nm. In consequence, the lipid content of the nanodispersions would be increased, probably leading to a reduced effort for sample concentration up to lipid contents desired for pharmaceutical applications. The HLM system provides a fouling-free operation range up to 800 μl min−1 across flow rate ratios from 5% to 20% organic lipid phase. This extends the optimal range of our previous micromixer, the coaxial lamination mixer (CLM), which is mainly restricted to total flow rates up to 200 μl min−1 and flow rate ratios up to 15%. The improved total flow rate also corresponds to an increased throughput of the systems, which can be extended further with suggested design optimizations. Moreover, the use of higher concentrations of castor oil and Softisan® 100 in the organic phase than in the CLM is successful with the HLM system. When using equal lipid concentrations and flow rate ratios, smaller particles with narrower size distributions are obtained in the HLM system. While lipid nanoparticles with similar sizes have already been generated in other micromixers, comparably narrow particle size distributions with simultaneous high throughput have, to our knowledge, never been achieved with microfluidic processes so far. The performance and high practical benefits of the HLM system are also demonstrated by the fact that stable long-term production is possible with complete avoidance of fouling.
Future work should include simulations that allow nonlinear interpolation of the properties of the mixture, which could help for designing optimized HLM elements for operation at higher flow rates without the occurrence of secondary vortices. To further increase throughput by an order of magnitude or more one should demonstrate the parallelization of such mixing systems. A microfluidic glass chip with integrated channels for uniform partitioning into multiple parallel mixing channels combined with several flow focusing nozzles as well as HLM elements can be realized by combining femtosecond laser structuring of glass with 2PP printing. Such hybrid systems could further increase the productivity of microfluidic nanoparticle precipitation many times over without the need to increase the number of feed pumps.
Author contributions
Peer Erfle: conceptualization, investigation, methodology, visualization, writing – original draft, writing – review & editing. Juliane Riewe: conceptualization, methodology, writing – review & editing. Songtao Cai: methodology, investigation, writing – review & editing. Heike Bunjes: conceptualization, supervision, writing – review & editing. Andreas Dietzel: conceptualization, supervision, writing – review & editing.Conflicts of interest
There are no conflicts to declare.Acknowledgements
P. Erfle acknowledges financial support from the ‘QUANOMET-Niedersächsische Wissenschaftsallianz’ provided by the Ministry of Science and Culture (MWK) of Lower Saxony (Germany) and the technical support for the cryo-SEM evaluation by Bogdan Semenenko of the Institute for Particle Technology, Technische Universität Braunschweig. J. Riewe acknowledges financial support from Boehringer Ingelheim and the MWK of Lower Saxony within the graduate program “μ Props – Processing of Poorly Soluble Drugs at Small Scale”. This work has been carried out within the framework of the SMART BIOTECS alliance between Technische Universität Braunschweig and Leibniz Universität Hannover, an initiative supported by the MWK of Lower Saxony.References
- N.-T. Nguyen, Micromixers. Fundamentals, design and fabrication, William Andrew, Norwich, NY, 2008 Search PubMed.
- C.-Y. Lee, C.-L. Chang, Y.-N. Wang and L.-M. Fu, Microfluidic mixing: a review, Int. J. Mol. Sci., 2011, 12, 3263–3287, DOI:10.3390/ijms12053263.
- A. Bohr, S. Colombo and H. Jensen, in Microfluidics for pharmaceutical applications, ed. H. A. Santos, D. Liu and H. Zhang, Elsevier, Amsterdam, 2019, pp. 425–465 Search PubMed.
- A. Dietzel, in Microsystems for Pharmatechnology, ed. A. Dietzel, Springer International Publishing, Cham, 2016, pp. 1–21 Search PubMed.
- V. Hessel, H. Löwe and F. Schönfeld, Micromixers - A review on passive and active mixing principles, Chem. Eng. Sci., 2005, 60, 2479–2501, DOI:10.1016/j.ces.2004.11.033.
- S. Streck, L. Hong, B. J. Boyd and A. McDowell, Microfluidics for the Production of Nanomedicines: Considerations for Polymer and Lipid-based Systems, Pharm. Nanotechnol., 2019, 7, 423–443, DOI:10.2174/2211738507666191019154815.
- R. Karnik, F. Gu, P. Basto, C. Cannizzaro, L. Dean, W. Kyei-Manu, R. Langer and O. C. Farokhzad, Microfluidic platform for controlled synthesis of polymeric nanoparticles, Nano Lett., 2008, 8, 2906–2912, DOI:10.1021/nl801736q.
- T. Lorenz, S. Bojko, H. Bunjes and A. Dietzel, An inert 3D emulsification device for individual precipitation and concentration of amorphous drug nanoparticles, Lab Chip, 2018, 18, 627–638, 10.1039/c7lc01313b.
- H. S. M. Ali, P. York and N. Blagden, Preparation of hydrocortisone nanosuspension through a bottom-up nanoprecipitation technique using microfluidic reactors, Int. J. Pharm., 2009, 375, 107–113, DOI:10.1016/j.ijpharm.2009.03.029.
- V. M. Shah, D. X. Nguyen, P. Patel, B. Cote, A. Al-Fatease, Y. Pham, M. G. Huynh, Y. Woo and A. W. Alani, Liposomes produced by microfluidics and extrusion: A comparison for scale-up purposes, Nanomed.: Nanotechnol., Biol. Med., 2019, 18, 146–156, DOI:10.1016/j.nano.2019.02.019.
- D. Carugo, E. Bottaro, J. Owen, E. Stride and C. Nastruzzi, Liposome production by microfluidics: potential and limiting factors, Sci. Rep., 2016, 6, 25876, DOI:10.1038/srep25876.
- G. Anderluzzi and Y. Perrie, Microfluidic Manufacture of Solid Lipid Nanoparticles: A Case Study on Tristearin-Based Systems, Drug Delivery Lett., 2020, 10, 197–208, DOI:10.2174/2210303109666190807104437.
- J. Yun, S. Zhang, S. Shen, Z. Chen, K. Yao and J. Chen, Continuous production of solid lipid nanoparticles by liquid flow-focusing and gas displacing method in microchannels, Chem. Eng. Sci., 2009, 64, 4115–4122, DOI:10.1016/j.ces.2009.06.047.
- M. A. Shetab Boushehri, D. Dietrich and A. Lamprecht, Nanotechnology as a Platform for the Development of Injectable Parenteral Formulations: A Comprehensive Review of the Know-Hows and State of the Art, Pharmaceutics, 2020, 12(6), 510, DOI:10.3390/pharmaceutics12060510.
- V. Bala, S. Rao, B. J. Boyd and C. A. Prestidge, Prodrug and nanomedicine approaches for the delivery of the camptothecin analogue SN38, J. Controlled Release, 2013, 172, 48–61, DOI:10.1016/j.jconrel.2013.07.022.
- H. D. Williams, N. L. Trevaskis, S. A. Charman, R. M. Shanker, W. N. Charman, C. W. Pouton and C. J. H. Porter, Strategies to address low drug solubility in discovery and development, Pharmacol. Rev., 2013, 65, 315–499, DOI:10.1124/pr.112.005660.
- F. Kesisoglou, S. Panmai and Y. Wu, Nanosizing - Oral formulation development and biopharmaceutical evaluation, Adv. Drug Delivery Rev., 2007, 59, 631–644, DOI:10.1016/j.addr.2007.05.003.
- J. Majumder, O. Taratula and T. Minko, Nanocarrier-based systems for targeted and site specific therapeutic delivery, Adv. Drug Delivery Rev., 2019, 144, 57–77, DOI:10.1016/j.addr.2019.07.010.
- I. U. Khan, C. A. Serra, N. Anton and T. Vandamme, Microfluidics: a focus on improved cancer targeted drug delivery systems, J. Controlled Release, 2013, 172, 1065–1074, DOI:10.1016/j.jconrel.2013.07.028.
- J. H. Tsui, W. Lee, S. H. Pun, J. Kim and D.-H. Kim, Microfluidics-assisted in vitro drug screening and carrier production, Adv. Drug Delivery Rev., 2013, 65, 1575–1588, DOI:10.1016/j.addr.2013.07.004.
- B. Baptista, R. Carapito, N. Laroui, C. Pichon and F. Sousa, mRNA, a Revolution in Biomedicine, Pharmaceutics, 2021, 13(12), 2090, DOI:10.3390/pharmaceutics13122090.
- G. Prakash, A. Shokr, N. Willemen, S. M. Bashir, S. R. Shin and S. Hassan, Microfluidic fabrication of lipid nanoparticles for the delivery of nucleic acids, Adv. Drug Delivery Rev., 2022, 184, 114197, DOI:10.1016/j.addr.2022.114197.
- B. G. Carvalho, B. T. Ceccato, M. Michelon, S. W. Han and L. G. de La Torre, Advanced Microfluidic Technologies for Lipid Nano-Microsystems from Synthesis to Biological Application, Pharmaceutics, 2022, 14(1), 141, DOI:10.3390/pharmaceutics14010141.
- A. Akinc, M. A. Maier, M. Manoharan, K. Fitzgerald, M. Jayaraman, S. Barros, S. Ansell, X. Du, M. J. Hope, T. D. Madden, B. L. Mui, S. C. Semple, Y. K. Tam, M. Ciufolini, D. Witzigmann, J. A. Kulkarni, R. van der Meel and P. R. Cullis, The Onpattro story and the clinical translation of nanomedicines containing nucleic acid-based drugs, Nat. Nanotechnol., 2019, 14, 1084–1087, DOI:10.1038/s41565-019-0591-y.
- M. Gaumet, A. Vargas, R. Gurny and F. Delie, Nanoparticles for drug delivery: the need for precision in reporting particle size parameters, Eur. J. Pharm. Biopharm., 2008, 69, 1–9, DOI:10.1016/j.ejpb.2007.08.001.
- Y. Wei, L. Quan, C. Zhou and Q. Zhan, Factors relating to the biodistribution & clearance of nanoparticles & their effects on in vivo application, Nanomedicine, 2018, 13, 1495–1512, DOI:10.2217/nnm-2018-0040.
- Y. Liu, P. Xie, D. Zhang and Q. Zhang, A mini review of nanosuspensions development, J. Drug Targeting, 2012, 20, 209–223, DOI:10.3109/1061186X.2011.645161.
- S. I. Hamdallah, R. Zoqlam, P. Erfle, M. Blyth, A. M. Alkilany, A. Dietzel and S. Qi, Microfluidics for pharmaceutical nanoparticle fabrication: the truth and the myth, Int. J. Pharm., 2020, 584, 119408, DOI:10.1016/j.ijpharm.2020.119408.
- B. Sinha, R. H. Müller and J. P. Möschwitzer, Bottom-up approaches for preparing drug nanocrystals: formulations and factors affecting particle size, Int. J. Pharm., 2013, 453, 126–141, DOI:10.1016/j.ijpharm.2013.01.019.
- A. A. Thorat and S. V. Dalvi, Liquid antisolvent precipitation and stabilization of nanoparticles of poorly water-soluble drugs in aqueous suspensions: recent developments and future perspective, Chem. Eng. J., 2012, 181–182, 1–34, DOI:10.1016/j.cej.2011.12.044.
- J. P. Martins, G. Torrieri and H. A. Santos, The importance of microfluidics for the preparation of nanoparticles as advanced drug delivery systems, Expert Opin. Drug Delivery, 2018, 15, 469–479, DOI:10.1080/17425247.2018.1446936.
- I. U. Khan, C. A. Serra, N. Anton and T. F. Vandamme, Production of nanoparticle drug delivery systems with microfluidics tools, Expert Opin. Drug Delivery, 2015, 12, 547–562, DOI:10.1517/17425247.2015.974547.
- A. M. Reichmuth, M. A. Oberli, A. Jaklenec, R. Langer and D. Blankschtein, mRNA vaccine delivery using lipid nanoparticles, Ther. Delivery, 2016, 7, 319–334, DOI:10.4155/tde-2016-0006.
- P. Erfle, J. Riewe, H. Bunjes and A. Dietzel, Stabilized production of lipid nanoparticles of tunable size in Taylor flow glass devices with high-surface-quality 3D microchannels, Micromachines, 2019, 10, 220, DOI:10.3390/mi10040220.
- H. M. Xia, Y. P. Seah, Y. C. Liu, W. Wang, A. G. G. Toh and Z. P. Wang, Anti-solvent precipitation of solid lipid nanoparticles using a microfluidic oscillator mixer, Microfluid. Nanofluid., 2015, 19, 283–290, DOI:10.1007/s10404-014-1517-5.
- L. Xu, X. Tan, J. Yun, S. Shen, S. Zhang, C. Tu, W. Zhao, B. Tian, G. Yang and K. Yao, Formulation of poorly water-soluble compound loaded solid lipid nanoparticles in a microchannel system fabricated by mechanical microcutting method: puerarin as a model drug, Ind. Eng. Chem. Res., 2012, 51, 11373–11380, DOI:10.1021/ie300592u.
- H. Bolze, J. Riewe, H. Bunjes, A. Dietzel and T. P. Burg, Protective filtration for microfluidic nanoparticle precipitation for pharmaceutical applications, Chem. Eng. Technol., 2021, 44, 457–464, DOI:10.1002/ceat.202000475.
- H. Bolze, J. Riewe, H. Bunjes, A. Dietzel and T. P. Burg, Continuous production of lipid nanoparticles by ultrasound-assisted microfluidic antisolvent precipitation, Chem. Eng. Technol., 2021, 44, 1641–1650, DOI:10.1002/ceat.202100149.
- J. Wagner and J. M. Köhler, Continuous synthesis of gold nanoparticles in a microreactor, Nano Lett., 2005, 5, 685–691, DOI:10.1021/nl050097t.
- J. L. Perry and S. G. Kandlikar, Fouling and its mitigation in silicon microchannels used for IC chip cooling, Microfluid. Nanofluid., 2008, 5, 357–371, DOI:10.1007/s10404-007-0254-4.
- M. Schoenitz, L. Grundemann, W. Augustin and S. Scholl, Fouling in microstructured devices: a review, Chem. Commun., 2015, 51, 8213–8228, 10.1039/c4cc07849g.
- J. Zhou, D. A. Khodakov, A. V. Ellis and N. H. Voelcker, Surface modification for PDMS-based microfluidic devices, Electrophoresis, 2012, 33, 89–104, DOI:10.1002/elps.201100482.
- N. R. Glass, R. Tjeung, P. Chan, L. Y. Yeo and J. R. Friend, Organosilane deposition for microfluidic applications, Biomicrofluidics, 2011, 5, 36501–365017, DOI:10.1063/1.3625605.
- S. Kuhn, T. Noël, L. Gu, P. L. Heider and K. F. Jensen, A Teflon microreactor with integrated piezoelectric actuator to handle solid forming reactions, Lab Chip, 2011, 11, 2488–2492, 10.1039/c1lc20337a.
- J. Riewe, P. Erfle, S. Melzig, A. Kwade, A. Dietzel and H. Bunjes, Antisolvent precipitation of lipid nanoparticles in microfluidic systems - A comparative study, Int. J. Pharm., 2020, 579, 119167, DOI:10.1016/j.ijpharm.2020.119167.
- M. Rhee, P. M. Valencia, M. I. Rodriguez, R. Langer, O. C. Farokhzad and R. Karnik, Synthesis of size-tunable polymeric nanoparticles enabled by 3D hydrodynamic flow focusing in single-layer microchannels, Adv. Mater., 2011, 23, H79–H83, DOI:10.1002/adma.201004333.
- H. Nagasawa and K. Mae, Development of a new microreactor based on annular microsegments for fine particle production, Ind. Eng. Chem. Res., 2006, 45, 2179–2186, DOI:10.1021/ie050869w.
- G. Gkogkos, M. O. Besenhard, L. Storozhuk, N. Thi Kim Thanh and A. Gavriilidis, Fouling-proof triple stream 3D flow focusing based reactor: Design and demonstration for iron oxide nanoparticle co-precipitation synthesis, Chem. Eng. Sci., 2022, 251, 117481, DOI:10.1016/j.ces.2022.117481.
- J. M. Ottino, The kinematics of mixing: stretching, chaos, and transport, Cambridge Univ. Pr, Cambridge, 1989 Search PubMed.
- S. Wiggins and J. M. Ottino, Foundations of chaotic mixing, Philos. Trans. R. Soc., A, 2004, 362, 937–970, DOI:10.1098/rsta.2003.1356.
- T. Yasui, Y. Omoto, K. Osato, N. Kaji, N. Suzuki, T. Naito, M. Watanabe, Y. Okamoto, M. Tokeshi, E. Shamoto and Y. Baba, Microfluidic baker's transformation device for three-dimensional rapid mixing, Lab Chip, 2011, 11, 3356–3360, 10.1039/c1lc20342h.
- F. Schönfeld, V. Hessel and C. Hofmann, An optimised split-and-recombine micro-mixer with uniform chaotic mixing, Lab Chip, 2004, 4, 65–69, 10.1039/b310802c.
- H. Zhang, X. Li, R. Chuai and Y. Zhang, Chaotic Micromixer Based on 3D Horseshoe Transformation, Micromachines, 2019, 10(6), 398, DOI:10.3390/mi10060398.
- P. Erfle, J. Riewe, H. Bunjes and A. Dietzel, Goodbye fouling: a unique coaxial lamination mixer (CLM) enabled by two-photon polymerization for the stable production of monodisperse drug carrier nanoparticles, Lab Chip, 2021, 2178–2193, 10.1039/d1lc00047k.
- C. Habchi, A. Ghanem, T. Lemenand, D. Della Valle and H. Peerhossaini, Mixing performance in Split-And-Recombine Milli-Static Mixers—A numerical analysis, Chem. Eng. Res. Des., 2019, 142, 298–306, DOI:10.1016/j.cherd.2018.12.010.
- R. R. Gidde, P. M. Pawar, S. R. Gavali and S. Y. Salunkhe, Flow feature analysis of an eye shaped split and collision (ES-SAC) element based micromixer for lab-on-a-chip application, Microsyst. Technol., 2019, 25, 2963–2973, DOI:10.1007/s00542-018-4271-x.
- M. Rafeie, M. Welleweerd, A. Hassanzadeh-Barforoushi, M. Asadnia, W. Olthuis and M. Ebrahimi Warkiani, An easily fabricated three-dimensional threaded lemniscate-shaped micromixer for a wide range of flow rates, Biomicrofluidics, 2017, 11, 14108, DOI:10.1063/1.4974904.
- A. D. Awtrey and R. E. Connick, Rate law and mechanism of the reaction of iodine with tetrathionate ion, J. Am. Chem. Soc., 1951, 73, 4546–4549, DOI:10.1021/ja01154a015.
- K. Ohkawa, T. Nakamoto, Y. Izuka, Y. Hirata and Y. Inoue, Flow and mixing characteristics of σ-type plate static mixer with splitting and inverse recombination, Chem. Eng. Res. Des., 2008, 86, 1447–1453, DOI:10.1016/j.cherd.2008.09.004.
- M. Schubert, Solvent injection as a new approach for manufacturing lipid nanoparticles - Evaluation of the method and process parameters, Eur. J. Pharm. Biopharm., 2003, 55, 125–131, DOI:10.1016/S0939-6411(02)00130-3.
- S. Bhattacharjee, DLS and zeta potential - What they are and what they are not?, J. Controlled Release, 2016, 235, 337–351, DOI:10.1016/j.jconrel.2016.06.017.
- N. M. Francke, F. Schneider, K. Baumann and H. Bunjes, Formulation of Cannabidiol in Colloidal Lipid Carriers, Molecules, 2021, 26(5), 1469, DOI:10.3390/molecules26051469.
- A. Klinov and I. Anashkin, Diffusion in Binary Aqueous Solutions of Alcohols by Molecular Simulation, Processes, 2019, 7, 947, DOI:10.3390/pr7120947.
- M. T. Tyn and W. F. Calus, Temperature and concentration dependence of mutual diffusion coefficients of some binary liquid systems, J. Chem. Eng. Data, 1975, 20, 310–316, DOI:10.1021/je60066a009.
- A. Königer, B. Meier and W. Köhler, Measurement of the Soret, diffusion, and thermal diffusion coefficients of three binary organic benchmark mixtures and of ethanol–water mixtures using a beam deflection technique, Philos. Mag., 2009, 89, 907–923, DOI:10.1080/14786430902814029.
- Transport Phenomena in Micro Process Engineering, ed. N. Kockmann, Springer Berlin Heidelberg, Berlin, Heidelberg, 2008 Search PubMed.
- International Organization for Standardization, Particle size analysis — Dynamic light scattering (DLS), 2017, https://www.iso.org/standard/65410.html, (accessed 13 March 2022) Search PubMed.
- S. M. D'Addio and R. K. Prud'homme, Controlling drug nanoparticle formation by rapid precipitation, Adv. Drug Delivery Rev., 2011, 63, 417–426, DOI:10.1016/j.addr.2011.04.005.
- L. Capretto, D. Carugo, S. Mazzitelli, C. Nastruzzi and X. Zhang, Microfluidic and lab-on-a-chip preparation routes for organic nanoparticles and vesicular systems for nanomedicine applications, Adv. Drug Delivery Rev., 2013, 65, 1496–1532, DOI:10.1016/j.addr.2013.08.002.
- E. Lepeltier, C. Bourgaux and P. Couvreur, Nanoprecipitation and the “Ouzo effect”: application to drug delivery devices, Adv. Drug Delivery Rev., 2014, 71, 86–97, DOI:10.1016/j.addr.2013.12.009.
- A. 'A. Al-Halhouli, W. Al-Faqheri, B. Alhamarneh, L. Hecht and A. Dietzel, Spiral microchannels with trapezoidal cross section fabricated by femtosecond laser ablation in glass for the inertial separation of microparticles, Micromachines, 2018, 9, 171, DOI:10.3390/mi9040171.
- F. Jiang, K. S. Drese, S. Hardt, M. Küpper and F. Schönfeld, Helical flows and chaotic mixing in curved micro channels, AIChE J., 2004, 50, 2297–2305, DOI:10.1002/aic.10188.
- V. Kumar, M. Aggarwal and K. D. P. Nigam, Mixing in curved tubes, Chem. Eng. Sci., 2006, 61, 5742–5753, DOI:10.1016/j.ces.2006.04.040.
- S. P. Vanka, G. Luo and C. M. Winkler, Numerical study of scalar mixing in curved channels at low Reynolds numbers, AIChE J., 2004, 50, 2359–2368, DOI:10.1002/aic.10196.
- S. Song and C. Peng, Viscosities of binary and ternary mixtures of water, alcohol, acetone, and hexane, J. Dispersion Sci. Technol., 2008, 29, 1367–1372, DOI:10.1080/01932690802313006.
- J. Zhang, Y. Fan and E. Smith, Experimental design for the optimization of lipid nanoparticles, J. Pharm. Sci., 2009, 98, 1813–1819, DOI:10.1002/jps.21549.
- F. Q. Hu, H. Yuan, H. H. Zhang and M. Fang, Preparation of solid lipid nanoparticles with clobetasol propionate by a novel solvent diffusion method in aqueous system and physicochemical characterization, Int. J. Pharm., 2002, 239, 121–128, DOI:10.1016/S0378-5173(02)00081-9.
- Y. Dong, W. K. Ng, S. Shen, S. Kim and R. B. H. Tan, Solid lipid nanoparticles: continuous and potential large-scale nanoprecipitation production in static mixers, Colloids Surf., B, 2012, 94, 68–72, DOI:10.1016/j.colsurfb.2012.01.018.
- V. Klang, N. B. Matsko, C. Valenta and F. Hofer, Electron microscopy of nanoemulsions: an essential tool for characterisation and stability assessment, Micron, 2012, 43, 85–103, DOI:10.1016/j.micron.2011.07.014.
- J. Stetefeld, S. A. McKenna and T. R. Patel, Dynamic light scattering: a practical guide and applications in biomedical sciences, Biophys. Rev., 2016, 8, 409–427, DOI:10.1007/s12551-016-0218-6.
Footnote |
| † Electronic supplementary information (ESI) available. See DOI: https://doi.org/10.1039/d2lc00240j |
| This journal is © The Royal Society of Chemistry 2022 |

