
Immuno-biosensor on a chip: a self-powered microfluidic-based electrochemical biosensing platform for point-of-care quantification of proteins†
Fatemeh
Haghayegh‡
a,
Razieh
Salahandish‡
ab,
Azam
Zare
a,
Mahmood
Khalghollah
a and
Amir
Sanati-Nezhad
 *abc
*abc
aBioMEMS and Bioinspired Microfluidic Laboratory, Department of Mechanical and Manufacturing Engineering, University of Calgary, Calgary, Alberta T2N 1N4, Canada. E-mail: amir.sanatinezhad@ucalgary.ca
bCenter for BioEngineering Research and Education, University of Calgary, Calgary, Alberta T2N 1N4, Canada
cBiomedical Engineering Graduate Program, University of Calgary, Calgary, Alberta T2N 1N4, Canada
First published on 29th November 2021
Abstract
The realization of true point-of-care (PoC) systems profoundly relies on integrating the bioanalytical assays into “on-chip” fluid handing platforms, with autonomous performance, reproducible functionality, and capacity in scalable production. Specifically for electrochemical immuno-biosensing, the complexity of the procedure used for ultrasensitive protein detection using screen-printed biosensors necessitates a lab-centralized practice, hindering the path towards near-patient use. This work develops a self-powered microfluidic chip that automates the entire assay of electrochemical immuno-biosensing, enabling controlled and sequential delivery of the biofluid sample and the sensing reagents to the surface of the embedded electrochemical biosensor. Without any need for active fluid handling, this novel sample-to-result testing kit offers antibody–antigen immunoreaction within 15 min followed by the subsequent automatic washing, redox probe delivery, and electrochemical signal recording. The redox molecules ([Fe(CN)6]3−/4−) are pre-soaked and dried in fiber and embedded inside the chip. The dimensions of the fluidic design and the parameters of the electrochemical bioassay are optimized to warrant a consistent and reproducible performance of the autonomous sensing device. The uniform diffusion of the dried redox into the injected solution and its controlled delivery onto the biosensor are modeled via a two-phase flow computational fluid dynamics simulation, determining the suitable time for electrochemical signal measurement from the biosensor. The microfluidic chip performs well with both water-based fluids and human plasma with the optimized sample volume to offer a proof-of-concept ultrasensitive biosensing of SARS-CoV-2 nucleocapsid proteins spiked in phosphate buffer saline within 15 min. The on-chip N-protein biosensing demonstrates a linear detection range of 10 to 1000 pg mL−1 with a limit of detection of 3.1 pg mL−1. This is the first self-powered microfluidic-integrated electrochemical immuno-biosensor that promises quantitative and ultrasensitive PoC biosensing. Once it is modified for its design and dimensions, it can be further used for autonomous detection of one or multiple proteins in diverse biofluid samples.
Introduction
The emergence of microfluidic systems has opened avenues for transferring macro-scale laboratory-based analytical protocols into one single-standing chip,1 with their innate capability in handling different biofluids with precise volumes.2 Regardless of the materials and fabrication techniques used to produce microfluidic chips, micro-components, such as microchannels,3 porous fibers,4 microvalves,5 micromixers,6,7 and micropumps8 have been embedded inside the fluidic systems to provide the desired control over the rate and direction of liquid flow. Leveraging the fluid mechanic principles at the micro-scale, these chips have been developed in a variety of different constructs, such as droplet microfluidics,9 centrifugal microfluidics,10 capillary microfluidics, gravity-based microfluidics, and multiphase flow microfluidics, with applications in isolation, extraction, and sorting of particles as well as tissue engineering, genetics, and sensing.11,12Various factors influence the functionality of microfluidic chips towards fulfilling the requirements of the intended applications. From a fabrication perspective, photolithography techniques have been extensively used for producing polydimethylsiloxane (PDMS)-based chips13 for versatile purposes, ranging from tissue engineering, diagnostics, energy harvesting in fuel cells, sensors, and assays.14,15 Where clean-room facilities are not the option for fabrication, microfluidic chips can be produced from laser-cut of materials like polymethyl methacrylate (PMMA)16 or glass17 as well as embossing and 3D printing of specific substrates and polymers.18 Another important element affecting the performance of microfluidic platforms is the mechanism of fluid-driving, either passively (by adding elements such as siphon-driven microfluidic passive pumps,19 capillary microchannel circuits,3 or gravity-driven components,20) or actively (using external or on-chip pumps21). These factors are selected and incorporated into the specific design created to perform the target application miniaturized inside the chip.
In recent years, enormous attention has been attracted towards integrating microfluidic platforms and biosensors with the mission of developing point-of-care (PoC) diagnostic systems.22 As opposed to the traditional diagnostics mainly performed in a central lab by trained individuals and advanced benchtop analyzers, the PoC diagnostic platforms offer on-site and near-to-patient detection of various biomarkers in different bodily fluids.23,24 However, to be considered as a true PoC, each diagnostic device should meet several criteria such as portability (handheld preferred), time-efficiency, self-contained reagents, and fully automated biofluid processing, apart from being accurate, stable, and sensitive.25,26 With the emergence of the demand for home-based and remote diagnostics, many attempts have been made to automate the previously laboratory-based assays for the purpose of translating them into PoC devices.27 This includes on-chip colorimetric assays,28 surface plasmon resonance (SPR) integrated microfluidic chips,29 droplet microfluidic platforms,30 and centrifugal microfluidic platforms.15,31 For transforming these platforms from research labs into the PoC world, one should consider numerous designs and manufacturing constraints, including the deployment of a passive fluid-driving mechanism for adding to the instrumental simplicity of the system. Mass production of the fluid platforms needs to be considered, affecting the selection of the materials and fabrication techniques compatible with scalable manufacturing of medical devices. Ultimately, the biosensing mechanism determines the accuracy and steps of the assay performed inside the chip and influences the design of the whole setup.
Among all existing methods used for detecting biofluid markers, electrochemical biosensors have shown promising clinical outcomes thanks to their rapid, ultrasensitive, label-free, and quantitative measurement. Their planar electrode-based sensing is also well compatible with microfluidic devices, potentially enabling the miniaturization of biosensing assays.32,33 Electrochemical biosensors used for detection of proteins have provided sensitivity, selectivity, and limits of detections comparable to or better performance than the standard laboratory-based assays such as ELISA and single molecule array (SIMOA),34–36 while eliminating the need for bulky readout systems. Despite all benefits of electrochemical biosensors, their implementation as a PoC test still requires their integration into microfluidics to automate the entire assay of electrochemical biosensing.
There are several reports on integrating electrochemical biosensors into microfluidic chips to either automate the sensing process37,38 or eliminate the evaporation39 on the electrodes during the sensing process with the aim of increasing the reproducibility of sensing.40,41 In an attempt to combine electrochemical sensors with a fluid-handling system for the delivery of the sample to the electrode, Lee et al.42 developed an integrated platform, placing the electrode inside a 3D printed housing for extraction and delivery of the salivary cotinine analytes. However, for measuring the electrochemical signals, the electrode needs to be detached from the fluidic platform to be exposed to the redox system responsible for generating the signals. To overcome this challenge, consecutive active injection of the redox reagents into the system was practiced8 where electrochemical biosensors integrated with microfluidic systems were used to sense small organ tissues inside the chip.33,43 These approaches, however, cannot be used for PoC systems, where no or minimum user interaction or bulky equipment is needed.
Regarding the microfluidic platforms previously incorporated for the sequential sample and reagent delivery, efforts have been made on creating capillary microfluidic devices within PDMS chips used thus far for optical sensing.3,44 To create the capillary effects within the fluidic elements such as channels, valves, and passive pumps, the fabrication of micro-scale features has been an obligation,45 which demands costly and time-consuming microfabrication processes.46 PDMS itself comes with several limitations, the most important being its incompatibility with organic materials, unstable surface properties, and absorption of small molecules, all of which restrict its use for biomarker sensing in bodily fluids.47 Hence, the development of self-powered microfluidic platforms through low-cost, rapid, and scalable fabrication processes is of paramount interest.48
In this work, a universal self-powered microfluidic-based electrochemical biosensing platform is developed with the aim of automating the electrochemical detection of protein biomarkers in different biofluids. The term ‘self-powered’ is used here to indicate that the microfluidic system is able to automate all steps of electrochemical sensing without a need for any manual steps or external device involved (such as external pumping, reagent pipetting, etc.). The N-protein immuno-biosensor is developed based on a highly sensitive zinc oxide (ZnO)/graphene (Gr) electrode. Taking the PoC criteria into account, the self-powered microfluidic platform is designed such that it only requires a one-step dispensing of the sample into the inlet well while all other steps of electrochemical sensing are performed automatically within the chip. This specific design allows for the delivery of a control volume of sample onto the immuno-biosensor to initiate the immunoreaction, washing the biosensor after the completion of the immunoreaction step, and the controlled release of the redox component into the sensor area. The mentioned washing step, in this case, is referred to the dynamic slow flow of the sample on top of the electrode, during the period of immunoreaction, which limits the non-specific binding, as opposed to statically drop-casting the sample on top of the working electrode. All these steps are done in a successive timely manner, needed for performing electrochemical sensing of proteins. A dry-reagent storage technique was used to place the redox probe ([Fe(CN)6]3−/4−) inside the chip, eliminating the need for either detaching the electrode or using external fluid-driving devices for signal measurement. Also, laser-cut tissue fibers and nitrocellulose sheets embedded into the microchannel network provided components needed for manipulating the direction and flow rate of liquid into the designated areas designed for intended purposes. Taking the easy and cleanroom-less fabrication criteria into account, a combination of laser-cut PMMA and pressure-sensitive adhesives (PSA) layers were used to fabricate the microchannel network without a need for any extra equipment for microfabrication or bonding of the layers. This fabrication method is compatible with medium- and large-scale manufacturing of microfluidic devices compared to PDMS-based platforms. A two-phase flow computational fluid dynamic (CFD) model coupled with convection–diffusion simulations was developed to warrant the uniform distribution of redox reagents inside the fluid system and optimize the time point of signal readout. As a proof of concept, the self-powered microfluidic integrated N-protein immuno-biosensor was examined for the autonomous and on-chip detection of N-proteins spiked in phosphate buffer saline (PBS) solution.
Materials and methods
Materials and reagents
PMMA sheets (the commercial name of Static Dissipative Rigid Plastic) were purchased from SciCron Tech, USA. The PSA (ARcare 8939) for shaping the fluidic channels, chambers and wells were purchased from Adhesive Research Inc, USA. Medical grade double-sided adhesive tapes (90106NB) were purchased from Adhesive Research Inc, USA. The high-dense (NC-120) and low dense (NC-90) (with 120 and 90 being the wicking rate in second per 4 cm2, respectively) vivid lateral flow nitrocellulose (NC) fibers (PALL Corp., USA) and virgin wood (VW) tissue wipers (Kimberly-Clark Worldwide, Inc) were used for dry storing the redox probe and directional delivery of the sample into different fluidic paths, respectively. Potassium ferricyanide (III) (#702587, Sigma, USA) and potassium hexacyanoferrate (II) trihydrate (#33358, Alfa Aesar, Thermo Fisher Scientific., USA) were used for preparing 70 mM redox solution and soaking it in the NC with high-density (wicking rate of 120 s/4 cm2). PBS (1×, Growcells, CA, USA, pH = 7.4) was used for preparing the N-protein spiked samples needed for on-chip electrochemical biosensing. The human plasma biofluid (#P9523, Millipore Sigma, USA) was tested on the chip to assess the autonomous performance of the microfluidic chips.Development and optimization of the self-powered microfluidic platform
The layers of the microfluidic chip were CO2 laser cut to create the fluidic network needed for assay automation. To guarantee the flawless and reproducible performance of the chips after assembly, the cut layers were examined for possible wrinkles and ensuring the appropriateness of the optimized cutting parameters. The dimensions of the cut layers were also measured to avoid possible misalignments affecting the functionality of the chips. ZEISS Axioscope 5 (ZEISS, Germany) was used to observe the cut edges of PMMA and PSA layers and precisely measure the dimensions of the channels. The laser engraver parameters, including power (P), speed (S), and the number of cutting cycles (N) were optimized to achieve the desired functional layers, where no sheet melting or burning occurs. For the PMMA layers, P = 95 watts, S = 3 m s−1, and N = 22 cycles of cutting are the optimal parameters while for the PSA layers, the optimal parameters are determined to be P = 59 watts, S = 30 m s−1, and N = 6 cycles. The details of the optimal laser cutting parameters used for patterning of different layers are presented in Table S1.†Design and fabrication of the microfluidic chips
All the designs were created using AutoCAD 2021 version: R.47.0.0 to make a DXF file compatible with the laser cutter's software (JobControl® Vision). PMMA, PSA, NC and VW sheets were cut (according to their designs) by Speedy 360 flex CO2 laser engraver machine (Trotec, USA), under the optimal power, speed and cutting cycles for each of the selected materials. The NC fibers were soaked with 20 μL of 70 mM [Fe(CN)6]3−/4− redox probe and dried at room temperature for one hour before being embedded inside the redox channel. The biosensor (prepared per instruction below) was fitted inside the first layer of 1.5 mm PMMA, devised as the electrode housing. The next layers of PSA and PMMA were attached to the underlying layers using the considered marks for their accurate alignment. To prevent fabrication-caused leakage, all chips once completely assembled were finally pressed using a customized clamp.Experimental protocols for preparation of electrochemical immuno-biosensors and on-chip biosensing
DS-110 screen-printed electrodes (SPEs) (Dropsence Inc., USA; the carbon-based counter and working electrodes and the silver reference electrode) were purchased to prepare the N-protein immuno-biosensor. A mixture of 2.5% (v/v) zinc oxide nanoparticles (Sigma-Aldrich, #721077, Sigma-Aldrich, USA) and 2.5% (v/v) reduced graphene oxide nanosheets (Sigma-Aldrich, #910406, dispersed in the water to reach 10 mg mL−1 concentration), were then prepared in PBS, drop cast on the working electrode, dried in room temperature for 6 h, and rinsed with deionized (DI) water to eliminate the extra salts. Then, 10 mM solution of 97% L-cysteine (#168149, Sigma-Aldrich, USA) in the water was prepared and cast coated on the nanocomposite deposited on the working electrode to create the self-assembled monolayer for further immobilization of the target antibody. The N-protein antibody (HC2003, GenScript Inc. USA) with a concentration of 50 μg mL−1 (optimal concentration) was prepared in PBS, immobilized on the functionalized electrode, and incubated overnight. The antibody immobilized electrode was passivated using 0.1% (w/v) bovine serum albumin (BSA) (#A2153, Sigma, USA). The electrode was then embedded inside the intended slot in the layer-by-layer assembled microfluidic chip (see details below). The PBS sample containing the target SARS-CoV-2 N-protein (GenScript Inc. USA, #Z03488) with various standard concentrations ranging from 1 pg mL−1 to 10 ng mL−1 was then injected into the microfluidic chips. The electrochemical impedance spectroscopy (EIS) measurements were performed within 10–15 min using PGSTAT 204 potentiostat/galvanostat (Metrohm, USA) with a signal amplitude of 10 mV, the frequency range of 5000 Hz to 0.5 Hz, and an open circuit potential (Eocp) of 170 mV, and open circuit potential (Eocp) of 170 mV. The frequency range is selected based on the optimized range suitable for the target analyte, the geometry and architecture of the sensing electrode, and the selected biosensing protocol.Numerical simulation
One critical parameter of the electrochemical bioassays is the delivery of a certain redox probe concentration into the sensing area needed for accurate biosensing. To meet this criterion, COMSOL Multiphysics 5.6 was employed to model the fluid dynamics inside the redox channel and release of redox probes from the pre-soak NC fibers into the sample. The level-set method was used to simulate the two-phase flow of the sample and to characterize the dissolution of the dried [Fe(CN)6]3−/4− into the sample flowing along the redox channel towards the sensing zone. The diffusion of the redox ions into PBS was modeled using diffusion–convection transport equations‚ transport of diluted species'modules, coupled with the unsteady incompressible Navier–Stokes equations simulated for the 3D network. The computational domain of the sensing chamber and the redox channel, was meshed by 157![[thin space (1/6-em)]](https://www.rsc.org/images/entities/char_2009.gif) 023 tetrahedral elements, wherein the redox channel and the sensing chamber have the height of 1.5 mm, with dimensions as to the fabricated chips. Pressure boundary conditions were applied to this geometry of the chip to achieve the velocities similar to the experimental data. The diffusion coefficient of the liquid was defined as 0.7 × 10⁻⁹ m2 s−1 (ref. 49 and 50) and the concentration of the redox species at the bottom of the redox channel is calculated to be 30 mol m−3 based on drop-casting 4 μL of the 70 mM of [Fe(CN)6]3−/4− into the volume of the NC fiber.
023 tetrahedral elements, wherein the redox channel and the sensing chamber have the height of 1.5 mm, with dimensions as to the fabricated chips. Pressure boundary conditions were applied to this geometry of the chip to achieve the velocities similar to the experimental data. The diffusion coefficient of the liquid was defined as 0.7 × 10⁻⁹ m2 s−1 (ref. 49 and 50) and the concentration of the redox species at the bottom of the redox channel is calculated to be 30 mol m−3 based on drop-casting 4 μL of the 70 mM of [Fe(CN)6]3−/4− into the volume of the NC fiber.
Results and discussion
This work presents a compartmental self-powered fluid handling platform for automating stepwise electrochemical immuno-biosensing assays into sample-to-result testing chips. The complexity of the immuno-biosensing may vary depending upon the method of electrochemical sensing but the typical electrochemical immuno-biosensing assays contain incubation and washing steps along with the electrical recording in the presence of redox probes with a defined ionic content. Leveraging the properties of VW tissue and NC fibers for conducting the liquids in defined directions, the designed microfluidic platform consists of three main compartments (Scheme 1). The inlet channel connects the inlet well to the sensing chamber placed on top of the electrode, where the immunoreaction step initiates. The redox probe ions embedded in the redox channel (via dry storage in the NC fiber) are released into the sample flowing through the redox channel and delivered to the sensing chamber (with a controlled delay) to stop the immunoreaction and perform the subsequent washing and biosensing steps. The performance of the capillary microfluidic chip from conceptual design to the final operation was optimized in a stepwise manner and is discussed in the following section.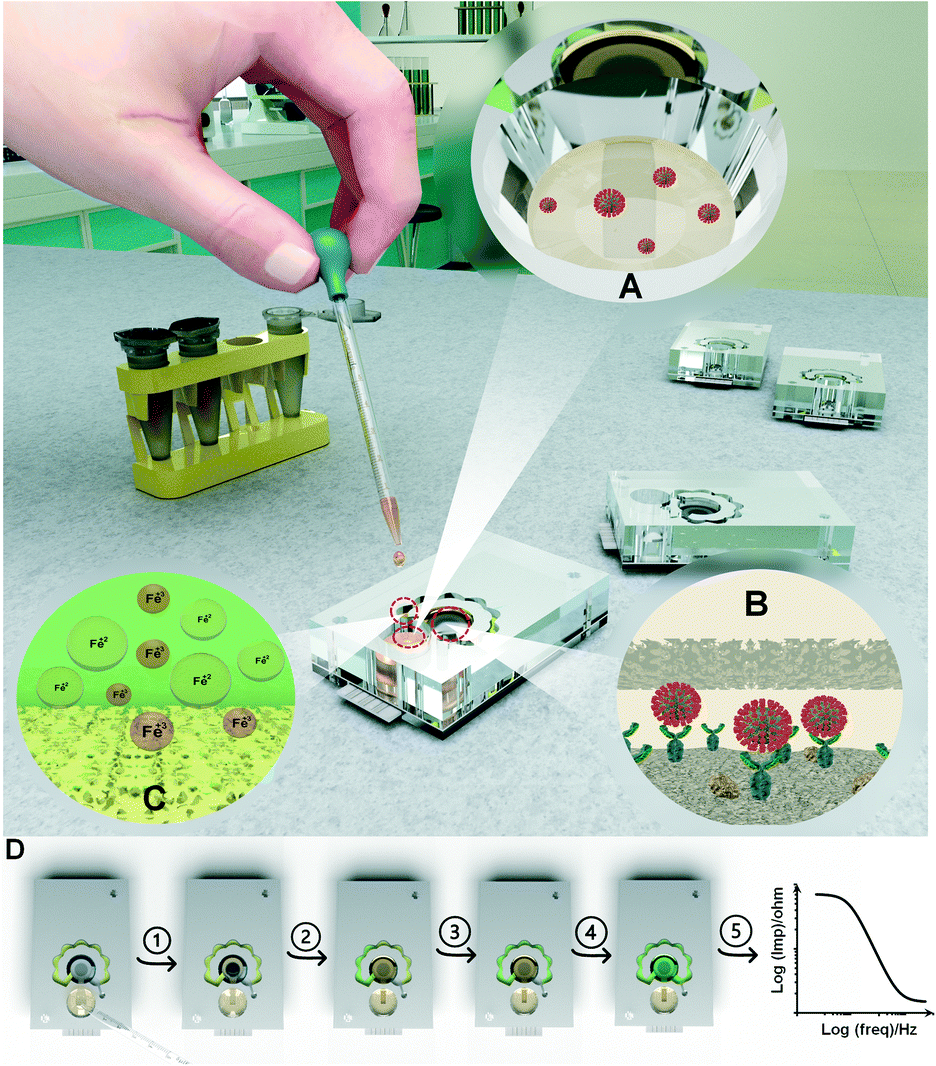 | ||
| Scheme 1 Illustration of different compartments of the microfluidic chip for self-powering the electrochemical biosensing assays. (A) Inlet well of the microfluidic chip where the target sample containing the target biomarker (here SARS-CoV-2 nucleocapsid proteins) is introduced. (B) Representation of the sample reaching on top of the electrode through the embedded tissue fiber and the interaction of target biomarkers with the conjugated antibodies immobilized on the immuno-biosensor. (C) Diffusion of Fe3+ and Fe2+ ions from the soaked/dried nitrocellulose (NC) fiber into the sample for preparation of the redox solution. (D) Step by step demonstration of different segments of the microfluidic chip performance. 1) From the injection of sample into the chip to gravity/capillary-based delivery of the sample to the working electrode, 2) sample filling the sensing chamber and flow into the redox channel, 3) the redox channel becomes completely filled with the sample and the dried-redox reagents dissolve into the incoming sample, 4) diffusion-based dispersion of the redox solution into the sensing zone on top of the electrodes, 5) the Bode diagram representation as the output signal is generated through electrochemical impedance spectroscopy (EIS) measurement. | ||
Design and optimization of the microfluidic chip
The essential steps of electrochemical biosensing were considered in the design of the self-powered microfluidic chips (Fig. 1A). As the first layer, a PMMA layer with a thickness of 1.5 mm was cut considering the dimensions of the DS-110 standard SPEs (Fig. 1A, a). For the second layer, a PSA layer was cut and used as the substrate for the liquid flow within the whole kit (Fig. 1A, b). The areas around the working electrode were also covered with PSA to provide a substrate for placing the NC fiber and delivering the sample to the working electrode (WE) (Fig. 1A, b, ii). The VW tissue covers the WE (Fig. 1A, b, i) to warrant a uniform distribution of the sample on the WE. The next PSA layer (Fig. 1A, c) creates the fluid channel through which the liquid flows from the inlet well to the sensing chamber and the vent. The redox channel was cut inside the third PSA layer (Fig. 1A, d), with the zig-zag shape and the average width of 0.08 mm, where the high-dense redox-soaked NC (Fig. 1A, d, i) is placed. The second PMMA layer (Fig. 1A, e) with the thickness of 1.5 mm was used to shape the height of the redox channel and bonded to the top PMMA sheet (Fig. 1A, g), with the thickness of 1.5 mm forming the inlet well (Fig. 1A, f). The conceptualized chip was fabricated and tested to examine the performance of the integrated components. As depicted in Fig. 1B, the capillary effect of the NC inside the redox channel was not sufficient to drag the sample throughout the redox channel. To facilitate sample flow through the redox channel, the width of the channel was increased to 2.5 mm with the PMMA sheet of 1.5 mm used to shape the inlet well (DS no. 2) (Fig. 1C). Also, owing to an insufficient sample volume to carry redox ions and their delivery to the sensing chamber, the size of the inlet well was adjusted to handle a larger sample volume, providing an adequate liquid volume to fill the entire fluid network. Optimizing the thickness of the PMMA layer to 6 mm in the next design (DS no. 3) along with increasing the diameter of the inlet well helped to reach the sample volume of 300 μL, sufficient to fill both the sensing chamber and the redox channel (Fig. 1D and E). Prior to this experiment, increasing the redox channel thickness to 6 mm, instead of the inlet well PMMA, was also examined, which did not produce the desired results (Fig. S1A and B†).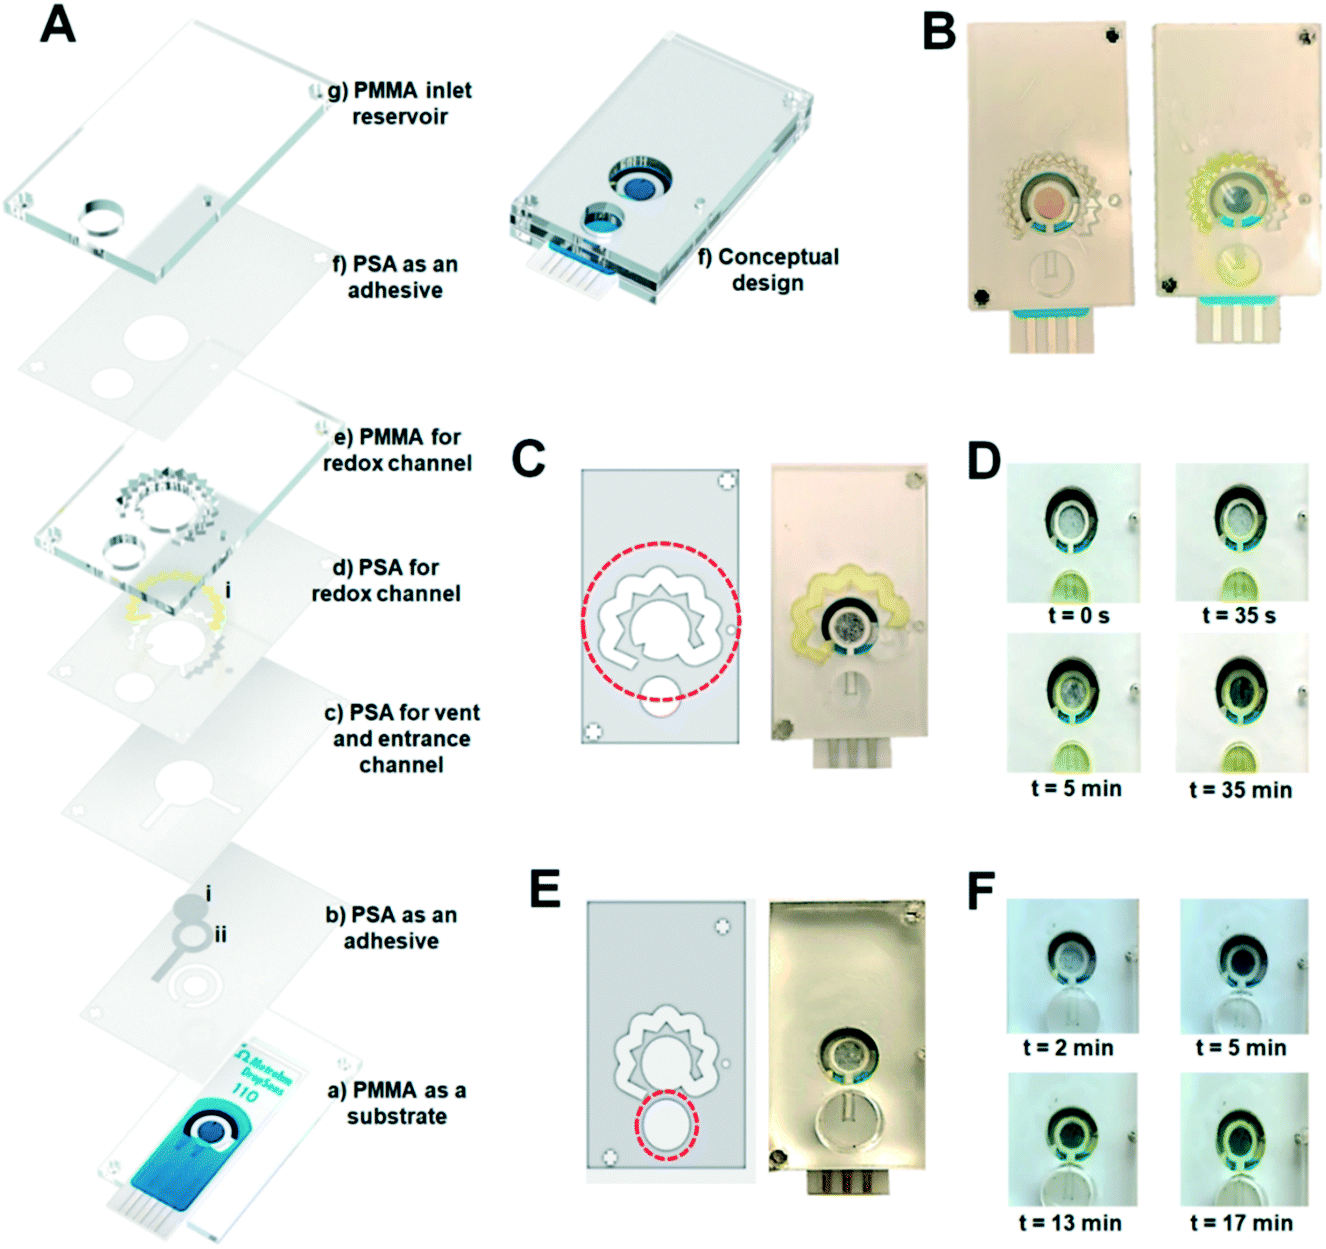 | ||
| Fig. 1 From concept to functional designs of the self-powered microfluidic chip. (A) Layer-by-layer illustration of the conceptual design of the microfluidic chip (design No. 1). (a) The first (polymethyl methacrylate) PMMA layer acts as a housing for the electrode. (b) The first pressure-sensitive adhesive (PSA) layer covering the electrode base, (b, i) the inlet nitrocellulose (NC) sheet connecting the inlet well to the sensing area. (b, ii) The tissue fiber smoothly delivers the sample from the peripheral NC to the surface of the working electrode. (c) Second PSA layer forming the inlet channel and the vent. (d) The third PSA layer for the creation of the redox channel. (d, i) The soaked/dried NC sheet containing the redox ions. (e) The second PMMA layer shapes the redox channel with a higher height. (f) The last PSA sheet bonding the bottom layers to the (g) final PMMA layer that forms the inlet well. (f) Representation of the layer-by-layer chip based on the conceptual design. (B) The performance of the fabricated chip based on the primary conceptual design, before and after injecting the sample. The initial dimensions failed to completely fill the redox channel. (C) Increasing the width of the redox channel in design No. 2. To fix the issue of filling the redox channel. (D) The performance of the modified design (DS no. 2) in specified time points after injection of the sample into the chip. (E) Increasing the thickness of the inlet well in design No. 3 (DS no. 3). (F) Timewise performance of the DS no. 3 chips. | ||
With a larger sample volume, it was required to warrant reproducibly in dragging the sample into the redox channel. The entrance of the redox channel was adjusted in size, allowing for a partial flow of the sample smoothly through this channel (Fig. 1F). As illustrated, the inlet NC (b, ii) and the VW tissue (b, i) absorbed enough sample volume to conduct the liquid through the redox-soaked NC (d, i). The sensing zone was filled with liquid in 10 min in this design, and the concentrated redox solution was delivered to the sensing area in 17 min, confirming the successful conceptual performance of the chip. However, the results were not reproducible enough in this stage, requiring an in-depth investigation and optimization of all steps of the chip operation.
To better understand the mechanism under which the sample flows through the redox chamber, the PSA sheet (f) bonding the last two PMMA layers and covering the upper surface of the redox channel was removed in the next design (DS no. 4). Fig. 2A shows the performance of this design. Upon injection of 300 μL PBS, the NC and VW tissues in the inlet channel became wet, implying that the sample reached the WE, initiating the immunoreaction on the WE. Part of the sample was then dragged into the redox channel (t = 8 min), and upon dissolution of the dried redox into the fluid, the redox solution in the channel was fully prepared. The concentrated redox solution reached the sensing chamber via the outlet of the redox channel and displaced the initial sample incubated on the electrode (t = 23 min). Despite the success of DS no. 4 in automating the steps of electrochemical biosensing, several parameters such as the height of the channels for preventing the leakage, material of the fibers, and the sample volume affecting the assay time and repeatability of the results needed further optimization. For instance, the thickness of the inlet NC (b, ii) exceeded the height of the PSA inlet channel (b), causing inconsistencies in the chip's functionality. As shown in Fig. 2B, the PSA (b) and NC (b, ii) at the inlet channel were not occasionally able to pass enough sample volume to the WE (Fig. 2B, a), provided an insufficient liquid for filling the sensing chamber (Fig. 2B, b) or caused a leakage (Fig. 2B, c).
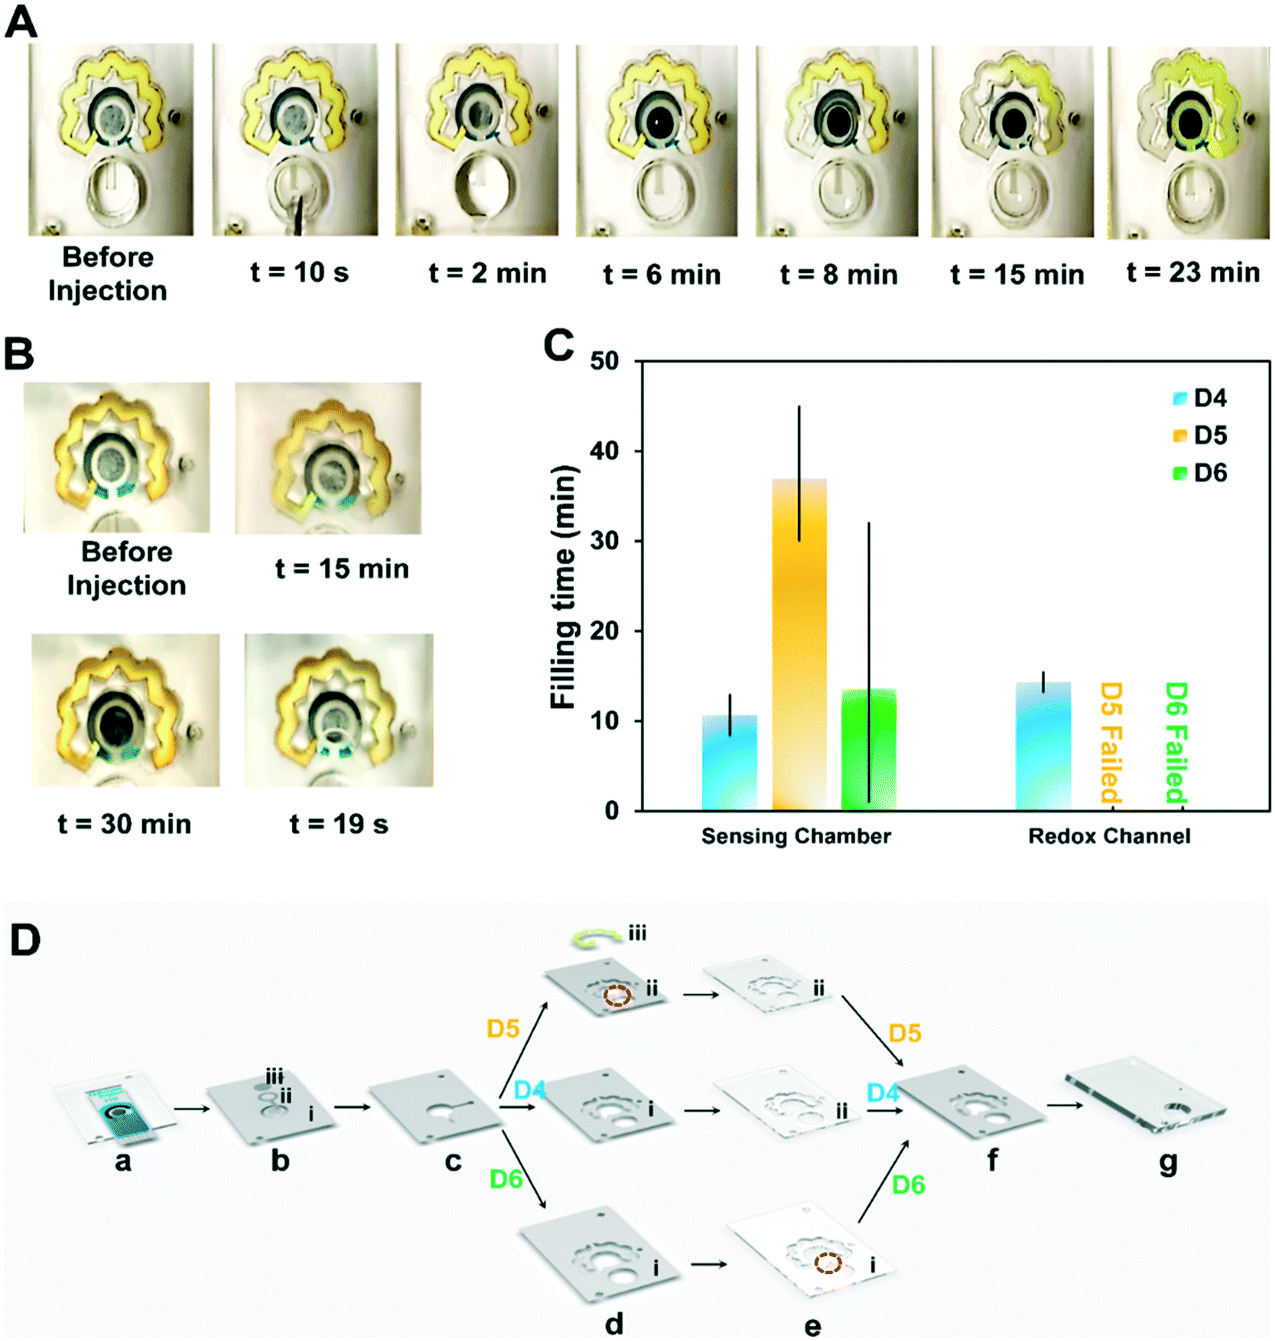 | ||
| Fig. 2 Optimization of the microfluidic chips. (A) Timewise performance of design No.4 for automating the steps of electrochemical sensing. (B) Possible flaws in chip performance; no wetting of the WE tissue after 15 min, the sensing chamber was not filled after 30 min, and the leakage from the sensing chamber after 19 s. (C) The performance of DS no. 4, DS no. 5, DS no. 6, based on the defined time intervals for activation of each segment of the microfluidic chip, including the sensing chamber and the redox channel. (D) Schematic of the modifications in layers of the design to address the inlet channel consistency, DS no. 4 to 6 include layers (a) to (g) and are only different in layers (d) and (e); DS no. 4: PSA (c) performs as the only inlet channel, with no extra fluidic channel cut in PSA (d) and PMMA (e), DS no. 5: a fluidic channel is cut parallel to the inlet's PSA channel (c) into the PSA sheet (d) which contains the redox PSA channel, DS no. 6: a fluidic channel is cut parallel to the inlet's PSA channel (c) into the PMMA sheet (e), which shapes the redox PMMA channel. | ||
To tackle the previously noted inconsistencies in the functionality of the chip, first, the effect of the inlet channel in driving the sample into the chip was assessed, including 1) cutting the PSA redox channel (d) parallel to the inlet channel and 2) cutting the upper PMMA layer (e) to increase the height of this channel. Two different time points were selected to be the indicators of the functionality of the chip. This includes the time during which the surface of the working electrode is covered with the sample, and the duration it takes for the liquid to fill the redox channel and re-enter the sensing chamber. For each set of the designs, these two timepoint data were recorded in addition to monitoring the risks of leakage, misalignment, or inaccurate sample volume on the electrode as the possible sources of error. Our results indicated that neither engraving the PSA (d) (DS no. 5) nor cutting the PMMA sheet (e) for forming the inlet channel (DS no. 6) contributed to an increased liquid volume flowing from the inlet well to the sensing chamber and the redox channel (Fig. 2C).
As opposed to the chips with modifications in PSA (d) (DS no. 5) and PMMA (e) (DS no. 6) layers (Fig. 2D), a more consistent performance was observed in design (DS no. 4) with a slight modification in its design. In the modified DS no. 4, two layers of PSA inlet channels (c) were used, as opposed to only one layer in original DS no. 4, therefore increasing the thickness of the channel housing the inlet NC (b, ii), avoids the possible leakage due to the difference in the height of these layers. Cutting the PSA layer responsible for housing the redox NC (d) in the area on top of the inlet channel is another option for adding to the height of the inlet channel (DS no. 5). These changes while effective caused a significant variance in the filling time of the sensing chamber. Moreover, the sample was held inside the inlet well for 35 ± 7 min (n = 5), only allowing for wetting the VW tissue (b, i). In DS no. 6, engraving the PMMA layer (e) in the depicted areas (Fig. 2D, e, i) was used as an alternative to adding to the height of the inlet channel. However, the sensing chamber was not filled in any of the chips fabricated based on this design. This could be owing to the hydrophobicity of the PSA adhesive at the bottom of the newly generated PMMA inlet channel, overcoming the pressure difference available for the sample to flow. Overall, the modified DS no. 4 was used for proceeding to the next steps of the optimization process. Changing the type of inlet NC (b, i and b, ii) was examined to ensure the flawless functionality of the inlet channel and the inlet fiber.
As the next step of supporting a consistent function of the inlet channel and the VW tissue, two other configurations of fibers were placed at the inlet channel. The high-density NC (b, ii) used previously tended to maintain the incoming fluid and not pass it to the following VW tissue fiber (b, i). Hence, a tissue with a lower porosity was exploited to flow the sample easier into the sensing chamber while presenting a capillary effect inside the inlet channel for self-powered transferring the sample to the WE area. To this end, we first replaced the high-density NC with a cellulose-based paper (Fig. 3A). As illustrated, the paper drags the sample from the inlet well to the top of the WE and due to its contact with the bottom layer tissue (b, i), uniformly delivers it to the surface of WE. However, even after 30 min, the sensing chamber was not filled with the sample, therefore, this paper was not useful for this study's intended design. In the second configuration, the same VW tissue was cut to cover the WE in a way that in one layer it acts as both VW tissue (b, i) and inlet channel fiber (b, ii). The results obtained from this modification proved to be consistently functional (Fig. 3B).
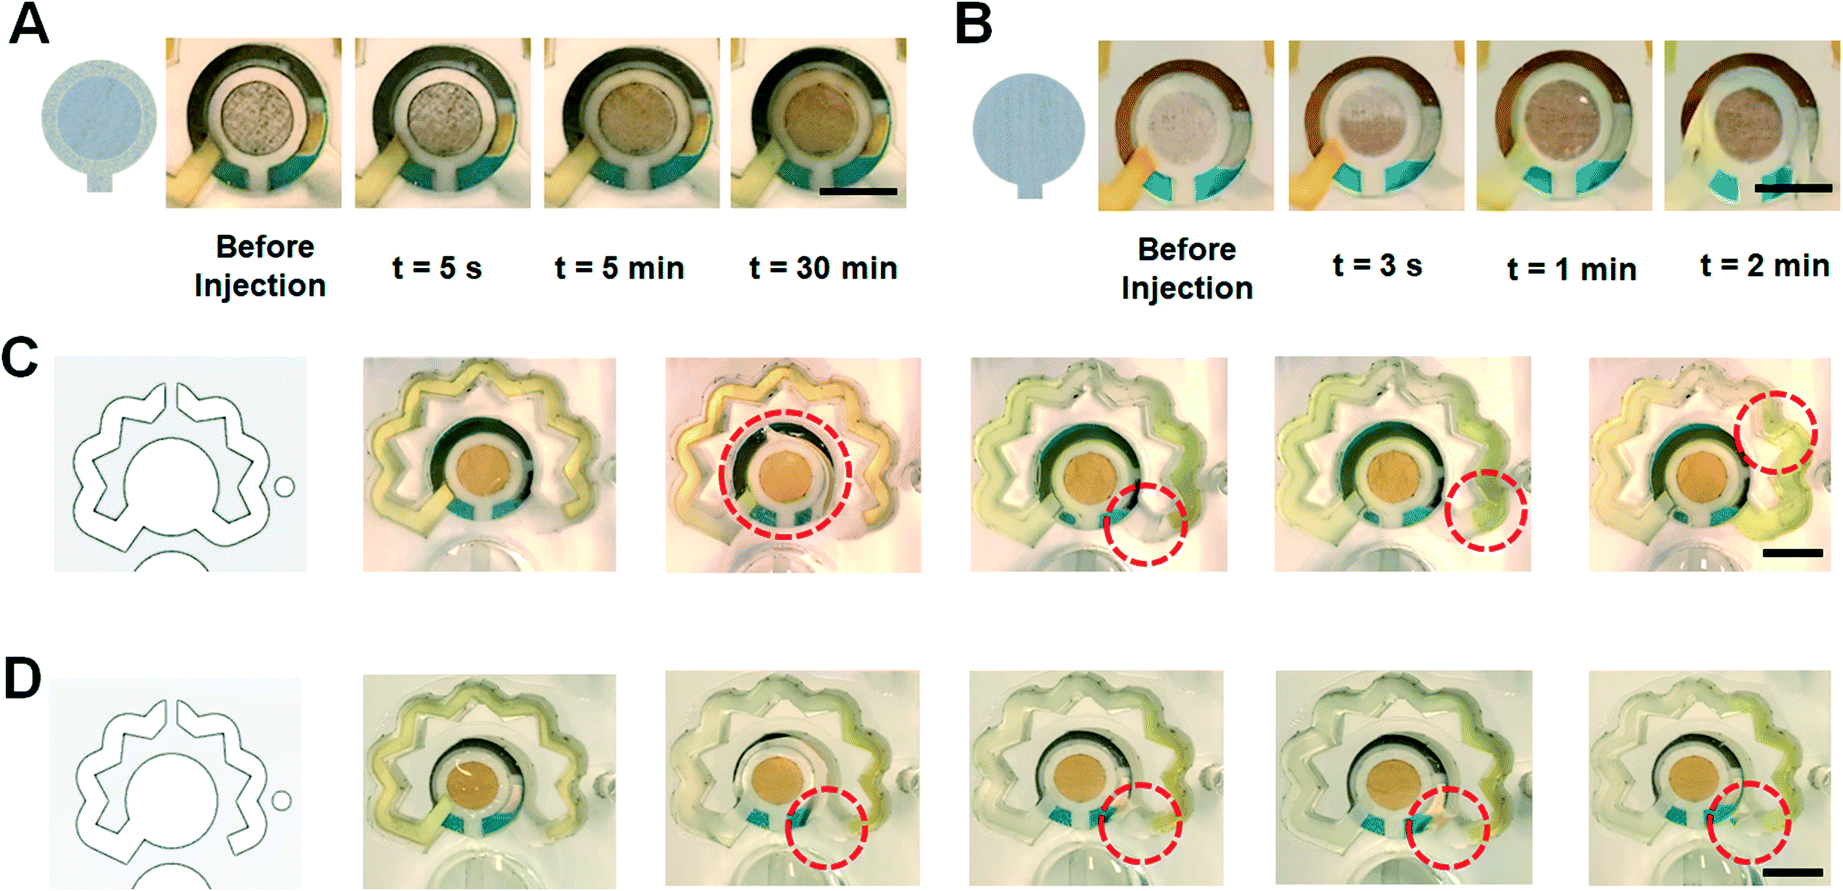 | ||
| Fig. 3 Optimization of the microfluidic chip for refining the performance consistency. (A) Using a paper as the guiding capillary fiber used at the inlet channel. (B) Using the same VW tissue to provide the capillary inside the inlet channel. (C) The flow of the sample to the redox channel in the opposite direction. (D) Adding a PSA step feature prevents the risk of reverse flow of the sample at the redox channel (scale bars: 4 mm). | ||
Although the presence of the redox-soaked NC (d, i) successfully dragged the sample from the sensing chamber to the redox channel in the intended direction, the sample may still flow in a reverse direction (Fig. 3C). This might result in air entrapment inside the system, owing to inadequate venting capabilities for removing the bubbles in the reverse flow direction. One step feature was designed in the PSA layer (d) which helped to prevent the reverse flow of the liquid in the redox channel (Fig. 3D). The location of the redox channel's vent also influences the pressure difference needed for the flow of the sample inside the redox channel. Also, the presence of bubbles inside the sensing chamber negatively affects the electrochemical signal. If a bubble remains inside the redox channel, it will block the diffusion of concentrated redox solution into the sensing chamber. Hence, it is essential to optimize the location of the vent to warrant bubble-free evacuation of the air from the system. Accordingly, three different vent positions were tested (Fig. 4A–C). Fig. 4A depicts the first design, where the vent was connected to the redox channel by cutting the intermediate PMMA layer (Fig. 4A, a). The tests revealed that there is a possibility of air entrapment at the end of the redox channel, preventing the flow of the redox solution further into the sensing chamber (Fig. 4A, c). In the next vent design, the intermediate PMMA sheet was cut to connect the end of the redox channel to the vent (Fig. 4B, a). Although this design proved to be more effective, there was still a probability of bubbles remaining in the system (Fig. 4B, c). In the third vent design, to eliminate the generation of air bubbles as a result of inappropriate air outflow, the vent column was directly connected to the end of the redox channel (Fig. 4C), where the air exited the system with the most consistent performance in this final design. All experiments were performed using 300 μL of PBS sample as a test fluid for further evaluating the biosensing performance of the chips.
 | ||
| Fig. 4 Parameters affecting the self-powering and reproducibility of the microfluidic chip. (A–C) Evaluating the optimal position of the vent well (scale bars: 4 mm); (a) design of the vent, (b) before injection, and (c) after injection of the sample. (D) The functionality of different types of fibers as the capillary generating tissue (Fig. 1A b, i and b, ii). (E) Optimizing the volume of PBS injected into the chip to reach a reproducible turn-around time. (F) The quantified evaluation of each segment of the chip for human plasma samples in terms of critical turn-around times. (G) Timewise illustration of the performance of the chip tested with human plasma. (H) Schematic illustration of the final layers of the final design (DS no. 7). | ||
Knowing that the sample was delivered to the WE in less than one minute using the final microfluidic design (DS no. 7) (Fig. 4D), the important factors determining the functionality and repeatability of the chips are filling time of the redox channel and reproducible delivery of the sample-redox mixture to the sensing chamber. To improve this reproducibility, two other sample volumes of 305 μL and 310 μL PBS were tested in addition to the initially tested 300 μL sample volume (Fig. 4E). All these sample volumes successfully operated in the chip by filling the sensing chamber and redox channel in the intended intervals. For the chips tested with 310 μL sample volume, we achieved 9.6 ± 0.5 min filling time for the redox channel with relative standard deviation (RSD) of 6.66% (n = 3) as opposed to the chips tested with 305 μL sample volume (RSD: 35.68%). Video S1† shows the flow of PBS (sample volume: 310 μL) in different compartments of the self-powered microfluidic chip for its final design.
The performance of the final microfluidic chip (DS no. 7) was further evaluated by testing it with human plasma samples. The results show that the optimal sample volume for the plasma samples is 350 μL with the sample leaving the redox channel in 8 ± 1 min following the sample injection into the chip (Fig. 4F). Fig. 4G shows the timewise process of plasma flow in the microfluidic chip, as an example showcasing the functionality of the microfluidic platform for biofluids other than water-like liquids.
To investigate whether the parameters optimized for the laser cutter are optimal for making the final fluidic design (DS no. 7), microscopic characterizations of the microfluidic chip were performed. Different components of the microfluidic chip were observed under the microscope (ZEISS Axioscope 5) with 10× and 5× optical lenses. The photos of the inlet channel cut through the adhesive layer and the inlet tissue (b, i) are seen in Fig. S2A.† Also, the area the redox NC is connected to the inlet tissue is seen in this figure. The PMMA layer employed to create the redox channel was also characterized in terms of the dimensions of the inlet and outlet channels (Fig. S2B†). To contribute to the improved mixing of the dried redox reagent into the sample flowing through the redox channel, the nozzle-diffuser fluid flow concept was implemented, where the width of the channel widens and tightens (Fig. S2B†), resulting in cycles of velocity increase and decrease, enhancing the reagent mixing.
Simulating the redox diffusion and flow in the redox channel
To warrant the uniform distribution of the redox solution (prepared inside the redox channel) on top of the biosensor, the two-phase flow (PBS-air) model inside the redox channel, where the dissolution of the dried redox reagent occurs, was numerically simulated, based on the geometrical solution domain, and generated mesh shown in Fig. S3.† Due to the similar physical properties of PBS and the water affecting the fluid flow (including viscosity and density), the water is considered as the liquid for the numerical simulation.51 The simulation results show that the redox ions diffused into the flowing water and entered the sensing chamber when the redox-diffused sample reaches the end of the redox channel. The simulation was used to quantify the timespan needed within which the redox solution uniformly covers all areas of the biosensing chamber. Considering the minimal time of 10 min immunoreaction is safe for completion of the antibody–antigen interaction, the time during which a consistent concentration of redox solution is achieved determines the readout time after injection. If this turn-around time is less than 10 min, the user should wait for the completion of the immunoreaction (i.e., 10 min here) prior to reading the signals from the biosensor. However, if the turn-around time is above 10 min, the user could conduct the measurement as soon as the redox solution is uniformly dispersed within the biosensing chamber. It is noted that the fluid design can be adapted to reach the desired turn-around time within the range of 7–30 min depending upon the type of target antigen and its carrier biofluid.The two-phase flow profile in the redox channel is indicated in Fig. 5A, wherein the liquid–air interface (ϕ, level set variable) progresses into the redox channel and drains the air out to the redox channel's vent. The area indicating the fluid is shown with red color and the area indicating the air is illustrated with green color. The simulated model acts identical to the experimental condition where the liquid enters the inlet of the redox channel (bottom left) from the sensing chamber and the air exits through the embedded vent. The effect of the NC fiber on driving the sample through the redox channel was simulated by considering a lower contact angle for the bottom of the redox channel (50°), compared to a higher contact angle considered for the other walls of the channel (80°). Another factor involved in confirming the agreement between the simulation results and the experimental observations is the absence of any disturbing air bubbles in the areas filled with liquid. During liquid flow through the redox channel, the dried redox is dissolved into the liquid via convection–diffusion, indicated with the color change for the liquid turning from green to yellow. The corresponding concentration diagrams for the redox dissolution are represented in Fig. 5B, where no concentration of the redox ions is initially present in the solution domain, but during the flow of the sample through the redox channel (blue color for zero concentration), the liquid starts becoming concentrated with the redox ions and the dissolved species move in the direction of the flow towards the end of the redox channel. When the air is removed from the redox channel, the fluid velocity at the end of the redox channel (shown in the cutlines highlighted in Fig. 5A) reaches 0.006 m s−1, which is in close agreement with the experimental observations.
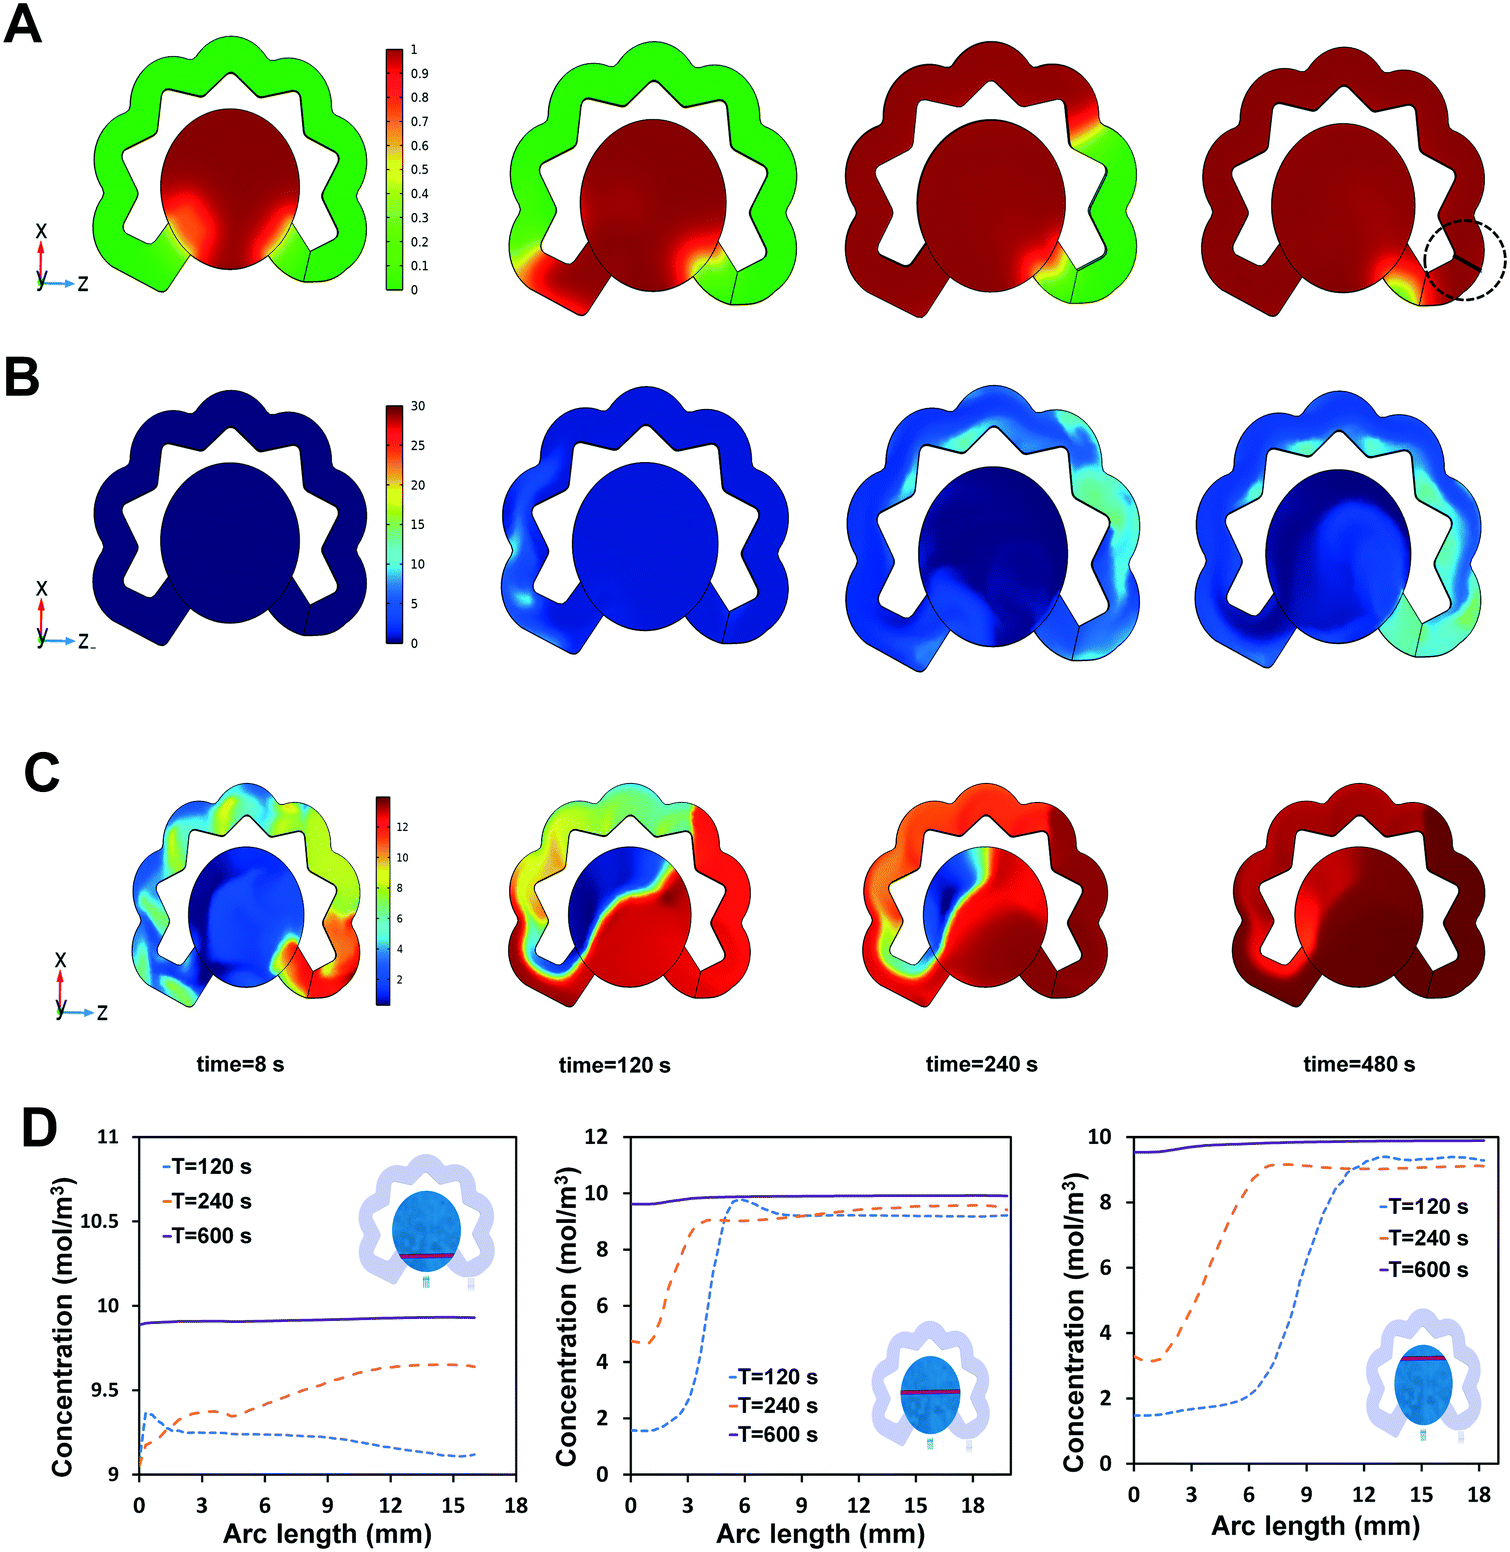 | ||
| Fig. 5 Numerical simulation of the fluid flow and redox diffusion in the microfluidic platform. (A) Two-phase flow of the sample and air inside the redox channel and (B) the associated convection–diffusion plots. (C) Concentration distribution of the redox solution inside the sensing chamber with the corresponding time points. (D) The redox concentrations in 8 s, 120 s, 240 s, and 600 s (after sample injection) within the redox channel and the sensing chamber. | ||
Once the concentrated liquid reaches the end of the redox channel, it enters the sensing chamber, where the convection–diffusion equations were applied for calculating the approximate time the concentration of the dissolved redox is consistent over the three-electrode system. The plots of the concentration distribution in various time points of 120 s, 240 s, and 600 s are presented in Fig. 5D, where the uniform concentration on the electrodes was achieved within 10 min (600 s), an appropriate timing after which the EIS signals could be reliably measured. To quantify these observations, three cutlines were defined in different locations of the sensing chamber, on which the concentration of the species was calculated over time (Fig. 5D). Based on the initial condition of 30 mM concentration of the redox in the fiber, the final concentration of the sample on top of the electrode reaches 10 mM, which is an appropriate concentration typically used for biosensing of proteins. Fig. S3† represents the domain of the solution.
On-chip electrochemical detection of nucleocapsid proteins within a self-powered microfluidics
As a proof of concept, the functionality of the self-powered microfluidic chip developed and refined above was further evaluated for detecting SARS-CoV-2 N-protein bio-analyte spiked in PBS. The N-protein electrochemical biosensors, once prepared, are simply embedded within the chips and ready for on-chip biosensing. DS-110 SPEs modified with the mixture of 2.5% (v/v) zinc oxide nanoparticles and 2.5% (v/v) graphene nanosheets were functionalized with 10 mM L-cysteine to form a self-assemble monolayer, containing carboxylic functional groups for immobilization of the N-protein antibodies. A duration of 10 min incubation was shown to be safe for completing the antibody–antigen interaction while this timing is sufficient for delivering the dissolved redox over the embedded N-protein immuno-biosensor.The EIS technique was implemented to measure the change in impedance of the electrode surface prepared with different coatings during its surface modifications (Fig. 6A). First, the ZnO–Gr modified electrodes were inserted into the chips. PBS (310 μL volume) was injected into the inlet well where it was mixed with the dried [Fe(CN)6]3−/4− and formed the required redox solution needed for reading out the EIS signals. The EIS measurement was also performed on other electrodes prepared with the next steps of surface modification, including the deposition of the zinc-based modifier, immobilization of the SARS-CoV-2 N-protein antibody, addition of BSA, and interaction of the 10 pg mL−1 antigen with the antibody. The results of EIS signal measurements on different electrodes show that the electrode's impedance response increased in the subsequent additions of any of the steps of surface modification, confirming the addition of the intended layers on the electrode surface. The effective conjugation of the redox probe on the NC fibers in the soak/dry process, in terms of generation of reproducible signals upon storage, was also evaluated. Fig. S4A† represents the bar chart showing that after 5 days of storing the dried redox NC fibers, their integration inside the fabricated chips produces the same results measured on the first day of soak/drying, for the same BSA coated electrodes.
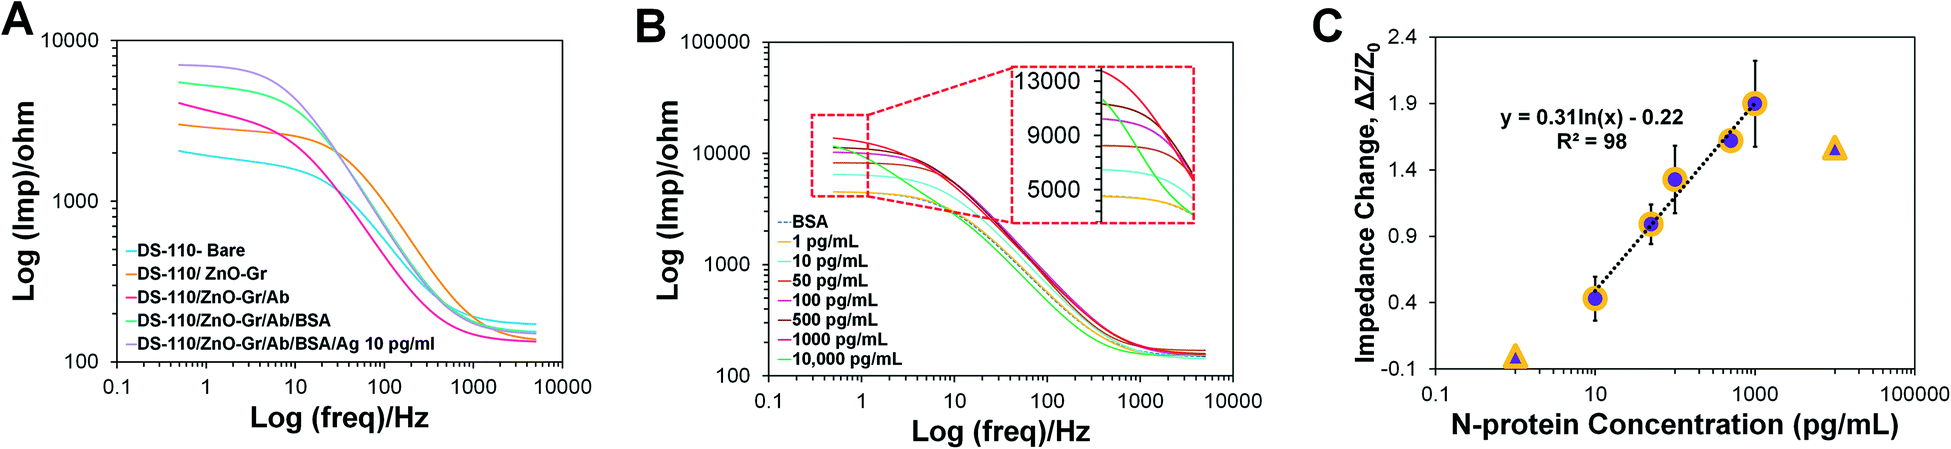 | ||
| Fig. 6 Proof of concept electrochemical detection of the N-protein immuno-biosensor inside the self-powered microfluidic chip. (A) Bode plots of the EIS measurement from embedded electrodes at different stages of surface modification. (B) Bode diagrams representing the EIS measurement results for various concentrations of the spiked N-protein in PBS, and (C) the corresponding calibration curve showing the impedance change of the immuno-biosensor inside the chip versus different concentrations of N-protein. | ||
To demonstrate a proof-of-concept self-powered electrochemical detection of N-protein antigen using the final design microfluidic chip, the fabricated N-protein immuno-biosensors were embedded inside the chip, and after 10 min of injecting the standard concentrations of N-proteins (spiked in PBS) into the inlet well, the increase in the impedance values for 10, 50, 100, 500, and 1000 pg mL−1 N-protein analyte was measured (Fig. 6B). The corresponding calibration curve is depicted in Fig. 6C, with a logarithmic correlation of y = 0.3185ln(x) − 0.2482 between the N-protein concentration and the impedance change (ΔZ/Z0), where ΔZ = Z − Z0, Z0 is the impedance of the biosensor measured on-chip at zero concentration of N-proteins, and Z is the impedance of the biosensor measured at various concentrations of N-proteins. This diagram shows a sensitivity of 111.81 ohms per mL pg1 mm−2, the limit of detection (LoD) of 3.10 pg mL−1, and the limit of quantification (LoQ) of 6.81 pg mL−1. A linear detection response between 10 to 1000 pg mL−1 was achieved for the immuno-biosensor integrated within the self-powered microfluidic chip, within a total detection range of 1 to 10000 pg mL−1. As can be seen in Fig. 6C, the signal of 1 pg mL−1 N-protein is equal to blank. The results extracted from Fig. 6C are also reported in Table S2.† Ultimately, the selective response of the N-protein sensing unit was investigated by exposing the sensing system to the sample containing 10 pg mL−1 S1 proteins, as well as samples containing a combination of 10 pg/mL N-protein and S1 protein. As illustrated in Fig. S4B,† the sample lacking N-proteins generates lower signals, which does not fall in the represented calibration curve, while both N-protein contained samples depict acceptable higher signals, showing effective and selective immunoreaction of N-protein antibodies and antigens. Also, Fig. S4C† shows that the signals measured from chips at 3.5 hours after washing the antibody immobilized electrodes, until measurements conducted through the following 1.5 hours, produced equal signals. These signals are attributed to four negative clinical nasal samples, preserved in Universal Transport Media (UTM), which are expected to produce equal results. The performance of the biosensing system for functioning under UTM media conditions is also represented in Fig. S4D.†
Conclusion
In this study, a self-powered microfluidic chip is presented, from its initial design to the final functional and reproducible kit, for fully automating the on-chip electrochemical biosensing. The microfluidic design contains compartments needed to provide accurate timing for antibody/antigen interaction as well as delivery of washing buffers (if needed) and redox reagents needed for conducting electrochemical measurements. The process of device development and optimization was carried out step-by-step for enhancing the reproducibility of the chips based on the desired outcomes. The microfluidic chip utilizes nitrocellulose fibers, housing the redox ions and directing the sample in intended paths. Design modifications were performed to warrant the operation of the chips within 10 min, without any bubble entrapment, where a redox solution is delivered to the sensing area and allows for the EIS measurement. The uniform diffusion of the redox species was confirmed via computational fluid dynamic simulations. The functionality of the microfluidic integrated immuno-biosensing platform was demonstrated for ultrasensitive detection of SARS-CoV-2 N-protein. The integrated platform was able to successfully detect the protein analyte within the linear dynamic detection range of 10 pg mL−1 to 1000 pg mL−1, with the LoD of 3.10 pg mL−1, offering a promising path towards the realization of the point-of-care electrochemical detection of COVID-19. The self-powered microfluidic chip developed in this work can be easily adapted to automate more complex electrochemical bioassays needing the sequential delivery of multiple reagents into the integrated biosensor. This platform is also well aligned with the critical need for multiplex electrochemical point-of-care devices where multiplex working electrodes can be integrated into the same or slightly modified microfluidic chip developed in this work.Author contributions
Concept and design: F. H., R. S., A. SN; experimentation & data acquisition: F. H., R. S; data analysis and/or interpretation: F. H., R. S., A. SN.; numerical analysis: F. H., R. S., A. Z.; drafting and revising the manuscript: F. H., R. S., A. Z., M. K., A. SN.Conflicts of interest
The authors declare no competing financial interests.Acknowledgements
The authors acknowledge the Canadian Institutes of Health Research (CIHR) and Natural Sciences and Engineering Research of Canada (NSERC) for their NSERC Alliance and Rapid COVID-19 Response funding. The authors also acknowledge the Alberta Innovates, the Canada Research Chair, the University of Calgary, and CMC – Microsystems, Canada for funding support to this research.References
- C. D. Chin, V. Linder and S. K. Sia, Lab Chip, 2012, 12, 2118–2134 RSC.
- J. Zhang, S. Yan, D. Yuan, G. Alici, N.-T. Nguyen, M. E. Warkiani and W. Li, Lab Chip, 2016, 16, 10–34 RSC.
- A. Olanrewaju, M. Beaugrand, M. Yafia and D. Juncker, Lab Chip, 2018, 18, 2323–2347 RSC.
- S. Byrnes, J. Bishop, L. Lafleur, J. Buser, B. Lutz and P. Yager, Lab Chip, 2015, 15, 2647–2659 RSC.
- A. V. Desai, J. D. Tice, C. A. Apblett and P. J. Kenis, Lab Chip, 2012, 12, 1078–1088 RSC.
- C.-Y. Lee, C.-L. Chang, Y.-N. Wang and L.-M. Fu, Int. J. Mol. Sci., 2011, 12, 3263–3287 CrossRef CAS PubMed.
- E. A. Mansur, Y. Mingxing, W. Yundong and D. Youyuan, Chin. J. Chem. Eng., 2008, 16, 503–516 CrossRef CAS.
- J. Etxebarria-Elezgarai, Y. Alvarez-Braña, R. Garoz-Sanchez, F. Benito-Lopez and L. Basabe-Desmonts, Ind. Eng. Chem. Res., 2020, 59, 22485–22491 CrossRef CAS.
- T. Trantidou, M. Friddin, A. Salehi-Reyhani, O. Ces and Y. Elani, Lab Chip, 2018, 18, 2488–2509 RSC.
- R. R. Soares, A. S. Akhtar, I. F. Pinto, N. Lapins, D. Barrett, G. Sandh, X. Yin, V. Pelechano and A. Russom, Lab Chip, 2021, 21, 2932–2944 RSC.
- J. Ma, Y. Wu, Y. Liu, Y. Ji, M. Yang and H. Zhu, Lab Chip, 2021, 21, 2129–2141 RSC.
- D. Liu, H. Shen, Y. Zhang, D. Shen, M. Zhu, Y. Song, Z. Zhu and C. Yang, Lab Chip, 2021, 21, 2019–2026 RSC.
- K. M. Raj and S. Chakraborty, J. Appl. Polym. Sci., 2020, 137, 48958 CrossRef.
- M. Safdar, J. Jänis and S. Sanchez, Lab Chip, 2016, 16, 2754–2758 RSC.
- J. Kim, H. Cho, J. Kim, J. S. Park and K.-H. Han, Biosens. Bioelectron., 2021, 176, 112897 CrossRef CAS.
- T.-F. Hong, W.-J. Ju, M.-C. Wu, C.-H. Tai, C.-H. Tsai and L.-M. Fu, Microfluid. Nanofluid., 2010, 9, 1125–1133 CrossRef CAS.
- K. L. Wlodarczyk, R. M. Carter, A. Jahanbakhsh, A. A. Lopes, M. D. Mackenzie, R. R. Maier, D. P. Hand and M. M. Maroto-Valer, Micromachines, 2018, 9, 409 CrossRef.
- S. M. Scott and Z. Ali, Micromachines, 2021, 12, 319 CrossRef PubMed.
- G. S. Jeong, J. Oh, S. B. Kim, M. R. Dokmeci, H. Bae, S.-H. Lee and A. Khademhosseini, Lab Chip, 2014, 14, 4213–4219 RSC.
- Y.-T. Kao, T. S. Kaminski, W. Postek, J. Guzowski, K. Makuch, A. Ruszczak, F. von Stetten, R. Zengerle and P. Garstecki, Lab Chip, 2020, 20, 54–63 RSC.
- A. K. Au, N. Bhattacharjee, L. F. Horowitz, T. C. Chang and A. Folch, Lab Chip, 2015, 15, 1934–1941 RSC.
- P. Li, G.-H. Lee, S. Y. Kim, S. Y. Kwon, H.-R. Kim and S. Park, ACS Nano, 2021, 15, 1960–2004 CrossRef CAS.
- A. J. Steckl and P. Ray, ACS Sens., 2018, 3, 2025–2044 CrossRef CAS.
- P. Ray and A. J. Steckl, ACS Sens., 2019, 4, 1346–1357 CrossRef CAS PubMed.
- L.-C. Chen, E. Wang, C.-S. Tai, Y.-C. Chiu, C.-W. Li, Y.-R. Lin, T.-H. Lee, C.-W. Huang, J.-C. Chen and W. L. Chen, Biosens. Bioelectron., 2020, 155, 112111 CrossRef CAS PubMed.
- R. Sista, Z. Hua, P. Thwar, A. Sudarsan, V. Srinivasan, A. Eckhardt, M. Pollack and V. Pamula, Lab Chip, 2008, 8, 2091–2104 RSC.
- Y. Dai and C. C. Liu, Am. Ethnol., 2019, 131, 12483–12496 Search PubMed.
- L. Zheng, G. Cai, S. Wang, M. Liao, Y. Li and J. Lin, Biosens. Bioelectron., 2019, 124, 143–149 CrossRef PubMed.
- F. Inci, Y. Saylan, A. M. Kojouri, M. G. Ogut, A. Denizli and U. Demirci, Appl. Mater. Today, 2020, 18, 100478 CrossRef.
- V. Yelleswarapu, J. R. Buser, M. Haber, J. Baron, E. Inapuri and D. Issadore, Proc. Natl. Acad. Sci. U. S. A., 2019, 116, 4489–4495 CrossRef CAS PubMed.
- M. Yamaguchi, H. Katagata, Y. Tezuka, D. Niwa and V. Shetty, Sensing and Bio-Sensing Research, 2014, 1, 15–20 CrossRef PubMed.
- N. Nesakumar, S. Kesavan, C.-Z. Li and S. Alwarappan, J. Anal. Test., 2019, 3, 3–18 CrossRef.
- J. Aleman, T. Kilic, L. S. Mille, S. R. Shin and Y. S. Zhang, Nat. Protoc., 2021, 16, 2564–2593 CrossRef CAS.
- J. Kuhle, C. Barro, U. Andreasson, T. Derfuss, R. Lindberg, Å. Sandelius, V. Liman, N. Norgren, K. Blennow and H. Zetterberg, Clin. Chem. Lab. Med., 2016, 54, 1655–1661 CAS.
- R. Salahandish, A. Ghaffarinejad, S. M. Naghib, A. Niyazi, K. Majidzadeh-A, M. Janmaleki and A. Sanati-Nezhad, Sci. Rep., 2019, 9, 1–11 CAS.
- R. Salahandish, A. Ghaffarinejad, S. M. Naghib, K. Majidzadeh-A, H. Zargartalebi and A. Sanati-Nezhad, Biosens. Bioelectron., 2018, 117, 104–111 CrossRef CAS.
- Z. Altintas, M. Akgun, G. Kokturk and Y. Uludag, Biosens. Bioelectron., 2018, 100, 541–548 CrossRef CAS PubMed.
- J. W. Parks, M. Olson, J. Kim, D. Ozcelik, H. Cai, R. Carrion Jr, J. Patterson, R. Mathies, A. Hawkins and H. Schmidt, Biomicrofluidics, 2014, 8, 054111 CrossRef CAS.
- K.-K. Liu, R.-G. Wu, Y.-J. Chuang, H. S. Khoo, S.-H. Huang and F.-G. Tseng, Sensors, 2010, 10, 6623–6661 CrossRef CAS PubMed.
- H. Bi, A. C. Fernandes, S. Cardoso and P. Freitas, Sens. Actuators, B, 2016, 224, 668–675 CrossRef CAS.
- M. H. Zarifi, H. Sadabadi, S. H. Hejazi, M. Daneshmand and A. Sanati-Nezhad, Sci. Rep., 2018, 8, 1–10 CAS.
- K. Lee, T. Yoon, H.-S. Yang, S. Cha, Y.-P. Cheon, L. Kashefi-Kheyrabadi and H.-I. Jung, Lab Chip, 2020, 20, 320–331 RSC.
- Y. S. Zhang, J. Aleman, S. R. Shin, T. Kilic, D. Kim, S. A. M. Shaegh, S. Massa, R. Riahi, S. Chae and N. Hu, Proc. Natl. Acad. Sci. U. S. A., 2017, 114, E2293–E2302 CrossRef CAS.
- D. Juncker, H. Schmid, U. Drechsler, H. Wolf, M. Wolf, B. Michel, N. de Rooij and E. Delamarche, Anal. Chem., 2002, 74, 6139–6144 CrossRef CAS.
- R. Safavieh and D. Juncker, Lab Chip, 2013, 13, 4180–4189 RSC.
- R. Mukhopadhyay, Anal. Chem., 2009, 81, 4169–4173 CrossRef CAS PubMed.
- Y. Wang, S. Chen, H. Sun, W. Li, C. Hu and K. Ren, Microphysiological Syst., 2018, 1, 1–11 CrossRef CAS.
- A. Liga, J. A. Morton and M. Kersaudy-Kerhoas, Microfluid. Nanofluid., 2016, 20, 1–12 CrossRef CAS.
- S. Konopka and B. McDuffie, Anal. Chem., 1970, 42, 1741–1746 CrossRef CAS.
- G. Prampolini, P. Yu, S. Pizzanelli, I. Cacelli, F. Yang, J. Zhao and J. Wang, J. Phys. Chem. B, 2014, 118, 14899–14912 CrossRef CAS.
- P. H. Brown, A. Balbo, H. Zhao, C. Ebel and P. Schuck, PLoS One, 2011, 6, e26221 CrossRef CAS.
Footnotes |
| † Electronic supplementary information (ESI) available. See DOI: 10.1039/d1lc00879j |
| ‡ These authors contributed equally. |
| This journal is © The Royal Society of Chemistry 2022 |