
 Open Access Article
 This Open Access Article is licensed under a
 Creative Commons Attribution 3.0 Unported Licence
Sub-micron thick liquid sheets produced by isotropically etched glass nozzles†
Christopher J.
Crissman
 *abc,
Mianzhen
Mo
c,
Zhijiang
Chen
c,
Jie
Yang
cd,
Diego A.
Huyke
ce,
Siegfried H.
Glenzer
c,
Kathryn
Ledbetter
fg,
J. Pedro
F. Nunes
g,
May Ling
Ng
c,
Hengzi
Wang
c,
Xiaozhe
Shen
c,
Xijie
Wang
c and
Daniel P.
DePonte
*c
*abc,
Mianzhen
Mo
c,
Zhijiang
Chen
c,
Jie
Yang
cd,
Diego A.
Huyke
ce,
Siegfried H.
Glenzer
c,
Kathryn
Ledbetter
fg,
J. Pedro
F. Nunes
g,
May Ling
Ng
c,
Hengzi
Wang
c,
Xiaozhe
Shen
c,
Xijie
Wang
c and
Daniel P.
DePonte
*c
aUnited States Military Academy, West Point, NY 10996, USA. E-mail: chris@crissman.us
bDepartment of Applied Physics, Stanford University, Stanford, California 94305, USA
cSLAC National Accelerator Laboratory, Menlo Park, California 94025, USA. E-mail: deponte@slac.stanford.edu
dDepartment of Entrepreneurship, Innovation, and Strategy, Tsinghua University, Beijing, China
eDepartment of Mechanical Engineering, Stanford University, Stanford, California 94305, USA
fStanford PULSE Institute, SLAC National Accelerator Laboratory, Menlo Park, California 94025, USA
gDepartment of Physics and Astronomy, University of Nebraska-Lincoln, Lincoln, Nebraska 68588, USA
First published on 16th February 2022
Abstract
We report on the design and testing of glass nozzles used to produce liquid sheets. The sheet nozzles use a single converging channel chemically etched into glass wafers by standard lithographic methods. Operation in ambient air and vacuum was demonstrated. The measured sheet thickness ranges over one order of magnitude with the smallest thickness of 250 nm and the largest of 2.5 μm. Sheet thickness was shown to be independent of liquid flow rate, and dependent on the nozzle outlet area. Sheet surface roughness was dependent on nozzle surface finish and was on the order of 10 nm for polished nozzles. Electron transmission data is presented for various sheet thicknesses near the MeV mean free path and the charge pair distribution function for D2O is determined from electron scattering data.
Introduction
Liquid sheets are useful targets for liquid phase studies that utilize X-ray spectroscopy, high-power optical lasers or electron scattering, either for liquid phase studies or as a medium to deliver suspended particles.1–5 The ability to present free surface liquid targets in a rapidly replenishing form has immense potential for use in high repetition-rate experiments. Liquid sheets provide a free-standing medium that is constantly replaced in a consistent and customizable form giving highly reproducible results without the possibility of accumulated sample or container degradation.Desired sheet qualities are application-dependent, though good temporal and spatial stability are generally required. Soft X-ray transmission and MeV electron scattering require thickness in the range of 0.1 μm to 1 μm while thicker sheets in the range of 10 μm are preferable for optimal signal generation when considering the higher transmission of hard X-ray probes. Damage to the nozzle can occur when using high power laser sources and so sheet length must also be considered to maintain a safe working distance between the nozzle and the interaction point. For static structural biology applications, large biomolecules or viruses will be easier to image using fast X-ray or electron probes if the carrier fluid is submicron thickness thereby contributing less to the background scatter. For time resolved or dynamics studies in which the target will first be optically pumped, such as in the study of photosynthetic molecules, sheet flatness is necessary to eliminate any lensing effect which might result in an uneven illumination of the sample. In addition to flatness, surface roughness is of particular importance to high energy density (HED) science. In HED science, targets have typically been solid state with very carefully prepared surfaces.6 These targets are heated and compressed by optical absorption of high-intensity laser pulses. Surface roughness plays a role in absorption and surfaces that are optically smooth or better are desired.
The need for liquid sample delivery and, perhaps more importantly, flat jet technology is increasing as pulsed optical and X-ray laser facilities move to higher repetition rates. In the case of free electron lasers (FEL), higher repetition rate implies an increased sample consumption for liquid phase studies unless the sample can be reused or recirculated. By spreading out the incident X-ray flux over a wider area the intensity can be lowered, reducing the sample damage. In the case of high-powered laser facilities, the replacement of solid targets several times per minute (or even per second), may not be feasible and liquid targets may provide a suitable alternative to enable the production of energetic particle sources of ions, electrons, neutrons, and X-rays.7
Converging nozzles operate in a manner similar to the more commonly used colliding jet nozzles.1,8–14 Both rely on a transfer of momentum transverse to the direction of the jet travel to generate a pressure gradient that spreads out the liquid into a sheet. In Fig. 1C, the outlet of a converging nozzle is shown with a resulting sheet flowing from the outlet. The momentum generated by the liquid flow within the converging channel results in a transfer of momentum flux to a plane perpendicular to the flow of the channel. Ultimately, surface tension causes the jet to collapse and again, this inward momentum flux generates another sheet orthogonal to the first. This can continue on as a “chain” of sheets until breakup. Converging nozzles have been previously made individually with either multipart assembly or 3D printing.7–9 In this study, the fabrication and characterization of the glass nozzles made by wet isotropic etch are reported together with their application for transmission electron scattering experiments.
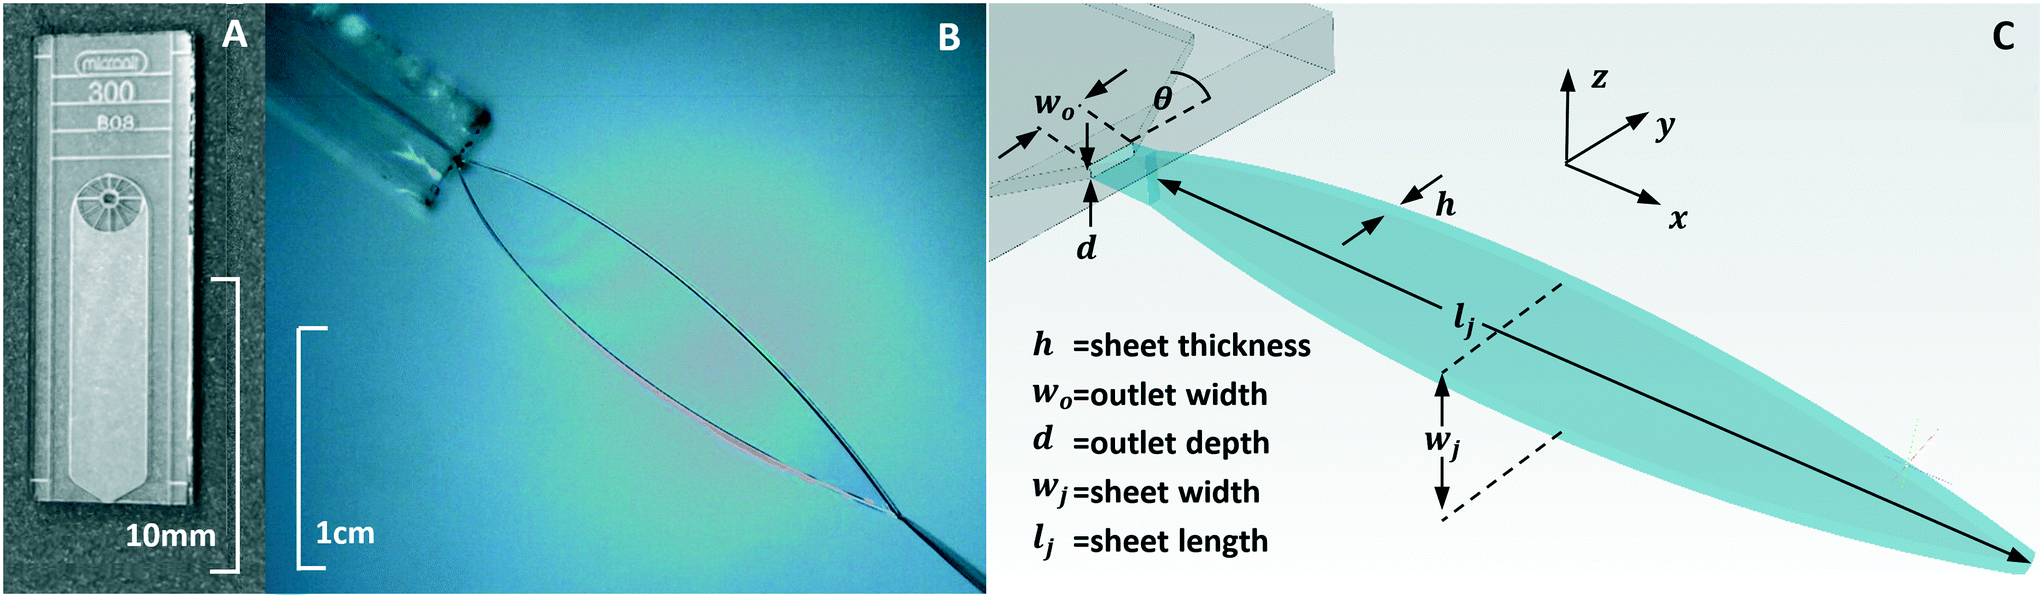 | ||
| Fig. 1 A A converging nozzle is shown with the channel inlet present in the center of the circular structure below the B08 label. The outlet is at the bottom of the chip and is shown in Fig. 1B as a schematic with a liquid sheet being projected in the plane perpendicular to the channel. B A sheet is generated by the transverse momentum of the fluid as it converges towards the nozzles exit. C The converging nozzle, with the channel in the xy plane, creates a sheet in the xz plane perpendicular to the channel. | ||
Liquid sheet nozzles can be fabricated by several methods with various respective merits. One of the most accessible to fabricate is a colliding jet in which cylindrical jets emanating from two aligned tubes collide to form a sheet.11 In this case, alignment can be challenging and pulsation of the liquid flow can cause fluctuations in sheet position or thickness. Lithographically formed channels have been used to aid in alignment, but this comes with another set of alignment challenges related to the detachment of the liquid from the chip surface. Koralek et al., mitigated this issue by using a lithographically formed nozzle that employs three channels – a central liquid channel and two gas orifices on opposing sides of the liquid channel to flatten out the liquid flow.2 This device can produce very thin sheets, to the limit of their reported measuring capability of 16 nm. Sheet thickness and the width to length ratios can be tuned by changing the gas and liquid flow rates, however the thickness reliance on both means that pulsation in flow rate causes pulsation of the sheet thickness. Gas load on vacuum systems and scattering of X-ray or optical probes from the gas is another disadvantage. The difficulty in fabricating single aperture converging nozzles lies somewhere between colliding and gas accelerated nozzles. Using a single orifice, such as with the converging nozzles examined here, eliminates the need for alignment and decreases clogging by using a larger nozzle aperture for similar flow rate colliding jets.
Converging nozzles can be produced by 3D printing or other soft methods in which case the exit orifice thickness, which must be non-zero for structural stability affects the nozzle performance. A straight section at the nozzle exit will decrease the ratio of spanwise to streamwise momentum flux and will result in a narrower and thicker sheet. In the limit that the exit length becomes arbitrarily large, the sheet becomes a cylinder. A 3D printed nozzle reported by Galinis et al. fabricated using a two-photon polymerization method produced very smooth and flat sheets of micron thickness in vacuum and ambient air.8 Theses sheets and those produced by the laser cut polyimide channels reported by Ha et al. produced similar results with thickness and length/width ratios both being somewhat smaller for the polyimide channels due to having closer to the ideal zero-length, “knife edge” exit.10 Razor blades were used to form the exit aperture in a device reported by Runge and Rosenberg for dye lasers. Dye laser nozzles were, for decades, produced by compression of a steel tube. In their simplest form, a hammer was the only tool needed for fabrication of these relatively large nozzles. A compressed-tube, dye laser nozzle with a razor blade exit reported by Watanabe et al. is perhaps closest to the geometry presented here but is limited in minimum size.9 Although lithography involves a more complex manufacturing process than hammering, highly repeatable structures in a wide variety of sizes are more consistently achieved. This method is not as well suited as 3D printing to producing single prototypes but can scale up to large quantities with ease, bringing the per-part costs down considerably.10
Experimental
Nozzle fabrication
The nozzles used in this study were created via standard lithography methods by Micronit Ltd. Channels in the chips were made by isotropic wet-etch into the surface of glass wafers. A pair of symmetric wafers were then bonded together to form the cavities that would serve as liquid channels. The nozzles were separated from the remainder of the wafer by scoring the surface with a diamond cutting wheel before break-out. Face-seal ports were chosen for ease of production and interfacing. Ports were powder blasted creating an inlet that tapered from 400 μm at the surface to 200 μm in the channel.Exit channel dimensions and convergence angle were chosen by practical considerations. The smallest nozzle dimension chosen was 20 μm depth to limit clogging. Channel width, prior to converging to outlet, was then chosen to minimize sheet thickness in the channel width to channel depth ratio of 2.25 as given by Ha et al.10 A convergence angle of 60 degrees was chosen as a trade-off between sheet thickness and ease of manufacturing. Larger angles produce thinner sheets at comparable distance from the nozzle but are more sensitive to the location of the chip edge with uncertainties in both etch depth and cleave location contributing to a larger variation in nozzle width. Once the smallest practical nozzle design was determined, a set of larger nozzles was also designed to provide a range of sheet sizes from 100's of nm to 10's of microns. As a finishing step, some of the nozzle exit faces were polished with 3 μm lapping film to decrease roughness around the fluid exit. As an unintended consequence, this step increased the nozzle width and added some variation to the range or nozzle widths tested. Sheet thickness data was collected prior to polishing, and the effects of polishing nozzle outlets is further discussed with regards to sheet surface characteristics.
Experimental setup
The fluid delivery system as described in Fig. 2, consisted of an high pressure reciprocating piston pump with a pressure dampener operating in a recirculating setup. Pressure was dampened through use of an air spring in order to which minimized fluctuations to less than what we could observe in sheet length. | ||
| Fig. 2 Fluid was circulated from a reservoir that both collected the nozzle output and fed the pump. Fluid went through a pulse dampener to ensure sheets were observed during unchanging pressure and flow rate. | ||
Although sheet thickness does not depend on flow rate or fluid properties, as shown in Results and discussion – sheet thickness, the sheet length and width are directly impacted by flow rate changes that would result from varying the pressure. For the nozzles tested, flow rates ranged from 3 to 5 ml min−1. Flow rates could be increased beyond the point at which the first sheet would fray and a chain would not form. All sheet measurements were recorded below this limit.
For all measurements, the nozzle was oriented vertically with the liquid flowing downwards from the nozzle. Nozzles were held in an O-ring sealed interface supplied by vendor Neptune Fluid Flow Systems. The fluid was collected within a reservoir that also fed through a filter and back into the HPLC pump. For vacuum operation, a temperature and pressure controlled collector/reservoir was purchased from vendor Innovative Research Solutions.3 In the case of ambient operation, a beaker sufficed as the reservoir.
Given the sheet's similarity to a thin film, a thin film interferometer, Filmetrics model F40, was used to measure the sheet thickness, h. The illumination from the interferometer was focused into the object plane of an optical microscope. Once a sheet was generated, the sheet was maneuvered into the focal plane of the interferometer through use of micron precision X, Y, Z stages as depicted in Fig. 2. By moving the sheet upward, thickness measurements were taken in intervals that were selected for each individual sheet, as each sheet length varied with respect to its nozzle outlet dimensions. Sheet thickness measurements were made in ambient air only.
The sheet length, lj, and sheet width, wj, were measured via positioning in the microscope field of view. The nozzle exit and sheet apex positions were recorded from the stage positions. These positions were recorded for all ambient experiments and a subset was repeated in vacuum for comparison.
Results and discussion
Sheet thickness
Sheet thickness, h, as measured along the centerline at distance x from the nozzle exit was recorded for 11 nozzles and is shown in Fig. 4. The thickness decreased with inverse distance as would be expected for an expanding sheet. Larger sheets were made by larger nozzles with sheet thickness proportional to the area of the nozzle exit. Fig. 4 shows data for nozzles for which nozzle widths were measured and only to distances from the nozzle which could still accommodate the >200 μm focus of our thickness probe. Sheet thickness down to 250 nm could be measured with a more tightly focused probe as shown in the ESI.†The data can be reasonably fit by the relation
 | (1) |
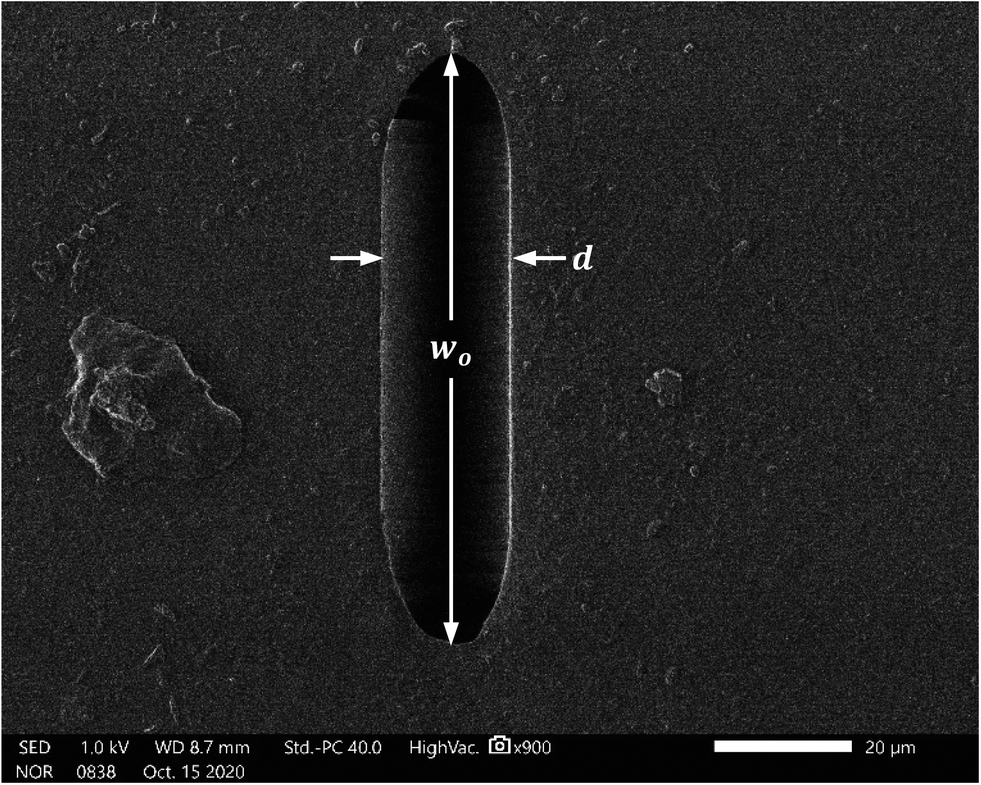 | ||
| Fig. 3 Nozzle outlets formed the geometry shown as a result of isotropic etch and bonding of two glass wafers. Nozzle outlet width, w0, and depth, d, were measured at their maximum distances. | ||
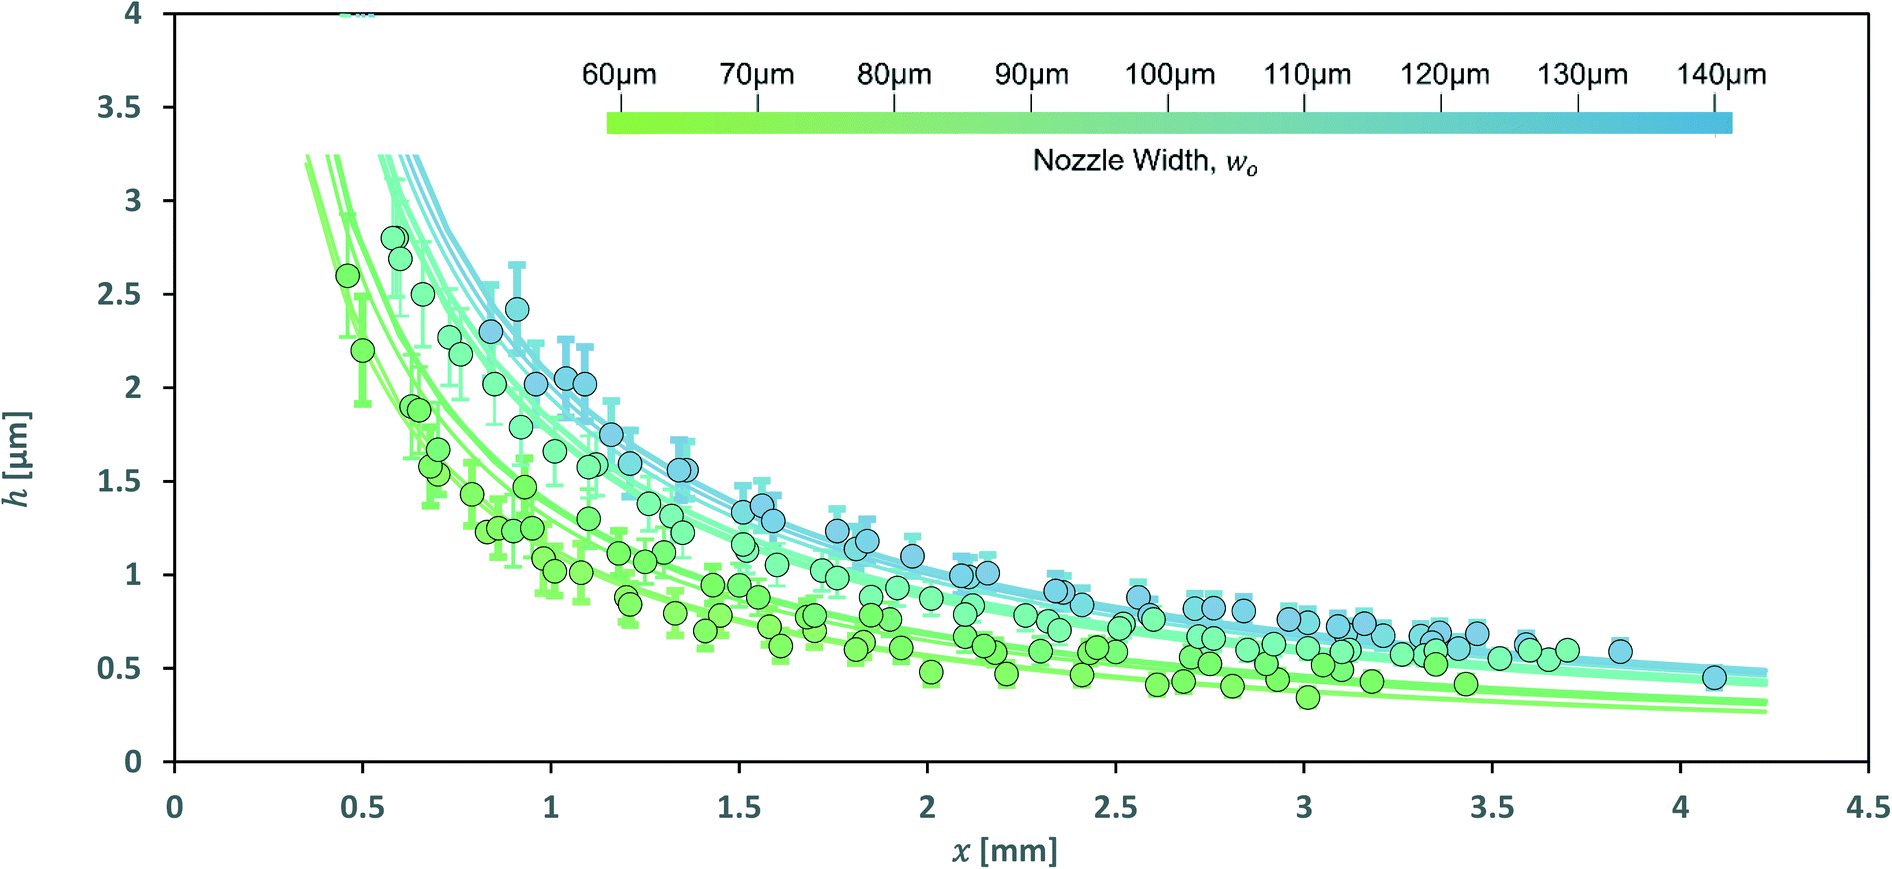 | ||
| Fig. 4 Sheet thickness as measured along the sheet centerline is shown for 11 different nozzles. The width of the nozzle exit aperture varied from 60 μm to 140 μm. Nozzle exit aperture depths ranged from 16–18.4 μm. Solid lines represent the thicknesses calculated by eqn (1). For each respective nozzle outlet width, w0. | ||
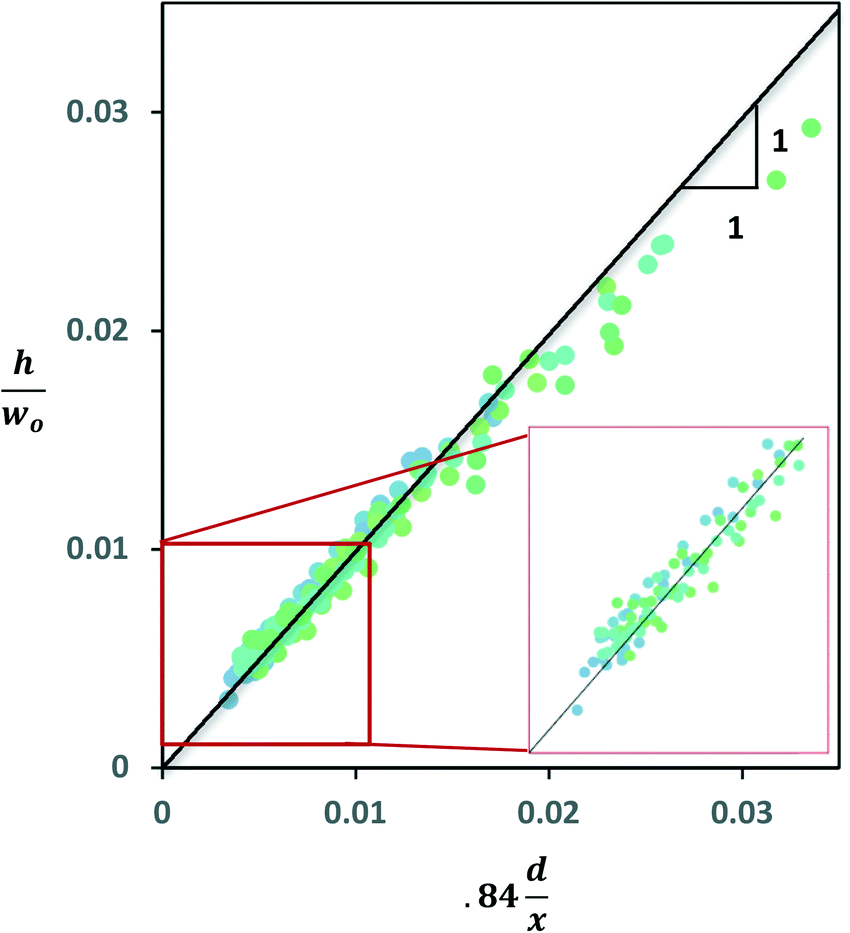 | ||
| Fig. 5 A nondimensionalized collapse of the data demonstrates that measured thicknesses aligned with calculated thicknesses. Deviation from this was prevalent for thicknesses measured at distances from the nozzle exit that 0.76 mm or closer. | ||
The work of Ha et al. used laser-cut polyimide channels which resulted in rectangular channel geometry. They showed that sheet thickness is directly related to the ratio of streamwise to spanwise momentum flux which is itself a function only of the nozzle converging angle.10
For comparison, flow simulations for nozzles of width 100 μm and 45 μm width and 20 μm depth were carried out for both rectangular channel geometry and the rounded channels due to isotropic etch. Flux momentum ratios are in agreement to within 2% for the two nozzle geometries. Nozzle shape did show one difference related to thickness – while the rectangular outlet geometry is dependent on the aspect ratio, that is not found to be true for geometry formed by isotropic etching.
There is no flow rate term in the above expression for sheet thickness. This can be demonstrated by white light interference. Repeating colored bands indicate a change in thickness along the sheet. These fringes were spatially stable with decreasing flow rate, as shown in Fig. 6. This is a valuable feature of sheets created by converging nozzles, as any changes to the pressure or flow rate of the fluid entering the nozzle will not affect the thickness of the targeted area.
 | ||
| Fig. 6 Images showing sheet length at flow rates of (from left to right) 3.1, 2.8, 2.5, and 2.2 ml min−1 from a nozzle with outlet dimensions of 81.8 μm by 18.2 μm. The horizontal lines cross areas of similar color to indicate that sheet thickness was not dependent on flow rate. | ||
Sheet behavior in vacuum
Sheet length and width were not impacted by being placed under vacuum. A nozzle with outlet dimensions of 69.8 μm by 18.4 μm was used to generate a sheet in both atmospheric conditions and under rough vacuum. The chamber was pumped down after the sheet was first generated in atmospheric conditions. The sheet length and width did not differ from each set of conditions given the same flow rate of 2.47 ml min−1, with nozzle pressure measured at 165 psi. During operation, the chamber pressure was kept to 10−1 mbar using a turbo molecular pump with a speed of 2000 L s−1 and a liquid nitrogen cooled surface with a pumping speed of approximately 5000 L s−1 for water.Sheet flatness and surface profile
Many of the nozzles did not initially produce smooth sheet surfaces and required polishing of the nozzle exit surface. The difference in sheet quality between polished and unpolished surfaces can be seen directly in Fig. 9A and B where the same nozzle is compared before and after being polished. Fig. 8 shows the various effects observed by uneven nozzle outlets, with nozzle surface topography, imaged by 3D interferometry, shown next to the sheet generated by that nozzle. Changes in topography of 3 μm are seen in Fig. 8A and B, and the topography of a nozzle post-polish, is shown in Fig. 8C where variations of less than 1 μm had a minimal effect on the sheet surface quality. The dark regions in Fig. 9A are a result of roughness on the sheet's surface that prevent the interference seen in Fig. 9B and C, although these surface characteristics did not measurably impact thickness or thickness measurements.The difference in thickness between any two points on a sheet can be estimated from the color at each location and therefore provides a measure of sheet roughness. The red band near the center of the sheet shown in Fig. 7 is 1.75 mm from the nozzle exit and corresponding to a thickness of 640 nm. Further downstream 100 nm in the orange band, the thickness is 600 nm thick. This implies orange-colored fluctuations on the red band at the sheet midpoint are under 40 nm. Between these ridges and valleys, the sheet surface roughness is too small to measure by this method. A separation of the red/blue/green channels for color data collected along the centerline of the sheet is shown in Fig. 7 and shows smoothly oscillating curves except at the points of surface disturbances. The largest of the red peaks shown was limited by detector saturation.
 | ||
| Fig. 7 The RGB channels from the centerline of the image in Fig. 9B with the detector saturation level set to 1 on the vertical axis. The curves are smoothly periodic except at distances corresponding to small ripples on the sheet surface. | ||
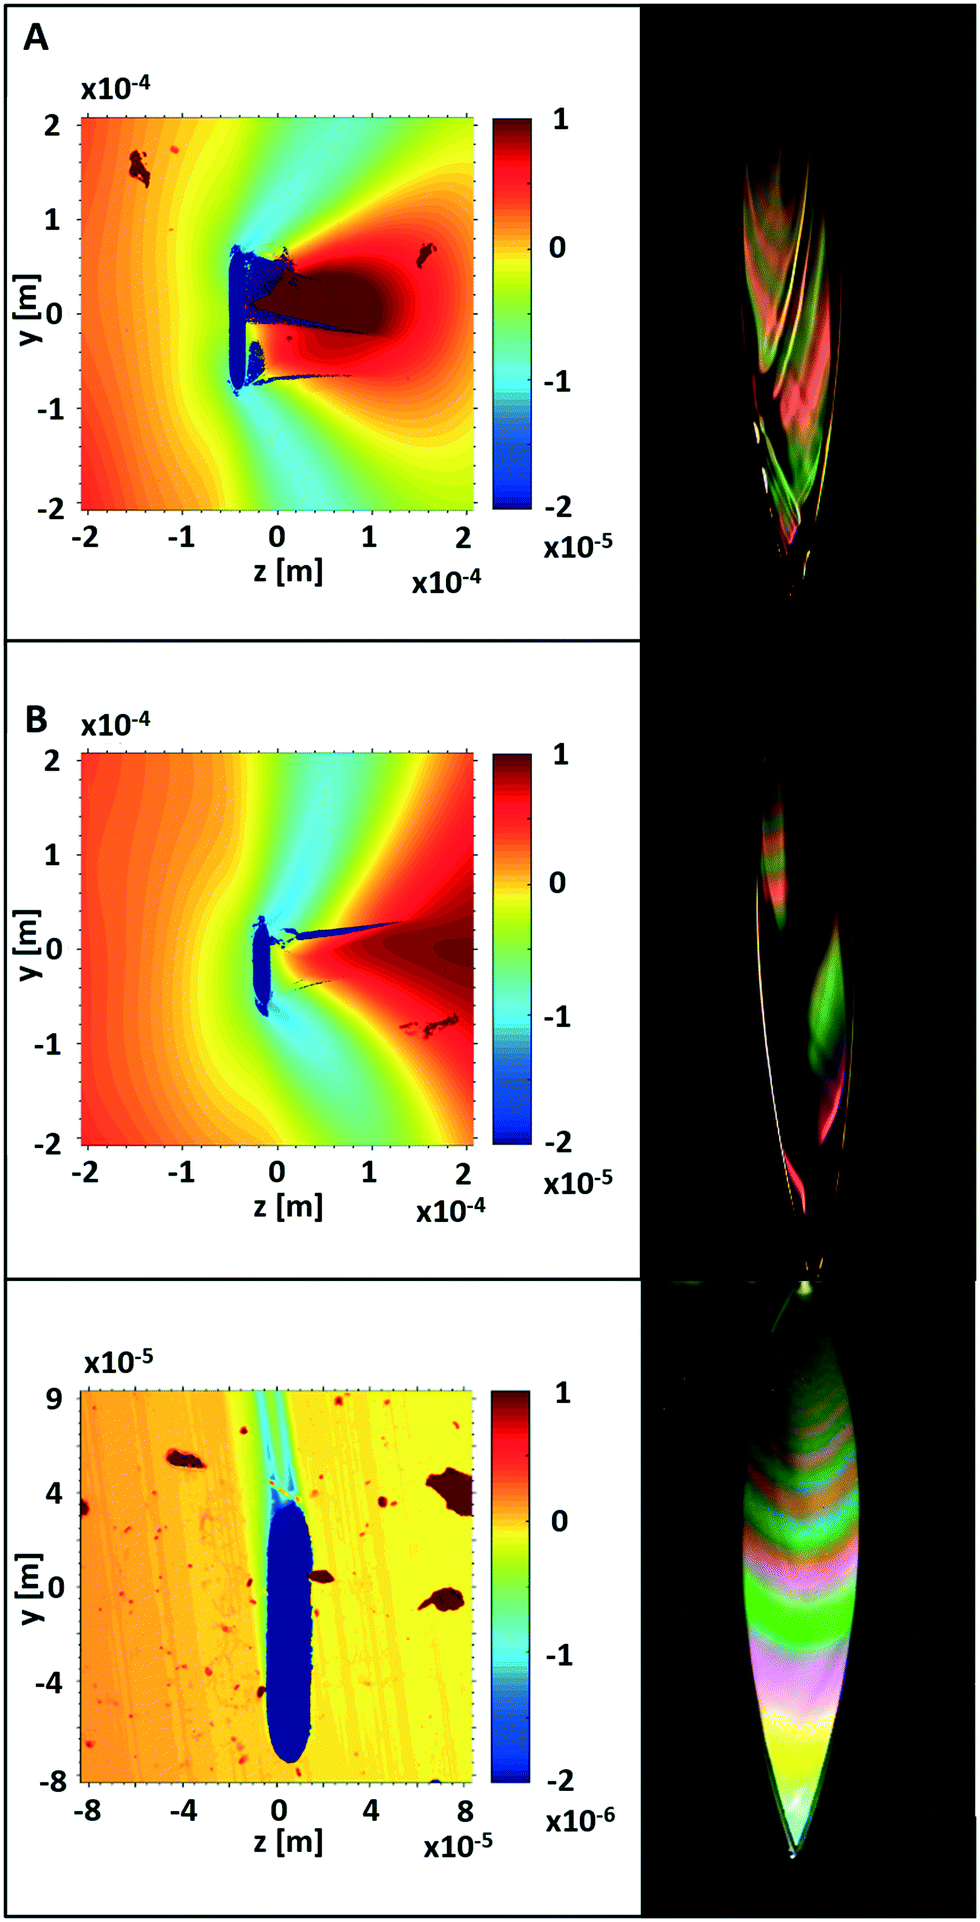 | ||
| Fig. 8 Uneven or rough nozzle outlets had explicit effects on sheet surface behavior. Where the nozzle outlet before polishing in Fig. 8A and B show variations of 3 μm across the surface topography, the sheets these nozzles generate demonstrate with the surface effects shown. After polishing, the nozzle outlet surface topography shown in Fig. 8C generated an optically smooth sheet. | ||
 | ||
| Fig. 9 In A, a liquid sheet is illuminated with white light; in B the surface quality of the sheet is improved after the nozzle exit face has been polished; in C, a 10 ns image was captured using 632 nm light again using the same polished nozzle as in B to demonstrate sheet stability at small time intervals. | ||
To explore the possibility that rapid fluctuations were being averaged out over the camera exposure time, several shorter exposure snapshots were compared. These images as shown in Fig. 5, were taken with an Andor ICCD camera with a 10 ns gated window and a HeNe laser centered at 632.8 nm. No additional short-timescale disturbances within the sheet were found. The use of monochromatic light also allowed for the direct calculation of thickness change, with each fringe period indicating a change in thickness of 257 nm. This is in line with the thickness data collected using thin film reflectometry and gives a higher resolution measurement of thickness change along the sheet.
Electron transmission
A liquid sheet generated by a glass converging nozzle was studied in vacuum, at the Mega-electronvolt Ultrafast Electron Diffraction (MeV-UED) facility in SLAC National Accelerator Laboratory. Here we are reporting the electron scattering data of the heavy water (deuterium oxide, D2O) sheet jet at static conditions with no excitation applied. In vacuum, a sheet was targeted along its centerline, from a starting position of 680 μm from the nozzle outlet, to 1700 μm from the nozzle outlet. This corresponds to sheet thickness ranging from 1.64 μm to 0.66 μm. The sheet thickness range was limited by vacuum requirements; thinner sheets can be obtained further from the nozzle by increasing the flow rate but only at the cost of a larger load on the vacuum pumps. The 3.7 MeV pulsed electron beams were focused onto the sheet jet with 130 μm spot diameters (FWHM); the scattering signal and the transmitted direct beam were measured simultaneously by two separate phosphor screen-based detectors. The electron signals were recorded at various positions along the vertical direction of the sheet. Each data point was collected from 3600 electron pulses each ∼400 fs and consisting of approximately 2 × 10⁵ electrons per pulse. The UED repetition rate was 360 Hz allowing for ample time for sample to be replenished between the UED pulses.Fig. 10 shows the transmission of the direct beam as a function of the sheet jet thickness which was obtained by scanning along the vertical direction of the same sheet jet. Note that the transmission data for thickness below 800 nm are consistent with the previously reported data for a thinner liquid sheet produced by the gas-accelerated jet.3 The experimental data were fit to a simple exponential function showing an 1/e attenuation length of approximately 0.94 μm. This implies that the elastic mean-free-path, (MFP) of MeV electrons in liquid D2O is approximately 0.94 μm.
 | ||
| Fig. 10 The transmission of the direct electron beam or main beam as a function of the heavy water sheet thickness. The red solid line is the exponential fit to the data. | ||
The effect of multiple scattering events for such a sheet jet can be evaluated with the ratio of the high-Q scattering signal over the low Q scattering signal. Here Q is the momentum transfer and is defined as Q = 4π![[thin space (1/6-em)]](https://www.rsc.org/images/entities/char_2009.gif) sinθ/λ, with θ and λ represent the scattering angle and the de Broglie wavelength of the electrons. Fig. 11a shows the radial averaged intensity signal of the diffraction patterns taken for four different sheet jet thicknesses. The rapid drop in scattering intensity at low Q is due to a through hole in the detector center to pass through the direct beam. The scattering signal that is below 4 Å−1 decreases noticeably with increasing the sheet jet thickness, which is indicative of the multiple scattering effect. Fig. 11b shows the ratio of the scattering signal between Q regions of 6.75–9 Å−1 and 0.75–3 Å−1 as a function of sheet jet thickness. Note the ratio was normalized to the value at the thinnest position. As indicated, the data shows clearly a two-trend behavior with the inflection point located approximately at the MFP value. These results facilitate the design of future pump-probed experiments in choosing the appropriate jet thickness to avoid multiple elastic scattering effect. Assuming the total elastic scattered electron intensity Is decreases as
sinθ/λ, with θ and λ represent the scattering angle and the de Broglie wavelength of the electrons. Fig. 11a shows the radial averaged intensity signal of the diffraction patterns taken for four different sheet jet thicknesses. The rapid drop in scattering intensity at low Q is due to a through hole in the detector center to pass through the direct beam. The scattering signal that is below 4 Å−1 decreases noticeably with increasing the sheet jet thickness, which is indicative of the multiple scattering effect. Fig. 11b shows the ratio of the scattering signal between Q regions of 6.75–9 Å−1 and 0.75–3 Å−1 as a function of sheet jet thickness. Note the ratio was normalized to the value at the thinnest position. As indicated, the data shows clearly a two-trend behavior with the inflection point located approximately at the MFP value. These results facilitate the design of future pump-probed experiments in choosing the appropriate jet thickness to avoid multiple elastic scattering effect. Assuming the total elastic scattered electron intensity Is decreases as
| Is = I0(1 − e−x/l) | (2) |
 | ||
| Fig. 11 a Radially averaged scattering signal for four different sheet jet thicknesses. The drastic drop of scattering intensity at Q < 0.75 Å−1 is due to the through-hole at the center of the phosphor screen that was made to avoid the saturation effect from the direct beam. b The ratio of scattering signal at the Q region of 6.75–9 Å−1 over that of 0.75–3 Å−1. The data were normalized to the value at the thinnest position. | ||
The data were of sufficiently high scattering angle that a pair distribution function could be determined. Fig. 12 shows the charge pair distribution function as described by Yang.15 In the 1st Born approximation, the angle averaged electron scattering intensity I(Q) for a liquid is given by
 | (3) |
![[r with combining right harpoon above (vector)]](https://www.rsc.org/images/entities/i_char_0072_20d1.gif) ) is the probability distribution of pairs uv at separation . The CPDF is defined to include all possible pairings of charged particles, nuclear and electron.
) is the probability distribution of pairs uv at separation . The CPDF is defined to include all possible pairings of charged particles, nuclear and electron. | (4) |
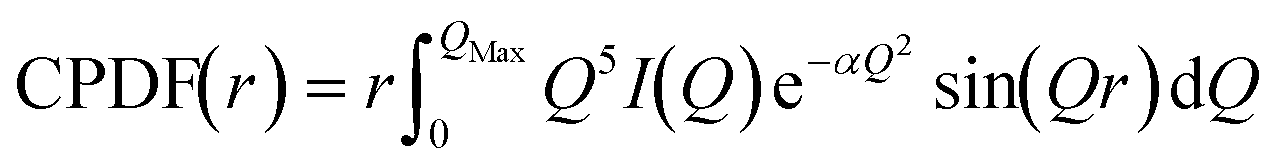 | (5) |
 | ||
| Fig. 12 The D2O charge pair distribution function is shown for data collected at four different sheet thickness and compared to simulation for H2O at 250 K. | ||
Conclusion
Convergent nozzles generate liquid sheets that are predictable and stable within the conditions discussed here. The liquid sheets studied were flat, smooth, and had a thickness that could be made sufficiently thin for use with low penetration probes such as MeV electrons or soft X-rays. The largest surface disturbances were on the order of tens of nanometers with no additional short timescale structures observed at every timescale they were observed under, down to 10 nanosecond time intervals. Sheet length and width are dependent on flow rate but sheet thickness at any fixed distance from the nozzle is independent of flow rate. Pump pulsation therefore has no effect on the path length of fluid encountered by probes as they pass through the sheet. The only extent to which flow rate influences thickness is through sheet length – higher flow implies a longer sheet and it is at the furthest distance along the sheet that it is thinnest.As a first demonstration of the nozzles' utility, they we used at SLAC's MeV-UED facility. MeV electrons were shot through a liquid sheet consisting of heavy water and electron transmission and scattering data were recorded. The collection of electron scattering data in water without noise from a container and for a target thickness that is otherwise difficult to consistently achieve allowed for the determination of the D2O pair distribution function. The thickness of the liquid sheets used was from 34% below to 36% above the MFP of electrons in D2O. Above the MFP, multiple scattering made data analysis more difficult but reasonably good CPDF fits were found for smaller values. The optimal thickness for sheets was not determined; vacuum limitations prevented the thinnest sheets from being probed. However, the sheet range presented in this study covers a range including from 1 MFP to well below the peak in single elastic scattering fraction. Extrapolating from the existing data we would expect 4% of the elastic scattering to be from multiple scattering events at 250 nm, the thinnest sheets reported in this study.
Wet etch lithography seems well suited to nozzle fabrication. While some deviation in nozzle width was found, these deviations can be kept to within a range that there is reasonable coverage of the intended thickness range for each nozzle. Most importantly, the sheet generated is consistent, per nozzle; once characterization is complete, each nozzle can be used to repeatedly re-create the same sheet as would be expected from a simple model for sheet thickness given as a function of nozzle distance and nozzle outlet cross sectional area. All nozzles fabricated by this method were able to produce liquid sheets within the expected range of sizes. Nozzle surface roughness was highly variable for unpolished sheets. For applications requiring 10's of nm surface roughness or better, the polishing and characterization steps carried out in this study may likely be eliminated by improved fabrication. Perhaps lithographically defined chip boundaries, laser dicing, use of crystalline silicon or quartz rather than amorphous glass, or some combination will suffice. Most important is that these nozzles can be produced in large batches and based on standard microfluidic chip layouts thereby reducing costs and simplifying interfacing.
Author contributions
C. C. conducted collection and analysis of sheet dimensions; C. C. wrote the manuscript; M. M. wrote the electron transmission section of the manuscript; Z. C. set up optics for sheet surface data collection; D. A. H. conducted error analysis; J. P. F. N. designed the LUED sample chamber and analyzed the static water data; K. L. designed the sample delivery system; M. M. performed LUED experiments using converging nozzles; X. S. optimized the MeV electron beam for LUED experiments; J. Y. performed LUED experiments, advised on the design and implementation of the LUED chamber and sample delivery; H. W. conducted simulations, M. L. N. conducted metrology data analysis, D. P. D. developed the converging liquid jets and supervised their adaptation to UED; D. P. D. supervised the project.Conflicts of interest
There are no conflicts to declare.Acknowledgements
This research used the resources of SLAC National Accelerator Laboratory, supported by the U.S. Department of Energy, Office of Science, Office of Basic Energy Sciences under Contract No. DE-AC02-76SF00515, and Stanford University, Applied Physics. The work of M. M., Z. C., and S. H. G. is supported by U.S. Department of Energy, Office of Science, Fusion Energy Sciences under FWP100182. M. M. would also like to thank the support from Department of Energy, Laboratory Directed Research and Development program at SLAC, under contract DE-AC02-76SF00515.Notes and references
- M. Ekimova, W. Quevedo, M. Faubel, P. Wernet and E. T. J. Nibbering, A liquid flatjet system for solution phase soft-x-ray spectroscopy, Struct. Dyn., 2015, 2(5), 054301 CrossRef PubMed.
- J. D. Koralek, J. B. Kim, P. Brůža, C. B. Curry, Z. Chen and H. A. Bechtel, et al., Generation and characterization of ultrathin free-flowing liquid sheets, Nat. Commun., 2018, 9, 1353 CrossRef PubMed.
- J. P. F. Nunes, K. Ledbetter, M. Lin, M. Kozina, D. P. DePonte and E. Biasin, et al., Liquid-phase mega-electron-volt ultrafast electron diffraction, Struct. Dyn., 2020, 7(2), 024301 CrossRef CAS PubMed.
- K. M. George, J. T. Morrison, S. Feister, G. K. Ngirmang, J. R. Smith and A. J. Klim, et al., High-repetition-rate (>= kHz) targets and optics from liquid microjets for high-intensity laser–plasma interactions, High Power Laser Sci. Eng., 2019, 7, e50 CrossRef CAS.
- L. Obst, S. Göde, M. Rehwald, F.-E. Brack, J. Branco and S. Bock, et al., Efficient laser-driven proton acceleration from cylindrical and planar cryogenic hydrogen jets, Sci. Rep., 2017, 7(1), 10248 CrossRef PubMed.
- M. Mo, S. Murphy, Z. Chen, P. Fossati, R. Li and Y. Wang, et al., Visualization of ultrafast melting initiated from radiation-driven defects in solids, Sci. Adv., 2019, 5(5), eaaw0392 CrossRef CAS PubMed.
- M. Gauthier, C. Curry, S. Göde, F. Brack, J. Kim and M. MacDonald, et al., High repetition rate, multi-MeV proton source from cryogenic hydrogen jets, Appl. Phys. Lett., 2017, 111, 114102 CrossRef.
- G. Galinis, J. Strucka, J. C. T. Barnard, A. Braun, R. A. Smith and J. P. Marangos, Micrometer-thickness liquid sheet jets flowing in vacuum, Rev. Sci. Instrum., 2017, 88(8), 083117 CrossRef PubMed.
- A. Watanabe, H. Saito, Y. Ishida, M. Nakamoto and T. Yajima, A new nozzle producing ultrathin liquid sheets for femtosecond pulse dye lasers, Opt. Commun., 1989, 71(5), 301–304 CrossRef CAS.
- B. Ha, D. P. DePonte and J. G. Santiago, Device design and flow scaling for liquid sheet jets, Phys. Rev. Fluids, 2018, 3(11), 114202 CrossRef.
- J. Bush and A. Hasha, On the collision of laminar jets: fluid chains and fishbones, J. Fluid Mech., 2004, 511, 285–310 CrossRef.
- Y. J. Choo and B. S. Kang, Parametric study on impinging-jet liquid sheet thickness distribution using an interferometric method, Exp. Fluids, 2001, 31(1), 56–62 CrossRef.
- D. S. Hasson and R. E. Peck, Thickness distribution in a sheet formed by impinging jets, AIChE J., 1964, 10, 752–754 CrossRef.
- V. Sanjay and A. K. Das, Formation of liquid chain by collision of two laminar jets, Phys. Fluids, 2017, 29(11), 112101 CrossRef.
- J. Yang, J. P. F. Nunes, K. Ledbetter, E. Biasin, M. Centurion and Z. Chen, et al., Structure retrieval in liquid-phase electron scattering, Phys. Chem. Chem. Phys., 2021, 23(2), 1308–1316 RSC.
- A. K. Soper, The radial distribution functions of water and ice from 220 to 673 K and at pressures up to 400 MPa, Chem. Phys., 2000, 258, 121–137 CrossRef CAS.
- B. J. Siwick, J. R. Dwyer, R. E. Jordan and R. J. D. Miller, Femtosecond electron diffraction studies of strongly driven structural phase transitions, Chem. Phys., 2004, 299(2), 285–305 CrossRef CAS.
- G. R. Anstis, Z. Liu and M. Lake, Investigation of amorphous materials by electron diffraction — The effects of multiple scattering, Ultramicroscopy, 1988, 26(1), 65–69 CrossRef.
- J. A. Sellberg, C. Huang, T. A. McQueen, N. D. Loh, H. Laksmono and D. Schlesinger, et al., Ultrafast X-ray probing of water structure below the homogeneous ice nucleation temperature, Nature, 2014, 510(7505), 381–384 CrossRef CAS PubMed.
Footnote |
| † Electronic supplementary information (ESI) available. See DOI: 10.1039/d1lc00757b |
| This journal is © The Royal Society of Chemistry 2022 |