A highly precise micro-analytical XRF method for compositional characterization of fast breeder reactor fuels†
Kaushik
Sanyal
 ac,
Buddhadev
Kanrar
 ac,
Shiny S.
Suresh
bc and
Sangita
Dhara
 *ac
*ac
aFuel Chemistry Division, Bhabha Atomic Research Centre, Mumbai, 400085, India. E-mail: sdhara@barc.gov.in
bRadiochemistry Division, Bhabha Atomic Research Centre, Mumbai, 400085, India
cHomi Bhabha National Institute, Anushakti Nagar, Mumbai, 400094, India
First published on 15th November 2021
Abstract
Accurate and precise determination of plutonium and uranium in Fast Breeder Reactor (FBR) fuels is one of the most important steps in the chemical quality control of these fuels. Along with high precision, minimization of radioanalytical waste generated during measurements is of equal importance. Till date, routine wet radioanalytical techniques used for this purpose produce a lot of radioactive waste which needed an extensive recovery procedure. This paper describes a novel and simple micro-analytical method for determination of the Pu percentage with respect to uranium in fast reactor nuclear fuels, both carbide and oxide, using micro X-Ray Fluorescence (μ-XRF) spectrometry. The developed methodology requires ∼200 ng of sample for analysis and the radioactivity in such sample specimens is below 500 becquerel. Therefore, these sample specimens could be isolated with a layer of Scotch tape and analyzed. The detection limit for U and Pu, obtained using the developed methodology was ∼60–64 ng mL−1. Using a single calibration plot, the Pu percentage in fuel samples could be determined in the entire concentration range from 10 to 90% for both the fuels. The average precision obtained was 0.23% (1σ; n = 3) for samples having a (U/Pu) concentration of <100 μg mL−1 in the final aliquot (sample deposition volume was 2 μL) and the deviations from the expected results (calculated on the basis of sample preparation) were within 0.21%. The developed methodology minimizes radiological waste to a great extent and reduces radiotoxic burden on the environment. Due to high precision and accuracy of the obtained analytical results, this micro-analytical methodology can evolve as a potential alternative to wet chemical methods used routinely.
Introduction
Nuclear energy is a viable alternative source of energy to the largest non-renewable resource, coal. In India, where there is a very high demand for energy, the potential of nuclear energy can be substantially increased with Fast Breeder Reactors (FBRs). A FBR is a type of reactor which uses high energy neutrons or fast neutrons to generate more nuclear fuel than they consume during the production of power. In India, the Fast Breeder Test Reactor (FBTR) and Prototype Fast Breeder Reactor (PFBR) are the two fast reactors in which carbide and oxide based (U and Pu) fuels are used.1 The Indian three stage nuclear energy program is based on the closed nuclear fuel cycle concept where artificially produced Pu, from nuclear reactors, is reprocessed and used as a fuel for FBRs. The driver fuel of the FBTR is a unique Pu rich mixed carbide (Pu, U)C and that of the PFBR is (U, Pu)O2.1,2 Both (U, Pu) oxide and carbide fuels are produced using powder metallurgy routes following stringent quality control steps necessary for the fabrication of fuel pellets.3,4An accurate and precise method for compositional characterization of Pu and U in nuclear fuels is very important due to stringent specifications designed to achieve the desired performance of the nuclear fuel inside the reactor under operating conditions. There are only a few analytical techniques available for simultaneous determination of U and Pu.5–7 Gamma and alpha spectrometry techniques are also used for such determinations.8,9 However, these methods can be applied only to gamma and alpha active elements and the accuracy and precision obtained are poor. Wet chemical analysis methods are always prioritized owing to their capability to provide results with accuracy and precision <1%. However, these methods require an elaborate sample preparation methodology and addition of many chemicals and reagents.10–12 Also the sample amount required for analysis is high. These factors generate a high amount of hazardous radioactive waste during analysis in the range of 1–5 mg per aliquot.13 The Indian nuclear energy power program envisages minimising the production of radioanalytical waste, so as to reduce the radiotoxic burden on the environment.14 Hence, a lot of efforts are being made to develop procedures and strategies which will minimize radioactive waste in the nuclear industry. So, along with high precision and accuracy, minimization of radioanalytical waste produced during the composition characterization of nuclear fuels is one of the major concerns.
X-Ray Fluorescence (XRF) is a well established method for characterization of nuclear materials. It is a simple, versatile and fast analytical technique requiring minimum sample preparation.15 However, it could not compete with electroanalytical methods in terms of precision and accuracy. Moreover, it suffers from severe matrix effect and poor detection limits. The thin film sample preparation method has been applied for the analysis of other types of samples in the past. In this method the matrix effect and detection limits were minimized to some extent.16 In case of radioactive samples, such a method of analysis reduces the radiation burden on instruments, especially detectors and also minimizes radioanalytical waste. Further, the need to enclose the entire instrument inside a glovebox can also be avoided. However, using this methodology the average precision obtained was 4% (1 s, n = 3) and the analytical results deviated by 4%.16 The poor precision and accuracy can be attributed to the non-uniform distribution of analytes and the internal standard on thin transparent adhesive tape after drying. Though extreme care is taken to deposit the sample, depending on its concentration, solvent and method of drying, the sample spot area and position may vary.17 This leads to poor analytical results. Micro-XRF (μ-XRF) is a microanalysis technique based on the principles of Energy Dispersive X-Ray Fluorescence (EDXRF). It is a multielemental analysis method with the capability of elemental mapping and distribution. The X-ray beam emited from the X-ray tube is generally having the size of a few millimeters. After incorporation of polycapillary, the beam is focussed to micron size. The insertion of polycapillary optics increases the X-ray flux density in comparison to the conventional XRF spectrometers. So, a drastic improvement in the signal to background ratio is achieved using the μ-XRF technique in combination with the thin film sample deposition methodology.18 Moreover, very high counts are also obtained due to the utilization of the entire bremsstrahlung spectrum emitted from the tube for excitation of the sample.19 However, the most advantageous feature of μ-XRF analysis is the possibility of excitation of the whole sample spot area on the support, irrespective of its size due to the step wise scanning of the sample stage at the micron level. This takes care of all the inhomogenities in the analytical results due to the uneven distribution of analytes while drying the sample.
This paper describes a novel yet simple and direct microanalytical method with high precision and accuracy for compositional characterization of U and Pu based fuels by μ-XRF, with great focus on mitigating the radiological waste generated during sample analysis. The radioactive micro-samples (<200 ng) were isolated using Scotch tape and analyzed in the ambient atmosphere. Such a method of analysis will also reduce the radiation burden on the spectrometer and the analyst. All these aspects are described in detail in this manuscript.
Experimental
Sample preparation
The Merck ICP standard solution of U having an elemental concentration of 1000 μg mL−1 was diluted to 100 μg mL−1 using 1.5% supra pure HNO3 in Milli-Q water. It was used as a stock solution for preparation of synthetic solutions. Since standards of Pu are not commercially available, a nuclear grade Pu solution having a concentration of 86.95 ± 0.20 μg mL−1, as determined by biamperometry, was used as the stock solution for Pu. Synthetic solutions of Pu and U for calibration and validation were prepared using these stock solutions. The details of these synthetic solutions are given in Table 1 (S-1 to S-6). The concentration of Pu was varied from 9.66 to 77.3 μg mL−1 and the Pu percentage with respect to U was from 9.8 to 87.4. Solutions S-1, S-2, S-4 and S-6 were used to construct the calibration curve and S-3 and S-5 were used for validation purpose.| Sample name (used for) | U conc. (μg mL−1) | Pu conc. (μg mL−1) | U conc. (%) | Pu conc. (%) |
|---|---|---|---|---|
| S-1 (calibration) | 88.89 | 9.66 | 90.20 | 9.80 |
| S-2 (calibration) | 80 | 17.39 | 82.14 | 17.86 |
| S-3 (validation) | 50 | 43.48 | 53.49 | 46.51 |
| S-4 (calibration) | 40 | 52.18 | 43.40 | 56.60 |
| S-5 (validation) | 20 | 69.57 | 22.33 | 77.67 |
| S-6 (calibration) | 11.11 | 77.30 | 12.57 | 87.43 |
It is very important to validate any developed methodology with real samples. So, two carbide (U and Pu)C samples of FBTR Mark-I fuel and two oxide (U and Pu)O2 samples of PFBR fuel were analyzed. For the dissolution of FBTR Mark-I fuel, the powdered carbide sample was refluxed in a mixture of conc. H2SO4![[thin space (1/6-em)]](https://www.rsc.org/images/entities/char_2009.gif) :
:![[thin space (1/6-em)]](https://www.rsc.org/images/entities/char_2009.gif) HNO3 with a 1
HNO3 with a 1![[thin space (1/6-em)]](https://www.rsc.org/images/entities/char_2009.gif) :
:![[thin space (1/6-em)]](https://www.rsc.org/images/entities/char_2009.gif) 1 ratio, for around 2 hours till a clear solution was obtained.20 The oxide fuel samples were dissolved in conc. HNO3 containing 0.05 M HF under IR heating. After dissolution the solution was evaporated completely and then fumed with conc. HNO3 to remove HF. This was repeated twice or thrice to remove HF completely, followed by re-dissolution of the sample in 1 M dilute nitric acid.7 All the dissolutions were carried out inside a glove box. The four solid samples dissolved were as follows: two carbide (U, Pu)C samples (carbide 1 and carbide 2) and two oxide (U, Pu)O2 (oxide 1 and oxide 2) samples. The resultant Pu concentrations of the solutions were in the range of 3–5 mg mL−1. After dissolution the sealed samples were transferred from the glove box to a fume hood for further analysis.
1 ratio, for around 2 hours till a clear solution was obtained.20 The oxide fuel samples were dissolved in conc. HNO3 containing 0.05 M HF under IR heating. After dissolution the solution was evaporated completely and then fumed with conc. HNO3 to remove HF. This was repeated twice or thrice to remove HF completely, followed by re-dissolution of the sample in 1 M dilute nitric acid.7 All the dissolutions were carried out inside a glove box. The four solid samples dissolved were as follows: two carbide (U, Pu)C samples (carbide 1 and carbide 2) and two oxide (U, Pu)O2 (oxide 1 and oxide 2) samples. The resultant Pu concentrations of the solutions were in the range of 3–5 mg mL−1. After dissolution the sealed samples were transferred from the glove box to a fume hood for further analysis.
Preparation of the sample specimen for μ-XRF
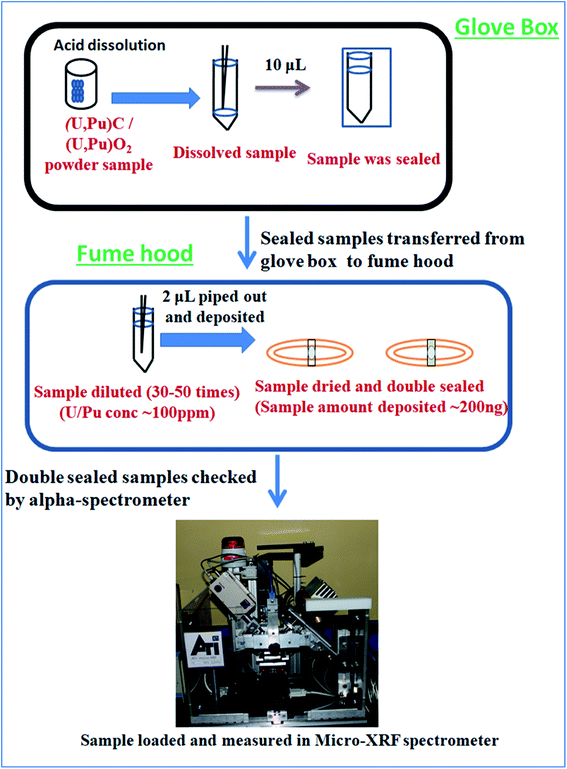
Caution! It is to be remembered that Pu is a highly radioactive (t1/2 = 2.4 × 10⁴ years) and radiotoxic element. Utmost care has been taken while handling Pu based samples. The dissolution of carbide (carbide 1and carbide 2) and oxide (oxide 1and oxide 2) fuels was carried out inside a glove box as described above. After complete sample dissolution the samples were transferred into a vial and stored. Since much less sample amount was required for analysis, only 10 μL of the samples were transferred into another vial, sealed properly and then taken out of the glovebox. From the glovebox the samples were transferred to a fumehood and the seal was removed. The concentration of Pu in the undiluted samples was 3–5 mg mL−1. Since, we cannot handle high radioactivity (activity should be <1000 becquerel) in the laboratory, all the samples were diluted such that the resultant concentration of Pu in the sample solutions was <100 μg mL−1. The samples were diluted using 3 M supra pure HNO3 in Milli-Q water in such a way that the final concentration of U/Pu in the sample solutions always remained below 100 μg mL−1. So, the samples were diluted 30 to 50 times depending on the initial sample concentration. All these sample preparation procedures were carried out inside a fume hood well equipped for Pu handling in solution form. Fig. 1 shows the pictorial representation of all the steps of sample preparation carried out in this work. The necessary precautions required for Pu handling, e.g. wearing lab coats, hand gloves, thermo-luminescence dosimeter badges etc., were strictly followed. Further, before taking the samples out for XRF measurements, they were cleaned from outside and checked for any loose contamination.A commercially available thin transparent adhesive Scotch tape film (“3 M Science Applied to Life” (USA)) was used for sample deposition. The Scotch tape was a ∼50 μm thick transparent film with a very high strength acrylic adhesive which adheres instantly to a wide variety of surfaces. The backing material is PVC (Poly Vinyl Chloride) exhibiting high clarity, with moisture, chemical and UV resistance as well as non-staining properties. This thin film was spread over an Al disk, having 30 mm inner diameter, 40 mm outer diameter and 2 mm thickness. This Al disk was used as the sample support for μ-XRF measurement. An aliquot of 2 μL of each solution (both standards and samples) was deposited exactly at the centre of the circular disk on the Scotch tape. So the sample amount deposited was ∼200 ng and the total radioactivity deposited was less than 460 becquerel (Bq). Since the samples were measured in a spectrometer which was kept in the ambient atmosphere with no confinement, it was very necessary to keep the level of radioactivity as low as possible. Further, the Pu particles in the samples should be in non-dispersible form for handling them in the ambient atmosphere.21 These sample specimens were kept for drying overnight inside the active fume hood. After drying, the samples were double sealed by using another small piece of Scotch tape such that the sample spot was completely sealed. Fig. 2 shows the picture of the sample double sealed in between the pieces of thin transparent Scotch tape supported on the aluminum disc. After that the samples were first wiped with wet tissue paper containing Milli-Q water and then with dry tissue paper to ensure the removal of any loose contamination. All the sample specimens were taken out from the fume hood and placed in a Petri dish and taken to the counting room, where each sample specimen was checked by using an alpha-spectrometer to ensure that there is no loose contamination on the sample specimens. After ensuring that these specimens are fit to be handled in the ambient atmosphere, they were measured by using a μ-XRF spectrometer. All the samples were measured in triplicate to estimate the precision.
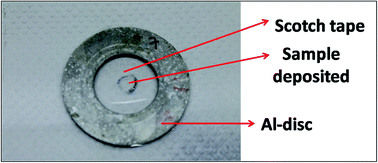 | ||
| Fig. 2 Picture of the sample containing ∼200 ng (U/Pu) dropcasted at the center and double sealed in between the pieces of thin transparent Scotch tape supported on an aluminum disc. | ||
Instrumentation
As the sample was dropcast using a micropipette on a thin transparent film, it is very important to determine the exact location of the sample spot before carrying out the μ-XRF measurements, so that we can exclusively excite the sample area. First, the sample spot was visually identified and the X-ray beam was focused over that spot, then an elemental line present in that sample (Pu L3 (14.28 keV) line) was chosen as the marker line and a line scan was performed for 500 μm (step size 25 μm, measurement time 5 s) along the X axis of the sample spot. This line scan produces a Gaussian like intensity profile. The maxima in general indicates the centre of the spot (along the X axis) and the terminal points along the X axis are indicated by the minima (basically defines the start and end of the sample residue). So this plot indicates the spread of the sample residue along the X axis. The same procedure was followed to determine the spread of the sample spot along the Y axis. The starting point was chosen at the maxima point of the Gaussian plot obtained after performing X scan and is shown in Fig. 3. This experiment gives an exact idea about the location of the centre of the sample spot. As can be seen from Fig. 3, most of the sample is situated within 400–500 μm along the X and Y axis. Hence for area scanning over the droplet residue, 400 × 400 μm area was chosen around the centre of the sample spot with a step size of 40 μm for all the samples. A measurement time of 10 s was chosen for each step which results in a total measurement time of 1000 s for each sample. The sum spectra obtained after the area scan of each sample were used for the analysis purpose. The typical μ-XRF spectra of carbide and oxide fuel are shown in Fig. S1 (ESI†). It is to be noted that there are several elemental peaks like S Kα, K Kα, Ca Kα, Ti Kα, Fe Kα and Zn Kα, seen in the spectrum. These were present in the samples as impurities. The major contribution of the background comes from the Bremsstrahlung continuum which is spread across the energy region from 4–14 keV. The Pu L3 and U L3 lines having energies of 14.28 keV and 13.62 keV, respectively were used as the analytical lines for quantification. The sum spectra were processed using AXIL QXAS 3.6 software.22 The fitting of the spectral data was performed by the least square fitting procedure by minimizing the χ2 value.
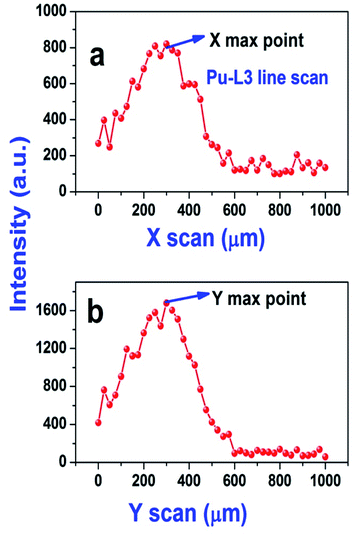 | ||
| Fig. 3 Line scan performed along the X (a) and Y (b) axis for a (U and Pu)C fuel sample solution (the marker line chosen was the Pu L3 line). | ||
In order to counter check the analytical results obtained using μ-XRF, U and Pu percentages in the same samples were also determined by Ti(III) reduction and AgO oxidation methods, respectively using a biamperometric end point.11,12
Results and discussion
Though the biamperometric method is widely used in the nuclear industry for determination of U and Pu, simultaneous determination of U and Pu is not possible using this method. However, using XRF based techniques we can determine the relative percentage of U and Pu. Further, as we determine the relative ratios, there is no need to accurately weigh the sample during the dissolution process. This is one of the very crucial advantages of this method, as we can avoid the errors associated with the weighing process and we can use sample amount <1 mg for dissolution.The calibration plots for U and Pu percentage determination were made using the synthetic standard solutions (S-1, S-2, S-4 and S-6) and by plotting the relative intensity ratios of U and Pu in percentage as a function of expected concentration (in percentage) calculated on the basis of sample preparation. The relative intensity ratio (in percentage) was calculated using the formula given below:
 | (1) |
Fig. 4 shows the calibration curves of U and Pu obtained using the above standard solutions. Two separate calibration plots were made for U and Pu. A linear calibration curve was obtained with a very good correlation coefficient (R2 = 0.999) for both the elements. The equation obtained from the calibration plot, was used to determine the relative concentration (in percentage) of U and Pu in different fuel samples.
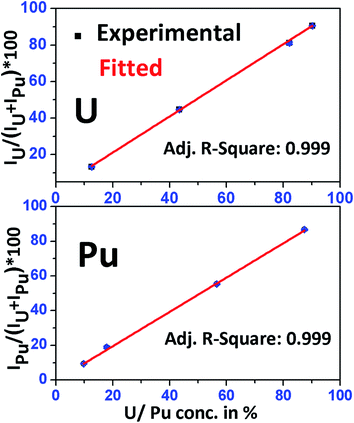 | ||
| Fig. 4 Calibration curve obtained for uranium and plutonium using standard solutions S-1, S-2, S-4 and S-6 having known concentrations of uranium and plutonium in them. | ||
For evaluation of the detection limits of U and Pu, the synthetic sample (S-3) containing almost equal amounts of U and Pu was diluted using Milli-Q water such that, the resulting concentration was nearly 1 μg mL−1 for both the analytes. An aliquot of 2 μL was deposited on thin transparent Scotch tape and isolated as described above. The μ-XRF spectrum was recorded over the droplet residue having 400 × 400 μm area and step size of 40 μm. The measurement time was 10 s for each step, so the total measurement time was 1000 s. The sum spectrum/average spectrum generated after the area scan was used for the determination of the detection limit. The detection limit was calculated using the following equation:
 | (2) |
| Elements | Background counts | Peak counts | Detection limit (ng mL−1) |
|---|---|---|---|
| U | 8502 | 29![[thin space (1/6-em)]](https://www.rsc.org/images/entities/char_2009.gif) 550 550 |
61 |
| Pu | 7380 | 24![[thin space (1/6-em)]](https://www.rsc.org/images/entities/char_2009.gif) 934 934 |
64 |
The validation of the methodology was performed using the synthetic solutions S-3 and S-5 (Table 1). The relative percentage of U and Pu was calculated using their respective calibration regression equation (Fig. 4). The average relative standard deviation (RSD) calculated using three sample specimens was 0.31% (σ = 1) and 0.16% (σ = 1), respectively for the determination of the relative percentage of U and Pu. The average deviation from the expected values calculated on the basis of sample preparation was 0.22% and 0.20%, respectively for U and Pu. The analytical results are tabulated in Table 3. The accuracy and precision obtained using this developed methodology are comparable to those obtained by the biamperometric method with added advantages of no chemical pretreatment, requirement of a few nanograms of sample, negligible waste generation, no cumbersome recovery process, etc. All these added advantages make this methodology an extremely simple yet effective technique for the routine analysis of U and Pu in different types of fuel samples.
| Sample name | Expected relative amount (A) (%) | μ-XRF determined relative amount (B ± σ) (%) | Devb (%) | RSDc (%) | ||||
|---|---|---|---|---|---|---|---|---|
| U | Pu | U | Pu | U | Pu | U | Pu | |
| a ±: 1σ was calculated using n = 3. b Dev. (%) = (BU/Pu − AU/Pu)/AU/Pu × 100. c RSD (%) = (σU/Pu/BU/Pu) × 100. | ||||||||
| S-3 | 53.49 | 46.51 | 53.56 ± 0.09 | 46.43 ± 0.09 | 0.13 | −0.17 | 0.17 | 0.19 |
| S-5 | 22.33 | 77.67 | 22.4 ± 0.1 | 77.5 ± 0.1 | 0.31 | −0.22 | 0.45 | 0.13 |
| Avg. dev.: 0.21 | Avg. RSD: 0.23 | |||||||
A comparison of different techniques used for the determination of U and Pu is given in Table 4. The developed methodology has many advantages compared to the other existing well established methods of analysis in nuclear fuel samples.
| Method used | Simultaneous analysis | Sample amount required | Accuracy and precision | LODs | Acquisition cost/annual operating cost | Measurement time | Ref. |
|---|---|---|---|---|---|---|---|
| Spectro photometry | Yes | Large (few mg) | Precision ∼ 3% | 50![[thin space (1/6-em)]](https://www.rsc.org/images/entities/char_2009.gif) 000 ng mL−1 000 ng mL−1 |
Moderate/low | 1–2 min | 23 |
| Biamperometry | No | Large (few mg) | Accuracy and precision within 0.2% | NA | Low/low | 10–15 min for measurement, however the associated recovery process requires 1–2 days | 12 |
| Cyclic voltammetry | Yes, however cannot analyze Pu and U in the complete concentration range | Large (few mg) | Accuracy 0.5%, precision 0.2% | 2120 ng mL−1 for U and 3720 ng mL−1 for Pu | Low/low | 15 min | 10 |
| EDXRF | Yes | 50 μg | Accuracy 2%, precision 1% | 4000 ng mL−1 | High/low | 15–20 min | 7 |
| μ-XRF thin film sample preparation | Yes | 200 ng | Accuracy 0.21%, precision 0.23% | 61 ng mL−1 for U and 64 ng mL−1 for Pu | High/low | ∼15 min | This work |
| Can analyze U and Pu in all conc. ranges |
Determination of the relative percentage of U and Pu present in FBTR Mark-I and PFBR fuels
Two samples of (U and Pu) oxide and two (U and Pu) carbide samples were received from the fuel fabrication unit. These samples were dissolved inside a glove box and transferred to an active fume hood. During the sample preparation, 2 μL of the sample solution was dropcast and dried under ambient conditions. The details of the sample preparation steps are shown in Fig. 2. Using μ-XRF, both elemental quantification and distribution can be studied. Elemental mapping, to probe the distribution of the analytes Pu and U in the sample specimen prepared for μ-XRF analysis, was carried out for oxide and carbide samples. A step size of 35 μm and scan rate of 2 s were chosen for obtaining the elemental mapping data of the sample spot. Fig. 5 shows the distribution of U and Pu in the oxide and carbide samples. It can be clearly seen from the figure that after drying of the sample, there was inhomogeneous migration and non-uniform distribution of Pu and U in the sample specimens. This inhomogeneity can severely affect the results if the sample spot is not measured precisely. In the carbide fuel sample, distribution of U and Pu was observed to be comparatively more homogeneous, however in the case of oxide samples the distribution was highly inhomogeneous. The inhomogenities in analyte distribution are unpredictable and occur due to differential migration of U and Pu during the drying process, which can lead to poor analytical results. However, this problem can be taken care using μ-XRF scanning. During the μ-XRF analysis, almost 90% of the sample spot was covered for analysis. Such micron size scanning of the sample can take care of inhomogenities in analyte distribution within the sample specimens.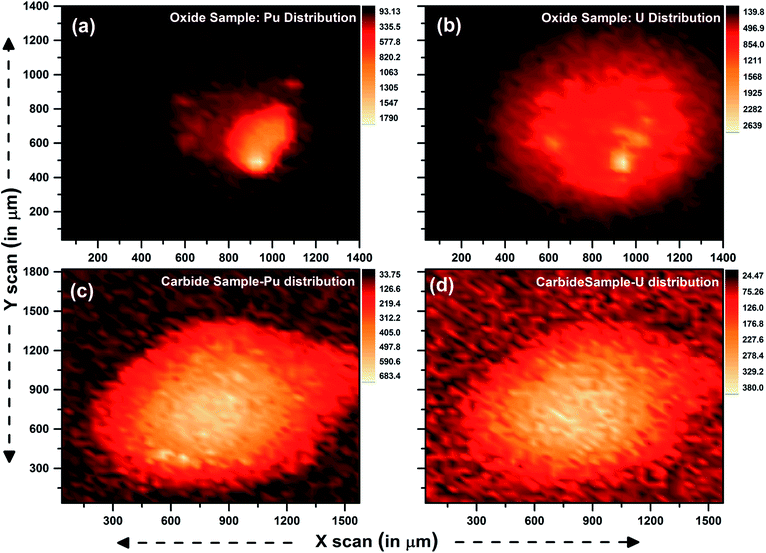 | ||
| Fig. 5 μ-XRF image showing the distribution of U and Pu in oxide and carbide fuel sample solution deposited on thin Scotch tape and dried in the ambient atmosphere. | ||
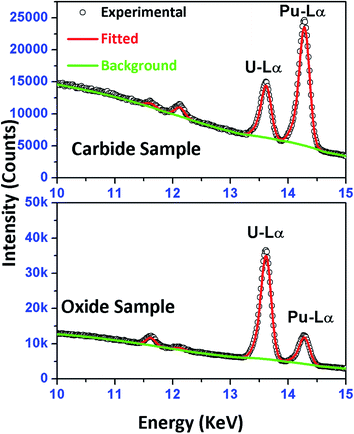
In Fig. 6, a comparison of experimentally obtained and theoretically fitted μ-XRF spectra of one carbide sample and one oxide sample is shown. It can be seen from the figure that very prominent peaks of U-Lα and Pu-Lα are observed with very high counts in both the samples. The relative percentage of U and Pu present in these samples was determined from the calibration equation obtained using the synthetic standard solutions (Fig. 4), and is tabulated in Table 5. The analytical results obtained using the biamperometric end point method are also shown in the same table. The average precision obtained was 0.16% (n = 3, σ = 1) and 0.23% (n = 3, σ = 1), respectively for U and Pu in the samples. Very good agreement was observed between the biamperometric and μ-XRF results with a deviation of 0.38% and 0.59%, respectively for U and Pu. As can be seen from Table 5, in spite of inhomogeneous distribution of the analytes in the sample specimens, the analytical results obtained in case of oxide samples were very good. The comparison of the analytical results obtained using two independent methods is shown as a bar diagram in Fig. S2 (ESI†). It can be clearly seen from both Table 5 and Fig. S2† that there is an excellent agreement between bioamperometric technique and the developed XRF-based micro-analytical technique.
| Sample code | Amount determined by the biamperometry method (%) | μ-XRF determined relative amount (%) | Deviation from biamperometry (%) | RSD (%) in biamperometric determination | RSD (%) in μ-XRF determination | |||||
|---|---|---|---|---|---|---|---|---|---|---|
| U | Pu | U | Pu | U | Pu | U | Pu | U | Pu | |
| a ±: 1σ was calculated using n = 3. | ||||||||||
| Carbide-1 | 29.94 ± 0.06 | 70.05 ± 0.07 | 29.74 ± 0.06 | 70.26 ± 0.06 | −0.67 | 0.30 | 0.20 | 0.10 | 0.20 | 0.09 |
| Carbide-2 | 30.12 ± 0.01 | 69.87 ± 0.01 | 30.24 ± 0.07 | 69.76 ± 0.07 | 0.40 | −0.16 | 0.03 | 0.01 | 0.23 | 0.10 |
| Oxide-1 | 78.94 ± 0.1 | 21.06 ± 0.1 | 79.22 ± 0.08 | 20.78 ± 0.08 | 0.35 | −1.33 | 0.13 | 0.47 | 0.10 | 0.38 |
| Oxide-2 | 78.81 ± 0.1 | 21.19 ± 0.1 | 78.73 ± 0.07 | 21.07 ± 0.07 | −0.10 | −0.57 | 0.13 | 0.47 | 0.09 | 0.33 |
| Average | 0.38 | 0.59 | 0.12 | 0.27 | 0.16 | 0.23 | ||||
Conclusions
The present paper describes the immense potential of the μ-XRF based technique developed for the analysis of U–Pu based carbide and oxide fuels used in FBRs with minimum radioanalytical waste generation. As the μ-XRF technique can simultaneously determine U and Pu percentages with respect to each other, the error associated with weighing of the sample before dissolution can be completely avoided. Only a few micrograms of sample are required for the dissolution. Moreover, this methodology requires only 2 μL of the sample solution containing ∼200 ng of sample (total radioactivity is less than 460 Bq) for analysis, so the radioactive waste generation shall be minimum. At the same time the developed micro-analytical methodology does not require any cumbersome recovery process. Further, use of micron size X-ray scanning during analysis takes care of in-homogeneities in the sample specimens and leads to high precision (0.2%; 1σ) and accuracy (0.48%) for FBTR Mark-I carbide and PFBR oxide fuels, which is comparable to those of electro-chemical methods. Finally, the above studies clearly show that this micro-analytical methodology can evolve as a potential alternative to biamperometric methods for the routine analysis of U and Pu percentages in FBR fuels with an added advantage of negligible radioanalytical waste generation.Conflicts of interest
There are no conflict to declare.Acknowledgements
The authors are thankful to Dr P. K. Pujari, Director, Radiochemistry and Isotope Group and Dr S. Kannan, Head, Fuel Chemistry Division, for their support in this work. The authors would also like to thank Dr Rajesh V. Pai, Head Fuel Development Chemistry Section, Fuel Chemistry Division for his keen interest and encouragement for this work. We are also thankful to Mr Rahul Agarwal, Actinide Electrochemistry Section, and the members of Actinide Processing Section, Fuel Chemistry Division, for providing the carbide samples for analysis.References
- R. Kale, Prog. Nucl. Energy, 2020, 122, 103265 CrossRef CAS.
- P. Rodriguez and C. Sundaram, J. Nucl. Mater., 1981, 100, 227–249 CrossRef CAS.
- C. Ganguly, P. V. Hegde, G. C. Jain, U. Basak, R. S. Mehrotra, S. Majumdar and P. R. Roy, Nucl. Technol., 1986, 72, 59–69 CrossRef CAS.
- H. Kamath, Energy Procedia, 2011, 7, 110–119 CrossRef.
- C.-G. Lee, D. Suzuki, Y. Saito-Kokubu, F. Esaka, M. Magara and T. Kimura, Int. J. Mass Spectrom., 2012, 314, 57–62 CrossRef CAS.
- R. Gupta, K. Jayachandran and S. K. Aggarwal, RSC Adv., 2013, 3, 13491–13496 RSC.
- S. Dhara, S. S. Kumar, K. Jayachandran, J. Kamat, A. Kumar, J. Radhakrishna and N. Misra, Spectrochim. Acta, Part B, 2017, 131, 124–129 CrossRef CAS.
- C. Agarwal, P. Kalsi, A. Mhatre and A. Goswami, Appl. Radiat. Isot., 2007, 65, 1386–1388 CrossRef CAS.
- M. R. Montero, A. M. n. Sánchez and A. C. Lourtau, Nucl. Instrum. Methods Phys. Res., Sect. B, 2004, 213, 429–433 CrossRef.
- R. Agarwal, M. K. Sharma, K. Jayachandran, J. S. Gamare, D. M. Noronha and K. V. Lohithakshan, Anal. Chem., 2018, 90, 10187–10195 CrossRef CAS.
- J. Drummond and R. Grant, Talanta, 1966, 13, 477–488 CrossRef CAS.
- P. Nair, M. Xavier and S. Aggarwal, Radiochim. Acta, 2009, 7, 419–422 Search PubMed.
- M. Suba, A. Nageswara Rao, P. Velavendan, N. K. Pandey, U. Kamachi Mudali and R. V. Subba Rao, J. Radioanal. Nucl. Chem., 2015, 303, 631–636 CrossRef CAS.
- K. Raj, K. Prasad and N. Bansal, Nucl. Eng. Des., 2006, 236, 914–930 CrossRef CAS.
- E. P. Bertin, Principles and practice of X-ray spectrometric analysis, Springer Science & Business Media, 2012 Search PubMed.
- B. Kanrar, K. Sanyal, N. Misra and S. Aggarwal, Spectrochim. Acta, Part B, 2014, 101, 130–133 CrossRef CAS.
- C. Horntrich, S. Smolek, A. Maderitsch, R. Simon, P. Kregsamer and C. Streli, Anal. Bioanal. Chem., 2011, 400, 2649–2654 CrossRef CAS.
- B. Kanrar, K. Sanyal and S. Dhara, Spectrochim. Acta, Part B, 2021, 177, 106063 CrossRef CAS.
- K. Sanyal, B. Kanrar and S. Dhara, J. Anal. At. Spectrom., 2021, 36, 803–812 RSC.
- K. Chander, B. N. Patil, J. V. Kamat, N. B. Khedekar, R. B. Manolkar and S. G. Marathe, Direct dissolution of nuclear materials for chemical quality control, Nucl. Technol., 1987, 78, 69–74 CrossRef CAS.
- S. Dhara, K. Sanyal, S. Paul and N. L. Misra, J. Anal. At. Spectrom., 2019, 34, 366–374 RSC.
- B. Vekemans, K. Janssens, L. Vincze, F. Adams and P. Van Espen, X-Ray Spectrom., 1994, 23, 278–285 CrossRef CAS.
- K. Suresh Kumar, P. Magesvaran, D. Sreejeya, T. Kumar, B. Shreekumar and P. Dey, J. Radioanal. Nucl. Chem., 2010, 284, 457–460 CrossRef CAS.
Footnote |
| † Electronic supplementary information (ESI) available. See DOI: 10.1039/d1ja00306b |
| This journal is © The Royal Society of Chemistry 2022 |

