 Open Access Article
Chemicals from lignin by diol-stabilized acidolysis: reaction pathways and kinetics†
Zhenlei
Zhang
 a,
Ciaran W.
Lahive
 *a,
Jozef G. M.
Winkelman
 a,
Katalin
Barta
 bc and
Peter J.
Deuss
 *a
*a
aDepartment of Chemical Engineering (ENTEG), University of Groningen, Nijenborgh 4, 9747 AG Groningen, The Netherlands. E-mail: c.w.lahive@rug.nl; p.j.deuss@rug.nl
bStratingh Institute for Chemistry, University of Groningen, Nijenborgh 4, 9747 AG Groningen, The Netherlands
cDepartment of Chemistry, Organic and Bioorganic Chemistry, University of Graz, Heinrichstrasse 28/II, 8010 Graz, Austria
First published on 26th March 2022
Abstract
The product selectivity, production rates and the required process conditions are important for technology development. Selective lignin depolymerisation on the prime β-O-4 motif provides an opportunity to obtain valuable functionalized phenolic monomers. Diol-stabilized acidolysis of lignin with sulfuric acid, triflic acid or triflate salts is a proven β-O-4 cleavage methodology that forms acetals by trapping of released reactive aldehydes. For future scale-up, a better understanding of the prime reaction pathways and how these can be controlled upon changing reaction parameters is required. By using β-O-4 model compounds and ytterbium(III) triflate as catalyst, starting material conversion and product formation including two key intermediates, the diol adducts (in this study, ethylene glycol as the diol) and the vinyl ethers, were accurately monitored, allowing for detailed kinetic modelling. Over the selected temperature range (80–150 °C), higher temperatures led to higher overall carbon balance and selectivity for the main desired acetal product. The kinetic modelling allowed for establishing a detailed reaction network with activation energies and rate constants. These collectively led to new insights into the key steps involved in the diol-stabilized β-O-4 motif acidolysis and how the reaction selectivity can be manipulated by controlling the reaction temperature, and the ethylene glycol and water content. The elucidation on reaction kinetics and networks constitutes a further step in the design of a diol-stabilized lignin acidolysis process.
Introduction
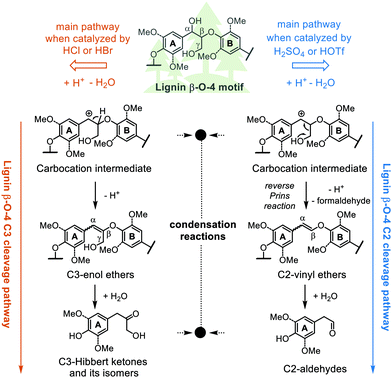
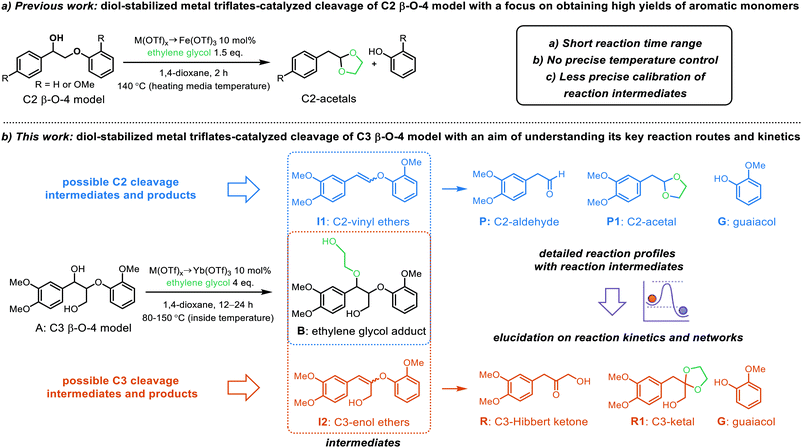
Lignin is globally the most abundant aromatic biopolymer serving as one of the major components of lignocellulosic biomass.1 Its efficient conversion to valuable aromatic chemicals is key to enhancing biorefineries’ profitability, which can be a sustainable option or supplementary for the depleting fossil-based refinery.2,3 Although low carbon-footprint chemical production from lignin has been considered promising,4,5 there are many challenges in lignin valorisation especially its tendency to break down into reactive fragments and reform new, even significantly more recalcitrant C–C bonds.6,7 Recently, many elegant depolymerisation approaches, such as reductive, oxidative, acid/base catalyzed and thermal depolymerisation methods have been developed to achieve the efficient conversion of lignin to specific aromatic chemicals, and most of these methods target the most abundant β-O-4 linking motif.7–12 Acidolysis or acid-catalyzed degradation of the lignin β-O-4 linking motif has been historically applied for the elucidation of lignin structure.13–16 Two distinct cleavage pathways, differentiated by the loss, or not, of the γ-carbinol group have been identified, namely the C3 and the C2 cleavage pathways with the choice of types of acid appearing to determine the dominant route (Scheme 1).17 Reactions on dimeric β-O-4 linking motif model compounds have shown that hydrobromic acid (HBr) and hydrochloric acid (HCl) appear to favor the C3 cleavage pathway resulting in a mixture of C3-ketones known as Hibbert ketones.18–22 In contrast, sulfuric acid (H2SO4) and triflic acid (HOTf) favor the C2 cleavage pathway leading to formaldehyde and C2-aldehydes.23,24 Both pathways are believed to be initiated via a carbocation intermediate that is also claimed to be involved in C–C bond-forming condensation reactions. These and other secondary condensation reactions such as acid-catalyzed aldol condensation and nucleophilic aromatic substitution reactions involving aldehydes and ketones, ultimately lead to low monomer yields and the formation of highly condensed C–C bonded products.In recent years, several related strategies have been developed based on the concept of in situ trapping or defunctionalization of reactive intermediates to prevent their repolymerization and consequently increase the yield of monomers.25–28 Acidolysis of the β-O-4 in lignin with HOTf, combined with in situ capture of reactive aldehydes by ethylene glycol (EG), has proved to be a very successful methodology to generate the corresponding aromatic C2-acetals.25 For example, acetals yields of 35.5 wt% upon the depolymerisation of organosolv lignin were reported.29 The formed acetals can be either deprotected to the relevant aldehydes30 or serve as new type of platform chemicals (e.g., introducing functionalized diols to form modified acetals to make polymers31,32). In addition, an adapted acidolysis methodology with EG has been applied for lignin-first fractionation, which achieved up to 9 wt% acetals with a degree of delignification of 77% on a pinewood. Recent studies in our laboratory on simple dimeric C2 β-O-4 models that lack the γ-carbinol group showed that the highly corrosive and hazardous HOTf could be replaced by a broad range of metal triflates (M(OTf)x).33 Metal triflates have also been applied as hydrolysis catalysts to cleave lignin β-O-4 linking motif.34,35 Likely, the triflate counter ion can play a similar role in the reaction as HSO4−, which was recently revealed to facilitate proton transfer steps necessary for the acidolysis reaction.36 Notably, a screening of different metal triflates found Fe(OTf)3 to be as effective as HOTf for the diol-stabilized acidolysis reaction (Scheme 2a). Approximately 20 wt% of C2-acetal was achieved on walnut methanosolv lignin by using Fe(OTf)3.33 Equal amounts of C2-acetal and guaiacol were obtained with C2 β-O-4 models, while lower C2-acetal yield than that of guaiacol was observed with the application of this method on a C3 β-O-4 model, which was possibly due to the competing C3 pathway products and condensation reactions. These lead to yield losses when applied to lignin which contains such C3 β-O-4 motifs.33,37 Many questions remain unanswered with respect to this diol-stabilized metal triflates catalyzed lignin acidolysis approach. For example, (1) the key reaction steps/pathways and their relative reaction rates; (2) the reactivity of the key reaction intermediates under acidolysis conditions, or which specific reaction intermediates/steps lead to side reactions; (3) and how the reaction conditions influence the reaction pathways, rates and overall yields. For the progress toward new production routes of bio-based chemicals from lignin, a deeper understanding of the underlying mechanisms is thus needed.
Our ongoing work on the development and scale-up of reactors for the production of bio-based chemicals depends on the availability of detailed kinetic information. Ultimately, the information of this study will help facilitate process design and evaluation of alternative processes for the production of bio-based chemicals from lignin. Understanding the reaction mechanism provided by monitoring the kinetics of the formation and consumption of the key reaction intermediates can elevate our understanding of the metal triflate-catalyzed acidolysis reaction. However, monitoring acidolysis reaction can be extremely difficult because reactions are typically extremely fast, thus making it highly challenging to obtain suitably detailed reaction profiles.33 In this contribution, through careful selection of metal triflate catalysts, the aim is to identify key reaction steps and to quantify the formation and consumption of intermediates that lead to the final cleavage products from representative C3-β-O-4 model compounds. The generated detailed reaction profiles allow us to perform kinetic modeling and determine kinetic parameters such as rate constants and activation energies for key reaction steps (Scheme 2b). These enabled us to reveal key intermediates that may lead to secondary reactions causing the loss of carbon balance. In addition, the effect of the addition of ethylene glycol and water on the diol-stabilized acidolysis was studied. Overall, through systematic kinetic analysis, these findings have greatly enhanced understanding of the major reaction networks and key intermediates leading to side reactions, as well as how reaction conditions can steer reaction outcomes.
Results and discussion
C3 β-O-4 model acidolysis with different metal triflates
Our previous investigation of diol-stabilized acidolysis reactions catalyzed by various metal triflates showed different catalytic activities for the C2 β-O-4 model.33 In order to gain further insights into the reaction, we performed a similar evaluation of metal triflate-catalyzed ethylene glycol (EG)-stabilized acidolysis using a more complex and lignin-representative phenolic C3 β-O-4 model compound (HO-A) (Fig. 1). We have recently demonstrated the benefits of using dimethyl carbonate as a greener alternative to 1,4-dioxane,38 and therefore was also used here as a solvent. Ag(I), Sn(III), Al(III), Bi(III), In(III) and Sc(III) triflates all gave complete conversion and good yields of both guaiacol (G) (mid 80% yields) and phenolic C2-acetal (HO-P1) (low 70% yields) after a reaction time of 30 min. AgOTf achieved the highest combined selectivity toward G (92%) and HO-P1 (75%). Fe(OTf)3 and Cu(OTf)2 could also achieve more than 80% yield of G and complete conversion while the selectivity toward HO-P1 was decreased dramatically. These lower yields of HO-P1 than G can be explained by the higher reactivity of these metal triflates, so that C2-acetals are formed quickly and are affected to a greater extent by secondary condensation reactions (Table S1†). Interestingly, more than 70% conversion of HO-A was observed within 30 min for Yb(III), Sm(III) and Zn(II) triflates that have lower hydrolysis constants (pKh).33 Only at reaction times of over 1 h the formation of cleavage products HO-P1 were detected (Table S1†, Entry 13) suggesting that at moderate reaction times intermediates must be present in significant amounts. After 30 min, reaction intermediates, such as a mixture of the phenolic cis/trans vinyl ethers (HO-I1) could be clearly identified for these triflate salts-catalyzed acidolysis reactions (Fig. S1†). These intermediate products from the reverse Prins reaction with the loss of formaldehyde were previously identified as (minor) reaction intermediates in acidolysis with various mineral acids under different conditions.16,20,21,23,24,39,40 Furthermore, the ethylene glycol adduct (HO-B) was identified, which has been observed previously in reactions with mineral acids in the presence of ethylene glycol.38,41 This adduct is formed upon dehydration which has been shown for a range of alcohols.42,43 Monitoring the reaction of HO-A with Yb(OTf)3 over a longer reaction time of 24 h did allow the formation of a higher amount of G (65%) and HO-P1 (40%), at which the reaction was still ongoing (Fig. S2†). This suggests that Yb(OTf)3 as well as Sm(OTf)3 and Zn(OTf)2 catalyze the reaction via the same pathway, albeit at a slower rate compared with other triflate salts (e.g., Fe(OTf)3, which catalyze the acidolysis fast and was used in our previous investigation33). Taking Yb(OTf)3 as an example, similar results were found when the non-phenolic model of the β-O-4 A, a model for an “internal” β-O-4 linkage, which accounts for the majority of the β-O-4 linkages in the lignin biopolymer,44 was investigated as substrate for acidolysis in both dimethyl carbonate and 1,4-dioxane (Fig. S3†). Yb(OTf)3 is of particular interest as it has also been reported to promote ether linkage cleavage in lignin in combination with other stabilization strategies.34,45 Therefore, in the following experiments, Yb(OTf)3 was used as the acidolysis catalyst, as it gives a suitable reaction rate to allow tracking of intermediates. It is also worth noting that the metal triflates diol-stabilized acidolysis also works for other diols such as 1,3-propanediol and 1,2-propanediol. Both the relevant diol adducts intermediates and C2-acetal are identified and monitored by UPLC-MS (Fig. S6–S8†). The differences between the phenolic and non-phenolic β-O-4 linkage during acidolysis mainly lie in the conversion rate (the conversion rate of phenolic β-O-4 is 2–11 times faster than the non-phenolic counterpart depending on the acids applied), which has been studied in detail by Yokoyama et al.,46 and Beckham et al.39 DFT calculations suggested that the rate increase is due to the stabilization of the carbocation intermediate by delocalization of benzylic carbocation in the phenolic β-O-4.39 In this study, the non-phenolic β-O-4 model compound was used for further investigations due to its dominant existence in lignin. In both solvents (i.e., 1,4-dioxane and dimethyl carbonate) the reaction catalyzed by Yb(OTf)3 follows the analogous acid-catalyzed C2 β-O-4 cleavage pathway. Monitoring these reaction profiles showed that the yield of ethylene glycol adducts (B) rose to approximately 45–50% under the applied conditions coinciding with the rapid consumption of starting material A, with it being fully consumed at just over 100 min. Simultaneously, a mixture of cis/trans vinyl ethers (I1, considered here as a mixture) were observed to be formed and reached a maximum yield of approximately 50% at 6 h, after which they were slowly consumed. The formation rate of guaiacol (G) was relatively higher than that of C2-acetal (P1), and a yield gap between the two was as previously also observed for H2SO4 catalyzed acidolysis reaction.38 Earlier acidolysis work without ethylene glycol using HCl/HBr in 9![[thin space (1/6-em)]](https://www.rsc.org/images/entities/char_2009.gif) :
:![[thin space (1/6-em)]](https://www.rsc.org/images/entities/char_2009.gif) 1 1,4-dioxane and water as solvent24 or H2SO4 in water39 showed that the C3 cleavage pathway is likely involved in causing this yield gap. Targeted analysis of potential intermediates (C3-enol ethers I2) and products (C3-Hibbert ketone R, C3-ketal R1) was performed with these compounds being specifically synthesized (Scheme 2b and ESI, S2.0 for synthesis details†). However, to our surprise, the products R and R1 were not detected, while I2 was found only in a minor amount (<1 mol%). It is well known that C3-Hibbert ketone products have a tendency to undergo disproportionation reactions, which could explain the elusive nature of formation of specific products in high yields.14,47–50 Further analysis revealed the formation of veratraldehyde (up to 5 mol%). Other cleavage products like the one with a 1,4-dioxene structure, recently reported by Westwood et al. are potentially formed.50 It is expected that all the minor amounts of all these products combined with some secondary reactions involving P1,51 contribute to the yield gap between G and P1. The remainder of carbon balance loss involves condensation/repolymerization reactions that do not release guaiacol, such as intramolecular repolymerization products reported by Beckham et al.,39 however, unfortunately, no specific products could be identified in this case as these are not expected to be present in large quantities. GPC analysis showed that besides the low molecular weight cleavage products, high molecular weight fractions were formed, (Fig. S5†). Further insight into the nature of carbon balance loss (either by unidentified cleavage or condensation reactions) is important because it could be extended to acidolysis with other triflates, including triflic acid as well as sulfonate anion containing catalysts (e.g., H2SO4).
1 1,4-dioxane and water as solvent24 or H2SO4 in water39 showed that the C3 cleavage pathway is likely involved in causing this yield gap. Targeted analysis of potential intermediates (C3-enol ethers I2) and products (C3-Hibbert ketone R, C3-ketal R1) was performed with these compounds being specifically synthesized (Scheme 2b and ESI, S2.0 for synthesis details†). However, to our surprise, the products R and R1 were not detected, while I2 was found only in a minor amount (<1 mol%). It is well known that C3-Hibbert ketone products have a tendency to undergo disproportionation reactions, which could explain the elusive nature of formation of specific products in high yields.14,47–50 Further analysis revealed the formation of veratraldehyde (up to 5 mol%). Other cleavage products like the one with a 1,4-dioxene structure, recently reported by Westwood et al. are potentially formed.50 It is expected that all the minor amounts of all these products combined with some secondary reactions involving P1,51 contribute to the yield gap between G and P1. The remainder of carbon balance loss involves condensation/repolymerization reactions that do not release guaiacol, such as intramolecular repolymerization products reported by Beckham et al.,39 however, unfortunately, no specific products could be identified in this case as these are not expected to be present in large quantities. GPC analysis showed that besides the low molecular weight cleavage products, high molecular weight fractions were formed, (Fig. S5†). Further insight into the nature of carbon balance loss (either by unidentified cleavage or condensation reactions) is important because it could be extended to acidolysis with other triflates, including triflic acid as well as sulfonate anion containing catalysts (e.g., H2SO4).
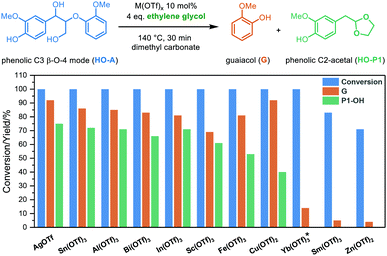 | ||
| Fig. 1 Cleavage of the phenolic C3 β-O-4 model compound (HO-A) using metal triflates as catalysts in dimethyl carbonate (reaction conditions shown in the scheme). *monitoring the reaction with Yb(OTf)3 over a longer reaction time shows the eventual formation of G and HO-P1 in a similar ratio as other triflate salts, see ESI, Fig. S2.† | ||
The temperature-dependence of the diol-stabilized Yb(OTf)3-catalyzed lignin β-O-4 acidolysis
We aimed to identify secondary reaction pathways by detailed kinetic investigations of starting materials, products and key intermediates. Solvent types and compositions (water content) have a clear effect on the carbocation formation rate during acidolysis of lignin,52 dry 1,4-dioxane (around 400 ppm H2O) was used here also to avoid potential side reactions previously identified from reactions carried out in dimethyl carbonate.36,38 Although acidolysis has been performed at different temperatures,8,24,38,53,54 there is still no systematic investigation on temperature-dependence of lignin acidolysis with ethylene glycol as trapping reagent to show the effect on the formation of reaction intermediates. Thus, using lignin model compound A, acidolysis reactions under a wide temperature range from 80 to 150 °C with 10 °C intervals were monitored (Fig. 2, Fig. S9 and S10†). In these reactions, the temperature was very carefully controlled by measuring internal reaction temperatures. This was shown to be essential to obtain suitable profiles for kinetic modelling as small fluctuations led to clear changes in the reaction profiles, which can still be seen at different stages of the reaction for some of the reaction profiles. Fig. 2 shows representative detailed reaction profiles for acidolysis at 80, 100, 120 and 140 °C, in which the conversion, intermediates and products yields were monitored over time. At 80 °C (Fig. 2a and Fig. S9a†), the α-OH group in the β-O-4 model compound A was slowly substituted by ethylene glycol generating B (26% after 10 h), with nearly no further reaction and a carbon balance close to 100% over 24 h. The ethylene glycol substitution reaction to form B, as well as the formation of I1, was observed within 24 h by increasing the temperature to 90 or 100 °C. At 100 °C, the formation rate of B was higher than at 90 °C, peaking at 180 min with 65% yield, which was then converted within 10 h (71% of the peak yield of B was at 480 min at 90 °C) to I1 (maximum yield = 30%). I1 was finally cleaved, leading to the formation of G and P1. Further increasing the reaction temperature from 110 to 150 °C led to higher I1 peak yields (up to 71% at 150 °C) reached at shorter times, as well as higher G and P1 yields (98% and 85%, respectively, at 150 °C). Independent reaction profiles were plotted for each intermediate at different reaction temperatures, clearly showing increased conversion rate at higher temperatures (Fig. S11a†). The peak yield of B is higher at lower temperatures (Fig. S11b†), while the peak yield of I1 is higher at high temperatures (Fig. S11c†). Both P1 and G showed accelerated formation rates and more importantly, increased final yields at higher temperatures (Fig. S9 and S10†). Interestingly, the selectivity to P1 was dramatically improved by running the diol-stabilized acidolysis reaction at a higher temperature range (130 to 150 °C), where the yield gap was near constant at 14% (Fig. 3). In contrast, the yield gap between G and P1 reached as high as 44% at lower temperatures ranging from 90 to 120 °C. As this indicates a similar trend to the carbon balance loss it is suspected that the main C3 pathway side reactions as well as intramolecular condensations, are relatively more active at lower temperatures, which was unexpected as lignin condensation reactions are typically associated with higher temperatures, for example during extractions in the presence of sulfuric acid.55,56 Here, it is important to distinguish between those side reactions: i.e., those involving the condensation of starting material through carbocation without generating cleavage products and those following the C3 cleavage pathway and thus releasing G. To further investigate these aspects, we turned to kinetic modelling.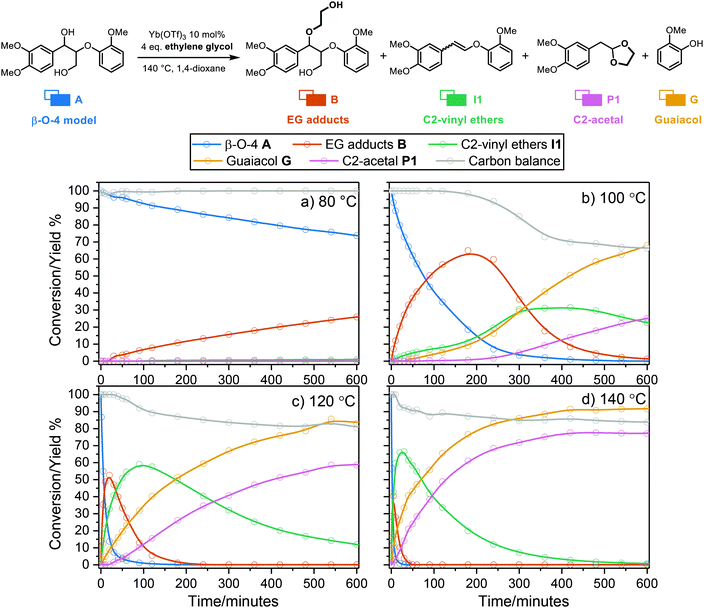 | ||
| Fig. 2 Graphs of time course of the reaction of β-O-4 model compound A with 10 mol% Yb(OTf)3, 4 eq. ethylene glycol, in 1,4-dioxane at 80, 100, 120, 140 °C. Conversions and yields were obtained via HPLC analysis using 1,2,4,5-tetramethylbenzene as an internal standard. Symbols: measured; lines: for illustrative purposes. The carbon balance calculation is based on the identified products, as further detailed in section 3.1, ESI.† | ||
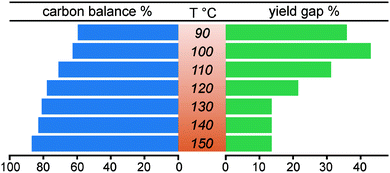 | ||
| Fig. 3 The carbon balance and yield gap between guaiacol G and C2-acetal P1 after 24 h when the reaction is complete or near-complete under different temperatures. The carbon balance calculation is based on the identified products, as further detailed in section 3.1, ESI.† | ||
Kinetic modelling of the lignin acidolysis reaction profiles under different temperatures
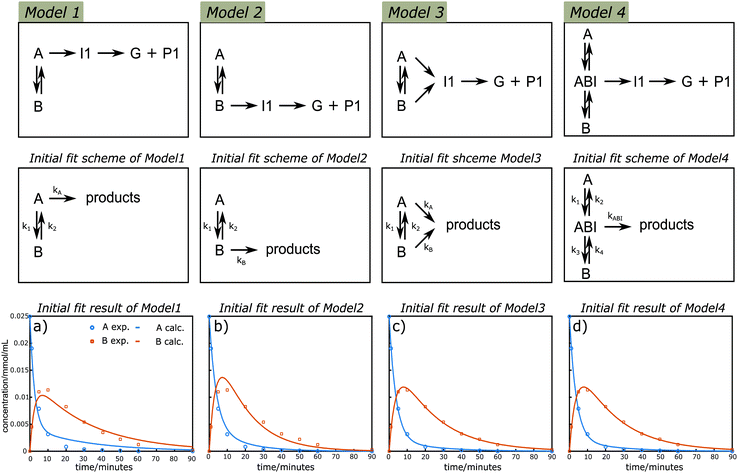
Kinetic modelling is a powerful tool for the quantitative description of reactions in time and the understanding of reaction mechanisms. Initially, the possible primary lignin acidolysis pathways and suspected side reactions are summarized (illustrated in Scheme 3). In addition to the diol-stabilized acidolysis C2 or C3 acidolysis pathway, postulated intra and intermolecular condensation reactions to the phenyl dihydrobenzofuran (C1) or C2via electrophilic aromatic substitution under acidolysis conditions are illustrated in Scheme 3. In principle, there are two possible starting materials for the formation of I1via the reverse-Prins reaction, either A or B, which should be in equilibrium with each other via displacement of water with ethylene glycol and vice versa (Scheme 3). To get more insights into their relative contributions, four variations of a simplified reaction network focusing on the consumption of A and the formation/consumption of B were considered for further kinetic evaluation based on the pathways diagram of the lignin acidolysis reaction (Fig. 4). It is worth to mention that both water and ethylene glycol concentrations are important. However their quantities were not monitored and there are many possible formation and consumption pathways, their effects are discussed separately (vide infra). Model 1 depicts a reversible reaction between A and B, where only A can lead to the formation of I1, which subsequently decomposes to G and P1. In Model 2, I1 is exclusively formed from B, while both A and B are allowed to transform to I1 in Model 3. Pseudo-first-order reaction orders were used, which has been reported to give good fits for the acidolysis reactions catalyzed by HCl, HBr or H2SO4.19,23,24 The very good fit, especially of Model 3 to the measured data, confirms that the reaction network can now be described well with a first-order dependency of the reactants. Both Model 1 and Model 2 showed poor fits with initial simultaneously data fitting of CA and CB using the time course profile at 130 °C (Fig. 4a and b). There was too much A reacting to B for the initial fitting of Model 1, while too little A reacted to B for the initial fitting of Model 2. This result clearly demonstrated that likely reactions from both A and B contributed to the I1 formation, which was confirmed by initial evaluation of the fit of the Model 3 giving an excellent fit for both CA and CB (t < 90 min in which all A and B were consumed, Fig. 4c). Simplified Model 3 was applied to the expanded data sets at temperatures ranging from 80–150 °C. As is shown in Fig. S12,† good initial fits were observed under these considered reaction temperatures. The carbocation intermediate (ABI) has been hypothesized as the key intermediate that may cause condensation reactions. Therefore, the existence of this benzyl carbocation is introduced and examined in Model 4. In this model, the reversible reaction between A and B goes through the benzyl carbocation ABI as a transition state, while ABI is also the intermediate for further reactions. Comparably satisfying fits were also observed for CA and CB, therefore, no clear distinction between Models 3 and 4 can be made based on the data for A and B (Fig. 4d). Earlier mechanistic investigations showed that ABI is likely involved in the interexchange between A and B as well as routes to products, but the obtained kinetic data does not allow to quantitatively differentiate its involvement in this data set.39,57 Nevertheless, the fact that the kinetic data show that products generating from both A and B does indicate that a direct pathway from A is active, and not all products are formed necessarily viaB as an intermediate.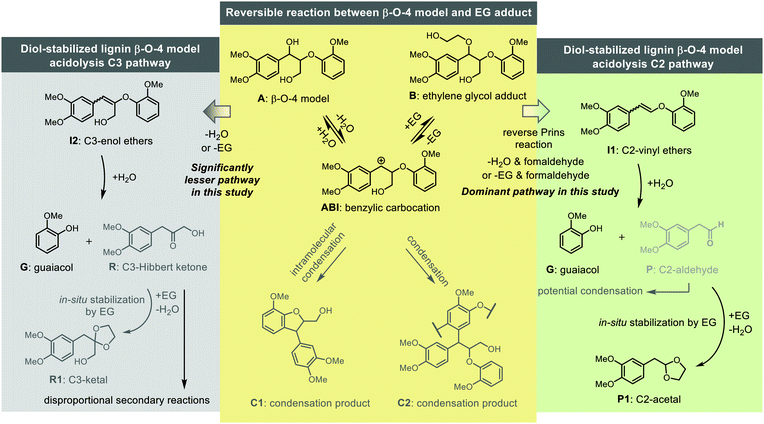 | ||
| Scheme 3 The primary acidolysis pathways and potential condensation reactions of the lignin β-O-4 linking motif. | ||
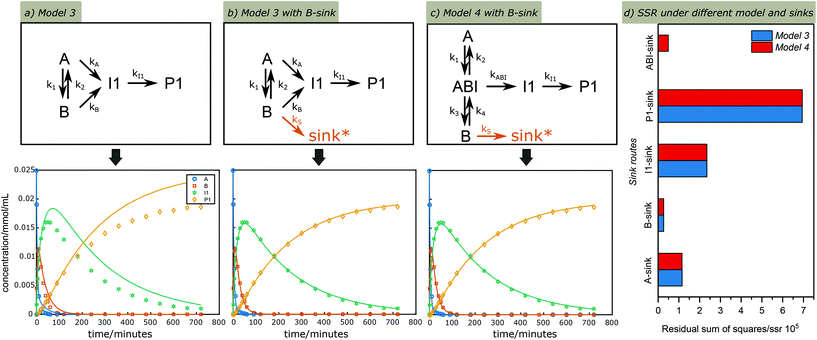
An extended version of Model 3 including I1 and P1 was used for further detailed kinetic studies. G was left out at this stage as it can also form via the C3 or other analogous cleavage pathways. Taking the time course profile at 130 °C as an example, a poor fit was obtained, showing much less I1 and P1 than suggested by model (Fig. 5a); this is because the model does not take side reactions into account. To account for this, side reactions including both unidentified cleavage and condensation reactions, here defined as “sinks”, were introduced to different positions in Model 3 to compensate for the incomplete selectivity toward the C2 pathway (Fig. S13†). Again utilizing the data sets from the reaction at 130 °C, the simultaneous fitting of k1, k2, kA, kB, kI1, ksink was performed to observe CA, CB, CI1 and CP1 under these different sink routes, see modelling results in Fig. S13.† The summary of the rate constants and residual sum of squares using different sinks are shown in Table S2.† Among the options considered, a sole sink route originating from B showed an excellent fit (Fig. 5b) with the smallest residual sum of squares (Fig. 5d and Table S2†). Similarly, different sink routes were introduced on a simplified Model 4 to compensate for the loss of carbon balance (Fig. S14†), and the simplified Model 4 under these different sink routes was evaluated with the time course profile at 130 °C. The comparison of kinetic modelling results of the Model 4 under different sink routes are summarized in Fig. 5d and Table S3.† As illustrated, the best model under these reaction conditions remains that with a sink originating from B confirming that reactions from B lead to most unknown products, contributing most to the carbon balance loss. However, also a sink at the carbocation AB1 gave a relatively good fit, which could also indicate its involvement in side reactions to form structures like C1 and C2 previously suggested.8,57
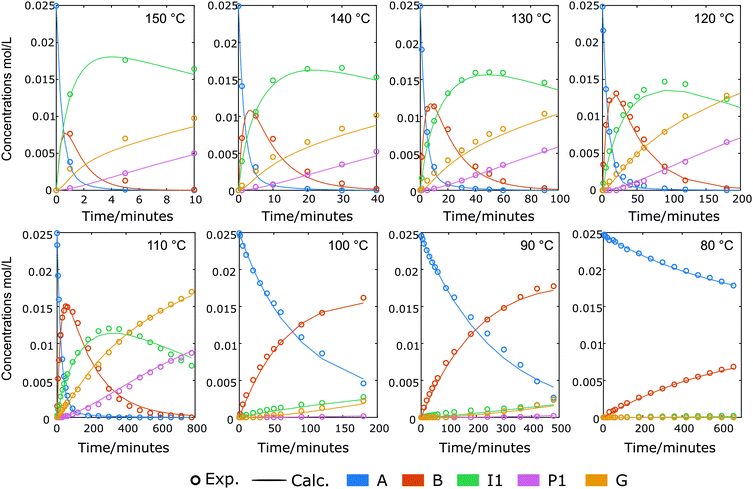
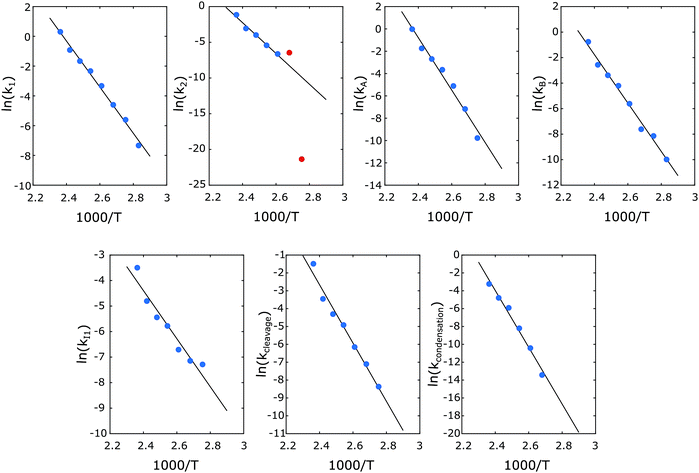
Next, the reaction network was further tuned. Including the excess G (relative to P1) formed in the reaction, two distinct sink reactions were introduced to Model 3 (Fig. 6a). One sink route is to X1 that does not release G and produce condensation products such as C1 and C2, while the other sink route is to X2, corresponding to reactions that do release G but do not lead to P1 (potentially the C3 pathway). The simultaneous data fitting of CA, CB, CI1, CP1 and CG on this reaction scheme was performed for the entire data set of different temperatures. As can be seen from Fig. 7, all data sets at various temperatures ranging from 80–150 °C showed high-quality fits using this fine-tuned reaction network. The activation energy for each step could be obtained from the Arrhenius plots (Fig. 8), and the activation energy along with rate constants at 110, 130 and 150 °C are summarized in Fig. 6b. These kinetic modelling results provide a detailed kinetic perspective on the key reaction steps involved in the diol-stabilized acidolysis reaction. For example, the cleavage of I1 to P1 and G possesses the lowest activation energy, while the I1 formation reactions represent the highest energy barrier. The reversible reaction between A and B shows the forward reaction possessing an activation energy of 129 ± 11 kJ mol−1, around 50 kJ mol−1 less than that of the reverse reaction. This is also consistent with the much higher k1 than that k2 values, e.g., 0.189 vs. 0.019 min−1 at 130 °C. Both A and B can lead to the formation of I1; however, the route from B to I1 has an activation energy only of 158 ± 17 kJ mol−1, while 195 ± 32 kJ mol−1 is necessary to activate the route from A to I1. This suggests that the formation of B can facilitate the reverse Prins reaction. Thus, although not all I1 is formed viaB, it acts as a significant intermediate in the reaction from A to I1. This is also reflected by rate constants: kA is only approximately 2 times that of kB in the same order of magnitude. In addition, the activation energy from B to G and X2 is smaller than both B to I1 and A to I1, which would indicate that the higher G yield than that of P1 is caused by the degradation of B to G and an unknown product X2. The rate constant of this cleavage side reaction (kcleavage) is higher than that of condensation reaction (kcondensation) (Fig. 6b), denoting more active participation of the side cleavage reaction of B than the condensation reaction. Comparing the experimental observations at different temperatures with the found activation energies for the different I1 formation pathways, namely either from A (195 ± 32 kJ mol−1) or from B (158 ± 17 kJ mol−1), it is understood that lower temperature favors the formation path of I1 from B due to the lower activation energy than that of A to I1. With the increase of temperature, the formation of I1 directly from A becomes much more dominant in the acidolysis reaction, of which kA/kB is slightly changed from 1.7 times to 2.1 with temperature increasing from 110 to 150 °C (Fig. 6b). This is consistent with the lower carbon balance at lower reaction temperatures, since there is more formation of B at relatively low temperatures, which can lead to side reactions. In addition, since model 4 involving the transition state ABI showed comparably good fitting results, ABI initiating side reactions may be intensively involved in the reversible reaction between A and B. This reversible reaction is also influenced by the concentrations of water and ethylene glycol.
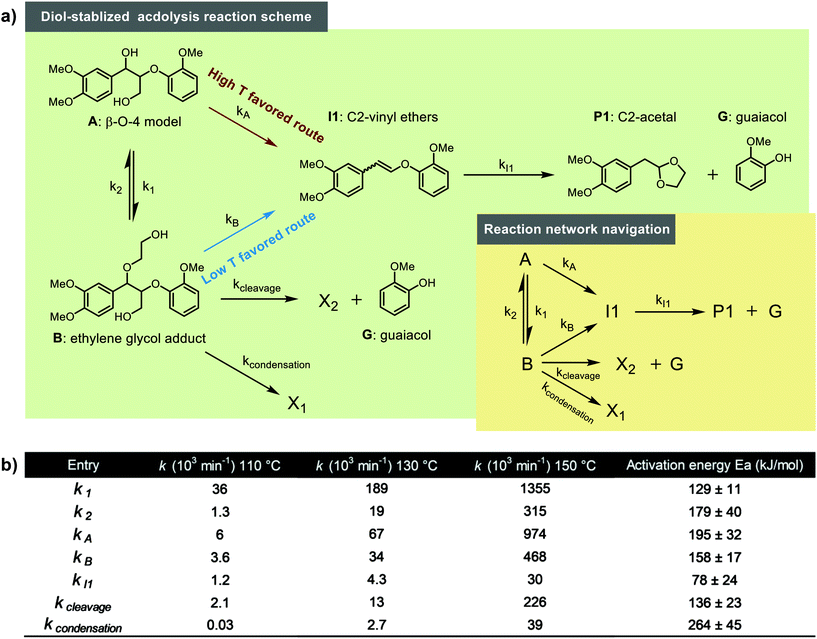 | ||
| Fig. 6 (a) Reaction networks that were used for final kinetic modeling, (b) Summary of activation energies and rate constants (110, 130 and 150 °C) within the developed model. | ||
The effect of ethylene glycol and water concentrations on the reaction pathways
When dealing with these reactions with biomass or isolated lignins the situation gets significantly more complex. For example, ethylene glycol is also consumed in reactions with carbohydrates and is therefore present at varying concentrations. Different amounts of water are present depending on the biomass and lignin species or their processing methods. Therefore, to gain more insights we were particularly interested in the effect of the presence of different amounts of ethylene glycol and water in the reaction system.Our previous study found that a balanced ethylene glycol loading is of importance to achieve higher yields of final products.38 While better selectivity is observed at higher ethylene glycol content, lower reaction rates are observed. Thus, the loading of ethylene glycol was varied from the typical 4 eq. to 2, 8 and 16 eq. to study the rate/concentration kinetic dependencies (Fig. S15†). Indeed, the main observation was that the overall reaction rates decreased and as expected, the maximum yield of B was boosted dramatically (from 32% to 96% for 2 and 16 eq. EG, respectively), combined with an overall better carbon balance (e.g., 89% for 2 eq. EG and >99% for 16 eq. EG when full conversion of A was reached). To investigate the origin of the increase of product selectivity, a simultaneous fit of k1, k2, kA, kB, kI1 and kS was applied to observe CA, CB, CI1 and CP1 under the Model 3 with different sink routes, namely, A-sink, B-sink, I1-sink and P1-sink (Fig. S16†). Comparing these fitting results under different sink routes indicated by the sum of square residuals the best fitting model is clearly B-sink at 2 and 4 eq. of ethylene glycol, while it is not distinct under these different sink routes at 8 and 16 eq. EG (Fig. S17†). This indicates that the B-sink route becomes less dominant at higher ethylene glycol loading, while clearly more I1 is formed viaB based on comparison of kA and kB values (Table S4†). Overall, very marginal sinks from all of these possible sink routes were observed at higher ethylene glycol amount, matching the very low carbon balance loss. This shows that an increase of ethylene glycol loading can dramatically decrease the sink route from B, while the sink routes from A, P1 and I1 become relatively higher contributors under very high carbon balance of the reaction. This demonstrates the previously observed beneficial effect that ethylene glycol has on the reaction, which likely ensures that ABI can only be involved in side reactions to a limited extent by extensively trapping in the form of the adduct B, but at the cost of lowering the reaction rates.
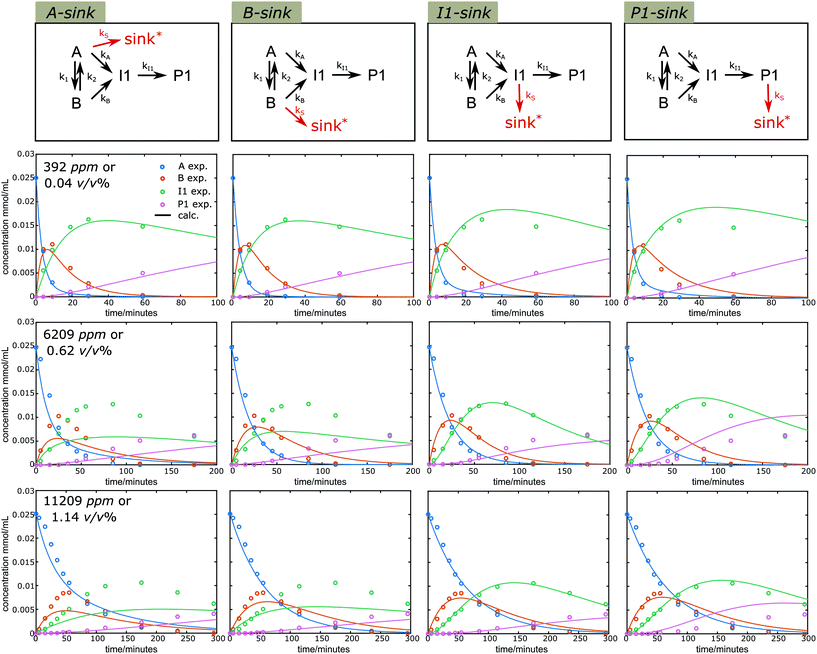
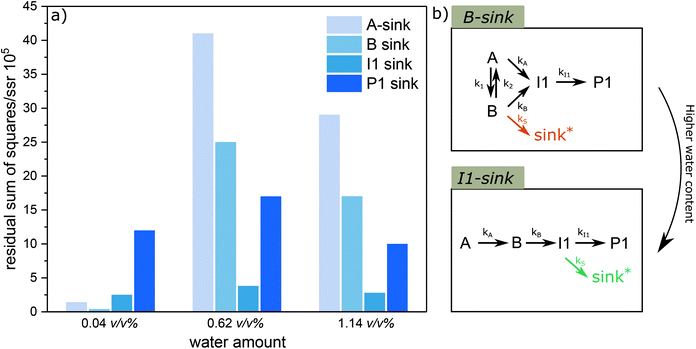
Water is a typical component involved in the lignin acidolysis in the presence of ethylene glycol, either introduced by the solvent or the biomass itself. In addition, water is unavoidably formed during the ethylene glycol substitution reaction, and is also released in the acetal formation reactions. Water, in combination with Lewis acid, can promote several types of reactions,58 while several Lewis acids are claimed to be unusable in aqueous media.59 Thus it is of particular interest to see how the water affects the diol-stabilized acidolysis reaction. Reaction profiles under different water content (392, 6209 and 11![[thin space (1/6-em)]](https://www.rsc.org/images/entities/char_2009.gif) 209 ppm, corresponding to 0.04, 0.62 and 1.12 v/v%, or 1, 14 and 25 eq.) were monitored (Fig. S18†). It is clear that the introduction of higher water content decreased the reaction rates. Also, the peak yields of both B and I1 were decreased with the increase of water loading. In addition, the P1 yield was dramatically decreased, while the yield of G was nearly unaffected under higher water content. Similarly, a simultaneous fit of k1, k2, kA, kB, kI1 and kS allowed for observing the behavior of CA, CB, CI1 and CP1 under the simplified model 3 with different sink routes (results shown in Fig. 9). The sum of square residuals was calculated for these fittings under different sink routes (Fig. 10a). With higher water content, Model 3 with I1 sink described the best fitting, suggesting I1 becomes the dominate carbon balance loss source at higher water content. Once I1 is formed, formaldehyde is already lost and thus the higher carbon loss does not originate from an increased contribution of the C3 pathway. Rather, it more likely originates from the C2-aldehyde condensation reactions. Water is involved in the cleavage reaction of I1 to P1 or C2-aldehyde and G. Therefore, higher water content likely promotes the cleavage reaction of I1 to G and C2-aldehyde, which is prone to undergo condensation. Moreover, the introduction of water can promote the release of ethylene glycol from P1 under aqueous acidic conditions leading to the same C2-aldehyde. All of these contribute to lower yields of P1 than that of G under higher water content. In addition, it is noticeable that Model 3 with I1 sink effectively reduces the reaction sequence to: A to B to I1 shown in Fig. 10b and k values are shown in Table S5†. Although the A to B equilibrium is moved toward A under higher water contents, the forward reaction from A to B is still dominant, moreover, the direct reaction from A to I1 is significantly slowed. Also, the fact that the amount of G released is nearly 100% for the reaction with high water content indicates that the sink routes via inter- or intramolecular condensation from the carbocation intermediate ABI is actually reduced, thus contributes less to the carbon loss. Overall, it suggests the presence of water is particularly detrimental for the selectivity to P1 and needs to be carefully controlled to obtain high acetal yields.
209 ppm, corresponding to 0.04, 0.62 and 1.12 v/v%, or 1, 14 and 25 eq.) were monitored (Fig. S18†). It is clear that the introduction of higher water content decreased the reaction rates. Also, the peak yields of both B and I1 were decreased with the increase of water loading. In addition, the P1 yield was dramatically decreased, while the yield of G was nearly unaffected under higher water content. Similarly, a simultaneous fit of k1, k2, kA, kB, kI1 and kS allowed for observing the behavior of CA, CB, CI1 and CP1 under the simplified model 3 with different sink routes (results shown in Fig. 9). The sum of square residuals was calculated for these fittings under different sink routes (Fig. 10a). With higher water content, Model 3 with I1 sink described the best fitting, suggesting I1 becomes the dominate carbon balance loss source at higher water content. Once I1 is formed, formaldehyde is already lost and thus the higher carbon loss does not originate from an increased contribution of the C3 pathway. Rather, it more likely originates from the C2-aldehyde condensation reactions. Water is involved in the cleavage reaction of I1 to P1 or C2-aldehyde and G. Therefore, higher water content likely promotes the cleavage reaction of I1 to G and C2-aldehyde, which is prone to undergo condensation. Moreover, the introduction of water can promote the release of ethylene glycol from P1 under aqueous acidic conditions leading to the same C2-aldehyde. All of these contribute to lower yields of P1 than that of G under higher water content. In addition, it is noticeable that Model 3 with I1 sink effectively reduces the reaction sequence to: A to B to I1 shown in Fig. 10b and k values are shown in Table S5†. Although the A to B equilibrium is moved toward A under higher water contents, the forward reaction from A to B is still dominant, moreover, the direct reaction from A to I1 is significantly slowed. Also, the fact that the amount of G released is nearly 100% for the reaction with high water content indicates that the sink routes via inter- or intramolecular condensation from the carbocation intermediate ABI is actually reduced, thus contributes less to the carbon loss. Overall, it suggests the presence of water is particularly detrimental for the selectivity to P1 and needs to be carefully controlled to obtain high acetal yields.
Conclusions
We have demonstrated that Yb(OTf)3 can catalyze the diol-stabilized acidolysis of the lignin β-O-4 motif and was specifically suitable to study the relevant intermediates. At least 90 °C was necessary to initiate the diol-stabilized acidolysis of the β-O-4 motif. The C2 cleavage acidolysis pathway was observed to be dominant under the utilized reaction conditions (up to 150 °C with 2–16 eq. EG and up to 11![[thin space (1/6-em)]](https://www.rsc.org/images/entities/char_2009.gif) 000 ppm water). At elevated reaction temperatures, higher carbon balance and improved C2-acetal P1 yields were observed. Kinetic analysis revealed that this was due to the alternation of the main reaction pathways (A/B to I1 to P1) in relation to main contributing side reactions. The starting material A and ethylene glycol adduct B were found to be in equilibrium (via carbocation ABI), favoring B under the applied reaction conditions. Both, A and B were found to undergo a reverse Prins reaction (also viaABI) to result in the formation of C2-vinyl ethers I1, though with different activation energies: 195 ± 32 kJ mol−1 for A to I1 in contrast with 158 ± 17 kJ mol−1 for B to I1. At higher reaction temperature, more I1 was directly formed from A, while at lower reaction temperatures, more formation of I1 was revealed through B. This means that B is not an intermediate for all I1 formed. At lower temperatures, kinetic modeling suggested that the acidolysis was accompanied by more condensation or unclear cleavage reactions that were mostly linked with B but were also likely initiated from ABI. The conversion of I1 to P1 and G had a lower activation energy (78 kJ mol−1) and was shown to be relatively selective suggesting that carbon balance loss was indeed mostly linked to the species formed before the key intermediate I1. We have additionally observed that the cleavage of A and B slowed down significantly with increasing ethylene glycol content, but at the same time the carbon balance and the selectivity to P1 increased significantly. Kinetic analysis showed that in particular the side reactions originating from B were reduced remarkably, revealing possible beneficial effect of ethylene glycol in stabilizing ABI in the form of B. In general, similar effects to the reaction rate were observed with the increase of water content; however much lower yields of P1 were obtained than that of G. It is pointed out by kinetic investigation that the formation of I1 was nearly exclusively via the B-mediated pathway at increased water concentration. The main side reactions under these conditions were linked to I1, which can be explained by increase of condensation reactions related to C2-aldehyde.
000 ppm water). At elevated reaction temperatures, higher carbon balance and improved C2-acetal P1 yields were observed. Kinetic analysis revealed that this was due to the alternation of the main reaction pathways (A/B to I1 to P1) in relation to main contributing side reactions. The starting material A and ethylene glycol adduct B were found to be in equilibrium (via carbocation ABI), favoring B under the applied reaction conditions. Both, A and B were found to undergo a reverse Prins reaction (also viaABI) to result in the formation of C2-vinyl ethers I1, though with different activation energies: 195 ± 32 kJ mol−1 for A to I1 in contrast with 158 ± 17 kJ mol−1 for B to I1. At higher reaction temperature, more I1 was directly formed from A, while at lower reaction temperatures, more formation of I1 was revealed through B. This means that B is not an intermediate for all I1 formed. At lower temperatures, kinetic modeling suggested that the acidolysis was accompanied by more condensation or unclear cleavage reactions that were mostly linked with B but were also likely initiated from ABI. The conversion of I1 to P1 and G had a lower activation energy (78 kJ mol−1) and was shown to be relatively selective suggesting that carbon balance loss was indeed mostly linked to the species formed before the key intermediate I1. We have additionally observed that the cleavage of A and B slowed down significantly with increasing ethylene glycol content, but at the same time the carbon balance and the selectivity to P1 increased significantly. Kinetic analysis showed that in particular the side reactions originating from B were reduced remarkably, revealing possible beneficial effect of ethylene glycol in stabilizing ABI in the form of B. In general, similar effects to the reaction rate were observed with the increase of water content; however much lower yields of P1 were obtained than that of G. It is pointed out by kinetic investigation that the formation of I1 was nearly exclusively via the B-mediated pathway at increased water concentration. The main side reactions under these conditions were linked to I1, which can be explained by increase of condensation reactions related to C2-aldehyde.
Overall, these detailed kinetic findings on the diol-stabilized lignin β-O-4 acidolysis confirm many previous speculations on the acidolysis mechanism and involved intermediates of this novel methodology based on previous knowledge of the lignin acidolysis. The understanding is now greatly enhanced in terms of contribution of the main pathways and secondary reactions derived from the key intermediates and the influence of the reaction conditions (temperature, time, ethylene glycol and water content). This can now be further extended to variations of the β-O-4 motif, such as phenolic and syringyl type substitutions as well as other common linking motifs. These results can facilitate the rational design of the diol-stabilized lignin acidolysis reaction and reactor setups by finely tuning the reaction conditions.
Experimental
Materials and experimental procedures
Metal triflates were obtained from Sigma-Aldrich, Alfa Aesar, and Fluorochem. Other chemicals obtained from Acros, Sigma-Aldrich, Fisher Chemicals and Fluorochem were used as received. The 1,4-dioxane utilized in this work was acquired anhydrous under argon and used standard Schlenk techniques. The model compounds A, B, I1, P1, I2, R, R1 were synthesized following the published procedure (ESI, S2.0 for details†).A typical procedure for the time course reaction: compound A (2 mL of a 0.15 mmol stock solution in 1,4-dioxane) was added to a 20 mL pressure vial (purchased from Biotage, also sold as microwave vials) equipped with a magnetic stirring bar. Internal standard (1,2,4,5-tetramethylbenzene, 3 mL of a 0.3 mmol stock solution in 1,4-dioxane) was added. Ethylene glycol (0.7 mL of a 0.6 mmol stock solution in 1,4-dioxane) was added and the vial was sealed. The solution was stirred and heated to desired temperature. An initial time point sample was taken immediately prior to the catalyst addition. The catalyst, Yb(OTf)3, (e.g., 10 mol%, 0.3 mL, 0.015 mmol from a stock solution in 1,4-dioxane) was added by syringe with a thin needle through the septum of the pressure vial. Samples of 0.1 mL were taken from the vial through the septum with a thin needle at intervals over a 24–48 h period and quenched into HPLC sample vials containing 0.9 mL of a 60![[thin space (1/6-em)]](https://www.rsc.org/images/entities/char_2009.gif) :
:![[thin space (1/6-em)]](https://www.rsc.org/images/entities/char_2009.gif) 40 MeCN
40 MeCN![[thin space (1/6-em)]](https://www.rsc.org/images/entities/char_2009.gif) :
:![[thin space (1/6-em)]](https://www.rsc.org/images/entities/char_2009.gif) H2O solution basified with Et3N. The samples were then analyzed by HPLC and UPLC-MS. There was temperature difference between the set temperature of oil bath and the inside reaction temperature, because of refluxing present in this setup as well as the low boiling point of 1,4-dioxane compared to the setting temperature. Therefore, the inside temperature of the reaction mixture was measured via a parallel blank pressure vial (1,4-dioxane inside) installed with a thermometer (see details of the reaction setup in Fig. S4†). All of the temperatures in the manuscript were referred to inside temperature of the reaction mixture, unless otherwise stated.
H2O solution basified with Et3N. The samples were then analyzed by HPLC and UPLC-MS. There was temperature difference between the set temperature of oil bath and the inside reaction temperature, because of refluxing present in this setup as well as the low boiling point of 1,4-dioxane compared to the setting temperature. Therefore, the inside temperature of the reaction mixture was measured via a parallel blank pressure vial (1,4-dioxane inside) installed with a thermometer (see details of the reaction setup in Fig. S4†). All of the temperatures in the manuscript were referred to inside temperature of the reaction mixture, unless otherwise stated.
Analysis
High performance liquid chromatography (HPLC) was performed on a Shimadzu prominence system equipped with a photodiode detector (Shimadzu SPD-M20A Prominence). The column is Agilent Eclipse XDB-C18 Column (5 μm 4.6 × 150 mm). Data analysis was processed with Shimadzu Lab Solutions Version 5.51 software. 1,2,4,5-Tetramethylbenzene was used as an internal standard. All samples were run using MeCN (0.1% formic acid) (A)/H2O (0.1% formic acid) (B) gradient follow with a flow rate of 1.0 mL min−1. The method started with 5% A/95% B for 10 min followed by gradient to 95% A/5% B over 30 min followed by 10 min at 95% A/5% B followed by a gradient to 5% A/95% B over 5 min followed by 5 min at 5% A/95% B a flow rate of 1.0 mL min−1. For other analysis see ESI, S1.0 for details.†Kinetic modelling
The reaction network was modelled using kinetic models where the reaction rates were assumed first order in each of the participating components. The experimental results consist of accurately measured concentrations of the reactants and products over time.Inspection of these profiles reveals that, especially at the higher temperatures, the variation in the concentrations of species A and B mainly occurs initially, i.e., at short time values, see for example Fig. 2. These initial parts of the experimental profiles were investigated first, using the simplified models shown in Fig. 4. For example, for Model 3 in Fig. 4, the model equations for the concentration profiles of A and B read:
 | (1) |
 | (2) |
For description of the complete profiles, including also the profiles of the products I1 and P1, the simple models of Fig. 4 were extended as shown in Fig. 5. For Model 3 equations now read:
 | (3) |
 | (4) |
 | (5) |
 | (6) |
Analogous to eqn (1)–(2) and (3)–(6), model equations are also written for the other models. The reaction rate constants were optimized by least squares optimization using the experimental data. The optimization routine lsqnonlin of Matlab 2020b was used, with numerical integration of the model equations using the ode45 routine. See also ESI, S4.0.†
Conflicts of interest
The authors declare no conflicts of interest.Acknowledgements
Z. Zhang acknowledges the China Scholarship Council for funding (grant no. 201704910922). K. Barta, P. J. Deuss and C. W. Lahive acknowledge financial support from the European Commission (SuBiCat Initial Training Network, Call FP7-PEOPLE-2013-ITN, grant no. 607044). We thank the late Prof. P. C. J. Kamer (Leibniz Institute for Catalysis), for consultation and useful discussion.References
- R. Vanholme, B. Demedts, K. Morreel, J. Ralph and W. Boerjan, Plant Physiol., 2010, 153, 895–905 CrossRef CAS PubMed
.
- G. T. Beckham, C. W. Johnson, E. M. Karp, D. Salvachua and D. R. Vardon, Curr. Opin. Biotechnol, 2016, 42, 40–53 CrossRef CAS PubMed
.
- S. Gillet, M. Aguedo, L. Petitjean, A. R. C. Morais, A. M. da Costa Lopes, R. M. Lukasik and P. T. Anastas, Green Chem., 2017, 19, 4200–4233 RSC
.
- A. J. Ragauskas, G. T. Beckham, M. J. Biddy, R. Chandra, F. Chen, M. F. Davis, B. H. Davison, R. A. Dixon, P. Gilna, M. Keller, P. Langan, A. K. Naskar, J. N. Saddler, T. J. Tschaplinski, G. A. Tuskan and C. E. Wyman, Science, 2014, 344, 1246843 CrossRef PubMed
.
- Y. Liao, S. F. Koelewijn, G. Van den Bossche, J. Van Aelst, S. Van den Bosch, T. Renders, K. Navare, T. Nicolai, K. Van Aelst, M. Maesen, H. Matsushima, J. M. Thevelein, K. Van Acker, B. Lagrain, D. Verboekend and B. F. Sels, Science, 2020, 367, 1385–1390 CrossRef CAS PubMed
.
-
C. Heitner, D. Dimmel and J. Schmidt, Lignin and lignans: advances in chemistry, CRC press, 2019 Search PubMed
.
- R. Rinaldi, R. Jastrzebski, M. T. Clough, J. Ralph, M. Kennema, P. C. Bruijnincx and B. M. Weckhuysen, Angew. Chem., Int. Ed., 2016, 55, 8164–8215 CrossRef CAS PubMed
.
- W. Schutyser, T. Renders, S. Van den Bosch, S. F. Koelewijn, G. T. Beckham and B. F. Sels, Chem. Soc. Rev., 2018, 47, 852–908 RSC
.
- C. Zhang and F. Wang, Acc. Chem. Res., 2020, 53, 470–484 CrossRef CAS PubMed
.
- M. Wang and F. Wang, Adv. Mater., 2019, 31, e1901866 CrossRef PubMed
.
- Z. Sun, B. Fridrich, A. de Santi, S. Elangovan and K. Barta, Chem. Rev., 2018, 118, 614–678 CrossRef CAS PubMed
.
- X. Liu, F. P. Bouxin, J. Fan, V. L. Budarin, C. Hu and J. H. Clark, ChemSusChem, 2020, 13, 4296–4317 CrossRef CAS PubMed
.
- E. Adler, Wood Sci. Technol., 1977, 11, 169–218 CrossRef CAS
.
- K. Lundquist, Acta Chem. Scand., 1967, 21, 1750–1754 CrossRef CAS
.
- K. Lundquist, Acta Chem. Scand., 1970, 24, 889–907 CrossRef CAS
.
- K. Lundquist and L. Ericsson, Acta Chem. Scand., 1970, 24, 3681–3686 CrossRef CAS
.
- O. Karlsson, K. Lundquist, S. Meuller and K. Westlid, Acta Chem. Scand., Ser. B, 1988, 42, 48–51 CrossRef
.
- M. Kulka and H. Hibbert, J. Am. Chem. Soc., 1943, 65, 1180–1185 CrossRef CAS
.
- T. Yokoyama and Y. Matsumoto, Holzforschung, 2008, 62, 164–168 CAS
.
- H. Ito, T. Imai, K. Lundquist, T. Yokoyama and Y. Matsumoto, J. Wood Chem. Technol., 2011, 31, 172–182 CrossRef CAS
.
- T. Imai, T. Yokoyama and Y. Matsumoto, J. Wood Chem. Technol., 2012, 32, 165–174 CrossRef CAS
.
- K. Lundquist, R. Lundgren, J. Danielsen, A. Haaland and S. Svensson, Acta Chem. Scand., 1972, 26, 2005–2023 CrossRef CAS
.
- T. Imai, T. Yokoyama and Y. Matsumoto, J. Wood Sci., 2011, 57, 219–225 CrossRef CAS
.
- T. Yokoyama, J. Wood Chem. Technol., 2014, 35, 27–42 CrossRef CAS
.
- P. J. Deuss, M. Scott, F. Tran, N. J. Westwood, J. G. de Vries and K. Barta, J. Am. Chem. Soc., 2015, 137, 7456–7467 CrossRef CAS PubMed
.
- M. M. Abu-Omar, K. Barta, G. T. Beckham, J. S. Luterbacher, J. Ralph, R. Rinaldi, Y. Roman-Leshkov, J. S. M. Samec, B. F. Sels and F. Wang, Energy Environ. Sci., 2021, 14, 262–292 RSC
.
- Y. M. Questell-Santiago, M. V. Galkin, K. Barta and J. S. Luterbacher, Nat. Rev. Chem., 2020, 4, 311–330 CrossRef CAS
.
- L. Shuai, M. T. Amiri, Y. M. Questell-Santiago, F. Heroguel, Y. Li, H. Kim, R. Meilan, C. Chapple, J. Ralph and J. S. Luterbacher, Science, 2016, 354, 329–333 CrossRef CAS PubMed
.
- P. J. Deuss, C. S. Lancefield, A. Narani, J. G. de Vries, N. J. Westwood and K. Barta, Green Chem., 2017, 19, 2774–2782 RSC
.
- P. Saravanan, M. Chandrasekhar, R. Vijaya Anand and V. K. Singh, Tetrahedron Lett., 1998, 39, 3091–3092 CrossRef CAS
.
- J. Kwon, J. Kim, S. Park, G. Khang, P. M. Kang and D. Lee, Biomacromolecules, 2013, 14, 1618–1626 CrossRef CAS PubMed
.
- A. Kaiho, D. Mazzarella, M. Satake, M. Kogo, R. Sakai and T. Watanabe, Green Chem., 2016, 18, 6526–6535 RSC
.
- P. J. Deuss, C. W. Lahive, C. S. Lancefield, N. J. Westwood, P. C. Kamer, K. Barta and J. G. de Vries, ChemSusChem, 2016, 9, 2974–2981 CrossRef CAS PubMed
.
- X. Huang, O. M. Morales Gonzalez, J. Zhu, T. I. Korányi, M. D. Boot and E. J. M. Hensen, Green Chem., 2017, 19, 175–187 RSC
.
- R. Jastrzebski, S. Constant, C. S. Lancefield, N. J. Westwood, B. M. Weckhuysen and P. C. Bruijnincx, ChemSusChem, 2016, 9, 2074–2079 CrossRef CAS PubMed
.
- A. De Santi, S. Monti, G. Barcaro, Z. Zhang, K. Barta and P. J. Deuss, ACS Sustainable Chem. Eng., 2021, 9, 2388–2399 CrossRef CAS PubMed
.
- C. W. Lahive, P. J. Deuss, C. S. Lancefield, Z. Sun, D. B. Cordes, C. M. Young, F. Tran, A. M. Slawin, J. G. de Vries, P. C. Kamer, N. J. Westwood and K. Barta, J. Am. Chem. Soc., 2016, 138, 8900–8911 CrossRef CAS PubMed
.
- A. De Santi, M. V. Galkin, C. W. Lahive, P. J. Deuss and K. Barta, ChemSusChem, 2020, 13, 4468–4477 CrossRef CAS PubMed
.
- M. R. Sturgeon, S. Kim, K. Lawrence, R. S. Paton, S. C. Chmely, M. Nimlos, T. D. Foust and G. T. Beckham, ACS Sustainable Chem. Eng., 2013, 2, 472–485 CrossRef
.
- A. Kaiho, M. Kogo, R. Sakai, K. Saito and T. Watanabe, Green Chem., 2015, 17, 2780–2783 RSC
.
- E. Jasiukaitytė-Grojzdek, M. Kunaver and C. Crestini, J. Wood Chem. Technol., 2012, 32, 342–360 CrossRef
.
- D. S. Zijlstra, C. W. Lahive, C. A. Analbers, M. B. Figueirêdo, Z. Wang, C. S. Lancefield and P. J. Deuss, ACS Sustainable Chem. Eng., 2020, 8, 5119–5131 CrossRef CAS
.
- C. S. Lancefield, I. Panovic, P. J. Deuss, K. Barta and N. J. Westwood, Green Chem., 2017, 19, 202–214 RSC
.
- C. W. Lahive, P. C. J. Kamer, C. S. Lancefield and P. J. Deuss, ChemSusChem, 2020, 13, 4238–4265 CrossRef CAS PubMed
.
- R. Jastrzebski, S. Constant, C. S. Lancefield, N. J. Westwood, B. M. Weckhuysen and P. C. Bruijnincx, ChemSusChem, 2016, 9, 2074–2079 CrossRef CAS PubMed
.
- Q. Ye and T. Yokoyama, J. Wood Chem. Technol., 2021, 41, 294–306 CrossRef CAS
.
- H. E. Fisher, M. Kulka and H. Hibbert, J. Am. Chem. Soc., 1944, 66, 598–601 CrossRef CAS
.
- E. West, A. S. MacInnes and H. Hibbert, J. Am. Chem. Soc., 1943, 65, 1187–1192 CrossRef CAS
.
- L. Mitchell and H. Hibbert, J. Am. Chem. Soc., 1944, 66, 602–604 CrossRef CAS
.
- D. M. Miles-Barrett, A. R. Neal, C. Hand, J. R. Montgomery, I. Panovic, O. S. Ojo, C. S. Lancefield, D. B. Cordes, A. M. Slawin, T. Lebl and N. J. Westwood, Org. Biomol. Chem., 2016, 14, 10023–10030 RSC
.
- M. Scott, P. J. Deuss, J. G. de Vries, M. H. G. Prechtl and K. Barta, Catal. Sci. Technol., 2016, 6, 1882–1891 RSC
.
- M. Hirata and T. Yokoyama, Holzforschung, 2022, 76(3), 223–234 CrossRef
.
- K. Lundquist and T. K. Kirk, Acta Chem. Scand., 1971, 25, 889–894 CrossRef CAS PubMed
.
- H. Wang, M. Tucker and Y. Ji, J. Appl. Chem., 2013, 2013, 1–9 CrossRef
.
- E. I. Evstigneyev and S. M. Shevchenko, Wood Sci. Technol., 2020, 54, 787–820 CrossRef CAS
.
- K. H. Kim and C. S. Kim, Front. Energy Res., 2018, 6, 92 CrossRef
.
- P. J. Deuss and K. Barta, Coord. Chem. Rev., 2016, 306, 510–532 CrossRef CAS
.
- K. Ishimaru and T. Kojima, J. Org. Chem., 2003, 68, 4959–4962 CrossRef CAS PubMed
.
- F. Fringuelli, F. Pizzo and L. Vaccaro, J. Org. Chem., 2001, 66, 4719–4722 CrossRef CAS PubMed
.
Footnote |
| † Electronic supplementary information (ESI) available. See DOI: https://doi.org/10.1039/d2gc00069e |
| This journal is © The Royal Society of Chemistry 2022 |

