
 Open Access Article
 This Open Access Article is licensed under a
 Creative Commons Attribution 3.0 Unported Licence
Separation of bio-based glucaric acid via antisolvent crystallization and azeotropic drying†
Hoon
Choi
 a,
Nathan E.
Soland‡
a,
Bonnie L.
Buss
a,
Nora C.
Honeycutt§
a,
Emily G.
Tomashek¶
a,
Stefan J.
Haugen
a,
Kelsey J.
Ramirez
a,
Joel
Miscall
a,
Eric C. D.
Tan
a,
Tyler N.
Smith
b,
Patrick O.
Saboe
a and
Eric M.
Karp
*a
a,
Nathan E.
Soland‡
a,
Bonnie L.
Buss
a,
Nora C.
Honeycutt§
a,
Emily G.
Tomashek¶
a,
Stefan J.
Haugen
a,
Kelsey J.
Ramirez
a,
Joel
Miscall
a,
Eric C. D.
Tan
a,
Tyler N.
Smith
b,
Patrick O.
Saboe
a and
Eric M.
Karp
*a
aRenewable Resources and Enabling Sciences Center, National Renewable Energy Laboratory, Golden, Colorado 80401, USA. E-mail: eric.karp@nrel.gov
bKalion Inc., 92 Elm St., Milton, MA 02186, USA
First published on 18th January 2022
Abstract
Glucaric acid is regarded as a top-value added compound from biomass, however, due to prevalent lactonization, the recovery of purified glucaric acid is challenging. Accordingly, an efficient method for glucaric acid separation, especially its diacid form, is necessary to facilitate its valorization. Here, we report a robust separation process that produces glucaric acid crystals from fermentation broth. This process first recovers purified monopotassium glucarate from broth and then recovers purified glucaric acid through acidification and antisolvent crystallization. Isopropanol was found to be an effective antisolvent reducing the solubility of glucaric acid while concomitantly forming an azeotrope with water. This allows solvent removal at low temperature through azeotropic drying, which avoids lactonization, and thus prevents impurities in the resulting crystals. Overall, this process was found to separate monopotassium glucarate and glucaric acid with a recovery yield of >99.9% and 71% at purities of ca. 95.6 and 98.3%, respectively. Process modeling demonstrates the ability to recycle the antisolvents IPA and acetone with >99% recovery and determined the energy input to be ∼20 MJ kg−1 for isolation of monopotassium glucarate and 714 MJ kg−1 for glucaric acid (0.06 M). The approach detailed in this work is likely applicable to the separation of other highly oxygenated bio-carboxylic acids (e.g., mevalonic acid) from fermentation broths, as well as to their recovery from abiotic reaction solutions.
Introduction
Glucaric acid (GA) and its salts have applications in many products including detergents, corrosion inhibitors, and polymers.1 Its dicarboxylic acid functionality and 6-carbon chain make it a precursor to adipic acid, which is used for the production of nylons and the biodegradable polymers, polybutylene succinate adipate and polybutylene adipate terephthalate.2–6 It is also a promising additive in polymers such as polyvinyl alcohol, where 3–5 wt% of glucaric acid has been shown to lower the melting temperature and improve mechanical performance.7 Furthermore, GA acts as a chelating agent for divalent ions (e.g. Ca2+ and Mg2+) such that GA can be used for phosphate-free and biodegradable detergents, or as a corrosion inhibitor in treating water systems, such as cooling towers and boilers.8Today, GA is primarily produced via the chemical oxidation of glucose using nitric acid, an expensive and nonselective process, where competing side reactions result in low isolated yields (≤43%) of GA.9 This highly exothermic oxidation requires a 4![[thin space (1/6-em)]](https://www.rsc.org/images/entities/char_2009.gif) :1 molar ratio of nitric acid to glucose, which generates 0.85 kg of nitric acid waste (NOx) per kg of GA. Although a method for regenerating and recycling nitric acid from the NOx waste has been reported, the process did not improve the selectivity of the glucose oxidation or increase the yields of GA.9 Alternatively, other GA production methods via electrochemical or catalytic oxidation methods with homogeneous or heterogeneous catalysts have been studied. However, these approaches were at a small scale (<100 ml) and are actively being researched.4,8,10,11 In these chemical oxidation reactions, organic acid byproducts such as gluconic acid, glucuronic acid, tartaric acid, and oxalic acid are often coproduced and result in dilute and complex mixtures to selectively isolate GA from.8,12,13 To that end, greener, scalable synthesis methods using fermentation for the production of GA are an active area of research.
:1 molar ratio of nitric acid to glucose, which generates 0.85 kg of nitric acid waste (NOx) per kg of GA. Although a method for regenerating and recycling nitric acid from the NOx waste has been reported, the process did not improve the selectivity of the glucose oxidation or increase the yields of GA.9 Alternatively, other GA production methods via electrochemical or catalytic oxidation methods with homogeneous or heterogeneous catalysts have been studied. However, these approaches were at a small scale (<100 ml) and are actively being researched.4,8,10,11 In these chemical oxidation reactions, organic acid byproducts such as gluconic acid, glucuronic acid, tartaric acid, and oxalic acid are often coproduced and result in dilute and complex mixtures to selectively isolate GA from.8,12,13 To that end, greener, scalable synthesis methods using fermentation for the production of GA are an active area of research.
Biocatalysis offers high selectivity, mild reaction conditions, and the ability to effectively convert renewable sugars to platform chemicals for fuels, plastics, and other renewable chemicals.14–16 These approaches also align with ‘green chemistry’ principles, having the potential to minimize waste streams, eliminate heavy metal catalysts, and increase energy efficiency.17,18 GA is an example of a promising platform carboxylic acid that can be produced via fermentation with several green chemistry benefits over traditional catalytic oxidation processes.19–21 Notably, fermentation occurs under mild conditions (30 °C and pH 7.0) without generating excessive amounts of toxic waste steams or requiring high pressure reactors.19,22 However, the isolation of GA from fermentation broth remains challenging, and there has been little work on improving the separation process.
A major challenge in recovering GA diacid crystals is avoiding lactonization side reactions that occur during the separation process. Under fermentation conditions at near neutral pH GA isomers exist stably in the mono- or di-salt form with counter cations such as potassium or sodium. However, after acidification of the broth to a pH < 3 the resulting GA diacid is readily lactonized into D-glucaro-1,4-lactone, D-glucaro-6,3-lactone, and D-glucaro-1,4:6,3-dilactone in aqueous conditions, as shown in Fig. S1A.†23 Brown et al. calculated the equilibrium and rate constants for each lactonization reaction in Fig. S1A† based on NMR data.23 Using those data, we found approximately 55% of GA is lactonized within 6 hours, even at 30 °C (Fig. S1B†). This rapid lactonization complicates the development of a method to isolate purified GA crystals. Armstrong et al. reported a method to produce crystalline GA from the monopotassium glucarate salt (KGA) via cation exchange (CEX) and azeotropic drying using a water–acetonitrile (ACN) system.24 In that system, the addition of ACN formed an azeotrope with water allowing low temperature water removal to minimize GA lactonization. Although the ACN–water system achieved high purity (>99%) and a high recovery yield (98.7%) of crystalline GA, the feed concentration was low (5 g L−1 KGA) with an overall diluted reaction solution (95:5 ACN:GA aqueous solution v/v), limiting the method's efficiency and scalability. Specifically, the starting GA solution volume is increased 19× due to a large amount of ACN needed to remove the water azeotropically. This 19× volume increase in the stream requires large crystallization tanks and a large amount of ACN solvent recovery. This results in excessive energy input per product for the post-crystallization ACN recovery process. Accordingly, developing a more sustainable and scalable process to recover specific purified forms of KGA and GA from fermentation broth is a key challenge to improving the economics of bio-glucaric acid and its ultimate commercialization.
To address the need for optimized downstream processing routes for GA, this work proposes a scalable, environmentally friendly, and economically feasible antisolvent separation process for the recovery of GA and its salts from fermentation broth. Antisolvent crystallization involves combining the product solution with another solvent in which the product is only slightly soluble. This significantly reduces the solubility of the product in that solution, allowing it to be recovered as a precipitate.25 One notable feature is that our process uses antisolvents that are Generally Recognized as Safe (GRAS).
The separation processes are depicted in Fig. 1. First, dipotassium glucarate (K2GA) is produced via fermentation at a neutral pH to generate a broth. Solid KGA is then recovered from the broth by employing (1) pH-adjustment from 7 to 3.5 to generate KGA, (2) antisolvent crystallization of KGA using acetone at an acetone-to-water mass ratio of 1 to 2.95, (3) KGA product filtration, and finally (4) acetone antisolvent recycling via distillation of the supernatant. Next, crystalline GA is produced from the purified KGA via another antisolvent crystallization process, which consists of the following steps: (1) cation exchange for acidification and K+ removal, (2) isopropanol (IPA) antisolvent crystallization of GA, (3) GA crystal recovery by azeotropic drying, and (4) IPA antisolvent recycling. The physicochemical and thermodynamic properties of the purified KGA and GA products were analyzed and used to develop Aspen Plus models for solvent recovery, which enables the calculation of the energy input on the downstream process. Compared to the ACN–water system the IPA system reduces the antisolvent amount by 2.1 times. The antisolvent crystallization process proposed in this work could also be applicable to the purification of other oxidation products from glucose, such as gluconic acid and mevalonic acid.26
 | ||
| Fig. 1 Process flow diagram for producing KGA and GA crystals. HCl was added into antisolvent crystallization 1 process for pH control. Acetone and isopropanol were used as antisolvent for KGA in antisolvent crystallization 1 and for GA in antisolvent crystallization 2 processes, respectively. | ||
Experimental
Materials
Glucaric acid fermentation broth was obtained from Kalion, Inc. The final titer of glucaric acid was ca. 69.1 g L−1 measured by LC analysis. The broth was sterile filtered through a 0.2 μm ceramic filter before any downstream processing. Cation exchange was carried out on DOWEX G-26 H ion exchange resin (DuPont) packed into a Cytiva XK 16/20 chromatography column. 6 M hydrochloric (HCl) (Carolina Biological) was diluted to 1 M for acidification of broth and regeneration of the DOWEX G-26 resin. Acetone (VWR, >99.5%), was used as the antisolvent for KGA, and isopropanol (Sigma-Aldrich, >99.5%) was used as an antisolvent and azeotropic drying aid to recover crystalline GA. All water used was ultra-high purity (>17.2 MΩ cm). D2O with 0.05 wt% 3-(trimethylsilyl)propionic-2,2,3,3-d4 acid was purchased from Sigma-Aldrich for NMR analysis.KGA solubility measurements
KGA solubility was quantified by adding excess KGA to ultra-high purity (UHP) water and adjusting pH between 1–6 by addition of 2 M HCl or 2 M KOH with stirring. The samples were mixed, allowed to sit overnight, and then the pH was measured again. The samples were filtered, diluted with a pH 7 phosphate buffer to reduce lactonization and the KGA concentration was quantified by LC. Similarly, KGA solubility in a 25.2 wt% acetone solution was measured by preparing KGA-saturated solution samples at −20 °C, 4 °C, and 22 °C and quantified using the LC method.GA solubility measurements
Due to the lactonization potential of GA, the solubility was estimated using thermogravimetric analysis (TGA) based on the mass balance of the saturated solution. A sample of acetone-washed GA was dissolved in 3 mL of the IPA/water mixture (7:1 by mass) to excess, sonicated, and allowed to settle overnight at each of three temperatures: −20 °C, 4 °C, and 22 °C. Next, the solutions were filtered at a pore size of 0.45 μm. These saturated solutions were dropped into an aluminum Differential Scanning Calorimetry (DSC) pan and placed on dry ice to partially freeze them and slow the evaporation rate so that the mass of the total solution could be measured by TGA. The partially frozen solution was heated from room temperature at 5 °C per minute to 110 °C and held isothermally for 15 minutes to allow the solvent to evaporate. In this way, the mass of the remaining species in the pan was determined to μg precision. This was taken to be the total mass of GA that had dissolved in the solvent, including possible lactone products, in a catch-all method. The method was tested for known concentrations in the range of 1 g L−1 to 15 g L−1 with a blinded relative error of approximately 6%, compared to 15% for the LC method used for KGA analysis (see ESI, Fig. S2†).
Recovery of KGA from fermentation broth
For the recovery of KGA, acetone was used as the antisolvent as it provided the lowest glucarate solubility in organic–aqueous systems (see Results). 2 M HCl (100 mL) was added to a broth solution (500 mL) to adjust the pH to 3.5. Acetone (250 mL) was slowly added into the solution with stirring. The broth mixture was cooled to 4 °C for 24 hours to promote crystal growth and increase yield, then KGA crystals were recovered via vacuum filtration. The filtered product was mixed with a 50% acetone/water solution and filtered three times to completely remove any leftover broth solution. The recovered crystals were dried in a vacuum oven until a constant mass was achieved. The purity of the crystalline KGA was evaluated using liquid chromatography (LC), FTIR, DSC, and 1H NMR.Glucarate acidification via cation exchange (CEX)
To generate crystalline GA, cation exchange of KGA in water was performed using DOWEX G-26 resin. This resin was pretreated by covering ∼15 g of dry resin with 1 M HCl. The resin was then slurry packed into a GE XK 16/20 column and then connected to a Cytiva ÄKTA Pure Chromatography system. The packed column size was 16 mm in inner diameter and 10 cm in length. This allowed for continuous pH, conductivity, and temperature monitoring. The resin was rinsed with 7–10 column volume of UHP water at a flow rate of 4 mL min−1 until a neutral pH was achieved. KGA purified from fermentation broth was dissolved in water. Here, 1 M KOH was added to increase the pH and solubility to yield a concentration of 0.1 M KGA. The effluent was collected as waste until the pH of the effluent dropped below 2.5 and stabilized, which indicated that the effluent pH was below the pKa of GA and that the GA concentration was constant. Additionally, UV 190 nm, 210 nm, and conductivity readings were steady in this range. This effluent fraction was collected into a clean beaker and placed in an ice bath to inhibit the lactonization of free GA in the solution. After the desired volume of KGA solution had been pumped into the column, UHP water was added to prevent the column from running dry. The effluent was then collected until the pH was above 2.5 and UV 190 nm signal began to decrease. UHP water was pumped through the column at a rate of 3 mL min−1 until the effluent was at a neutral pH. Then, the column was washed with UHP water to remove salts in the column and regenerated by loading 1 M HCl. When the pH curve showed a breakthrough of HCl, the column was washed with water until the conductivity dropped to below 0.01 mS cm−1.Antisolvent crystallization of GA with azeotropic drying
For the recovery of GA, IPA was used as the antisolvent and azeotropic drying aid. IPA was added to the GA solution at a mass ratio of 7:1 (12.5 wt% aqueous solution) to create a low-boiling azeotropic solution. GA was recovered by reducing the volume of the azeotrope using rotary evaporation to create a supersaturated solution of GA. This mixture was gradually evaporated using a Buchi Rotavapor® R-300 Rotary Evaporator at 30 mbar and 22 °C to one-tenth the original volume. At this point, small seed crystals of GA formed throughout the solution (Fig. S4D†). When the solution was not in the rotary evaporator, it was kept on ice to slow lactonization. The concentrated GA solution was stored overnight in a −20 °C freezer to further crystal growth from the seed crystals. Next, the GA crystals were recovered via rotary evaporation. Any lactones present in the GA crystals were removed by washing two times with an excess amount of acetone and the remaining crystals were then vacuum filtered. Finally, the GA crystals were vacuum dried (70 °C, 22 mmHg) for six hours. Purity of the crystalline GA was evaluated using FTIR, DSC and 1H NMR.
Solvent recovery model
An Aspen Plus model was built to estimate the energy footprint of solvent recycling via distillation. This model was developed to recover the antisolvents, acetone for KGA, and IPA for GA recovery, respectively, after the crystalline products were separated. The process was optimized to achieve a >99% recovery yield for both product crystal as well as the antisolvent with >99.0% purity. The simulation was split into two sections: (1) crystallization and (2) solvent recovery. In the crystallization section, KGA and GA were input as user-defined components, and the UNIFAC method was chosen because of its reliable predictions based on functional group contributions.27 Non-random two-liquid (NRTL) model was used for the solvent recovery section to accurately simulate the distillation process. The detailed parameter setup is explained in ESI section S4.†DSC for purity analysis
Modulated differential scanning calorimetry (MDSC) was used to measure the purities of crystalline KGA and GA via melting point depression. GA samples were tested from 20 to 140 °C at a ramp rate of 2 °C min−1 with a modulation amplitude of 1 °C and a modulation period of 60 seconds, and KGA from 20 to 190 °C with the same modulation.Liquid chromatography (LC) for KGA analysis
The concentration of KGA in aqueous solutions was quantified using an Agilent 1290 Infinity Series LC system equipped with UV-diode array detection at 210 nm. 15 μl samples were injected onto a Phenomenex Luna C18(2) 5 μm, 150 mm × 4.6 mm column at a temperature of 35 °C. An isocratic mobile phase of 20 mM potassium phosphate at pH 7 was pumped at a flow rate of 0.65 mL min−1 for 7 min. KGA standards were prepared from powder into the mobile phase buffer previously described. A calibration verification standard (CVS) was injected every 15 samples to ensure instrument stability.FT-IR analysis
Crystalline GA and KGA were analyzed via FTIR on a Nicolet iS50 spectrometer in ATR mode. Spectra were measured from 450–4000 cm−1 at 2 cm−1 resolutions over 24 scans.NMR analysis for GA analysis
Structural and purity analysis was performed using a Varian 300 MHz NMR Spectrometer. For all analyses, samples were prepared at 2–4 mg mL−1 using D2O with 0.05 wt% 3-(trimethylsilyl)propionic-2,2,3,3-d4 acid. All spectra were referenced from D2O and processed using Bruker TopSpin.Results
Effect of pH and solvents on the solubility of glucarate
The solubility of different glucarate forms was measured in the pH range of 1 to 6 in water and water–antisolvent systems to determine an optimal condition for separation from aqueous fermentation broth. Previous work has shown the solubility of monopotassium glucarate (KGA) is lower than the dipotassium form and the diacid form (GA), and, therefore, KGA can be precipitated by adjusting the pH to 3.4 where the KGA form is present in the highest concentration.9,13 This speciation as a function of pH is seen in Fig. 2A, where the molar fraction of each form is calculated from the reported pKa values of glucaric acid (pKa1 = 3.17 and pKa2 = 3.96).28 Here KGA reaches a maximum concentration of 55 mol% at pH 3.6. However, the KGA yields cannot reach 100% by pH adjustment alone. Accordingly, we added an antisolvent to increase the KGA yield. Preliminary antisolvent screening results found acetone and ethanol (Fig. S3†) to be promising antisolvents since both have low dielectric constants that reduce the KGA solubility. Acetone was chosen as the preferred antisolvent because of its low boiling point and no azeotrope formation with water, which is advantageous for solvent recycling via distillation. | ||
| Fig. 2 (A) Glucaric acid molar speciation at different pH (pKa1 = 3.17 and pKa2 = 3.96),28 (B) glucarate solubility at various pH in acetone/water mixtures (0, 12, 25 wt%) at 22 °C, (C) KGA from broth mass yield comparison among acid and acetone addition methods at 4 °C. The inset photo is the KGA precipitate from broth pH adjusted to 3.5 (left) and broth pH adjusted to 3.5 with acetone 25 wt% acetone addition (right). | ||
Fig. 2B shows the solubility of glucarate in the pH range of 1 to 6 and with acetone concentrations at 0, 12, and 25 wt%. When the pH is close to neutral, glucarate is approximately 100 mol% K2GA, which has a high solubility in water (>120 g L−1). As the pH is decreased to 3.5, KGA dominates the mol fraction at 55 mol% (Fig. 2A) and KGA's solubility is around 16 g L−1 (Fig. 2B), which is significantly reduced to 13.5% of the solubility of K2GA at pH 5.8. Further, an additional 50% reduction of the KGA solubility (down to ∼8.1 g L−1) was observed by adding acetone (25 wt%). Thus, the lowest solubility was observed between a pH of 3.1 and 4.3 where KGA− is largely formed. As the pH is decreased further toward 1.5 the solubility increases by ∼55% (26 g L−1), here KGA is fully protonated to H2GA and stabilized via hydrogen bonding interactions with water.
KGA recovery from fermentation broth via antisolvent crystallization
GA was produced by Kalion, Inc. by a proprietary fermentation process., The final titer of GA was 69.1 g L−1 at pH 7.0. Cells and debris were removed using 0.2 μm filtration. After filtration, the pH of the broth permeate remained at 7.0 such that all the produced GA stably existed as dipotassium glucarate (K2GA) as shown in Fig. 2A and thus did not form any lactone species.Using the solubility results, KGA was recovered from the filtered broth by adjusting the pH and with simultaneous addition of 25 wt% acetone. Fig. 2C compares the KGA recovery yield with these methods. Adding only 25 wt% acetone into the broth without pH adjustment (note the starting broth pH was 7.0) caused phase separation between the acetone-rich phase and the salt-rich phase resulting in a KGA recovery yield of only 7%. By adjusting the pH to 3.5, without acetone addition, the KGA recovery yield was 83%. Combining these two methods by adding 25 wt% acetone in the pH adjusted broth (pH = 3.5) resulted in essentially quantitative recovery of KGA. As seen in the inset photo in Fig. 2C and Fig. S4,† the amount of precipitated KGA from this combined pH adjustment and acetone addition method is visually larger compared to that from the acid addition method and the acetone addition method. Although the solubility of KGA was not expected to be zero at this condition (measured as around 8.1 g L−1 from control experiments in Fig. 2B), essentially all the KGA precipitated out. This could be the result of the lower equilibration temperature and the ion effect by other salt species in the broth that could further reduce the KGA solubility.
GA recovery via CEX and antisolvent crystallization
To recover the free acid form of GA, the purified KGA was redissolved in water at a concentration of 0.1 M (0.21 g L−1) and treated with a cation exchange (CEX) process to exchange the K+ cations to H+ cations. Since the selectivity of K+ over H+ is known (2.54) in polystyrene-based sulfonic resins with 10% cross-linkage, K+ cations were easily adsorbed to the resin by exchanging with preloaded H+ cations.29 The GA− anions were not adsorbed during the elution. When measuring the breakthrough curve, the GA-free acid was eluted without adsorption, and the eluent pH dropped immediately, remaining constant at ∼2.5 until the column was fully saturated with K+ cations (Fig. 3). The eluent pH increased after saturating the resin with K+ cations. Saturation occurred at approximately seven bed volumes of KGA solution (0.1 M, pH adjusted by KOH), which indicates the column capacity of ca. 2.0 mequiv. per mL. Thus, the acidified GA solution was collected for crystallization when the eluent pH was constant at 2.5 and cooled on ice to prevent lactonization. The CEX process was further tested using several KGA solutions to optimize the loading conditions.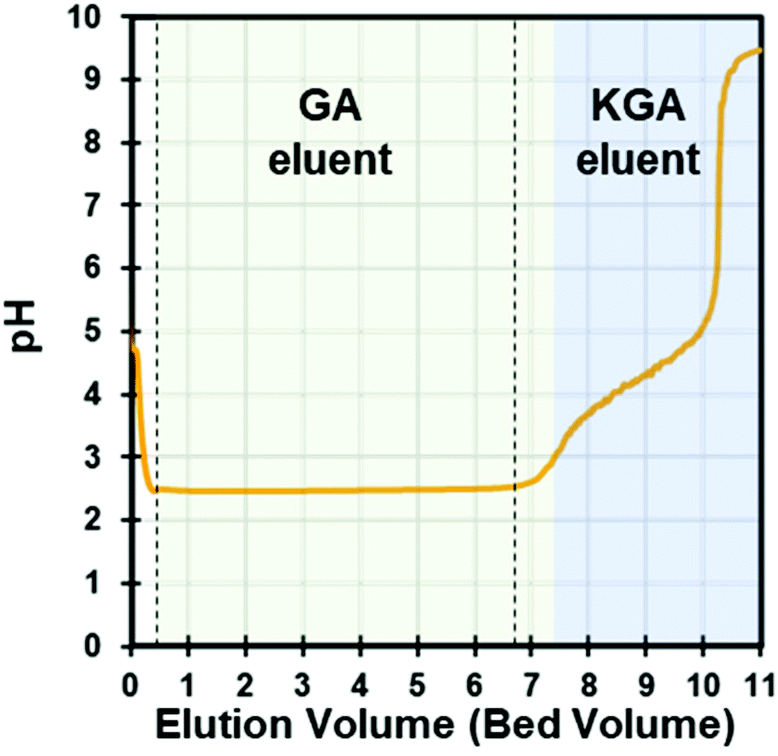 | ||
| Fig. 3 GA eluent from KGA loading in the DOWEX G26 CEX column. The vertical lines show the cutoff line for GA recovery. | ||
In this study, KGA was dissolved in high purity water near the saturation limit (0.06 M) and a higher feed concentration (0.1 M) was achieved by adjusting pH to 9.4 with additional KOH. We used the 0.1 M feed condition because the total mass of GA produced for a given loaded volume of KGA solution increased with similar yields and purities compared to the 0.06 M condition (discussed below). Also, seed crystal formation and growth are a concentration-driven process, and those rates in 0.1 M concentrations are therefore faster than at 0.06 M, which is favorable in a large-scale process. We also attempted to use higher feed concentrations of KGA at 0.24 M by adding KOH to increase the KGA solubility. However, K+ cations were not fully exchanged leading to the elution of some KGA, and this prevented downstream GA crystallization. Thus, it is not recommended to increase the KGA concentration above 0.1 M in the feed to the CEX resin.
Since GA has a 56% higher solubility than KGA, even in water/antisolvent mixtures as compared in Fig. 2B and is easily lactonized (Fig. S1†),24 an antisolvent crystallization approach that incorporates azeotropic drying was employed to recover the free acid form of GA. For this reason, the selection of an antisolvent is critical not only for decreasing GA solubility but also for evaporating water at low temperatures via azeotropic distillation. As seen in Fig. S3,† alcohols can be appropriate antisolvents because of their low dielectric constants. Among several alcohols, IPA was chosen as an antisolvent because it forms a low boiling azeotrope with water of 21.0 °C at 50 mbar and requires a relatively low solvent-to-water mass ratio of 7:1 based on results from an NRTL model (Fig. S5A†). Furthermore, IPA was found to generate a greater antisolvent effect than ACN. Specifically, the solubility of GA in IPA–water is 53% lower than that in ACN–water, and 77% lower than that in water (Fig. S5B†). Therefore, the addition of IPA to the aqueous GA solution generates a concomitant antisolvent effect accelerating the formation of GA crystals while also allowing low temperature water removal.
The IPA antisolvent crystallization process was carried out in three steps: (1) concentration, (2) seed growth, and (3) complete solvent removal. First, the collected GA solution was mixed with IPA at a 7:1 mass ratio of IPA to GA and then the GA solution–IPA mixture was concentrated 10-fold by rotary evaporation (30 mbar, 23 °C), resulting in the formation of GA crystal seed (Fig. S4D†). We observed that the evaporation rate was nearly two times faster at 30 mbar than 50 mbar. Accordingly, 30 mbar was used to lower the processing time as a means to prevent lactonization.
Table 1 presents the overall yield of this three step GA crystallization process based on the initial concentration of the KGA solution that was fed into the CEX column. GA recovery yields and purities were very similar between 0.06 M and 0.1 M KGA feed solution. The yield loss was mainly due to transfer losses of lactones stuck on the wall of the vial. After washing the recovered crystals with acetone, the recovery yield decreased to 71.1% but the GA purity was increased to 98.3% as determined by DSC.
| Feed concentration | GA yield (%) | GA purity (%) |
|---|---|---|
| a The GA yield was determined by a weight ratio (mGA/mKGA) and the purity by DSC. | ||
| 0.06 M KGA | 93.0 | 88.6 |
| 0.1 M KGA (pH 10) | 92.5 | 88.7 |
| 0.1 M KGA (Washed) | 71.1 | 98.3 |
To determine the source of the impurities, the recovered KGA and GA products were characterized with 1H NMR and ATR-FTIR. The 1H-NMR spectrum of crystalline KGA revealed a highly pure product (Fig. S6A,† green trace). Conversion of GA from KGA was clearly observed, with a downfield shift of the terminal protons from 4.21 ppm and 4.26 ppm to 4.36 ppm and 4.48 ppm, but with the presence of the undesired lactone species downfield (Fig. S6A,† red trace). The presence of lactones was qualitatively assessed by the γ-lactone peak at 1775 cm−1 (Fig. S6B,† red trace). The intensity of this peak was significantly reduced after washing the crystals with acetone with 1 to 1 solid to liquid volume ratio and eliminated after two successive acetone washes, which was also confirmed by 1NMR (Fig. S6A,† blue trace). Notably, the FTIR spectrum of GA obtained in this study matches with that reported by Armstrong, et al., though without the presence of acetonitrile C![[triple bond, length as m-dash]](https://www.rsc.org/images/entities/char_e002.gif) N stretching around 2250 cm−1.24 Further, these observations were consistent with other previously reported data.23,24,30,31
N stretching around 2250 cm−1.24 Further, these observations were consistent with other previously reported data.23,24,30,31
The XRD patterns for KGA and GA were also measured. Different peaks between KGA and GA indicate variances in crystal structures (Fig. S7†). The XRD pattern of GA is consistent with previously reported data.24,30 Optical microscopy images of the GA crystal revealed a monoclinic structure with around 200 μm on the longest axis as expected from XRD pattern (Fig. S4F†).30
DSC analysis showed that the melting point of KGA and GA was 182.5 °C and 105 °C, respectively (Fig. S8†). The literature values of KGA and GA were 188 °C and 111 °C, respectively.24,30 Lower melting point here could be results of trace amount of lactone impurities. Additionally, the purities of KGA and GA were measured with DSC by using the melting point depression method (Table 1). DSC is a highly accurate method to calculate absolute purity and it is possible that some impurities cannot be detected in NMR, which only shows the 1H resonance. The DSC measured purities of KGA and GA were 95.6% and 98.3%, respectively.
Energy demand for solvent recovery
Aspen Plus models of both the KGA and GA downstream processes were developed to determine the energy input on a kg product basis and to determine the ability to recycle the antisolvents. Process flow diagrams are shown in Fig. 4. To simulate the thermodynamic properties of KGA and GA, a UNIFAC model was employed, and their thermodynamic properties such as heat capacity, solubility, and solid molar volume were obtained either from product characterization data from this work or from literature data (Fig. S9 and Table S2†). The feed concentration of KGA and GA from the analysis of the broth was used as the simulation input stream. However, other salts and impurities in the fermentation broth were not considered and were assumed to remain in the wastewater, negligibly affecting the thermodynamic properties of KGA and GA in all processes. For the KGA recovery process, pH adjusted fermentation broth (pH = 3.5) was fed into the crystallization vessel with acetone as the antisolvent at 25 wt% and a filtration process was modeled to recover solid KGA (Fig. 4A). Then, pure acetone was recovered from the supernatant by distillation and recycled as the KGA antisolvent. The resulting water stream that includes non-quantified fermentation broth compounds was sent to wastewater treatment. Overall, both KGA and acetone were recovered with >99% yield and >99% purity. The heat duty for acetone recycling in the KGA purification process was determined to be 20.12 MJ kg−1 KGA as shown in Table 2. Approximately 35% of net heat duty was used for crystallization, while the other 65% was used for acetone recovery. The net vacuum duty for the KGA recovery process was 0.11 MJ kg−1 KGA. | ||
| Fig. 4 Process flow diagrams used to estimate energy consumption and to determine the ability to recycle the antisolvents in the process for the crystallization and recovery of (A) KGA and (B) GA. For the solvent recovery process in GA, two different processes, extractive distillation (EXD) and pervaporation (PV) were studied. | ||
| KGA | GA (case 1: EXD) | GA (case 2: PV) | ||||||
|---|---|---|---|---|---|---|---|---|
| Unit operation | Heat duty (MJ kg−1 KGA) | Vacuum duty (MJ kg−1 KGA) | Unit operation | Heat duty (MJ kg−1 GA) | Vacuum duty (MJ kg−1 GA) | Unit operation | Heat duty (MJ kg−1 GA) | Vacuum duty (MJ kg−1 GA) |
| Crystallizer | 6.03 | Crystallizer | 7.79 | Crystallizer | 7.79 | |||
| Flash | 0.02 | 0.04 | Flash1 | 529.35 | 207.12 | Flash1 | 529.35 | 207.12 |
| Flash2 | 0.98 | 0.06 | Flash2 | 0.98 | 0.06 | |||
| Distillation | 14.07 | 0.07 | Dist1 | 246.94 | 30.32 | PERV | 175.64 | 0.00 |
| Dist2 | 389.51 | |||||||
| Net duty | 20.12 | 0.11 | Net duty | 1174.57 | 237.49 | Net duty | 713.75 | 207.17 |
The modeled GA purification process includes crystallization and IPA recycling by distillation to isolate GA from the GA eluent after CEX (Fig. 4B). To generate the azeotropic mixture, IPA was added to the GA CEX eluent at a mass ratio of 7 to 1. The solution was then evaporated in Flash 1 at 25 °C and 50 mbar to concentrate the GA 10-fold. This concentrated solution was then sent to a seed crystallization tank at −20 °C to form seed crystals. The seed solution was then sent to Flash 2 (30 mbar, 25 °C), where IPA and water were removed in the overhead to recover solid GA in the bottoms. The overhead of Flash 2 containing the azeotrope of water and IPA was combined with the overhead of Flash 1 and then separated into pure water and pure IPA. Since azeotropic distillation is often an energy-intensive process, we compared two scenarios for IPA dehydration: an extractive distillation (EXD) process using DMSO as an entrainer and a pervaporation process (PV).32,33 For case 1, EXD process for IPA and water recovery was conducted under 30 mbar and below 89 °C. Although our system is under an inert condition of DMSO, users should be aware of potential explosion hazards of DMSO as it autocatalytically decomposed typically above 180 °C at atmospheric pressure in the presence of acids.34
For case 2, the IPA-recovery was accomplished via a PV process. A pressure difference between the feed side and the permeate side drives water diffusing through the membrane and evaporating adiabatically on the permeate side such that IPA is recovered at the retentate stream. Since both separated IPA and water were highly pure (>99.9%), they can be recycled for reuse in the KGA redissolution and GA antisolvent crystallization processes.
When using the same feed concentration as used experimentally (0.06 M) and assuming a 100% GA recovery yield with no lactonization side-products, the net heat duty required for the overall process was determined to be 1175 MJ kg−1 GA for case 1 and 714 MJ kg−1 GA for case 2, respectively (Table 2). The net vacuum duty was 237 MJ kg−1 GA in case 1 and 207 MJ kg−1 GA for case 2, respectively. In both cases, 87% or 100% of total vacuum duty was attributed to the azeotropic drying (Flash1 and Flash2). In case 1, the solvent evaporation and recovery processes consumed 45% and 54% of the net heat duty, respectively (Fig. 5A). The heat duty for the PV process was 72% lower than that of EXD process, resulting in a 39% reduction of the total heat duty in case 2 compared to case 1. Overall, the energy demand for GA purification was much higher than that of KGA purification. Fig. 5 shows that the net heat duty per kg of GA product as a function of the GA concentration in the Feed stream. A sensitivity analysis of the feed concentration on heat duty showed that the net heat duty can be reduced with increasing the GA concentration for both cases (Fig. 5). For instance, the net heat duty for case 1 and 2 was reduced to 591 MJ kg−1 GA and 363 MJ kg−1 GA, respectively, by doubling the GA concentration.
 | ||
| Fig. 5 Required heat duty of the GA recovery process in (A) extractive distillation (case 1) and (B) pervaporation (case 2). Colored area indicates the portion of heat duty of each unit operation. As the feed concentration of GA increases, the net heat duty decreases. Arrow indicates the current condition used in Fig. 4B. | ||
Although the PV process showed a favorable net heat duty for the IPA antisolvent recovery and does not require any entrainer chemical, its comparison with EXD would need to consider the respective associated capital cost and operating cost. Moreover, the solvent recovery process options should be optimized based on either the minimum total annual cost method33 or with an optimized heat integration strategy. Future work will undertake a comparative techno-economic and life cycle impact analysis.
Discussion
The enthalpy and entropy of dissolution of KGA and GA
The enthalpy and entropy of dissolution are calculated here using the solubility of KGA and GA in solutions of identical solvent composition as a function of temperature. The solubility of KGA and GA, and related thermodynamic properties (enthalpy and entropy of dissolution) are important because they can be used for building a crystallization model and optimizing crystallization conditions in a large-scale process. Accordingly, using the solubility data obtained for each compound (Fig. 2B), the enthalpy and entropy of dissolution of both KGA and GA were calculated using the Van't Hoff equation.35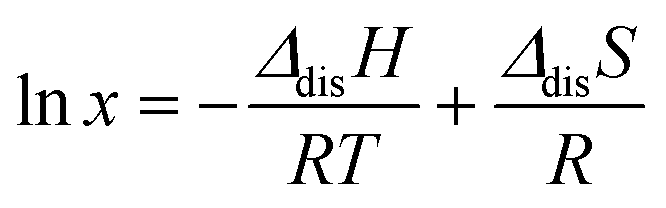 | (1) |
In eqn (1), x is the mole fraction of a compound in the solvent, ΔdisH and ΔdisS are the enthalpy and the entropy of dissolution, T is the absolute temperature, and R represents the ideal gas constant. The solubility of KGA or GA was measured by varying temperature to plot lnx versus 1/T, and the resulting values of enthalpy and entropy of dissolution were determined from the slope and the intercept, respectively.
Fig. 6 displays the Van't Hoff plot for KGA in a water/acetone mixture and GA in a water–IPA mixture, respectively. The antisolvent loading in each mixture is the same as used in each purification process. Table 3 provides the dissolution enthalpy and entropy of both KGA and GA calculated from eqn (1) using the linear fits within 95% confidence intervals in Fig. 6. The positive values of enthalpy for both indicate that the dissolution reaction of both compounds is endothermic in the experimental temperature range. The slope of GA solubility data yields a negative entropy of dissolution for GA. This could be because dissolved GA is in equilibrium with lactones, and they form dimers or organized structures that are represented by this value.
 | ||
| Fig. 6 Van't Hoff plot of (A) KGA in 25 wt% acetone solution and (B) GA in 87.5 wt% IPA solution. | ||
| Compound | Solvent | Δ dis H (kJ mol−1) | Δ dis S (J mol−1 K−1) |
|---|---|---|---|
| KGA | Acetone 24.7 wt% | 31.87 ± 0.22 | 35.67 ± 0.75 |
| GA | Isopropanol 87.5 wt% | 9.43 ± 0.23 | −14.12 ± 0.84 |
Scale up of the CEX process
In the above results section, we present process modeling to demonstrate the feasibility and energy input of the crystallization and solvent recycling operations. However, the CEX results were performed in batch column mode. To address the scalability of the CEX operation, we provide a discussion on scaling the system to a continuous operation using the results obtained from the batch experiments. In the single column experiments, we demonstrated the conversion of KGA to GA via a cation exchange process with the DOWEX G26 resin. In this CEX step, H+ ions in the solid phase resin were displaced by K+ ions in the mobile phase, converting KGA to GA. The second pH increase in Fig. 3 indicates the KGA frontal curve. Typically, the KGA frontal curve is broad and overlaid with the GA curve due to the mass transfer resistance such as film mass transfer, axial dispersion, and intraparticle diffusion.36 Since the presence of KGA in the eluent prevents clean GA crystallization, it is critical to collect the GA eluent before the KGA frontal curve breaks through. Thus, for a large-scale process, the design of the CEX process must consider the elution time of the mass transfer zone (MTZ) between GA and KGA. This can be modeled with the maximum loading volume (Vf,max) equation shown below.37 | (2) |
In eqn (2), CK+ is the concentration of K+ ion in a feed, VMTZ is the volume of the MTZ, qe is the resin capacity, Lc is the column length, Ac is the cross-sectional area, LMTZ is the length of MTZ.
Since the conversion of KGA to GA follows a displacement chromatography mechanism, LMTZ in eqn (2) can be theoretically predicted from its analytical solution (eqn (3)) assuming the column is sufficiently long and the film mass transfer effect is negligible.36,38
 | (3) |
In eqn (3), Eb is the axial dispersion coefficient, εb is the bed porosity, εp is the intraparticle porosity, Rp is the radius of resin particle, u0 is the linear velocity, Kse is the size exclusion factor, Dp is the intraparticle diffusion coefficient, α is the sorbent selectivity of K+ over H+, and θ is the cut-off value of a breakthrough curve.
Eqn (3) combined with eqn (2) represents the overall effect of system and operating parameters on the elution time for the length of MTZ (tMTZ). For example, increasing the flowrate (= εbu0Ac) or resins particle size (Rp) leads to an increased LMTZ so that Vf,max will be reduced. Thus, for scaling up a CEX process, eqn (2) and (3) are useful to calculate the maximum loading volume when operating conditions are changed on large scale. This calculation is important for proper equipment sizing and costing run in a single column mode.
Ideally, one can use multiple columns for a continuous process such as a carousel or periodic counter-current process, allowing full column utilization.39,40 In a continuous system, feed loading, washing, and regeneration steps occur simultaneously, which increases the yield and process productivity, generally by an order of magnitude.41 An example of a continuous CEX process for KGA conversion to GA is illustrated in Fig. 7. Since the feed loading time is critical in the process, eqn (2) and (3) are useful to determine the column switching time in a continuous CEX process. Since the mass transfer coefficients such as Eb and Dp are important to calculate LMTZ, those values were obtained from literature42 and verified with a rate model simulation (Fig. S10†). From simulation studies, the value of Dp was estimated as 5.6 × 10⁻⁴ cm2 min−1 (Fig. S10†). In order to determine the port switching time (tsw) of the illustrated process in Fig. 7, a simple way is to set tsw as the calculated maximum loading time for the given flowrate, feed concentration, and column size. Calculations that estimate a full scale continuous cation exchange process's parameters (including switch times and flowrates) are presented in the ESI section S5.†
 | ||
| Fig. 7 Example of a continuous CEX process consisting of feed loading, cleaning, regeneration, and washing steps. | ||
Comparison of this work to other glucarate isolation methods
In Table 4, the yields and purities of KGA and GA products from this study are compared with other representative methods reported in the literature. There are several different conversion methods to produce glucarate salts from glucose including; nitric acid oxidation,9,13 microorganisms (biocatalysis),20 catalytic oxidation,4,43 and electrochemical oxidation.8 Historically, nitric acid oxidation of glucose was the first approach developed to produce KGA but isolated crystal yields from this method are relatively low (41–43%), as shown in Table 4.9,13 Another oxidation method is the use of chlorine gas with a nitroxide catalyst (4-acetamido-TEMPO)44 wherein either pH adjustment or ethanol antisolvent precipitation methods were used to recover glucarate salts. Although it showed a high glucarate yield (70–85%, Table 4), the products were contaminated with byproducts (e.g. chloride salts and tartaric acid), and the use of toxic chemicals and an expensive catalyst limits a large-scale process.| Synthesis method | Final product | Separation method | Recovery yield [%] | Purity [%] | Ref. |
|---|---|---|---|---|---|
| N.D. = not determined. | |||||
| E. coli fermentation | KGA(s) | pH adjustment with acetone antisolvent | >99.9 | 97.7 | This work |
| Glucose oxidation using nitric acid | KGA(s) | pH adjustment | 41 | 99.2 | 13 |
| Glucose oxidation using nitric acid | KGA(s) | pH adjustment | 43 | N.D. | 9 |
| Glucose nitroxide-mediated oxidation with chlorine gas | (1) KGA(s) | (1) pH adjustment | (1) 70 | (1) 90.9 | 44 |
| (2) NaGA(s) | (2) Ethanol antisolvent | (2) 85 | (2) 90 | ||
| E. coli fermentation | GA(s) | IPA antisolvent crystallization with azeotropic drying | 71.1 | 98.3 | This work |
| Mock solution of KGA | GA(s) | Acetonitrile antisolvent crystallization with azeotropic drying | 98.7 | 99.9 | 24 |
Biocatalysis methods using engineered microorganisms usually exhibit high glucose conversions (>99%) and selectivities to glucarate salts but suffer from lower yields (48%) and low titers (<10 g L−1).20 Due to the high selectivity of biocatalysis methods the resulting broth is more amenable to achieving high recovery yield and purity in the downstream separation train. In this work, the pH adjustment method with acetone addition resulted in a KGA recovery yield of >99.9% at a purity of >97.7% (Table 4). To our knowledge, this is the highest reported recovery yield of KGA from a reaction solution.
Catalytic oxidation and electrochemical oxidation methods have also been widely studied and achieved relatively higher conversions (>98%), but their reported yields vary (40–84%).4,8,43 Additionally, these methods were done at a small scale of less than 100 mL, and the resulting glucarate concentration in the reaction solution ranges from 1.8 to 30.8 g L−1, which is lower than that of our biological approach. It should be noted that most of the approaches, except nitric acid or nitroxide oxidation, did not actually isolate products but reported the recovery yields and purities of glucarate salts or GA based on a final product concentration in solution and therefore could not be included in Table 4 for comparison. Furthermore, the catalytic oxidation methods were reported for the conversion of GA from glucose under high temperatures (80–100 °C) and pressures (13.2–40 bar).10,12 In these conditions, GA was readily lactonized, but the product speciation was not reported.
Due to the difficulty of isolating purified GA diacid crystals, recovery yields and purities of the diacid have been rarely reported. One notable approach that reported the isolation of purified GA is the work of Armstrong et al.21,24 In that work, acetonitrile was used to form an azeotrope with water to recover GA from a KGA mock solution at recovery yields and purities of 98.7% and 99.9% respectively (Table 4).24 To our knowledge, the work reported here is the first instance of isolated GA diacid crystals produced from real fermentation broth rather than from mock solutions. Our IPA antisolvent and azeotropic drying method recovered GA diacid crystals from fermentation broth at recovery yields of 71.1% and a purity of 98.3%. The recovery yield and purity are lower than that reported by Armstrong et al. but could be the result of working with actual fermentation-derived material compared to mock solutions. Given the high recovery yields and purities of KGA and GA from our method using real fermentation broth, we hypothesize that our procedure can be broadly applied to solutions generated from other abiotic conversion technologies, but with potential additional considerations due to disparate impurities that are present in those solutions.
Conclusion
Glucaric acid is regarded as a top-value added biomass-derived compound,1 however, the free acid form of GA is still not available in commercial markets due to difficulties in isolating the free acid form. In this work, a downstream process was developed for producing and isolating pure KGA and GA crystals from fermentation broth using GRAS solvents. In the proposed process, antisolvent crystallization using acetone was applied to first recover KGA from the broth at 100% recovery yields and high purity (95.6%). To isolate pure crystalline GA, the solid KGA was acidified via a CEX process, and then the crystallization and isolation of GA were conducted using an IPA/water system resulting in a GA recovery yield of 71% with 98.3% purity. To our knowledge, this is the largest quantity of isolated GA product (>2.2 g, Fig. S4†) reported to date. Furthermore, the process modeling presented here provides a path towards industrial scale implementation. This modeling found the energy demand was primarily from the solvent recycling processes. A heat integration process will further reduce the energy footprint of the system by an estimated 80%.45 Lastly, the developed separation method and the reported physicochemical properties of GA could be useful to the separation of other highly oxygenated acids from both biotic and abiotic processes.Conflicts of interest
H. C., N. E. S., and E. M. K. are inventors on a patent application submitted by the Alliance for Sustainable Energy; “Process for the recovery of monopotassium glucarate and glucaric acid” (U.S. Patent App. No. 63/273,234 filed on October 22, 2021).Acknowledgements
The research reported in this paper was sponsored by the U.S. Department of Energy (DOE), Energy Efficiency and Renewable Energy Office, Bioenergy Technologies Office (BETO) under the BETO Bioprocessing Separations Consortium via Contract No. DE-AC36-08GO28308 with the National Renewable Energy Laboratory. The authors gratefully acknowledge the support of Nichole Fitzgerald and Gayle Bentley at BETO. We thank Lauren Valentino at Argonne National Laboratory for her leadership within the Separations Consortium. We also thank Kalion, Inc. for providing the fermentation broth and its compositional data. We thank Gabriella Lahti for conducting XRD analysis and Hanna Monroe for developing parts of the Aspen Plus model. The views expressed in the article do not necessarily represent the views of the U.S. Department of Energy or the U.S. Government. The U.S. Government retains and the publisher, by accepting the article for publication, acknowledges that the U.S. Government retains a nonexclusive, paid-up, irrevocable, worldwide license to publish or reproduce the published form of this work or allow others to do so, for U.S. Government purposes.References
- T. Werpy and G. Petersen, Off. Sci. Technol. Inf., 2004, 69 Search PubMed.
- D. E. Kiely, L. Chen and T. H. Lin, J. Am. Chem. Soc., 1994, 116, 571–578 CrossRef CAS.
- S. Van De Vyver and Y. Román-Leshkov, Catal. Sci. Technol., 2013, 3, 1465–1479 RSC.
- W. Deng, L. Yan, B. Wang, Q. Zhang, H. Song, S. Wang, Q. Zhang and Y. Wang, Angew. Chem., Int. Ed., 2021, 60, 4712–4719 CrossRef CAS PubMed.
- R. A. Pérez-Camargo, B. Fernández-D'Arlas, D. Cavallo, T. Debuissy, E. Pollet, L. Avérous and A. J. Müller, Macromolecules, 2017, 50, 597–608 CrossRef.
- Q. Xing, D. Ruch, P. Dubois, L. Wu and W. J. Wang, ACS Sustainable Chem. Eng., 2017, 5, 10342–10351 CrossRef CAS.
- C. Lu and E. Ford, Macromol. Mater. Eng., 2018, 303, 1–16 Search PubMed.
- W. J. Liu, Z. Xu, D. Zhao, X. Q. Pan, H. C. Li, X. Hu, Z. Y. Fan, W. K. Wang, G. H. Zhao, S. Jin, G. W. Huber and H. Q. Yu, Nat. Commun., 2020, 11, 1–11 Search PubMed.
- T. N. Smith, K. Hash, C. L. Davey, H. Mills, H. Williams and D. E. Kiely, Carbohydr. Res., 2012, 350, 6–13 CrossRef CAS PubMed.
- J. Lee, B. Saha and D. G. Vlachos, Green Chem., 2016, 18, 3815–3822 RSC.
- X. Jin, M. Zhao, J. Shen, W. Yan, L. He, P. S. Thapa, S. Ren, B. Subramaniam and R. V. Chaudhari, J. Catal., 2015, 330, 323–329 CrossRef CAS.
- E. Derrien, M. Mounguengui-Diallo, N. Perret, P. Marion, C. Pinel and M. Besson, Ind. Eng. Chem. Res., 2017, 56, 13175–13189 CrossRef CAS.
- C. L. Mehltretter and C. E. Rist, J. Agric. Food Chem., 1953, 1, 779–783 CrossRef CAS.
- R. A. Sheldon and J. M. Woodley, Chem. Rev., 2018, 118, 801–838 CrossRef CAS PubMed.
- S. Verhoef, N. Gao, H. J. Ruijssenaars and J. H. De Winde, New Biotechnol., 2014, 31, 114–119 CrossRef CAS PubMed.
- Y. H. Weng, H. J. Wei, T. Y. Tsai, T. H. Lin, T. Y. Wei, G. L. Guo and C. P. Huang, Bioresour. Technol., 2010, 101, 4889–4894 CrossRef CAS PubMed.
- J. Chapman, A. E. Ismail and C. Z. Dinu, Catalysts, 2018, 8, 20–29 CrossRef.
- D. J. Timson, Fermentation, 2019, 5, 1–9 CrossRef.
- I. M. B. Reizman, A. R. Stenger, C. R. Reisch, A. Gupta, N. C. Connors and K. L. J. Prather, Metab. Eng. Commun., 2015, 2, 109–116 CrossRef PubMed.
- H. H. Su, F. Peng, X. Y. Ou, Y. J. Zeng, M. H. Zong and W. Y. Lou, New Biotechnol., 2020, 59, 51–58 CrossRef CAS PubMed.
- V. B. Thaore, R. D. Armstrong, G. J. Hutchings, D. W. Knight, D. Chadwick and N. Shah, Chem. Eng. Res. Des., 2020, 153, 337–349 CrossRef CAS.
- T. S. Moon, S. H. Yoon, A. M. Lanza, J. D. Roy-Mayhew and K. L. Jones Prather, Appl. Environ. Microbiol., 2009, 75, 589–595 CrossRef CAS PubMed.
- J. M. Brown, M. Manley-Harris, R. J. Field and D. E. Kiely, J. Carbohydr. Chem., 2007, 26, 455–467 CrossRef CAS.
- R. D. Armstrong, B. M. Kariuki, D. W. Knight and G. J. Hutchings, Eur. J. Org. Chem., 2017, 2017, 6811–6814 CrossRef CAS PubMed.
- A. A. Lonare and S. R. Patel, Int. J. Chem. Eng. Appl., 2013, 4, 337–341 CAS.
- P. Pal, R. Kumar and S. Banerjee, Front. Chem. Sci. Eng., 2019, 13, 152–163 CrossRef CAS.
- R. Wittig, J. Lohmann and J. Gmehling, Ind. Eng. Chem. Res., 2003, 42, 183–188 CrossRef CAS.
- R. M. Smith and A. E. Martell, Critical stability constants, Springer, New York, 1989, vol. 6, pp. 299–359 Search PubMed.
- Lenntech, https://www.lenntech.com/Data-sheets/Dowex-Ion-Exchange-Resins-Using-Selectivity-Coefficients-L.pdf (Lastly accessed on November, 2021).
- T. T. Denton, K. I. Hardcastle, M. K. Dowd and D. E. Kiely, Carbohydr. Res., 2011, 346, 2551–2557 CrossRef CAS PubMed.
- R. D. Armstrong, J. Hirayama, D. W. Knight and G. J. Hutchings, ACS Catal., 2019, 9, 325–335 CrossRef CAS.
- S. Arifin and I. L. Chien, Ind. Eng. Chem. Res., 2008, 47, 790–803 CrossRef CAS.
- V. Van Hoof, L. Van Den Abeele, A. Buekenhoudt, C. Dotremont and R. Leysen, Sep. Purif. Technol., 2004, 37, 33–49 CrossRef CAS.
- Q. Yang, M. Sheng, X. Li, C. Tucker, S. Vásquez Céspedes, N. J. Webb, G. T. Whiteker and J. Yu, Org. Process Res. Dev., 2020, 24, 916–939 CrossRef CAS.
- M. Tao, Z. Wang, J. Gong, H. Hao and J. Wang, Ind. Eng. Chem. Res., 2013, 52, 3036–3041 CrossRef CAS.
- H. Choi, D. Harvey, Y. Ding and N. L. Wang, J. Chromatogr. A, 2018, 1563, 47–61 CrossRef CAS PubMed.
- L. Ling, L.-W. Kao and N.-H. L. Wang, J. Chromatogr. A, 2014, 1355, 86–99 CrossRef CAS PubMed.
- J. Zhu and G. Guiochon, J. Chromatogr. A, 1994, 659, 15–25 CrossRef CAS.
- B. J. Hritzko, D. D. Walker and N.-H. L. Wang, AIChE J., 2000, 46, 552–564 CrossRef CAS.
- J. Pollock, G. Bolton, J. Coffman, S. V. Ho, D. G. Bracewell and S. S. Farid, J. Chromatogr. A, 2013, 1284, 17–27 CrossRef CAS PubMed.
- C. A. M. Cristancho and A. Seidel-Morgenstern, J. Chromatogr. A, 2016, 1434, 29–38 CrossRef PubMed.
- M. V. J. Ernest, R. D. Whitley, Z. Ma and N.-H. L. Wang, Ind. Eng. Chem. Res., 1997, 36, 212–226 CrossRef CAS.
- X. Jin, M. Zhao, M. Vora, J. Shen, C. Zeng, W. Yan, P. S. Thapa, B. Subramaniam and R. V. Chaudhari, Ind. Eng. Chem. Res., 2016, 55, 2932–2945 CrossRef CAS.
- N. Merbouh, J. M. Bobbitt and C. Brueckner, J. Carbohydr. Chem., 2002, 21, 65–77 CrossRef CAS.
- P. O. Saboe, L. P. Manker, W. E. Michener, D. J. Peterson, D. G. Brandner, S. P. Deutch, M. Kumar, R. M. Cywar, G. T. Beckham and E. M. Karp, Green Chem., 2018, 20, 1791–1804 RSC.
Footnotes |
| † Electronic supplementary information (ESI) available. See DOI: 10.1039/d1gc03984a |
| ‡ Current address: Department of Chemistry, University of California, Berkeley, CA 94720. |
| § Current address: Humm Kombucha, 20720 NE Brinson Blvd., Bend, OR 97701. |
| ¶ Current address: LanzaTech, 8045 Lamon Ave., Suite 400, Skokie, IL 60077. |
| This journal is © The Royal Society of Chemistry 2022 |