
 Open Access Article
 This Open Access Article is licensed under a Creative Commons Attribution-Non Commercial 3.0 Unported Licence
Synthesis, characterisation and carbon dioxide capture capacities of hierarchically porous Starbons®†
Han
Li
 a,
Cheng
Li
b,
Vitaliy L.
Budarin
a,
James H.
Clark
*a,
Michael
North
*a,
Jinxiu
Wang
b and
Xiao
Wu
a
a,
Cheng
Li
b,
Vitaliy L.
Budarin
a,
James H.
Clark
*a,
Michael
North
*a,
Jinxiu
Wang
b and
Xiao
Wu
a
aGreen Chemistry Centre of Excellence, Department of Chemistry, University of York, York, Y10 5DD, UK. E-mail: michael.north@york.ac.uk; james.clark@york.ac.uk
bLaboratory of Advanced Materials, Department of Chemistry, State Key Laboratory of Molecular Engineering of Polymers, Collaborative Innovation Centre of Chemistry for Energy Materials, Fudan University, Shanghai, 200433, P.R. China
First published on 28th January 2022
Abstract
The synthesis of hierarchically porous Starbon® based materials from initially highly mesoporous Starbons® is reported. Mesoporous starbons® are prepared from three different biopolymers: starch, alginic acid and pectin and each is then activated using three different activating agents: potassium hydroxide, carbon dioxide and oxygen to give a set of hierarchically porous Starbons® which retain the mesopores of the precursor whilst becoming predominantly microporous. The hierarchically porous materials are characterised using nitrogen porosimetry, CHN analysis, ICP-OES, XPS, SEM and TEM imaging. It is shown that the hierarchically porous Starbons® have higher carbon dioxide adsorption capacities than either the mesoporous Starbon® precursors or conventional microporous activated carbon. The materials show selectivities of up to 64 for adsorption of carbon dioxide versus nitrogen and only lose only 3–7% of their carbon dioxide adsorption capacities when the carbon dioxide is saturated with water. The carbon dioxide capture capacity of all 50 Starbon® materials showed a strong and positive linear correlation with the product of the materials ultramicropore surface area and ratio of ultramicropore (0.4–0.7 nm) volume to total pore volume.
Introduction
Starbons® are commercially available, sustainably sourced, highly mesoporous carbonaceous materials1 prepared from waste biomass derived polysaccharides without the use of a template. Thus, Clark and co-workers initially demonstrated that starch (extractable from potato peel) could be converted into Starbons® by a three-step process: gelatinisation and retrogradation in water;2 drying to form a mesoporous aerogel and carbonisation at 300–1200 °C.3 Other helix-forming polysaccharides with flexible glycosidic bond linkages4 such as alginic acid5 (from seaweed) and pectin6 (from orange peel), were subsequently transformed into Starbons®. The preparation of Starbons® has since been optimised to provide a green and inexpensive synthesis of these versatile and sustainable materials. In particular, the drying step which is critical to maintain the pore structure has evolved from: solvent exchange followed by oven drying3,7 to solvent exchange followed by supercritical carbon dioxide drying5,8 to a freeze-drying based method.9The chemical groups present in Starbons® are largely determined by the carbonation temperature.3 Carbonisation at 300 °C retains oxygen containing functionalities such as alcohols and ketones. By 600 °C, monocyclic aromatic rings predominate and at higher temperatures fused polycyclic aromatics are formed. The polysaccharide precursor influences the morphology10 of the Starbon® and also the pore size and shape.11 Alginic acid and pectin derived Starbons® have larger mesopore volumes compared to starch derived Starbon®.1,5
Starbons® have already found numerous applications. They can act as supports for catalytically active metal nanoparticles12–14 and can be sulphonated to provide solid, strong acid catalysts.13,15,16 Magnetically separable magnetite-Starbon® nanohybrid catalysts have also been prepared.17 Titanium dioxide supported on Starbon® was found to have higher photocatalytic activity for the degradation of phenol in water than use of either activated carbon or graphene oxide as support.18 A Starbon®–graphite composite showed enhanced stability, conductivity and capacitance retention when used as a supercapacitor electrode.19 Starbon® has been used both as a carbon additive in lithium-ion battery electrodes20 and as the electrode in its own right.21 Starbons® make excellent adsorbents for various solids and liquids, giving them applications in the separation of sugar analytes,5,22 recovery of phenolic compounds,10,23 removal of dyes11 and detergent residues24 from wastewater, adsorption and release of plant growth promoters25 and separation of critical metal ions from mixtures of metals.8 Established wisdom is that adsorption of gases occurs best on microporous solids with pore diameters less than 0.8 nm26,27 Nevertheless, Starbons® were found to physisorb up to 50% more carbon dioxide and to show 3–4 times better selectivity for carbon dioxide over nitrogen than microporous activated carbon.28 They were subsequently shown to also adsorb ammonia, hydrogen sulphide and sulphur dioxide more effectively than microporous carbon.29
The above applications all benefit from the favourable mass-transfer rates associated with highly mesoporous structures. However, for some of these applications, the higher surface area associated with a more microporous structure could be beneficial. Therefore, in this paper, the activation of Starbons® to give hierarchically porous materials possessing both micropores and mesopores is reported. The hierarchically porous materials are also shown to have better carbon dioxide adsorption capacities than either microporous activated carbon or mesoporous unactivated Starbons®, giving them the potential to be utilised on a large scale for post-combustion carbon capture and utilisation or storage30 which involves the separation of carbon dioxide from (mostly) nitrogen in the flue-gas of fossil fuelled power stations.
Results and discussion
Synthesis of hierarchically porous Starbons®
In this work, three different methods have been investigated for the activation of Starbons® derived from three different polysacharaides: starch, alginic acid and pectin. Potassium hydroxide is the most widely used activating agent for carbon based materials31 and can produce activated carbons with very large surface areas (up to 4000 m2 g−1), high pore volumes (up to 2.7 cm3 g−1) and tuneable and narrow pore size distributions. However, use of excess potassium hydroxide is less than desirable from a green chemistry perspective (though in principle it could be recycled).32 Therefore, the use of carbon dioxide33 and oxygen34 as activating agents were also investigated. Thus, a mesoporous aerogel obtained from one of the three biopolymers9 was converted first into a mesoporous Starbon® and then into an activated Starbon® as illustrated in Fig. 1. Unactivated Starbons® are referred to as Xn where X is S, A, or P representing the precursor (starch, alginic acid or pectin respectively) and n is the temperature (in °C) at which the material was carbonised (300 or 800 °C). Potassium hydroxide activated materials were prepared from X300's and are referred to as XnKm where X is S, A or P; n is the activation temperature (600–1000 °C) and m is the mass of potassium hydroxide used relative to the mass of X300 (1–5). X300's were selected as substrates for potassium hydroxide activation as they retain oxygen-containing functional groups which facilitate potassium hydroxide activation.35 | ||
| Fig. 1 Routes used to prepare activated Starbons®. | ||
Carbon dioxide and oxygen activated materials were prepared from X800's since Starbons® which have been carbonised at 800 °C retain far fewer oxygen containing functional groups than Starbons® prepared at 300 °C. Hence, use of X800's as the activation precursor allowed the activation to be better controlled and monitored by TGA-IR. Activation was carried out under a flow of carbon dioxide or diluted oxygen gas, increasing the sample temperature from ambient to the desired activation temperature at 10 °C per minute and then holding at that temperature for a period of time. Carbon dioxide activated Starbons® are then classified as XnCm where X is S, A or P; n is the maximum activation temperature (700–1000 °C) and m is the length of time (0–120 minutes) that the sample was held at the maximum activation temperature. Carbon dioxide activation was found to occur only at temperatures above 600 °C. For the synthesis of S900C15, the carbon dioxide flow rate (25–100 mL min−1) had no effect on the rate of activation, though the BET surface area and microporosity of the resulting activated Starbon® increased slightly as the flow rate increased (data in ESI†). The difference between flow rates of 50 and 100 mL min−1 was negligible however, so the flow rate was fixed at 50 mL min−1. The nature of the polysaccharide precursor did affect the rate of reaction of the X800 with carbon dioxide. P800 was the most reactive, followed by A800 and S800 was the least reactive precursor. This is shown in the results for samples activated by carbon dioxide at 900 °C where S800 shows only a 20% weight loss on being converted into S900C15; A800 shows a 68% weight loss on being converted into A900C10 and P800 shows a 72% weight loss on being converted into P900C0 (data in ESI†).
Oxygen is a much more reactive activating agent than carbon dioxide and reacts exothermically with carbon.36 Therefore, the activation of X800's with oxygen was carried out using a flow of just 2% oxygen in nitrogen and could be achieved at lower temperatures (270 °C for A800 and P800 and 400 °C for S800) than the carbon dioxide activations. Oxygen activated Starbons® are classified as XnOm where X is S, A or P; n is the maximum activation temperature (400–800 °C) and m is the length of time (0–60 minutes) that the sample was held at the maximum temperature. TGA-IR analysis showed that both carbon dioxide and carbon monoxide were formed as gaseous products (C + O2 → CO2; 2C + O2 → 2CO). When S800 was heated to 750 °C under a flow of nitrogen, only 5% mass loss occurred compared to the 25% mass loss seen during the formation of S750O0. The order of reactivity of the Starbon® precursors was again S800 least reactive and P800 most reactive (data in ESI†).
Characterisation of hierarchically porous Starbons®
All of the Starbon® materials were characterised by nitrogen porosimetry at −196 °C to determine their pore structures and BET surface areas. Adsorption isotherms and pore width distribution plots are given in the ESI† and key data are presented in Table 1. Entries 1–6 show that the unactivated Starbon® precursors are all predominantly mesoporous materials since their micropore volumes account for at most 40.7% of the total pore volume. On increasing the carbonisation temperature from 300 to 800 °C the BET surface areas increase from 65–305 m2 g−1 to 262–619 m2 g−1 and the microporosity increases from 1.3–37.1% to 16.0–40.7% of the total pore volume. The carbonisation was carried out in a vacuum furnace,3–16 at a pressure of less than 20 mbar. This increase in surface area and microporosity can be attributed to partial activation caused by residual oxygen36 present during the carbonisation at 800 °C and to steam activation37 due to water formed by dehydration of alcohols within the Starbon® material. Entries 7–23 show that the potassium hydroxide activated Starbons® all have higher BET surface areas (687–2452 m2 g−1) than the unactivated Starbons®. The adsorption isotherms of these materials indicated that they had become predominantly microporous. To quantify this change a model to use to extract pore distribution information from the isotherms of these structurally complex materials had to be validated. Therefore, the use of t-plot,38 HK,39 DFT40 and NLDFT41 models to analyse the micropore volumes; BJH,42 DFT and NLDFT models to analyse the mesopore volumes and the amount of nitrogen adsorbed at P/P0 = 0.99; and HK(P/P0 = 0.99), DFT and NLDFT models to analyse the total pore volumes was investigated. The various models were found to give consistent results and to show the same trend from sample to sample (data in ESI†), so the well-established BJH model was adopted to calculate the mesopore volumes and the HK model (developed to characterise activated carbons39) was used to calculate the micropore and total pore volumes. Entries 7–11 and 14–18 show the effect of using increasing mass equivalents of potassium hydroxide for the activation of S300 and A300 at 800 °C. The BET surface area and micropore volume both increase from S800K1 to S800K5 and from A800K1 to A800K5. Notably, even for S800K1, the BET surface area and micropore volume are about double the values measured for S800 (entry 4) and for A800K1, the corresponding values are more than three times those measured for A800 (entry 5). Over 40% of the micropore volume introduced into these materials by treatment with potassium hydroxide is associated with ultramicropores (diameters less than 0.7 nm).43 The mesopore volumes show less variation. The materials activated with one equivalent of potassium hydroxide possess higher mesopore volumes than the corresponding unactivated materials (compare entries 4 and 7 and entries 5 and 14), but the mesopore volume then drops rapidly to below 0.2 cm3 g−1 for materials activated with 2–5 equivalents of potassium hydroxide (entries 8–11 and 15–18). The total pore volumes for the potassium hydroxide activated materials are mostly around 1 cm3 g−1. As a result, the microporosity of the starch derived materials increases from 41% for S800 to 45% for S800K1, then to 80–83% for S800K2 and S800K3 and finally to over 92% for S800K4 and S800K5. Ultramicroporosity contributes 30–66% of the total porosity of S800K1–K5. Correspondingly, for the alginic acid derived materials the microporosity increases from 16% for A800 to 35% for S800K1, then to 79–88% for A800K2–K4 and finally to over 92% for A800K5. Ultramicroporosity contributes 22–67% of the total porosity of A800K1–K5.| Entry | Material | S BET (m2 g−1) |
V
micro![[thin space (1/6-em)]](https://www.rsc.org/images/entities/char_2009.gif) ,
(cm3 g−1)
,
(cm3 g−1) |
V
ultramicro
(cm3 g−1) |
V
meso
(cm3 g−1) |
V
total
(cm3 g−1) |
Microporee (%) |
Ultramicropore (%) |
|---|---|---|---|---|---|---|---|---|
| a Calculated based on the HK model. b Includes the ultramicropore volume. c Calculated based on the BJH model. d Calculated based on the HK model at P/P0 = 0.99. e Includes the ultramicropore %. f These are t-plot values as the microporosity was too low to analyse by the HK method. | ||||||||
| 1 | S300 | 305 | 0.13 | — | 0.22 | 0.35 | 37.1 | — |
| 2 | A300 | 168 | 0.01f | — | 0.76 | 0.77 | 1.3 | — |
| 3 | P300 | 65 | 0.01f | — | 0.37 | 0.38 | 2.6 | — |
| 4 | S800 | 619 | 0.24 | 0.19 | 0.35 | 0.59 | 40.7 | 32.2 |
| 5 | A800 | 322 | 0.13 | 0.08 | 0.71 | 0.81 | 16.0 | 9.9 |
| 6 | P800 | 262 | 0.11 | 0.07 | 0.43 | 0.54 | 20.4 | 13.0 |
| 7 | S800K1 | 1214 | 0.48 | 0.32 | 0.58 | 1.06 | 45.3 | 30.2 |
| 8 | S800K2 | 1294 | 0.49 | 0.39 | 0.10 | 0.59 | 83.1 | 66.1 |
| 9 | S800K3 | 1633 | 0.62 | 0.45 | 0.14 | 0.77 | 80.5 | 58.4 |
| 10 | S800K4 | 2299 | 0.91 | 0.46 | 0.07 | 0.98 | 92.9 | 46.9 |
| 11 | S800K5 | 2452 | 1.00 | 0.57 | 0.09 | 1.09 | 92.7 | 52.3 |
| 12 | S600K4 | 1890 | 0.73 | 0.50 | 0.13 | 0.84 | 86.9 | 59.5 |
| 13 | S1000K4 | 1503 | 0.62 | 0.28 | 0.23 | 0.84 | 73.8 | 33.3 |
| 14 | A800K1 | 1117 | 0.46 | 0.29 | 0.82 | 1.31 | 35.1 | 22.1 |
| 15 | A800K2 | 1392 | 0.53 | 0.43 | 0.16 | 0.67 | 79.1 | 64.2 |
| 16 | A800K3 | 1952 | 0.75 | 0.57 | 0.09 | 0.85 | 88.2 | 67.1 |
| 17 | A800K4 | 2419 | 0.95 | 0.39 | 0.18 | 1.15 | 82.6 | 33.9 |
| 18 | A800K5 | 2414 | 1.01 | 0.55 | 0.10 | 1.09 | 92.7 | 50.5 |
| 19 | A600K2 | 687 | 0.27 | 0.22 | 0.08 | 0.36 | 75.0 | 61.1 |
| 20 | A1000K2 | 1233 | 0.49 | 0.33 | 0.30 | 0.80 | 61.3 | 41.3 |
| 21 | P800K2 | 1895 | 0.77 | 0.52 | 0.18 | 0.97 | 79.4 | 53.6 |
| 22 | P800K3 | 1747 | 0.73 | 0.47 | 0.13 | 0.86 | 84.9 | 54.7 |
| 23 | P800K5 | 1954 | 0.82 | 0.43 | 0.20 | 1.02 | 80.4 | 42.2 |
| 24 | S800C15 | 529 | 0.21 | 0.17 | 0.37 | 0.58 | 36.2 | 29.3 |
| 25 | S850C15 | 637 | 0.26 | 0.20 | 0.31 | 0.60 | 43.3 | 33.3 |
| 26 | S900C15 | 983 | 0.39 | 0.31 | 0.38 | 0.77 | 50.6 | 40.3 |
| 27 | S950C15 | 930 | 0.38 | 0.28 | 0.35 | 0.73 | 52.1 | 38.4 |
| 28 | S1000C15 | 1535 | 0.62 | 0.42 | 0.52 | 1.16 | 53.4 | 36.2 |
| 29 | S900C30 | 1119 | 0.45 | 0.34 | 0.50 | 0.98 | 45.9 | 34.7 |
| 30 | S900C60 | 1097 | 0.44 | 0.33 | 0.40 | 0.89 | 49.4 | 37.1 |
| 31 | S900C90 | 1475 | 0.59 | 0.43 | 0.45 | 1.05 | 56.2 | 41.0 |
| 32 | S900C120 | 1914 | 0.77 | 0.52 | 0.71 | 1.49 | 51.7 | 34.9 |
| 33 | S950C30 | 1618 | 0.64 | 0.46 | 0.27 | 0.94 | 68.1 | 48.9 |
| 34 | S950C60 | 2180 | 0.89 | 0.53 | 0.41 | 1.32 | 67.4 | 40.2 |
| 35 | S950C90 | 2457 | 1.04 | 0.56 | 0.59 | 1.64 | 63.4 | 34.1 |
| 36 | S950C120 | 2733 | 1.16 | 0.56 | 0.96 | 2.09 | 55.5 | 26.8 |
| 37 | A750C45 | 738 | 0.31 | 0.21 | 0.68 | 0.99 | 31.3 | 21.2 |
| 38 | A750C60 | 756 | 0.32 | 0.21 | 0.76 | 1.09 | 29.4 | 19.3 |
| 39 | A750C90 | 762 | 0.32 | 0.21 | 0.74 | 1.05 | 30.5 | 20.0 |
| 40 | A900C0 | 822 | 0.35 | 0.22 | 0.86 | 1.18 | 29.7 | 18.6 |
| 41 | A900C10 | 868 | 0.38 | 0.21 | 0.98 | 1.33 | 28.6 | 15.8 |
| 42 | P700C50 | 734 | 0.31 | 0.21 | 0.47 | 0.78 | 39.7 | 26.9 |
| 43 | P900C0 | 946 | 0.40 | 0.22 | 0.54 | 0.93 | 43.0 | 23.7 |
| 44 | S700O0 | 897 | 0.35 | 0.27 | 0.14 | 0.50 | 70.0 | 54.0 |
| 45 | S750O0 | 1100 | 0.43 | 0.33 | 0.14 | 0.58 | 74.1 | 56.9 |
| 46 | S800O0 | 935 | 0.37 | 0.28 | 0.20 | 0.57 | 64.9 | 49.1 |
| 47 | S750O40 | 889 | 0.35 | 0.27 | 0.09 | 0.45 | 77.8 | 60.0 |
| 48 | S750O56 | 777 | 0.31 | 0.23 | 0.15 | 0.46 | 67.4 | 50.0 |
| 49 | A500O30 | 640 | 0.27 | 0.18 | 0.70 | 0.97 | 27.8 | 18.6 |
| 50 | A500O60 | 647 | 0.27 | 0.19 | 0.66 | 0.96 | 28.1 | 19.8 |
| 51 | A750O0 | 629 | 0.26 | 0.17 | 0.67 | 0.94 | 27.7 | 18.1 |
| 52 | P400O50 | 385 | 0.16 | 0.11 | 0.44 | 0.60 | 26.7 | 18.3 |
| 53 | P500O30 | 361 | 0.15 | 0.10 | 0.32 | 0.49 | 30.6 | 20.4 |
| 54 | P750O0 | 550 | 0.23 | 0.16 | 0.47 | 0.71 | 32.4 | 22.5 |
The above results suggested that one mass equivalent of potassium hydroxide was not enough to transform mesoporous Starbons® into mostly microporous materials and that use of four or five mass equivalents of potassium hydroxide would introduce similar micropore volumes. Therefore, for pectin derived Starbons®, only P800K2, P800K3 and P800K5 were prepared (entries 21–23). In contrast to the starch and alginic acid derived materials, there was very little variation between these three activated Starbons®. They all had BET surface areas of 1747–1954 m2 g−1, micropore volumes of 0.7–0.8 cm3 g−1 of which the volume due to ultramicropores was 0.4–0.5 cm3 g−1, mesopore volumes of 0.1–0.2 cm3 g−1 and total pore volumes of 0.9–1.0 cm3 g−1. As a result, these materials were all 79–85% microporous with ultramicropores contributing 42–55% of the microporosity.
Four additional potassium hydroxide activated samples were prepared to investigate the effect of activation temperature in the range of 600–1000 °C. For starch derived materials, this was carried out using four mass equivalents of potassium hydroxide and the results (entries 10, 12 and 13) showed that activation temperatures of 600 or 1000 °C gave materials (S600K4 and S1000K4) with lower BET surface areas and lower microporosities than material activated at 800 °C (S800K4). Exactly the same trend was observed for alginic acid derived activated Starbons® using two mass equivalents of potassium hydroxide to give A600K2, A800K2 and A1000K2 (entries 15, 19 and 20). This trend can be understood on the basis that at 600 °C, less activation occurs than at 800 °C, whilst at 1000 °C, the potassium hydroxide is so reactive that some of the induced micropores are further expanded to become mesopores. Consistent with this, the S1000K4 and A1000K2 materials have lower ultramicropore volumes than S800K4 and A800K2, again suggesting that at the highest temperature, the ultramicropores initially introduced have been further enlarged out of the ultramicropore region.
Entries 24–43 of Table 1 show the results obtained for carbon dioxide activation of Starbons®. Entries 24–28 indicate the effect of activation temperature on S800. At 800 °C (entry 24), no significant activation occurs and S800C15 had comparable BET surface area and porosity to S800. As the activation temperature increases from 850 to 1000 °C (entries 25–28) the BET surface area and micropore volume steadily increase to values 2.5 times those of S800 (entry 4). Unlike the potassium hydroxide activated samples (entries 7–23) where a substantial decrease in the mesopore volume was observed, the carbon dioxide activated samples retain the mesoporosity present in S800 to give materials in which the micropore volume accounts for just 43–54% of the total porosity. Entries 26, 29–32 and entries 27, 33–36 show the effect of increasing the activation time with the temperature fixed at 900 or 950 °C respectively. In both cases, the BET surface area, micropore volume and mesopore volume all increase as the activation time increases from 15 to 120 minutes. S950C120 has a BET surface area of 2733 m2 g−1 and a micropore volume of 1.16 cm3 g−1, values which exceed those of any of the other samples in Table 1. For these samples, the micropore volume accounts for 46–68% of the total pore volume. The ultramicropore volumes of these materials are up to 0.56 cm3 g−1 (entries 35 and 36), values which are comparable to the highest ultramicropore volumes seen for the potassium hydroxide activated materials (entries 11, 16 and 18). A800 (entries 37–41) and P800 (entries 42 and 43) were activated with carbon dioxide at lower temperatures (700–900 °C) than S800, but gave activated materials with much lower BET surface areas (up to 946 m2 g−1). These materials also had lower micropore volumes (0.31–0.40 cm3 g−1) than the S800 activated samples (entries 24–36), though this still represents a 2.4–3.6 fold increase on the micropore volumes of the A800 and P800 precursors (entries 5 and 6). The mesopore volumes also show a small increase compared to the unactivated precursors so that for A800 derived, carbon dioxide activated materials, the micropore volume is 29–31% of the total pore volume and for P800 derived materials it is 40–43% of the total pore volume.
Oxygen activation results are shown in entries 44–54 of Table 1. For activation of S800, temperatures of 700–800 °C were investigated (entries 44–46) and the BET surface area, micropore volume, ultramicropore volume and total pore volume were all maximised at 750 °C to give a material in which the micropore volume was 74% of the total pore volume. Extending the activation time at 750 °C (entries 45, 47 and 48) was detrimental to all of these parameters, presumably because oxygen is such a powerful activating agent that with extended reaction times it starts to expand micropores into mesopores. A800 could be activated with oxygen at either 500 or 750 °C (entries 49–51) and these activated materials had almost identical properties with BET surface areas of 629–647 m2 g−1 and micropore contents of 27–28%. Finally, P800 could be activated at 400–750 °C (entries 52–54), though the activated materials had comparatively low BET surface areas of 360–550 m2 g−1 and the micropore volume increased from 0.11 cm3 g−1 to just 0.15–023 cm3 g−1 to give materials with micropore contents of 26–33%.
To complement the porosimetry data, three unactivated Starbons® (X800s) and 38 activated Starbons® (covering all three biopolymers and all three activation methods) were imaged by SEM (data in ESI†). Five samples (S800, A800, S800K2, A800K2 and S950C90) were also imaged by TEM (data in ESI†). SEM images were obtained at both low magnification (×100–500) and high resolution (×5000–30000). Fig. 2 shows a representative selection of the high resolution SEM images. At this magnification, unactivated X800's derived from all three biopolymers have an uneven surface covered in roughly spherical nodules. In contrast, the corresponding X800K2's have a very smooth, glassy surface which is devoid of the nodules seen in the unactivated materials. The same smooth surface was seen for all other potassium hydroxide activated materials (data in ESI†). In contrast, carbon dioxide activation of S800 and A800 retains the rough nodular surface, but converts P800 into a material with a smooth glassy surface. The additional images in the ESI† indicate that this is true at all temperatures and times used for carbon dioxide activation. Oxygen activation appears to burn away most or all of the nodules, but leaves a rough surface for all three biopolymer derived materials. Thus, the three activation methods produce materials with different surface textures. The low magnification SEM images show that S800 and A800 consist of granular particles whilst P800 consists of flat plate like particles. This overall appearance of the individual particles does not change during any of the activation methods (data in ESI†). These low magnification images also allowed a particle size analysis to be carried out and the results are given in Table 2. The results indicate that for starch derived materials, activation of S300 with potassium hydroxide (to give S800K1–5) results in a larger average particle size than seen in S800 due to selective destruction of the smallest particles during the activation process. Particle size distribution plots (data in ESI†) are consistent with this interpretation. In contrast, carbon dioxide or oxygen activation of S800 results in no change in the average particle size. Activation of A300 with one mass equivalent of potassium hydroxide at 800 °C to form A800K1 gives material with a larger average particle size than A800, again due to selective destruction of the smallest particles during the activation as indicated by the particle size distribution plots (data in ESI†). Use of more potassium hydroxide at 800 °C to form A800K2–5 gives material with a much smaller average particle size than A800, indicating that under these conditions even the larger particles of A300 are susceptible to fragmentation and degradation. The effect of temperature on the average particle size of AnK2 (n = 600–1000) is also shown in Table 2. At the lowest temperature (600 °C), only the smallest particles are degraded during the activation, resulting in the average particle size of A600K2 being almost double that of A800. At 800 °C, the larger particles also undergo significant fragmentation and degradation to give A800K2 with a small average particle size as discussed above. Finally, at 1000 °C, small particles are completely eaten away almost as soon as they form, resulting in the formation of A1000K2 with a larger average particle size than A800. The particle size distribution plots (see ESI†) again support this interpretation. Just like S800, activation of A800 by carbon dioxide or oxygen results in no change in the average particle size. Materials derived by potassium hydroxide activation of P300 or by activation of P800 with carbon dioxide or oxygen displayed different changes in average particle sizes to those seen for starch and alginic acid derived materials. Thus, activation of P300 with potassium hydroxide (to form P800K2, P800K3 and P800K5) results in the formation of materials with the same average particle size as P800. This indicates that the thin, flat plate-like particles present in pectin derived Starbons® (data in ESI†) are all attacked by potassium hydroxide at the same rate. In contrast, carbon dioxide or oxygen activation of P800 results in a significant increase in the average particle size suggesting that these activating agents do selectively destroy the smaller particles of P800. The changes in particle width between the samples are however relatively small – less than one order of magnitude. Thus, all of the starch derived samples analysed had average particle widths of 10.0–39.5 μm; the alginic acid derived materials analysed had average particle widths of 11.5–99.2 μm; and the pectin derived samples had average particle widths of 15.3–78.3 μm. In contrast to the SEM images, higher resolution TEM images showed little difference between the samples analysed, but did allow the micropores present to be imaged (data in ESI†).
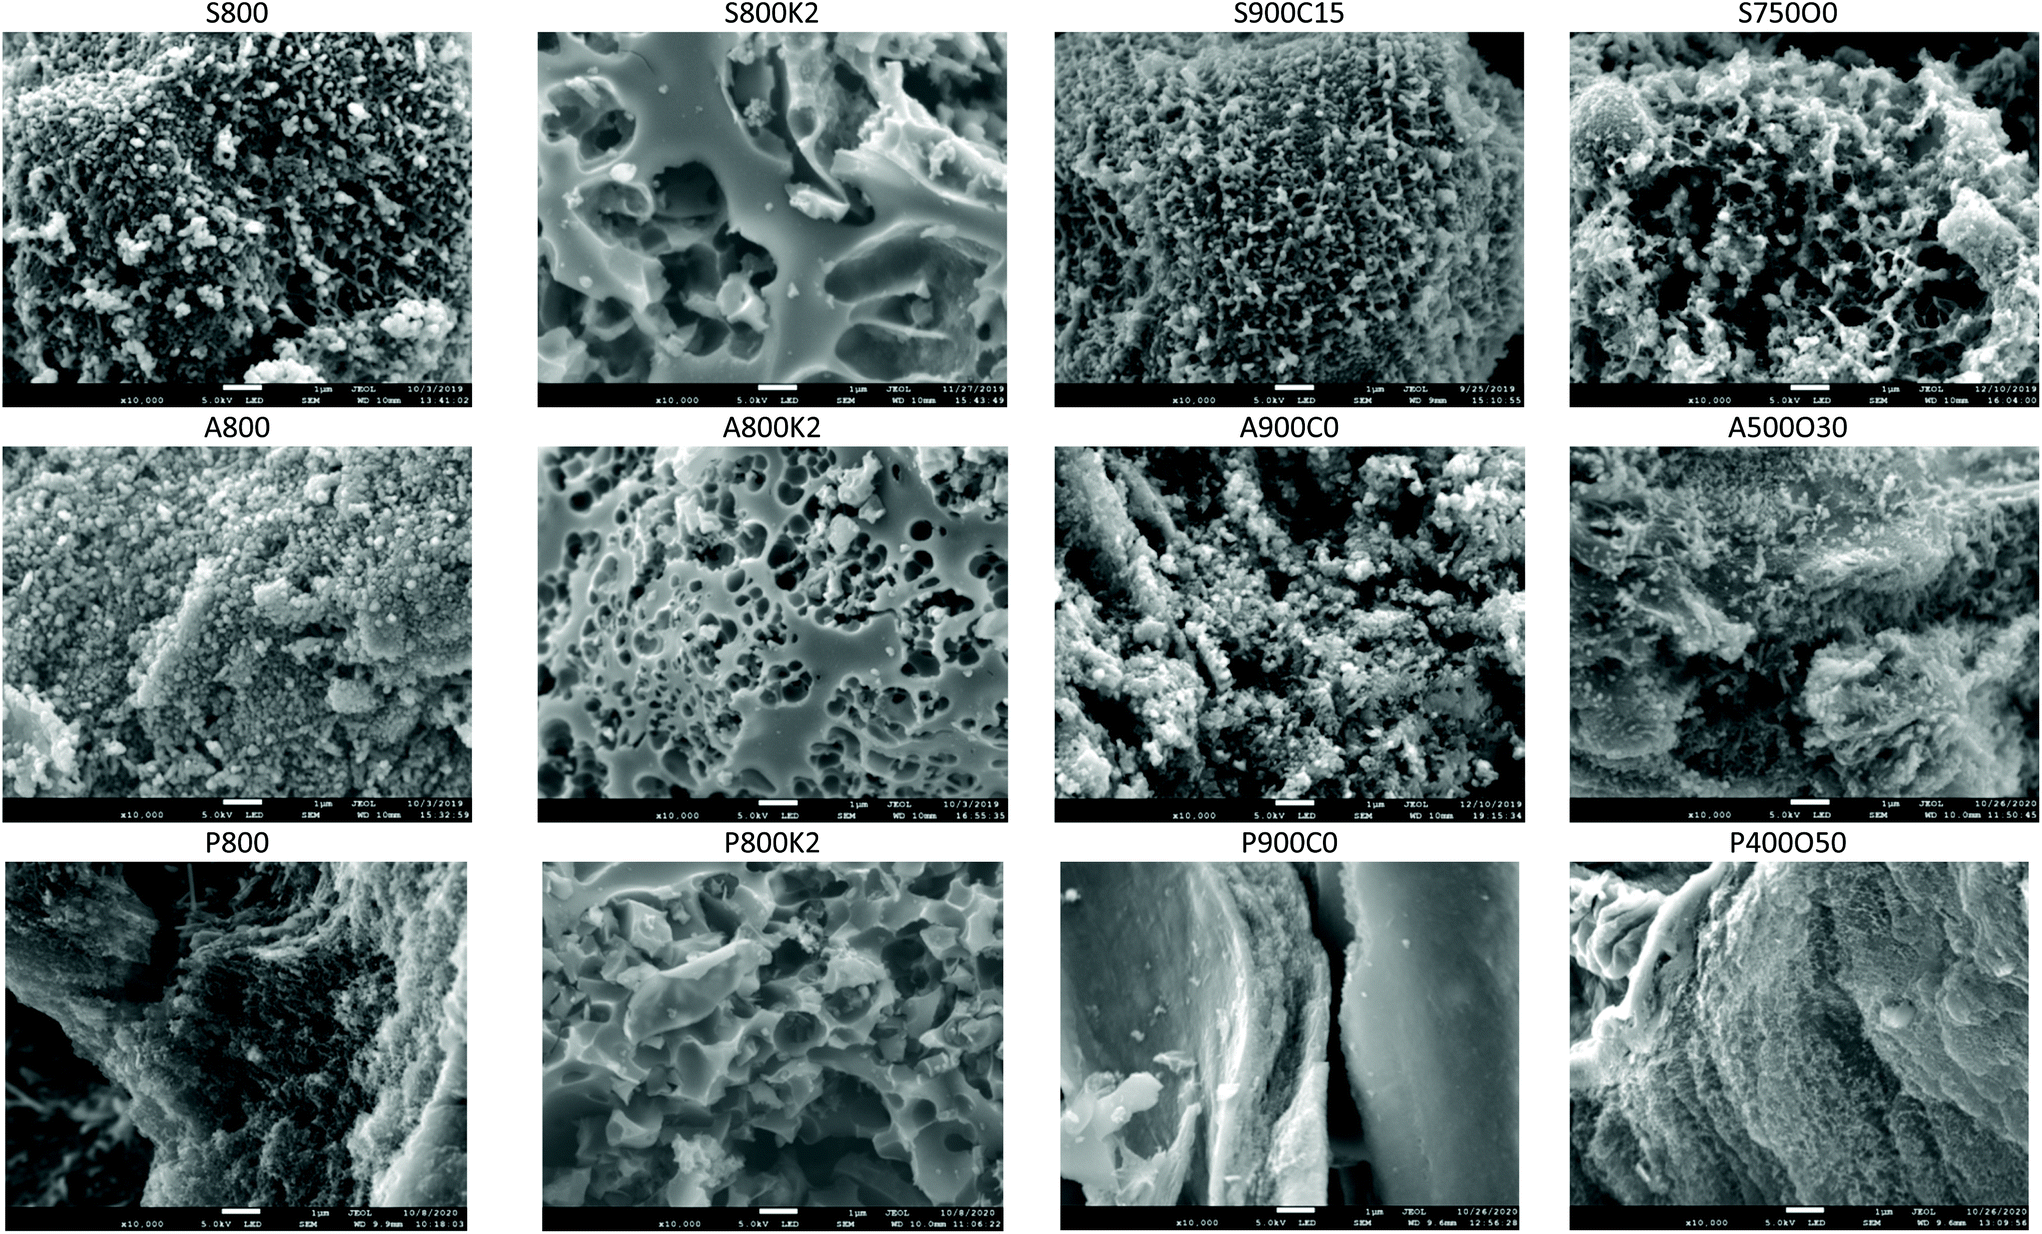 | ||
| Fig. 2 SEM images of activated and unactivated Starbons®. All images are at ×10000 magnification and the white scale bar represents 1 μm. | ||
| Starch derived | Alginic acid derived | ||
|---|---|---|---|
| Material | Particle width (μm) | Material | Particle width (μm) |
| S800 | 14.1 ± 6.4 | A800 | 50.6 ± 20.8 |
| S800K1 | 23.1 ± 14.0 | A800K1 | 72.4 ± 30.3 |
| S800K2 | 30.2 ± 18.9 | A800K2 | 13.2 ± 9.8 |
| S800K3 | 39.5 ± 26.6 | A800K3 | 11.5 ± 8.4 |
| S800K4 | 26.4 ± 15.1 | A800K4 | 15.8 ± 10.7 |
| S800K5 | 30.3 ± 20.0 | A800K5 | 34.0 ± 25.4 |
| S800C15 | 10.0 ± 4.9 | A600K2 | 99.2 ± 54.1 |
| S900C15 | 13.4 ± 6.0 | A1000K2 | 78.8 ± 43.3 |
| S950C15 | 12.3 ± 7.1 | A750C45 | 44.1 ± 26.9 |
| S1000C15 | 13.0 ± 6.2 | A750C60 | 39.7 ± 27.1 |
| S900C30 | 13.1 ± 6.3 | A750C90 | 43.3 ± 24.4 |
| S900C60 | 17.8 ± 12.2 | A900C0 | 41.7 ± 26.8 |
| S900C90 | 13.2 ± 5.8 | A900C10 | 46.5 ± 30.3 |
| S900C120 | 14.2 ± 8.2 | A500O30 | 44.3 ± 29.1 |
| S700O0 | 14.9 ± 7.0 | A500O60 | 51.5 ± 26.1 |
| S750O0 | 16.4 ± 7.7 | A750O0 | 51.5 ± 26.1 |
| S800O0 | 14.9 ± 8.8 | ||
| S750O40 | 14.2 ± 7.0 | ||
| S750O56 | 14.6 ± 8.4 | ||
| Pectin derived | |||
|---|---|---|---|
| Material | Particle width (μm) | ||
| a The largest visible width of 100–200 particles was measured. The value reported is the average of these measured widths ± one standard deviation. | |||
| P800 | 16.0 ± 12.0 | ||
| P800K2 | 20.3 ± 12.3 | ||
| P800K3 | 15.3 ± 9.2 | ||
| P800K5 | 19.9 ± 12.4 | ||
| P900C0 | 51.4 ± 32.4 | ||
| P400O50 | 78.3 ± 69.7 | ||
To investigate the chemical composition, a representative selection of the samples was analysed by a combination of combustion analysis, ICP-OES and XPS and key results are shown in Table 3. Entries 1–3 show the carbon and hydrogen content of the biopolymers from which the Starbons® were prepared. Entries 4–7 then give the chemical composition of unactivated Starbon® materials and entries 4 and 5 show that the carbon content increases from 39% in starch to 70% in S300 and to over 91% in S800. At the same time, the hydrogen and other contents decrease as the material undergoes dehydrations. S800 has significantly higher carbon content than either A800 or P800 (Table 3, entries 5–7), partly due to the presence of significant amounts of calcium (5.4%) in A800 and sodium (5.0%) in P800 as determined by ICP-OES (data in ESI†). A800 and P800 also contain more oxygen than S800 due to the presence of carboxylic acid and/or methyl ester groups in alginic acid and pectin. Entries 8–12 show that converting S300 into activated Starbons® S800K1–K5 gives materials which contain about 10% less carbon than unactivated S800 (entry 5) and conversely about 10% more other content. This is partly due to removal of carbon atoms (as carbon monoxide and carbon dioxide) during the activation process with potassium hydroxide and partly due to the introduction of additional oxygen atoms during the activation.44 S600K4 (entry 13) still contained 2.5% hydrogen indicating that the dehydration processes were not complete for this material. This and the introduction of oxygen during the activation process then explains its low carbon content (58%). S1000K4 (entry 14) also had a lower carbon content (71%) than S800K4 (78%, entry 11) which will be entirely due to the introduction of additional oxygen at the very high activation temperature. All of the materials listed in entries 8–14 of Table 3 were also analysed by ICP-OES to determine the amount of residual potassium and other trace elements present in the materials. Data for all the elements detected is given in the ESI,† but the potassium levels detected (0.01–0.04%) were at most six times those in unactivated S800 (0.007%), showing that the potassium hydroxide used for the activation process had been effectively removed from the activated Starbons®. A800K2 and P800K2 (entries 15 and 16) also showed a reduction in their carbon content compared to A800 and P800 respectively, though in the case of P800K2 this reduction was only 3.5%. However, A800K2 had a lower potassium content than A800 and P800K2 had the same potassium content as P800. For both of these materials, the total trace element composition was much lower than that of the unactivated X800 material, showing that the aqueous washes were effective in removing not only potassium residues, but also other trace elements present.
| Entry | Material | CHN analysis % | XPSa C (%), O (%) | ICP-OESb K (%) (total %) | ||
|---|---|---|---|---|---|---|
| C | H | Other | ||||
| a For details of other elements detected by XPS see ESI.† b 41 elements were analysed (data in ESI†). The figure in brackets is the sum of all elements quantitatively analysed. c aa = alginic acid. | ||||||
| 1 | starch | 39.1 | 6.4 | 54.5 | ||
| 2 | aac | 35.2 | 4.7 | 60.1 | ||
| 3 | pectin | 38.9 | 5.9 | 55.2 | ||
| 4 | S300 | 70.6 | 3.3 | 26.1 | ||
| 5 | S800 | 91.6 | 0.2 | 8.2 | C (94.8), O (5.2) | 0.007 (0.7) |
| 6 | A800 | 80.9 | 0 | 19.1 | C (87.4), O (9.3) | 0.09 (8.1) |
| 7 | P800 | 72.1 | 1.1 | 26.8 | C (76.2), O (14.4) | 0.04 (6.7) |
| 8 | S800K1 | 80.3 | 0.6 | 19.1 | 0.02 (0.2) | |
| 9 | S800K2 | 83.8 | 0.1 | 16.1 | C (86.3), O (13.5) | 0.02 (0.3) |
| 10 | S800K3 | 74.2 | 0.5 | 25.3 | 0.02 (0.3) | |
| 11 | S800K4 | 78.3 | 0 | 21.7 | 0.04 (0.6) | |
| 12 | S800K5 | 83.5 | 0.3 | 16.2 | 0.04 (0.5) | |
| 13 | S600K4 | 57.9 | 2.5 | 39.6 | 0.01 (0.9) | |
| 14 | S1000K4 | 70.9 | 0.6 | 28.5 | 0.03 (1.7) | |
| 15 | A800K2 | 70.0 | 0 | 30.0 | C (84.8), O (14.4) | 0.04 (1.7) |
| 16 | P800K2 | 68.6 | 0.5 | 30.9 | C (91.0), O (8.8) | 0.04 (1.8) |
| 17 | S950C15 | 92.6 | 0 | 7.4 | ||
| 18 | S950C30 | 90.1 | 0 | 9.9 | ||
| 19 | S950C60 | 88.1 | 0 | 11.9 | ||
| 20 | S950C90 | 88.7 | 0 | 11.3 | C (98.5), O (1.3) | 0.12 (4.1) |
| 21 | S950C120 | 78.0 | 0 | 22.0 | ||
| 22 | A750C60 | 74.7 | 0 | 25.3 | C (90.9), O (6.8) | 0.19 (4.4) |
| 23 | P700C50 | 62.7 | 0.8 | 36.5 | C (77.2), O (13.8) | 1.59 (12.0) |
| 24 | S700O0 | 80.4 | 0 | 19.6 | ||
| 25 | S750O0 | 84.6 | 0 | 15.4 | C (98.2), O (1.5) | 0.05 (9.2) |
| 26 | S750O56 | 81.9 | 0 | 18.1 | ||
| 27 | S800O0 | 84.9 | 0 | 15.1 | ||
| 28 | A750O0 | 78.3 | 0.9 | 20.8 | C (90.4), O (7.1) | 0.08 (4.2) |
| 29 | P400O50 | 66.8 | 0.2 | 33.0 | C (72.1), O (17.2) | 0.81 (4.9) |
Table 3, entries 17–21 show the chemical composition of carbon dioxide activated Starbons® prepared from S800 at 950 °C for 15–120 minutes. As the activation time increases, the carbon content decreases consistent with the material becoming more oxygenated due to loss of carbon as carbon monoxide. S950C120 had a chemical composition that was virtually identical to that of S800K4 (entries 11 and 21). A750C60 and P700C50 (entries 22 and 23) also show a decrease in carbon content compared to their X800 precursors. The chemical compositions of oxygen activated materials obtained from X800's are shown in entries 24–29. Again the materials all show a reduction in carbon content relative to their unactivated precursors, consistent with conversion of carbon into carbon monoxide and carbon dioxide. Six carbon dioxide and oxygen activated samples were also analysed by ICP-OES. In all cases, both the potassium and total trace elemental contents of these samples were higher than those of the potassium hydroxide activated samples (Table 3 and ESI†). The metal content of P700C50 (entry 23) was particularly high with values for sodium and potassium of 9.2 and 1.6% respectively. This is consistent with the presence of carboxylic acid groups in this pectin derived material.
XPS analysis was used to probe the surface functionality of nine activated Starbons® (one from each biomass source activated by each activation method) and the three X800′s. Spectra and elemental compositions for each sample are given in the ESI† and representative spectra and deconvolutions for C 1s and O 1s of S800 and S800K2 are given in Fig. 3. For all the samples, the carbon content of the surface as determined by XPS was higher than the bulk carbon content determined by combustion analysis. The differences range from 2.5% for S800K2 (Table 3, entry 9) to 22.4% for P800K2 (entry 16) and indicate that the interior of the materials is more oxygenated than the surface which is consistent with the composition of elements other than carbon and hydrogen determined by combustion analysis always being higher than the surface oxygen composition determined by XPS. Deconvolution of the carbon 1s XPS signal showed that for all the materials, the surface carbon was predominantly sp2 hybridised and constituted 31.4–71.4% of the surface atoms. For S800K2 and A800K2, the XPS data shows an increase in the total amount of surface oxygen present compared to the corresponding unactivated X800 material (5.2 to 13.5% for S800 to S800K2 and 9.3 to 14.4% for A800 to A800K2) with a corresponding reduction in surface carbon composition (94.8 to 86.3% for S800 to S800K2 and 87.4 to 84.8% for A800 to A800K2), but P800K2 contains less surface oxygen than P800 (8.8% versus 14.4%). The lower surface oxygen content of P800K2 can be attributed to decarboxylation of acid and ester groups under the strongly basic, high temperature conditions as shown by the O–C![[double bond, length as m-dash]](https://www.rsc.org/images/entities/char_e001.gif) O component of the carbon 1s peak (3.3% in P800 versus 2.6% in P800K2). For all three X800′s, carbon dioxide activation (at 700–950 °C) resulted in an increase in surface carbon content and decrease in surface oxygen content. The same trend was observed for oxygen activation of S800 and A800 at 750 °C, but P400O50 had increased surface oxygen content (17.2%, Table 3, entry 29) compared to P800 (14.4%, entry 7). This can be explained by the lower activation temperature (400 °C) used for P400O50 since oxygen activation at 400 °C is known to result in predominant oxygenation of the surface whereas at higher temperatures, removal of carbon (as carbon monoxide and carbon dioxide) is the dominant process.45
O component of the carbon 1s peak (3.3% in P800 versus 2.6% in P800K2). For all three X800′s, carbon dioxide activation (at 700–950 °C) resulted in an increase in surface carbon content and decrease in surface oxygen content. The same trend was observed for oxygen activation of S800 and A800 at 750 °C, but P400O50 had increased surface oxygen content (17.2%, Table 3, entry 29) compared to P800 (14.4%, entry 7). This can be explained by the lower activation temperature (400 °C) used for P400O50 since oxygen activation at 400 °C is known to result in predominant oxygenation of the surface whereas at higher temperatures, removal of carbon (as carbon monoxide and carbon dioxide) is the dominant process.45
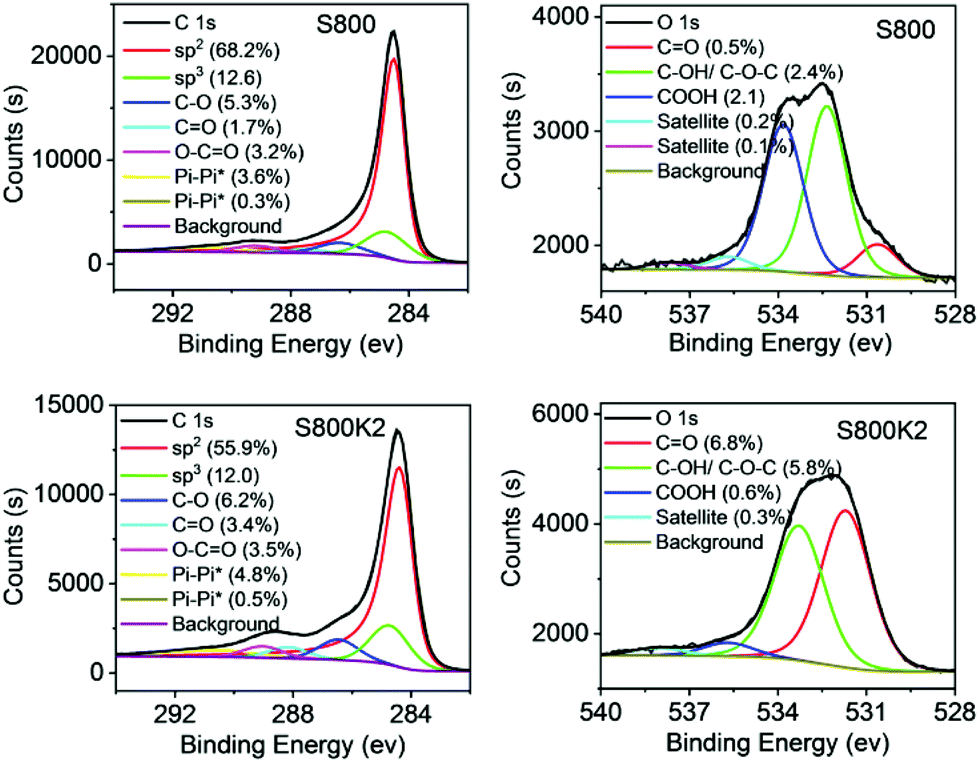 | ||
| Fig. 3 C1s and O1s XPS spectra of S800 and S800K2. | ||
Carbon dioxide capture capacities of hierarchically porous Starbons®
Carbon dioxide is a by-product of many large-scale industries and is usually vented to atmosphere.46 As a result, atmospheric carbon dioxide levels have increased to over 415 ppm leading to climate changes.47 Hence a major challenge is the development of methods for the capture of waste carbon dioxide to permit its subsequent storage48 or reuse.49 Adsorption of carbon dioxide onto solids is one of the most promising processes for carbon dioxide capture from waste gas streams even at low carbon dioxide partial pressures.50 Adsorbents including zeolites,51 mesoporous silicas,52 MOFs,53 COFs,54 metal oxides55 and carbon-based materials56 have been developed for carbon dioxide capture. For efficient carbon dioxide separation, materials should have high surface areas, high total and micropore volumes, and a well-defined pore size distribution. Other important attributes are the adsorption/desorption kinetics; tolerance towards moisture and impurities; low energy consumption for regeneration; and long-term stability in multi-cycle processes.57 Since microporous activated carbons are effective materials for carbon dioxide capture58 and we have previously shown that mesoporous Starbons® have even higher carbon dioxide adsorption capacities and selectivities,28 we anticipated that the hierarchical pore structure within activated Starbons® could confer them with the ideal morphology to adsorb carbon dioxide. Therefore, these materials were screened for their carbon dioxide adsorption capacities.The ability of activated Starbons® to reversibly adsorb carbon dioxide was studied using thermogravimetric analysis during gas composition swing (from nitrogen to carbon dioxide) capture and release at 35 °C and 1 bar pressure using identical methodology and conditions to those used in previous work.28 Each sample was subjected to 2–6 cycles of carbon dioxide capture and release (data in ESI†) and the results are shown in Fig. 4 and tabulated in the ESI.† The top four entries in Fig. 4 show the results obtained with unactivated Starbons®. These materials show the same trend as previous work,28 with carbonisation at 800 °C giving material with higher carbon dioxide adsorption capacity than carbonisation at 300 °C and the carbon dioxide adsorption capacities decreasing from starch to alginic acid and to pectin derived materials. Comparison of the results for the X800 samples with those previously reported for materials made by the older solvent exchange method28 shows that the freeze drying method gives Starbons® with 59–77% higher carbon dioxide adsorption capacities. The next seventeen entries in Fig. 4 give the results obtained for potassium hydroxide activated Starbons®. The pectin derived materials again had lower carbon dioxide adsorption capacities than the corresponding alginic acid and starch derived materials. The best results were obtained using 2–3 weight equivalents of potassium hydroxide to activate A300 or S300, giving materials (A800K3, S800K3, A800K2 and S800K2) with carbon dioxide adsorption capacities of 2.8–3.1 mmol g−1. These values are approximately double those of the corresponding, predominantly mesoporous, unactivated A800 and S800 (1.4 and 1.6 mmol g−1 respectively) and are substantially higher than the value of 0.4 mmol g−1 reported for microporous Norit activated carbon.28 This can be attributed to the presence of large numbers of ultramicropores (58–67% of the total pore volume, see Table 1) in A800K3, S800K3, A800K2 and S800K2 as well as to the retention of mesopores within their hierarchically porous structure to facilitate mass transfer. Ultramicropores possess stronger carbon dioxide adsorption potentials than larger pores due to favourable van der Waals interactions between the walls of ultramicropores and carbon dioxide molecules.59,60 Therefore, at low pressure, it is the ultramicropore volume and surface area that determine the carbon dioxide adsorption capacity of a material. The remaining entries in Fig. 4 correspond to carbon dioxide or oxygen activated samples. Of these materials, only those derived from starch were able to adsorb significantly more carbon dioxide than the unactivated X800 precursor. The best results were obtained with S900C15, S900C60, S700O0 and S750O0, all of which had carbon dioxide adsorption capacities of 2.0 mmol g−1. This is 25% higher than the adsorption capacity of S800, but 35% lower than the adsorption capacity of S800K2. The lower carbon dioxide adsorption capacities of carbon dioxide activated Starbons® than of potassium hydroxide activated Starbons® correlates directly with their lower ultramicropore content which never exceeds 50% of the total pore volume (Table 1). Oxygen activated, starch derived Starbons® do have ultramicropore volumes which are 49–60% of their total pore volume (Table 1, entries 44–48), but the total pore volumes of these materials (0.5–0.6 cm3 g−1) are lower than those of potassium hydroxide activated, starch derived Starbons® (0.6–1.1 cm3 g−1). In view of the above results and analysis, potassium hydroxide activated Starbons® derived from starch (S800K2, S800K3 and S800K5) along with S800 as a control were selected for a more detailed analysis of their ability to adsorb carbon dioxide at various temperatures and pressures.
 | ||
| Fig. 4 CO2 adsorption capacities and heats of CO2 adsorption for Starbon® materials obtained at 35 °C and 1 bar pressure under an alternating flow of N2 and CO2. Colour and shading coding: blue, starch derived; green, alginic acid derived; purple, pectin derived; vertical stripes, unactivated; solid fill, KOH activated; diagonal stripes, CO2 activated; checkerboard, O2 activated. | ||
Fig. 4 also shows the enthalpy of carbon dioxide adsorption onto each material. Most of the values lie between −30 and −50 kJ mol−1, consistent with physisorption of carbon dioxide.61 However, materials which have low carbon dioxide adsorption capacities tend to also have high magnitude carbon dioxide adsorption enthalpies. This is indicative of multilayer binding of carbon dioxide occurring within the pores of these materials so that materials which physisorb the least carbon dioxide hold it, on average, closest to the pore walls and hence adsorb it most strongly.
The thermogravimetric data also allowed the rate of carbon dioxide adsorption to be studied. For all the materials, physisorption of carbon dioxide was found to be a very rapid process (at 35 °C and 1 bar carbon dioxide pressure) with saturation occurring in 30–60 seconds for all of the samples (data in ESI†). The adsorption data was modelled against both pseudo-first order and pseudo-second order models62 and in all cases‡ showed a better fit to the pseudo-first order model which indicates that the adsorption is controlled by the diffusion step, which is proportional to the concentration of carbon dioxide. The first order rate constants for carbon dioxide adsorption by unactivated Starbons® were in the range 5.2–8.9 min−1. The potassium hydroxide and oxygen activated materials had slightly lower first order rate constants for carbon dioxide adsorption (2.5–5.7 and 4.3–6.0 min−1 respectively) whilst the carbon dioxide activated materials had first order rate constants of 3.6–9.1 min−1 which in the best cases exceeded those of the unactivated Starbons®. The highest rate of carbon dioxide adsorption occurred onto S950C120 which also had the highest mesopore volume of all the materials (Table 1, entry 36). The results are consistent with highly mesoporous materials facilitating the transportation of carbon dioxide to the adsorption sites.63
To investigate how the carbon dioxide adsorption capacities varied with pressure and so facilitate the use of these materials in pressure swing and vacuum swing adsorption systems64 and with gas streams containing carbon dioxide partial pressures below 1 bar,50 the carbon dioxide adsorption isotherms at 0.1–10 bar and 0 °C of S800K2, S800K3 and S800K5 along with unactivated S800 were measured volumetrically (Fig. 5). The carbon dioxide adsorption of all the materials increased as the pressure increased. Fig. 4 shows that S800K2 and S800K3 have very similar carbon dioxide adsorption capacities at 1 bar and 35 °C and the isotherm studies showed that this was also the case at 0 °C over all the pressures studied. Both of these materials outperformed unactivated S800 under all conditions investigated. The most striking result in Fig. 5 is the increase in carbon dioxide adsorption of S800K5 as the carbon dioxide pressure increases. At pressures below 0.2 bar, this is a very poorly performing material which is outperformed even by unactivated S800 (Fig. 5b). Between carbon dioxide pressures of 0.2 and 1.0 bar, S800K5 outperforms S800 but is inferior to S800K2 and S800K3. At pressures above 1 bar, S800K5 outperforms even S800K2 and S800K3 and its carbon dioxide adsorption capacity reaches 20.3 mmol g−1 at 10 bar and 0 °C (Fig. 5a). S800K5 has the highest BET surface area, largest total pore volume and highest microporosity of these four materials and whilst ultramicropores are known to be important for carbon dioxide adsorption at low pressures,58,59 at higher pressures larger pores65 and total surface area66 become more important as they provide additional space for carbon dioxide storage and promote efficient diffusion of carbon dioxide within the material. The carbon dioxide adsorption capacities around 1 bar pressure are fully consistent with those measured at 35 °C by thermogravimetric analysis and shown in Fig. 4. The carbon dioxide adsorption isotherms of S800 and S800K2 were also measured at 25 and 50 °C (data in ESI†) and their carbon dioxide adsorptions decreased as the temperature increased, consistent with the exothermic nature of carbon dioxide adsorption onto the materials as shown in Fig. 4.44,67
 | ||
| Fig. 5 CO2 adsorption isotherms at 0 °C. (a) 0–10 bar; (b) expansion of 0–1 bar. | ||
To further analyse the carbon dioxide adsorption isotherms for S800, S800K2, S800K3 and S800K5, the data was fitted to the Langmuir, Freundlich and Temkin isotherm models68 (data in ESI†). At all three temperatures, the best fit to the S800 data was the Freundlich model (R2 > 0.995) indicating that multilayer adsorption occurs on S800. For the potassium hydroxide activated materials, both the Langmuir and Freundlich isotherm models gave similar fits to the experimental data (R2 > 0.985), though the Langmuir model always gave the marginally better fit. This suggests that both monolayer and multilayer adsorptions occurs on these materials, predominantly by filling of their micropores. Van't Hoff plots (see ESI†) based on the equilibrium constants obtained from the Freundlich isotherm models for S800 and S800K2 were linear and allowed the thermodynamic parameters associated with carbon dioxide adsorption onto these materials to be determined (Table 4). The negative values of ΔG° show that the adsorption process proceeds spontaneously and the negative ΔH° values, with magnitudes less than 20 kJ mol−1, indicate the physisorption nature of the adsorption on both samples.69 Both ΔS° values are negative which indicates an increase in order after adsorption of carbon dioxide onto the surface of the materials.70 The temperatures at which carbon dioxide adsorption ceases to be favourable (ΔG° = 0) are 373 K for S800 and 404 K for S800K2, indicating that S800K2 can adsorb carbon dioxide at higher temperatures than S800.
| Material | T (K) | ΔG° (KJ mol−1) | ΔH° (KJ mol−1) | ΔS° (J mol−1 K−1) |
|---|---|---|---|---|
| S800 | 273 | −2.74 | −10.21 | −27.37 |
| 298 | −2.05 | |||
| 323 | −1.37 | |||
| S800K2 | 273 | −3.95 | −12.17 | −30.09 |
| 298 | −3.20 | |||
| 323 | −2.45 |
To verify that the results obtained from single component isotherms were applicable to the dynamic processes occurring during adsorption from multicomponent gas mixtures, S800 and S800K2 were analysed by thermogravimetric analysis switching between nitrogen and mixtures of carbon dioxide in nitrogen with carbon dioxide partial pressures of 0.15 to 0.83 bar (data in ESI†).71 The resulting carbon dioxide adsorptions were fitted to a Freundlich isotherm and used to calculate Gibbs free energies of adsorption which were entirely consistent with those reported in Table 4 obtained from single component isotherms. Thus these experiments indicate that S800K2 is capable of selectively adsorbing carbon dioxide from real waste gas streams even at low partial pressures. Additional dynamic breakthrough experiments would mimic these real-word separation processes, reflecting the kinetics and competitiveness of the adsorption once the composition of a particular waste gas stream of interest was defined.
The Freundlich isotherms also allow the enthalpy of adsorption (ΔH°) to be calculated as a function of amount of carbon dioxide adsorbed by use of the Clausius–Clapeyron equation72 and Fig. 6 shows the results obtained for S800 and S800K2. The enthalpies of adsorption of S800 and S800K2 were found to be in the range of −20 to −25 and −19 to −42 kJ mol−1 respectively; values which indicate that, in both cases, carbon dioxide adsorption occurs by physisorption and that regeneration of the adsorbent would only require low energy input. For S800, the enthalpy of adsorption was almost independent of the amount of carbon dioxide adsorbed; whilst for S800K2, the enthalpy of adsorption increased significantly as the amount of carbon dioxide adsorbed increased. The very negative enthalpy of carbon dioxide adsorption at low carbon dioxide loadings of S800K2 (−42 kJ mol−1) indicates that the carbon dioxide is being physisorbed within its micropores and especially in its ultramicropores. As the amount of carbon dioxide being adsorbed increases, these sites become full, so additional carbon dioxide is physisorbed in larger micropores and in mesopores which have lower van der Waals forces and short-range interactions between the adsorbent surface and carbon dioxide molecules.73 At the highest carbon dioxide loadings, S800K2 has an enthalpy of carbon dioxide adsorption of just −19 kJ mol−1 which is almost identical to the −20 kJ mol−1 calculated for the enthalpy of carbon dioxide adsorption by highly mesoporous S800 at its highest carbon dioxide loadings. This indicates that in both materials, carbon dioxide is being physisorbed within mesopores at high carbon dioxide loadings.
 | ||
| Fig. 6 Enthalpy of adsorption of CO2 on S800 (red) and S800K2 (blue) as a function of amount of CO2 adsorbed. | ||
Once the carbon dioxide adsorption capacity of a material reaches 3 mmol g−1, then the selectivity of carbon dioxide capture becomes more important than further increase in the adsorption capacity in determining the overall cost of carbon dioxide capture.27 Since the carbon dioxide adsorption isotherms of S800K2 and S800K5 showed that they had carbon dioxide adsorption capacities greater than 3 mmol g−1 at 1 bar pressure (Fig. 5 and ESI†), the selectivity of carbon dioxide versus nitrogen adsorption by these two activated Starbons® and by unactivated S800 for comparison was investigated. Therefore nitrogen adsorption isotherms at 0–25 °C and 0.1–10 bar pressure were recorded for these three materials (see ESI†). The nitrogen adsorption data was again found to be well described by both the Langmuir and Freundlich models (R2>0.995). The selectivity of carbon dioxide versus nitrogen adsorption was then calculated using the Ideal Adsorbed Solutions Theory (IAST) method74 to give plots showing how the selectivity of carbon dioxide adsorption varies with pressure in the range of 0.1–10 bar. In addition, the adsorption isotherms (0–1 bar) previously recorded28 for Norit activated carbon (AC) and S800 prepared by the solvent exchange method (S800SE) were reanalysed using the IAST method to allow the selectivities to be compared with previous work. Fig. 7 shows the IAST calculated selectivities over the 0.1–10 bar pressure range and the selectivities at 1 bar and 10 bar are tabulated in Table 5. It is apparent from the data shown in Fig. 7 and Table 5 that S800SE, S800 and S800K2 have higher carbon dioxide to nitrogen selectivities than Norit activated carbon. S800, prepared by the freeze drying method, has a lower carbon dioxide adsorption selectivity than S800SE prepared by the older solvent exchange method. However, activation of S800 with potassium hydroxide gives S800K2 which, at 25 °C and 1 bar pressure has a carbon dioxide to nitrogen adsorption selectivity of 60, which is 2.4 times the selectivity of Norit activated carbon, 2.1 times the selectivity of S800 and 1.5 times the selectivity of S800SE. Even at 10 bar pressure, the carbon dioxide adsorption selectivity of S800K2 at 25 °C (37) is more than double that of S800 (16). Reducing the adsorption temperature to 0 °C slightly increases the carbon dioxide adsorption selectivity of S800K2 (to 65 and 41 at 1 and 10 bar respectively). S800K5 shows a much lower variation of carbon dioxide adsorption selectivity with pressure than any of the other Starbon® based materials. Thus its selectivity only decreases from 66 at 0.1 bar to 46 at 1 bar and 43 at 10 bar. As a result, S800K5 exhibits a lower selectivity than S800K2 at pressures below 6.2 bar, but a higher selectivity than S800K2 at pressures of 6.2 bar or higher. This trend matches the trend in carbon dioxide adsorption capacities of S800K2 and S800K5 (Fig. 5), though in that case the performance of S800K5 exceeds that of S800K2 at pressures above 1.2 bar.
 | ||
| Fig. 7 Variation of selectivities of CO2versus N2 adsorption with pressure. Black Norit activated carbon at 25 °C; brown S800SE at 25 °C; red S800 at 25 °C; blue S800K2 at 25 °C; green S800K2 at 0 °C; purple S800K5 at 0 °C. | ||
| Sample | Temperature (°C) | Selectivity at 1 bar | Selectivity at 10 bar |
|---|---|---|---|
| a AC = Norit activated carbon and S800SE is S800 prepared by solvent exchange. CO2 and N2 adsorption isotherms (0–1 bar) for both these samples were reported in ref. 28 and the data has been reanalysed by the IAST method. | |||
| ACa | 25 | 24.5 | |
| S800SEa | 25 | 38.7 | |
| S800 | 25 | 29.1 | 15.7 |
| S800K2 | 25 | 59.9 | 36.6 |
| S800K2 | 0 | 64.5 | 40.5 |
| S800K5 | 0 | 45.6 | 43.1 |
Other than nitrogen, the contaminant most often associated with waste carbon dioxide gas streams is water. Therefore, the influence of water on the carbon dioxide adsorption capacities of S800, S800K2 and S800K5 was investigated by thermogravimetric analysis during gas composition swing (from dry nitrogen to either dry or water saturated carbon dioxide) capture and release at 1 bar pressure. It was found (data in ESI†) that the carbon dioxide adsorption capacities of S800, S800K2 and S800K5 decreased by just 8, 7 and 3% respectively when the carbon dioxide was water saturated. These results compare very favourably with those previously reported28 for Norit activated carbon and S800 made by the solvent exchange method, both of which were found to lose 20% of their carbon dioxide adsorption capacities in the presence of water.
Correlation of carbon dioxide adsorption capacity with Starbon® textural properties
The 48 materials listed in Fig. 4 combined with S600 and S1000 (see ESI†) gave a set of 50 carbon based materials with varying structural parameters. This set of related materials was used to investigate any relationships between the carbon dioxide adsorption capacity, enthalpy of carbon dioxide adsorption and first order rate constant for carbon dioxide adsorption (all at 35 °C and 1 bar carbon dioxide pressure) with 16 structural properties or ratios of properties of the materials (see ESI†).74§ No correlation was found between the enthalpy of carbon dioxide adsorption or the first order rate constant for carbon dioxide adsorption and any of these parameters. Five trends were found for the carbon dioxide adsorption capacity which increased as the micropore surface area increased; increased as the ratio of ultramicropores, ultramicropores with diameters of 0.4–0.7 nm, or micropores, to total pore volume increased;64,75 and decreased as the ratio of mesopores to total pore volume increased. Since no single parameter gave a strong correlation with the carbon dioxide adsorption capacity, correlations involving combinations of two parameters were investigated. The product of the ultramicropore surface area and the ratio of volume of pores with 0.4–0.7 nm diameter to total pore volume did give a linear correlation with the carbon dioxide adsorption capacity for all 50 materials (Fig. 8). This correlation suggests that at close to ambient temperature and pressure, adsorption of carbon dioxide by the Starbon® materials only partially fills their ultamicropores, giving a dependence on ultramicropore volume (corresponding to filled pores) and ultramicropore surface area (corresponding to partially filled pores). This leaves space available in the ultramicropores and larger micropores to accommodate more carbon dioxide at higher pressures as shown in Fig. 5. The lower diameter limit (0.4 nm) used in the ultramicropore volume ratio is consistent with the kinetic diameter of carbon dioxide molecules which is reported to be 0.33 nm.76 It is also known that as the pore width increases above 0.7 nm, the carbon dioxide adsorption capacity decreases due to reduced overlapping of the adsorption potential of carbon dioxide with wall atoms in neighbouring pore walls as well as with wall atoms in the pore holding the carbon dioxide molecule.61 Thus, as a result of favorable van der Waals force and short-range interactions, the initial interaction is between carbon dioxide and the ultramicropores present in the materials. Once these are filled, additional carbon dioxide is captured by larger micropores. The advantageous role of mesopores in the Starbons® then appears to be due to the increase in total surface area that they provide, which provides more surface onto which to burn micropores when the materials are activated. These additional micropores would only be accessible via the mesopores as previously determined.28 | ||
| Fig. 8 Correlation between CO2 adsorption capacity and the product of ultramicropore surface area and ratio of volume of pores with 0.4–0.7 nm diameter to total pore volume. | ||
Experimental
Synthetic procedures for the synthesis of activated Starbons® using potassium hydroxide, carbon dioxide and oxygen are given in the ESI† along with details of instrumentation and methods used to analyse the materials and their ability to adsorb carbon dioxide and nitrogen.Conclusions
A new class of hierarchically porous carbons (activated Starbons®) derived from three sustainable sources of waste biomass: starch, alginic acid and pectin has been developed. Activation could be achieved using potassium hydroxide, carbon dioxide or oxygen to give a set of activated Starbons® with widely varying pore structures and morphologies.The activated Starbons® were found to be excellent adsorbents for the physisorption of carbon dioxide. The optimal materials (S800K2 at 1 bar and S800K5 at 10 bar pressure) show high carbon dioxide adsorption capacities (4 mmol g−1 at 25 °C and 1 bar and 20 mmol g−1 at 0 °C and 10 bar pressure). These high carbon dioxide adsorption capacities are combined with high selectivities for carbon dioxide over nitrogen (59.9 at 25 °C and 1 bar and 43.1 at 0 °C and 10 bar pressure), low enthalpies of carbon dioxide adsorption (−26.7 kJ mol−1 for S800K5 and −33.6 kJ mol−1 for S800K2), very rapid carbon dioxide adsorption and desorption kinetics (K1 = 2.5–5.7 min−1) and excellent tolerance to the presence of water (just 3–7% reduction in carbon dioxide adsorption capacity when the carbon dioxide was water saturated). The availability of a large set of related materials allowed the correlation of their carbon dioxide adsorption capacities with a range of structural properties to be investigated and the product of ultramicropore surface area and the ratio of volume of pores with 0.4–0.7 nm diameter to total pore volume gave a linear correlation with the 1 bar carbon dioxide adsorption capacities. This, along with the thermodynamic data obtained for carbon dioxide physisorption highlights, that at 1 bar pressure, carbon dioxide is predominantly adsorbed within pores with diameters of 0.4–0.7 nm. At higher pressures, these pores become filled and carbon dioxide adsorption also occurs in larger pores. The highly mesoporous nature of the unactivated Starbon® precursor provides an enhanced surface area into which the activation process can introduce additional ultramicropores.
The most established methodology for carbon capture is chemisorption using aqueous solutions of amines in a thermal swing process. However, this technology has severe disadvantages including a low carbon dioxide loading capacity and a high rate of equipment corrosion.77 The reliance on chemisorption also makes the process energy intensive and hence expensive to operate.75 The amines used are not sustainably sourced; are manufactured from ammonia,78 the production of which consumes 2% of global energy and generates 400 megatonnes of carbon dioxide each year;79 and undergo decomposition to toxic by-products including carcinogenic nitrosamines.80 These problems can all be avoided by use of solid carbonaceous adsorbents to physisorb carbon dioxide in a pressure swing process, technology which is currently at pilot plant scale.81 A commercially viable, carbon based adsorbent should be reliably producible on a large scale, have a high selectivity for carbon dioxide over nitrogen and tolerate the presence of water.82 It should also have a low enthalpy of carbon dioxide adsorption to minimise the energetic cost of carbon dioxide release, rapid kinetics for both adsorption and desorption and the carbon dioxide capture capacity should be reproducible over multiple cycles.80,81
The activated Starbons® reported in this work have been shown to meet the above requirements with the additional advantage of being sustainably sourced from waste biomass. The non-activated Starbon® precursors are commercially available and are being produced on a 10s-100s Kg scale.83Table 6 compares the carbon dioxide adsorption capacity and carbon dioxide versus nitrogen selectivity of S800K2 with those of 18 other biomass derived activated carbons reported in the literature. S800K2 has one of the highest carbon dioxide adsorption capacities at both 0 °C and 25 °C and by far the highest selectivity for carbon dioxide versus nitrogen adsorption of any of the materials. Since it has previously been shown that once the carbon dioxide adsorption capacity reaches 3 mmol g−1, selectivity is more important than capacity from a cost of capture perspective,27 this along with their rapid kinetics and excellent water tolerance makes the activated Starbons® reported in this paper the most promising carbon-based materials for commercial use in carbon dioxide separation applications. Based on the carbon dioxide capture capacity, rate of capture and release, selectivity for carbon dioxide versus nitrogen, and effect of water; capture of 1 Tonne per day of carbon dioxide would require just 11.1 kg of S800K2. Capture of the carbon dioxide from a biomass fuelled power station, biorefinery or other sustainable source in this way would then provide the sustainable carbon dioxide feedstock needed for the multitude of methods being developed to convert carbon dioxide into sustainable chemicals and fuels84 and is essential for the development of a circular economy based on a carbon dioxide refinery.85
| Biomass precursor | Activation method | 1 bar CO2 capacity (mmol g−1) | CO2/N2 selectivity (25 °C, 1 bar) | |
|---|---|---|---|---|
| 0 °C | 25 °C | |||
| nr = not reported.a Determined from the ratio of the amount of CO2 and N2 adsorbed.b Determined by the initial slope method.c Determined by the IAST method.d Determined by the Henry's law method. | ||||
| Celtuce leaves86 | KOH | 6 | 4.4 | nr |
| Sawdust59 | KOH | 6.1 | 4.8 | 5.4a |
| Starch based packaging waste87 | KOH | 5.3 | 4.2 | 16b |
| Glucose/acrylic acid88 | KOH | 5.9 | 3.8 | nr |
| Starch89 | CO2 | 4.3 | 3.2 | nr |
| Pomegranate peel90 | KOH | 6.0 | 4.1 | 15.1c |
| Glucose65 | KOH | 5.9 | 4.3 | nr |
| Elephant grass91 | KOH | 6.3 | 3.6 | nr |
| Pine nutshell92 | KOH | 7.7 | 5.0 | 8.4a |
| Wheat flour93 | KOH | 5.7 | 3.5 | 15c |
| Casein44 | KOH | 4.1 | 2.3 | nr |
| Bamboo94 | air | 4.1 | 2.3 | nr |
| Starch95 | H2O2/steam | 5.8 | 3.9 | 18c |
| Cellulose96 | Steam | 4.4 | 3 | 39.2d |
| Cross-linked cellulose97 | CO2 | 5.0 | nr | 32.9c |
| Almond shells98 | air | 3.1 | 2.1 | 35c |
| Palm empty fruit bunch99 | KOH | 5.2 | 3.7 | 11.2c |
| Dates100 | KOH | 6.4 | 4.4 | 41.5c |
| S800K2 | KOH | 6.2 | 4.0 | 59.9 |
Author contributions
H. Li: Investigation; methodology; writing – review and editing – C. Li: Investigation; resources. – V. Budarin: Methodology; supervision. – James H. Clark: Funding acquisition; project administration; resources; supervision; writing – review and editing. – M. North: Conceptualisation; funding acquisition; project administration; supervision; writing – original draft. – J. Wang: Resources; supervision – X. Wu: Methodology; writing – original draft.Conflicts of interest
There are no conflicts to declare.Acknowledgements
The authors thank the Chinese Scholarship Council for a scholarship (to HL).References
- M.-M. Titirici, R. J. White, N. Brun, V. L. Budarin, D. S. Su, F. del Monte, J. H. Clark and M. J. MacLachlan, Chem. Soc. Rev., 2015, 44, 250–290 RSC.
- S. Rondeau-Gagne and J. F. Morin, Chem. Soc. Rev., 2014, 43, 85–98 RSC; J. V. Maciel, A. M. M. Durigon, M. M. Souza, R. F. N. Quadrado, A. R. Fajardo and D. Dias, Trends Environ. Anal. Chem., 2019, 22, e00062 CrossRef CAS.
- V. Budarin, J. H. Clark, J. J. E. Hardy, R. Luque, K. Milkowski, S. J. Tavener and A. J. Wilson, Angew. Chem., Int. Ed., 2006, 45, 3782–3786 CrossRef CAS PubMed.
- P. S. Shuttleworth, V. L. Budarin, R. J. White, V. M. Gun'ko, R. Luque and J. H. Clark, Chem. – Eur. J., 2013, 19, 9351–9357 CrossRef CAS PubMed.
- R. J. White, C. Antonio, V. L. Budarin, E. Bergstrom, J. Thomas-Oates and J. H. Clark, Adv. Funct. Mater., 2010, 20, 1834–1841 CrossRef CAS; A. S. Marriott, A. J. Hunt, E. Bergstrom, J. Thomas-Oates and J. H. Clark, J. Anal. Appl. Pyrolysis, 2016, 121, 62–66 CrossRef PubMed.
- R. J. White, V. L. Budarin and J. H. Clark, Chem. – Eur. J., 2010, 16, 1326–1335 CrossRef CAS PubMed.
- V. Budarin, R. Luque, D. J. Macquarrie and J. H. Clark, Chem. – Eur. J., 2007, 13, 6914–6919 CrossRef CAS PubMed; V. L. Budarin, J. H. Clark, R. Luque, D. J. Macquarrie, A. Koutinas and C. Webb, Green Chem., 2007, 9, 992–995 RSC.
- A. M. Garcia, A. J. Hunt, V. L. Budarin, H. L. Parker, P. S. Shuttleworth, G. J. Ellis and J. H. Clark, Green Chem., 2015, 17, 2146–2149 RSC.
- A. Borisova, M. De Bruyn, V. L. Budarin, P. S. Shuttleworth, J. R. Dodson, M. L. Segatto and J. H. Clark, Macromol. Rapid Commun., 2015, 36, 774–779 CrossRef CAS PubMed.
- V. G. Zuin, V. L. Budarin, P. S. Shuttleworth, A. J. Hunt, C. Pluciennik, A. Borisova, J. Dodson, H. L. Parker and J. H. Clark, Faraday Discuss., 2017, 202, 451–464 RSC.
- H. L. Parker, A. J. Hunt, V. L. Budarin, P. S. Shuttleworth, K. L. Miller and J. H. Clark, RSC Adv., 2012, 2, 8992–8997 RSC.
- R. Luque, J. H. Clark, K. Yoshida and P. L. Gai, Chem. Commun., 2009, 5305–5307 RSC; R. Luque and J. H. Clark, Catal. Commun., 2010, 11, 928–931 CrossRef CAS.
- R. Luque, V. Budarin, J. H. Clark and D. J. Macquarrie, Appl. Catal., B, 2008, 82, 157–162 CrossRef CAS.
- V. L. Budarin, J. H. Clark, R. Luque, D. J. Macquarrie and R. J. White, Green Chem., 2008, 10, 382–387 RSC; H. L. Parker, J. R. Dodson, V. L. Budarin, J. H. Clark and A. J. Hunt, Green Chem., 2015, 17, 2200–2207 RSC.
- V. L. Budarin, J. H. Clark, R. Luque and D. J. Macquarrie, Chem. Commun., 2007, 634–636 RSC.
- J. H. Clark, V. Budarin, T. Dugmore, R. Luque, D. J. Macquarrie and V. Strelko, Catal. Commun., 2008, 9, 1709–1714 CrossRef CAS; R. Luque, C. S. K. Lin, C. Du, D. J. Macquarrie, A. Koutinas, R. Wang, C. Webb and J. H. Clark, Green Chem., 2009, 11, 193–200 RSC; R. Luque and J. H. Clark, ChemCatChem, 2011, 3, 594–597 CrossRef.
- M. Ojeda, A. M. Balu, A. A. Romero, P. Esquinazi, J. Ruokolainen, H. Sixta and R. Luque, ChemCatChem, 2014, 6, 2847–2853 CrossRef CAS.
- J. C. Colmenares, P. Lisowski and D. Łomot, RSC Adv., 2013, 3, 20186–20192 RSC.
- A. M. Garcia, V. L. Budarin, Y. X. Zhou, M. De Bruyn, A. J. Hunt, L. Lari, V. K. Lazarov, H. J. Salavagione, E. Morales, G. J. Ellis, J. H. Clark and P. S. Shuttleworth, J. Mater. Chem. A, 2018, 6, 1119–1127 RSC.
- S. Kim, A. M. Escamilla-Perez, M. De Bruyn, J. G. Alauzun, N. Louvain, N. Brun, D. Macquarrie, L. Stievano, B. Boury, L. Monconduit and P. H. Mutin, J. Mater. Chem. A, 2017, 5, 24380–24387 RSC.
- S. Kim, M. De Bruyn, J. G. Alauzun, N. Louvain, N. Brun, D. J. Macquarrie, L. Stievano, B. Boury, P. H. Mutin and L. Monconduit, J. Power Sources, 2018, 406, 18–25 CrossRef CAS.
- A. S. Marriott, E. Bergstrom, A. J. Hunt, J. Thomas-Oates and J. H. Clark, RSC Adv., 2014, 4, 222–228 RSC.
- H. L. Parker, V. L. Budarin, J. H. Clark and A. J. Hunt, ACS Sustainable Chem. Eng., 2013, 1, 1311–1318 CrossRef CAS.
- M. A. Tony, H. L. Parker and J. H. Clark, J. Environ. Sci. Health, Part A: Toxic/Hazard. Subst. Environ. Eng., 2016, 51, 974–979 CrossRef CAS PubMed.
- J. M. Shannon, J. H. Clark, M. I. de Heer, T. Ekblad and A. S. Matharu, ACS Omega, 2018, 3, 18361–18369 CrossRef CAS.
- V. Presser, J. McDonough, S.-H. Yeon and Y. Gogotsi, Energy Environ. Sci., 2011, 4, 3059–3066 RSC; A. Samanta, A. Zhao, G. K. H. Shimizu, P. Sarkar and R. Gupta, Ind. Eng. Chem. Res., 2012, 51, 1438–1463 CrossRef CAS; A.-H. Lu and G. P. Hao, Annu. Rep. Prog. Chem., Sect. A: Inorg. Chem., 2013, 109, 484–503 RSC.
- H. A. Patel, J. Byun and C. T. Yavuz, ChemSusChem, 2017, 10, 1303–1317 CrossRef CAS PubMed.
- G. Dura, V. L. Budarin, J. A. Castro-Osma, P. S. Shuttleworth, S. C. Z. Quek, J. H. Clark and M. North, Angew. Chem., Int. Ed., 2016, 55, 9173–9177 CrossRef CAS PubMed.
- R. A. Milescu, M. R. Dennis, C. R. McElroy, D. J. Macquarrie, A. S. Matharu, M. W. Smith, J. H. Clark and V. L. Budarin, Sustainable Chem. Pharm., 2020, 15, 100230 CrossRef.
- T. P. Senftle and E. A. Carter, Acc. Chem. Res., 2017, 50, 472–475 CrossRef CAS PubMed; H. Zhao, H. Zhang, N. Sun, W. Wei and Y. Sun, Greenhouse Gases: Sci. Technol., 2018, 8, 11–36 CrossRef; J. Wang, Y. Yang, Q. Jia, Y. Shi, Q. Guan, N. Yang, P. Ning and Q. Wang, ChemSusChem, 2019, 12, 2055–2082 CrossRef PubMed; G. Singh, J. Lee, A. Karakoti, R. Bahadur, J. Yi, D. Zhao, K. AlBahily and A. Vinu, Chem. Soc. Rev., 2020, 49, 4360–4404 RSC; R.-S. Liu, X.-D. Shi, C.-T. Wang, Y.-Z. Gao, S. Xu, G.-P. Hao, S. Chen and A.-H. Lu, ChemSusChem, 2021, 14, 1428–1471 CrossRef PubMed.
- J. Wang and S. Kaskel, J. Mater. Chem., 2012, 22, 23710–23725 RSC.
- M. Sevilla, N. Diez and A. B. Fuertes, ChemSusChem, 2021, 14, 94–117 CrossRef CAS PubMed.
- A. S. Gonzalez, M. G. Plaza, F. Rubiera and C. Pevida, Chem. Eng. J., 2013, 230, 456–465 CrossRef CAS.
- M. G. Plaza, A. S. Gonzalez, J. J. Pis, F. Rubiera and C. Pevida, Appl. Energy, 2014, 114, 551–562 CrossRef CAS.
- S. Zhang, X. Li, J. Zhou, L. Li, L. Bao and X. Li, ACS Sustainable Chem. Eng., 2021, 9, 1646–1655 CrossRef CAS.
- M. G. Plaza, A. S. Gonzalez, J. J. Pis, F. Rubiera and C. Pevida, Appl. Energy, 2014, 114, 551–562 CrossRef CAS.
- S. Román, J. González, C. González-García and F. Zamora, Fuel Process. Technol., 2008, 89, 715–720 CrossRef.
- J. H. deBoer, B. C. Lippens, B. G. Linsen, J. C. P. Broekhoff, A. van den Heuvel and T. V. Osinga, J. Colloid Interface Sci., 1966, 21, 405–414 CrossRef CAS.
- G. Horvath and K. Kawazoe, J. Chem. Eng. Jpn., 1983, 16, 470–475 CrossRef CAS.
- M. Thommes and K. A. Cychosz, Adsorption, 2014, 20, 233–250 CrossRef CAS.
- C. Lastoskie, K. E. Gubbins and N. Quirke, J. Phys. Chem., 1993, 97, 4786–4796 CrossRef CAS; P. I. Ravikovitch, A. Vishnyakov, R. Russo and A. V. Neimark, Langmuir, 2000, 16, 2311–2320 CrossRef.
- M. Thommes, Chem. Eng. Technol., 2010, 82, 1059–1073 CAS.
- B. D. Zdravkov, J. J. Cermak, M. Sefara and J. Janku, Cent. Eur. J. Chem., 2007, 5, 385–395 CAS.
- G. Singh, K. S. Lakhi, C. Sathish, K. Ramadass, J.-H. Yang and A. Vinu, ACS Appl. Nano Mater., 2019, 2, 1604–1613 CrossRef CAS.
- M. G. Plaza, K. J. Thurecht, C. Previda, F. Rubiera, J. J. Pis, C. E. Snape and T. C. Drage, Fuel Process. Technol., 2013, 110, 53–60 CrossRef CAS.
- J. Wilcox, Carbon Capture, Springer, New York, 2012, chp. 1 Search PubMed.
- I. Capellán-Pérez, I. Arto, J. M. Polanco-Martínez, M. González-Eguino and M. B. Neumann, Energy Environ. Sci., 2016, 9, 2482–2496 RSC.
- S. Haszeldine, Science, 2009, 325, 1647–1651 CrossRef PubMed.
- J. A. Martens, A. Bogaerts, N. De Kimpe, P. A. Jacobs, G. B. Marin, K. Rabaey, M. Saeys and S. Verhelst, ChemSusChem, 2017, 10, 1039–1055 CrossRef CAS PubMed.
- D. Aaron and C. Tsouris, Sep. Sci. Technol., 2005, 40, 321–348 CrossRef CAS; J. D. Figueroa, T. Fout, S. Plasynski, H. McIlvried and R. D. Srivastava, Int. J. Greenhouse Gas Control, 2008, 2, 9–20 CrossRef; S. Choi, J. H. Drese and C. W. Jones, ChemSusChem, 2009, 2, 796–854 CrossRef PubMed.
- S. Kumar, R. Srivastava and J. Koh, J. CO2 Util., 2020, 41, 101251 CrossRef CAS.
- T.-L. Chew, A. L. Ahmad and S. Bhatia, Adv. Colloid Interface Sci., 2010, 153, 43–57 CrossRef CAS PubMed.
- Z. Li, P. Liu, C. Ou and X. Dong, ACS Sustainable Chem. Eng., 2020, 8, 15378–15404 CrossRef CAS; R. Aniruddha, I. Sreedhar and B. M. Reddy, J. CO2 Util., 2020, 42, 101297 CrossRef.
- A. A. Olajire, J. CO2 Util., 2017, 17, 137–161 CrossRef CAS.
- Y. Ren, Z. Ma and P. G. Bruce, Chem. Soc. Rev., 2012, 41, 4909–4927 RSC.
- N. A. Rashidi and S. Yusup, J. CO2 Util., 2016, 13, 1–16 CrossRef CAS; S. Jung, Y.-K. Park and E. E. Kwon, J. CO2 Util., 2019, 32, 128–139 CrossRef.
- D. M. D'Alessandro, B. Smit and J. R. Long, Angew. Chem., Int. Ed., 2010, 49, 6058–6082 CrossRef PubMed.
- E. J. Ra, T. H. Kim, W. J. Yu, K. H. An and Y. H. Lee, Chem. Commun., 2010, 46, 1320–1322 RSC; X. Zhu, D. C. W. Tsang, L. Wang, Z. Su, D. Hou, L. Li and J. Shang, J. Cleaner Prod., 2020, 273, 122915 CrossRef CAS.
- M. Sevilla and A. B. Fuertes, Energy Environ. Sci., 2011, 4, 1765–1771 RSC.
- Y. Belmabkhout, V. Guillerm and M. Eddaoudi, Chem. Eng. J., 2016, 296, 386–397 CrossRef CAS.
- J. Singh, S. Basu and H. Bhunia, Microporous Mesoporous Mater., 2019, 280, 357–366 CrossRef CAS.
- X. M. Ren, H. Li, J. Chen, L. J. Wei, A. Modak, H. Q. Yang and Q. H. Yang, Carbon, 2017, 114, 473–481 CrossRef CAS.
- N. Balahmar, A. C. Mitchell and R. Mokaya, Adv. Energy Mater., 2015, 5, 1500867 CrossRef.
- Z. Rouzitalab, D. M. Maklavany, A. Rashidi and S. Jafarinejad, J. Environ. Chem. Eng., 2018, 6, 6653–6663 CrossRef CAS.
- J. Li, B. Michalkiewicz, J. Min, C. Ma, X. Chen, J. Gong, E. Mijowska and T. Tang, Chem. Eng. J., 2019, 360, 250–259 CrossRef CAS.
- Z. Zhang, D. Luo, G. Lui, G. R. Li, G. P. Jiang, Z. P. Cano, Y. P. Deng, X. J. Du, S. Yin, Y. F. Chen, M. H. Zhang, Z. F. Yan and Z. W. Chen, Carbon, 2019, 143, 531–541 CrossRef CAS.
- K. Y. Foo and B. H. Hameed, Chem. Eng. J., 2010, 156, 2–10 CrossRef CAS.
- D. Tiwari, H. Bhunia and P. K. Bajpai, J. Environ. Manage., 2018, 218, 579–592 CrossRef CAS PubMed.
- C. Goel, H. Bhunia and P. K. Bajpai, J. Chem. Eng. Data, 2017, 62, 214–225 CrossRef CAS.
- V. Benedetti, E. Cordioli, F. Patuzzi and M. Baratieri, J. CO2 Util., 2019, 33, 46–54 CrossRef CAS; X. Liu, S. Wang, C. Sun, H. Liu, L. Stevens, P. K. Dwomoh and C. Snape, Chem. Eng. J., 2020, 402, 125459 CrossRef.
- K. Ramadass, C. Sathish, S. MariaRuban, G. Kothandam, S. Joseph, G. Singh, S. Kim, W. Cha, A. Karakoti and T. Belperio, ACS Appl. Mater. Interfaces, 2020, 12, 11922–11933 CrossRef CAS PubMed.
- L. M. Yue, L. L. Rao, L. L. Wang, Y. Sun, Z. Z. Wu, H. DaCosta and X. Hu, Energy Fuels, 2018, 32, 2081–2088 CrossRef CAS.
- A. L. Myers and J. M. Prausnitz, AIChE J., 1965, 11, 121–127 CrossRef CAS.
- P. Zhang, Y. Zhong, J. Ding, J. Wang, M. Xu, Q. Deng, Z. Zeng and S. Deng, Chem. Eng. J., 2019, 355, 963–973 CrossRef CAS; X. Liu, C. Sun, H. Liu, W. H. Tan, W. Wang and C. Snape, Chem. Eng. J., 2019, 361, 199–208 CrossRef; C. Xu and M. Strømme, Nanomaterials, 2019, 9, 103 CrossRef PubMed; Y. Xu, Z. Yang, G. Zhang and P. Zhao, J. Cleaner Prod., 2020, 264, 121645 CrossRef.
- A. Rehman and S. J. Park, Carbon, 2020, 159, 625–637 CrossRef CAS.
- A. Rehman and S. J. Park, Chem. Eng. J., 2019, 362, 731–742 CrossRef CAS.
- C. H. Yu, C. H. Huang and C. S. Tan, Aerosol Air Qual. Res., 2012, 12, 745–769 CrossRef CAS; M. Songolzadeh, M. Soleimani, M. T. Ravanchi and R. Songolzadeh, Sci. World J., 2014, 828131 Search PubMed.
- C. Chao, Y. Deng, R. Dewil, J. Baeyens and X. Fan, Renewable Sustainable Energy Rev., 2021, 138, 110490 CrossRef CAS.
- B. H. Suryanto, H. L. Du, D. Wang, J. Chen, A. N. Simonov and D. R. MacFarlane, Nat. Catal., 2019, 2, 290–296 CrossRef CAS.
- C. Gouedard, D. Picq, F. Launay and P. L. Carrette, Int. J. Greenhouse Gas Control, 2012, 10, 244–270 CrossRef CAS.
- I. Majchrzak-Kucęba, D. Wawrzyńczak, J. Zdeb, W. Smółka and A. Zajchowski, Energies, 2021, 14, 2458 CrossRef.
- N. Abuelnoor, A. AlHajaj, M. Khaleel, L. F. Vega and M. R. Abu-Zahra, Chemosphere, 2021, 131111 CrossRef CAS PubMed.
- https://www.starbons.com/ (accessed 26 October 2021).
- Carbon Dioxide Utilisation, ed. M. North and P. Styring, Walter de Gruyter GmbH, 2019, vol. 1 and 2 Search PubMed.
- M. North, ChemSusChem, 2019, 12, 1763–1765 CrossRef CAS PubMed.
- R. T. Wang, P. Y. Wang, X. B. Yan, J. W. Lang, C. Peng and Q. J. Xue, ACS Appl. Mater. Interfaces, 2012, 4, 5800–5806 CrossRef CAS PubMed.
- M. Idrees, V. Rangari and S. Jeelani, J. CO2 Util., 2018, 26, 380–387 CrossRef CAS.
- Z. Liu, Z. Zhang, Z. Jia, L. Zhao, T. Zhang, W. Xing, S. Komarneni, F. Subhan and Z. Yan, Chem. Eng. J., 2018, 337, 290–299 CrossRef CAS.
- Y. Li, D. Li, Y. Rao, X. Zhao and M. Wu, Carbon, 2016, 105, 454–462 CrossRef CAS.
- J. Serafin, U. Narkiewicz, A. W. Morawski, R. J. Wróbel and B. Michalkiewicz, J. CO2 Util., 2017, 18, 73–79 CrossRef CAS.
- G. Singh, I. Y. Kim, K. S. Lakhi, P. Srivastava, R. Naidu and A. Vinu, Carbon, 2017, 116, 448–455 CrossRef CAS.
- S. Deng, H. Wei, T. Chen, B. Wang, J. Huang and G. Yu, Chem. Eng. J., 2014, 253, 46–54 CrossRef CAS.
- S. M. Hong, E. Jang, A. D. Dysart, V. G. Pol and K. B. Lee, Sci. Rep., 2016, 6, 1–10 CrossRef PubMed.
- W. Dilokekunakul, P. Teerachawanwong, N. Klomkliang, S. Supasitmongkol and S. Chaemchuen, Chem. Eng. J., 2020, 389, 124413 CrossRef CAS.
- Y. J. Heo and S. J. Park, Green Chem., 2018, 20, 5224–5234 RSC.
- J. Heo and S. J. Park, Energy, 2015, 91, 142–150 CrossRef.
- C. Xu, C. Q. Ruan, Y. Li, J. Lindh and M. Strømme, Adv. Sustainable Syst., 2018, 2, 1700147 CrossRef.
- M. G. Plaza, A. S. González, J. J. Pis, F. Rubiera and C. Pevida, Appl. Energy, 2014, 114, 551–562 CrossRef CAS.
- G. K. Parshetti, S. Chowdhury and R. Balasubramanian, Fuel, 2015, 148, 246–254 CrossRef CAS.
- J. Li, B. Michalkiewicz, J. Min, C. Ma, X. Chen, J. Gong, E. Mijowska and T. Tang, Chem. Eng. J., 2019, 360, 250–259 CrossRef CAS.
Footnotes |
| † Electronic supplementary information (ESI) available: experimental details for the synthesis of activated Starbons®, TGA-FTIR plots, porosimetry data and analysis, SEM and TEM images, ICP-OES data, XPS plots, STA traces and data analysis, CO2 and N2 adsorption isotherms and data analysis including adsorption selectivity data and plots of textural properties versus CO2 adsorption parameters. See DOI: 10.1039/d1gc03715c |
| ‡ Both the pseudo-first order and pseudo-second order models failed to fit to the carbon dioxide adsorption by P400O50 due to its low carbon dioxide adsorption capacity. |
| § The structural properties investigated were: ultramicropore surface area, micropore surface area, external surface area, BET surface area, ultramicropore volume, ultramicropore (0.4–0.7 nm) volume, supramicropore volume, micropore volume, mesopore volume, total pore volume, ratio of ultramicropore volume to total pore volume, ratio of ultramicropore (0.4–0.7 nm) volume to total pore volume, ratio of supramicropore volume to total pore volume, ratio of micropore volume to total pore volume, ratio of mesopore volume to total pore volume and ratio of micropore volume to mesopore volume. |
| This journal is © The Royal Society of Chemistry 2022 |