 Open Access Article
(−)-Oleocanthal induces death preferentially in tumor hematopoietic cells through caspase dependent and independent mechanisms
Chiara
Pastorio
 a,
Sara
Torres-Rusillo
 *a,
Juan
Ortega-Vidal
b,
M. Carmen
Jiménez-López
a,
Inmaculada
Iañez
a,
Sofía
Salido
 b,
Manuel
Santamaría
c,
Joaquín
Altarejos
 b and
Ignacio J.
Molina
ad
aInstitute of Biopathology and Regenerative Medicine, Center for Biomedical Research, University of Granada, Health Sciences Technology Park, 18016 Armilla, Granada, Spain. E-mail: storres@ugr.es
bDepartament of Inorganic and Organic Chemistry, Faculty of Experimental Sciences, University of Jaén, 23071 Jaén, Spain
cDepartment of Physiology, Cell Biology and Immunology, Faculty of Medicine, University of Córdoba, and Unidad de Inmunología y Alergología, Hospital Universitario Reina Sofía, 14004 Córdoba, Spain
dInstituto de Investigación Biosanitaria ibs.GRANADA, Granada, Spain
First published on 13th October 2022
Abstract
Olive oil is a key component of the highly cardiovascular protective Mediterranean diet. (−)-Oleocanthal (OLC) is one of the most interesting phenolics present in virgin olive oil, and is formed from secoiridoid ligustroside during the processing of olives to yield the oil. Anti-inflammatory and anti-oxidant properties were identified shortly after OLC isolation, followed by the discovery of anti-tumor activities in a few non-hematopoietic cell lineages. Because of the scarcity of tissues potentially targeted by OLC analyzed so far and the unresolved mechanism(s) for OLC anti-tumor properties, we used a panel of 17 cell lines belonging to 11 tissue lineages to carry out a detailed examination of targets and pathways leading to cell growth inhibition and death. We found that OLC inhibits cell proliferation and induces apoptotic death as revealed by sub-G1 cell cycle analyses and Annexin-V staining in all lineages analyzed except lung carcinoma cell lines. Hematopoietic tumor cell lines, untested until now, were the most sensitive to OLC treatment, whereas non-transformed cells were significantly resistant to cell death. The specificity of OLC-mediated caspase activation was confirmed by blocking experiments and the use of transfectants overexpressing anti apoptotic genes. OLC triggers typical mediators of the intrinsic apoptotic pathway such as production of reactive oxygen species and mitochondrial membrane depolarization (Δψm). Complete blockade of caspases, however, did not result in parallel abrogation of Annexin-V staining, thus suggesting that complex mechanisms are involved in triggering OLC-mediated cell death. Our results demonstrate that OLC preferentially targets hematopoietic tumor cell lines and support that cell death is mediated by caspase-dependent and independent mechanisms.
1. Introduction
Extra-virgin olive oil is a key component of the Mediterranean diet, widely recognized by its beneficial effects for human health. Followers of this diet have lower rates of cardiovascular diseases, obesity and certain types of cancer.1 These effects have been linked to the presence of several phenolic compounds including OLC, a compound present in the oil obtained from Olea europaea L fruits.2 Ibuprofen-like biological properties, including the shared stinging sensations in the throat, were later discovered.3 In addition, OLC has anti-oxidant, anti-bacterial and anti-degenerative effects (reviewed in ref. 4 and 5). OLC also has anti-tumor properties. Inhibition of cell growth and metastasis of hepatocarcinoma cells were achieved through generation of Reactive Oxygen Species (ROS)6 and blockade of STAT3 activation,7 a mechanism also observed in melanoma cells.8 OLC-treated breast cancer cells downmodulate several molecules, such as: phosphorylation of Mammalian Target of Rapamycin (m-TOR);9 mesenchymal epithelial transition factor (c-MET);10 estrogen receptor;11 or the TRCP6 Ca2+ channel.12 OLC also causes lysosomal membrane permeabilization.13,14 However, the mechanism(s) leading to OLC-mediated cell death have not been thoroughly studied.Apoptosis is a mechanism of programmed cell death triggered either by specific interactions between death receptors and their ligands (extrinsic pathway) or through activation of mitochondrial intermediates without receptor involvement (intrinsic or mitochondrial pathway) as consequence of DNA damage, deprival of growth factors or exposure to cytotoxic drugs.15 The process is regulated by the opposing functions of pro- and anti-apoptotic genes, with Bcl-2 and Bcl-xL among the latter. Both pathways transduce death signals through initiator caspases (-2, -8, -9 and -10) and effector caspases (-3,-6 and -7), which are activated after being specifically cleaved by the preceding caspase in a cascade-like model.16 Although apoptosis is the most widely recognized mechanism of programmed cell death, other non-apoptotic ways to induce regulated death have been identified, including necroptosis, pyroptosis, parthanatos, ferroptosis or PANoptosis.17 Since the effector pathways leading to cell death induced by OLC have only been partially addressed in a few targets, we have dissected the death-related pathways in a panel of 17 cell lines belonging to 11 tissue lineages. We found that OLC strongly induces cell death in all tissues analyzed except lung tumor cell lines, being hematopoietic tumor cell lines the most sensitive. Caspase dependent and independent mechanisms were involved in the observed cytotoxic effects.
2. Materials and methods
2.1 OLC extraction and purification
OLC was obtained from a sample of extra virgin olive oil supplied by the Cooperativa San Ginés y San Isidro, Sabiote, Spain, after purification as described in detail elsewhere.12 Briefly, extraction of the oil was carried out in a separatory funnel using a MeOH/H2O mixture (8![[thin space (1/6-em)]](https://www.rsc.org/images/entities/char_2009.gif) :
:![[thin space (1/6-em)]](https://www.rsc.org/images/entities/char_2009.gif) 2, v/v). The resulting supernatant was evaporated in vacuo and purified by a combination of fast centrifugal partition chromatography (FCPC) and semi-preparative high-performance liquid chromatography (HPLC) techniques. Confirmation of the structure of pure OLC (shown in graphical abstract) was carried out by proton nuclear magnetic resonance (1H NMR) and carbon nuclear magnetic resonance (13C NMR).
2, v/v). The resulting supernatant was evaporated in vacuo and purified by a combination of fast centrifugal partition chromatography (FCPC) and semi-preparative high-performance liquid chromatography (HPLC) techniques. Confirmation of the structure of pure OLC (shown in graphical abstract) was carried out by proton nuclear magnetic resonance (1H NMR) and carbon nuclear magnetic resonance (13C NMR).
2.2. Reagents and antibodies
Pan Caspase Inhibitor Z-VAD-FMK was purchased from R&D Systems (Minneapolis, MN, USA). eBioscience™ Annexin V Apoptosis Detection Kit FITC came from Invitrogen™ (Carlsbad, CA, USA). N-Acetyl-L-cysteine, propidium iodide, etoposide and the fluorescent cationic lipophilic dye 3,3′-dihexyloxacarbocyanine iodide (DiOC6) were purchased from Sigma-Aldrich (St Louis, MO, USA). Mouse monoclonal antibodies (mAb) against human caspase-9 (catalog# 551247), caspase-3 (#610323), caspase-8 (#551243) were from BD Pharmingen (Franklin Lakes, NJ, USA); anti-Bcl-2 (sc-7382) and Bcl-xL (sc-8392) were purchased from Santa Cruz Biotechnology (Dallas, TX, USA); anti-human β-actin mAb (#02844826) and polyclonal anti-Mouse IgG (H+L)-Peroxidase-labeled antibody (SAB3701095-2) were purchased from Sigma-Aldrich.2.3. Cell lines and culture
All tumor cell lines were obtained from and certified by the University of Granada's cell repository (ATCC-affiliated) and grown as follows: – MDA-MB-231 (ATCC® HTB-26™) and MCF7 (ATCC® HTB-22™) (breast carcinoma cell lines); G361 (ATCC® CRL-1424™) and HT144 (ATCC® HTB-63™) (malignant melanoma cell lines); HCT 116 (ATCC® CCL-247™) (colorectal carcinoma cell line); HeLa (ATCC® CCL-2™) (cervical carcinoma cell line); MIA PaCa-2 (ATCC® CRL-1420™) (pancreatic carcinoma cell line); A549 (ATCC® CCL-185™) (lung carcinoma cell line); 293T (ATCC® CRL-3216™) (embryonic kidney cell line) – in Dulbecco's modified Eagle's medium (DMEM; Gibco BRL, Waltham, MA, USA), supplemented with 10% fetal bovine serum (FBS) and 1% (v/v) Penicillin–Streptomycin 100 U mL−1 –; the human hematopoietic cell lines: – Jurkat (ATCC® TIB-152™) and CEM (ATCC® CCL-119™) (Acute Lymphoblastic T cell leukemias); Raji (ATCC® CCL-86™) (Burkitt's lymphoma B cell line); K-562 (ATCC® CCL-243™) (chronic myelogenous leukaemia); Jurkat clones transfected with the expression vector pCDNA3/Bcl-xL (H15 clone), pCDNA3/Bcl-2 (H25 and L15 clones) or backbone pCDNA3 (control)18 were maintained in RPMI (Gibco), supplemented as above plus 2 mM L-glutamine; the human colorectal adenocarcinoma cell line Caco-2 (ATCC® HTB-37™) was cultured in Iscove's Modified Dulbecco's Medium (IMDM, Gibco) supplemented with FBS and antibiotics as above; the human choriocarcinoma cell line JEG-3 (ATCC® HTB-36™) was maintained in Eagle's Minimum Essential Medium (EMEM; Lonza, Basel, Switzerland), supplemented with 10% FBS and L-glutamine without antibiotics; the lung carcinoma cell line NCI-H460 (ATCC® HTB-177™) was maintained in RPMI (Gibco) supplemented with 10% FBS, L-glutamine, antibiotics as well as 2% (v/v) sodium bicarbonate, 2.25% (v/v) L-glucose, 1% (v/v) HEPES and 1% (v/v) sodium pyruvate. All cells were cultured in T-75 flasks (Nunc) at 37 °C in an atmosphere containing 5% CO2 and passed twice a week.2.4. Cell proliferation assay
Non-hematopoietic cells (G361, A549, NCI-H460) were seeded in 96-well flat-bottomed culture plates at 750 cells per well and 24 h afterwards OLC was added at indicated concentrations, whereas Jurkat cells were seeded at 1000 cells per well and OLC added 1 h later. After 5 days of culture, cell proliferation was assessed with the PrestoBlue™ cell viability reagent (10 μl per well) (Invitrogen), which was added to the plates and incubated for 30 min. Fluorescence emission was detected using a Synergy™ HTX Multi-Mode Microplate Reader (BioTek) (excitation 530/20 nm, emission 590/35 nm). Proliferation results were expressed as normalized percentages over the values obtained with untreated cells (100%).2.5. Colony survival assay
Survival fractions of cells as a function of doses were determined by in vitro clonogenic assays performed as described19 by seeding 500 cells in 6 cm culture Petri dishes. Cells were treated with the indicated doses of OLC and cultured for 2 weeks, fixed in 80% ethanol, stained with crystal violet and photographed. Clusters containing over 50 cells were considered colonies and analyzed with ImageJ software. The total area occupied by colonies produced by treated cells was quantified and compared to that from untreated cells for each cell line. Survival fractions (SF) were calculated as described.192.6. Cell cycle analysis and Annexin V staining
250![[thin space (1/6-em)]](https://www.rsc.org/images/entities/char_2009.gif) 000 cells per well were seeded in 6-well culture plates 24 h prior adding the indicated compounds for 48 h. Cell cycle analysis was carried after cell fixation in cold 70% ethanol, followed by extraction and staining of DNA with Propidium iodide as described.18 Cells were analyzed by flow cytometry (FACSCalibur, BD) to determine the sub-G1 fraction after appropriate gating. Alternatively, cells treated as above were stained using the eBioscience™ Annexin V Apoptosis Detection Kit FITC (Invitrogen) according to manufacturer's recommendations and analyzed by flow cytometry.
000 cells per well were seeded in 6-well culture plates 24 h prior adding the indicated compounds for 48 h. Cell cycle analysis was carried after cell fixation in cold 70% ethanol, followed by extraction and staining of DNA with Propidium iodide as described.18 Cells were analyzed by flow cytometry (FACSCalibur, BD) to determine the sub-G1 fraction after appropriate gating. Alternatively, cells treated as above were stained using the eBioscience™ Annexin V Apoptosis Detection Kit FITC (Invitrogen) according to manufacturer's recommendations and analyzed by flow cytometry.
2.7. Measurement of reactive oxygen species (ROS) and mitochondrial membrane depolarization (Δψm)
The intracellular accumulation of ROS was determined using the fluorescent probe dihydroethidium (HE; Sigma-Aldrich) that measures intracellular superoxide ion production. Δψm was measured using 3-3′-dihexyloxacarbocyanine iodide (DiOC6, Sigma-Aldrich). Cells were treated as above, collected and resuspended in serum-free media containing 2 μM HE and 10 nM DIOC6. After a 20-minute incubation at 37 °C, fluorescence was analyzed by flow cytometry. In ROS-blocking experiments, cells were pre-treated for 1 h with 10 mM of the anti-oxidant N-acetyl-L-cysteine (NAC) and maintained throughout the culture.2.8. Western blot analysis
Cytoplasmic lysates were obtained with the NE-PER Nuclear and Cytoplasmic Extraction Reagents (Thermo Fisher Scientific, Waltham, MA, USA) and 35 μg of total proteins were resolved by SDS-PAGE (12%, reducing conditions), electrotransferred onto PVDF membranes, blocked for 1 h with 5% non-fat milk in 0.1% PBS/Tween 20 and incubated overnight at 4 °C with indicated antibodies at 0.1 μg mL−1 in 10 mL of blocking solution. Membranes were washed and incubated for 1 h with horseradish peroxide-conjugated secondary antibody (1/50 dilution) for 1 h at room temperature. Membranes were developed by chemiluminiscence with the ECL Prime Western Blotting Detection Reagent (Amersham, Chicago, IL, USA). Light emission was detected with a digital imaging system (Fujifilm Image Analyzer LAS-4000, Tokyo, Japan) and analyzed with the Multi Gauge software. Rehybridization of membranes with the anti-β-actin mAb was used as loading controls.2.9. Statistical analysis
Results were presented as means ± standard deviation (SD). Differences among various treatment groups were determined by the analysis of variance (One-way ANOVA) followed by Dunnett's test or by the analysis of variance (Two-way ANOVA) followed by Sidak's test. A value of p < 0.05 was considered statistically significant as compared to the control group.3. Results
3.1. OLC inhibits cell proliferation in all cell lines analyzed but not lung carcinoma cells
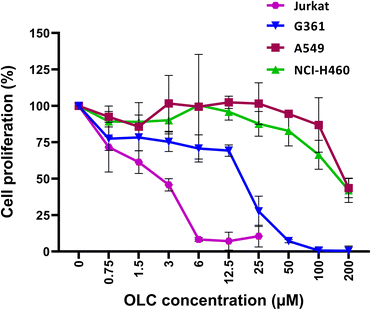
To determine the active dose of our pure OLC preparation, serial dilutions were tested in cell proliferation assays on our panel of cell lines. Proliferation was inhibited by OLC in all cell lines analyzed at low doses, with hematopoietic cells being the most sensitive (Fig. 1 and data not shown). In stark contrast to all other lineages analyzed, lung carcinoma cell lines were resistant to the antiproliferative activity of OLC, which required very high concentrations of the compound to achieve a moderate effect (Fig. 1).3.2. OLC efficiently inhibits colony formation capacity
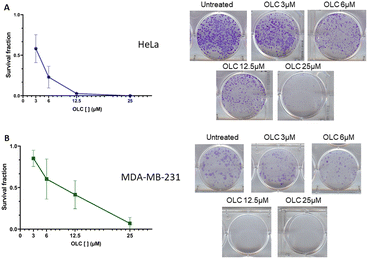
To determine if the above data resulted from cell arrest or death, colony survival assays were performed to evaluate whether individual cells could survive in the presence of the compound and therefore form colonies. After a long-term culture of two representative non-hematopoietic adherent cells (HeLa and MDA-MB-231), we found a rapid decline of the survival fraction at low OLC doses in both cell lines (Fig. 2, left hand panel). The cervix carcinoma HeLa cells (Fig. 2A) were highly sensitive, since OLC used at a concentration of 12.5 μM completely prevented colony growth, whereas the same effect was observed in MDA-MB-231 breast carcinoma cells at 25 μM (Fig. 2B).3.3. OLC induces accumulation of sub-G1 cells
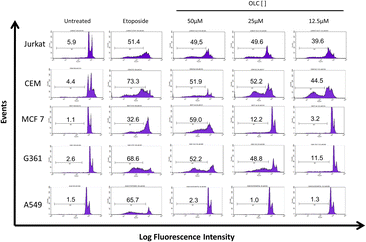
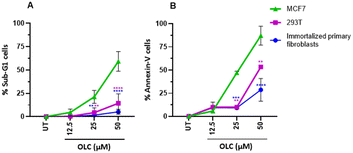
Cell cycle analyses by means of DNA staining with propidium iodide were carried out in all cell lines 48 h after treatment with OLC at indicated doses. The sub-G1 fraction of the cell cycle is an indirect but reliable identification of apoptotic cells.20 We found a significant proportion of sub-G1 cells in Jurkat and CEM cells at low OLC concentrations, whereas sub-G1 cells cannot be detected in lung A549 cells (Fig. 3).Results of the cell cycle analyses were carried out on all cell lines of the panel and are presented in Table 1. Sub-G1 cells can be observed, although to varying degrees, in all cells sensitive to the cytotoxic drug Etoposide with the exception, already mentioned, of lung cancer cells. Interestingly, only small percentages of sub-G1 cells were detected in immortalized, non-tumor cells (293T embryonic kidney cells) and immortalized primary fibroblasts.19
| Tissue lineage | Cell line | Etoposide (100 μM) | OLC (μM) | ||
|---|---|---|---|---|---|
| 50 | 25 | 12.5 | |||
| Cells were treated with indicated doses of OLC for 48 h and sub-G1 cells determined by cell cycle analysis. Values represent the mean ± SD of at least three independent experiments. | |||||
| Hematopoietic. T cells | Jurkat | 41.8 ± 6.2 | 30.8 ± 11.4 | 19.5 ± 11.9 | 18.7 ± 8.0 |
| CEM | 70.3 ± 7.7 | 30.3 ± 15.2 | 42.3 ± 4.5 | 36.6 ± 2.5 | |
| Hematopoietic. B cells | Raji | 55.0 ± 10.1 | 43.6 ± 6.8 | 23.0 ± 7.2 | 4.0 ± 2.8 |
| Hematopoietic. Myeloid | K-562 | 50.0 ± 5.3 | 19.0 ± 6.0 | 34.6 ± 7.0 | 36.3 ± 4.5 |
| Breast | MCF7 | 67.0 ± 11.2 | 50.6 ± 19.6 | 16.6 ± 9.6 | 3.0 ± 2.5 |
| MDA-MB-231 | 65.3 ± 6.5 | 35.6 ± 14.7 | 17.0 ± 11.3 | 3.0 ± 2.6 | |
| Skin Melanoma | G361 | 65.5 ± 21.1 | 52.2 ± 15.3 | 33.2 ± 21.5 | 5.2 ± 3.3 |
| HT144 | 58.0 ± 19.9 | 42.3 ± 24.2 | 4.6 ± 5.6 | 0.6 ± 1.1 | |
| Colon | HCT 116 | 61.0 ± 14.1 | 52.2 ± 22.5 | 4.2 ± 3.0 | 7.3 ± 7.0 |
| Caco-2 | 12.5 ± 1.0 | 10.7 ± 0.9 | 8.2 ± 3.2 | 0.6 ± 0.5 | |
| Cervix | HeLa | 24.0 ± 6.0 | 21.6 ± 9.0 | 5.6 ± 4.1 | 1.5 ± 2.00 |
| Pancreas | MIA PaCa-2 | 36.3 ± 10.4 | 21.5 ± 5.1 | 3.3 ± 2.5 | 0.0± 0.0 |
| Choriocarcinoma | JEG-3 | 43.3 ± 16.1 | 19.6 ± 11.3 | 23.6 ± 12.0 | 15.3 ± 2.8 |
| Lung | A549 | 62.0 ± 1.4 | 0.0 ± 0.0 | 0.0 ± 0.0 | 0.00 ± 0.0 |
| NCI-H460 | 27.5 ± 3.5 | 0.5 ± 0.7 | 1.5 ± 2.1 | 0.0 ± 0.0 | |
| Embyonic kidney cells | 293T | 28.3 ± 8.5 | 14.3 ± 10.1 | 4.33 ± 5.1 | 0.3 ± 0.5 |
| Primary fibroblasts | WT | 15.3 ± 12.2 | 5.2 ± 2.6 | 1.58 ± 0.5 | 0.2 ± 0.1 |
3.4. Annexin-V staining of cells treated with OLC
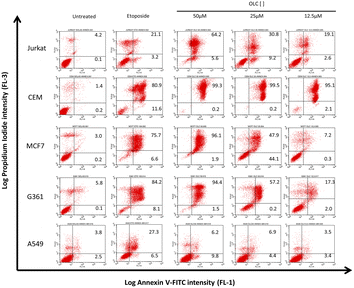
To confirm that the sub-G1 cells were suffering a process of apoptosis, we performed parallel experiments in which cells were also stained with Annexin-V, which binds to phosphatidylserine (PS) on membrane of cells undergoing apoptosis.21 OLC-treated cells showed a dose-dependent Annexin-V staining of all tumor cells analyzed except lung-derived lines, observing again that hematopoietic cells were highly sensitive (Fig. 4 and 5).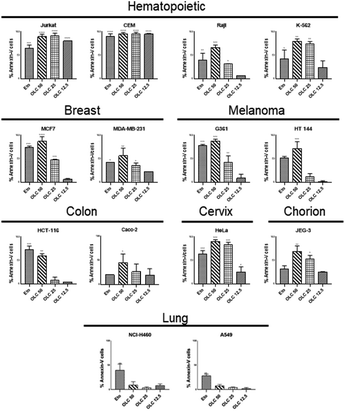 | ||
| Fig. 5 OLC induces PS translocation to the cell membrane on a panel of tumor cell lines. Cells were treated and analyzed as in Fig. 4 and the figure shows the mean ± SD of cells within the apoptotic quadrants from at least three independent experiments. Etoposide (100 μM) was used as positive control. Significance values are expressed over those of untreated cells. | ||
Interestingly, non-malignant embryonic kidney cells 293T and immortalized primary fibroblasts were refractory to OLC-induced effects (Fig. 6).
3.5. Induction of cell death by caspase dependent and independent mechanisms
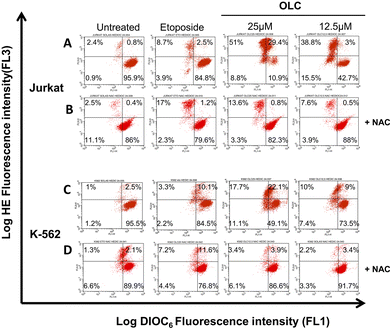
To determine whether caspases were activated upon OLC treatment, we carried out a time-course analysis by Western Blotting of caspases -9, -8 and -3 activation on Jurkat (Fig. 7A) and CEM (Fig. 7B). A rapid activation of caspases is readily detected by appearance of specific cleavage products with a concomitant decrease of the native form. Caspases activation peak at 4–6 h, except for caspase-3 in CEM cells (Fig. 7B), which shows a slower dynamic of appearance.Cell exposure to OLC resulted in the triggering of two mechanisms characteristic of the intrinsic apoptotic pathway, namely the production of ROS and the Δψm. A vigorous production of ROS can readily be detected after OLC treatment, which occurs simultaneously to the Δψm process as revealed by the DiOC6 probe (Fig. 8A and C). Pretreatment of cells with the anti-oxidant NAC markedly reduced the percentage of cells producing ROS, thus sustaining the specificity of the OLC-mediated process (Fig. 8B and D). Similar results were obtained with all other cell lines (data not shown).
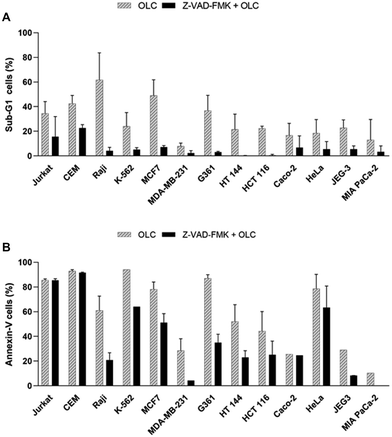
To gain additional evidence for the caspase-mediated cell death induced by OLC, all lines were pre-treated with the pan-caspase inhibitor Z-VAD-FMK, exposed to the compound and analyzed simultaneously by cell cycle (Fig. 9A) and Annexin-V staining (Fig. 9B). Whereas cell cycle analysis revealed a marked reduction in the percentage of sub-G1 cells in all Z-VAD-FMK-treated lines (Fig. 9A, solid columns) over their untreated controls (Fig. 9A, striped columns), this protection was not paralleled in cells analyzed by Annexin-V (Fig. 9B).
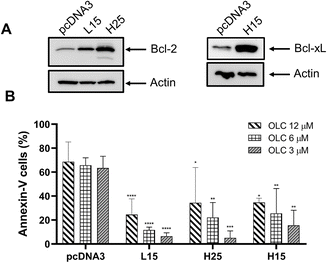
The involvement of the anti-apoptotic genes Bcl-2 and Bcl-xL was ascertained by using transfected Jurkat clones overexpressing those genes.18 Clones L15 and H25 express high levels of Bcl-2 protein as confirmed by Western Blotting analysis (Fig. 10A, left hand panel), whereas clone H15 has a high expression of Bcl-xL (Fig. 10A, right hand panel). Clones overexpressing anti-apoptotic genes showed a marked reduction in apoptotic cells over the mock-transfected controls (pCDNA3; empty plasmid) after OLC exposure (Fig. 10B).
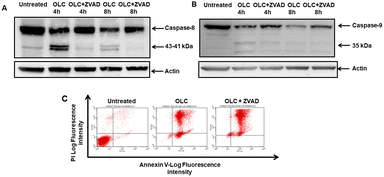
The apparent discrepancies observed between the percentage of apoptotic cells detected by cell cycle analyses and annexin-V staining (Table 1 and Fig. 5 and 9) prompted us to address cellular staining with the latter probe after documented blockade of caspases. Thus, Jurkat cells were pre-cultured, or not, with the Z-VAD-FMK pan-caspase inhibitor, exposed to OLC and simultaneously analyzed by Western Blotting and Annexin-V staining analyzed by flow cytometry. As expected, Z-VAD-FMK-treated cells showed an almost complete blockade in the activation of caspases-8 (Fig. 11A) and -9 (Fig. 11B), as revealed by inhibition of cleaved bands. However, the vigorous staining of OLC-treated cells with the Annexin-V probe was not modulated by the pre-incubation with Z-VAD-FMK (Fig. 11C).
4. Discussion
The biological activities of OLC have attracted significant interest from researchers over the last few years. OLC contributes to the antioxidant properties attributed to olive oil, a key component of the highly cardioprotective Mediterranean diet.1 In puzzling coincidence with those activities leading to cellular protection, health and survival, OLC has also strong anti-tumor capabilities in vitro and in vivo.7,11 This was observed in several tumor models such as prostate,22 colon,6,7 melanoma8 and, more extensively studied, breast.9,10,12 However, OLC actions over hematopoietic tumors have not been assessed, and its mechanisms leading to cell death remain not fully explained. Because of this, we carried out a comprehensive analysis of death-related mechanisms on an extended panel of tumor cells belonging to several tissue lineages.We found that OLC is able to block proliferation (Fig. 1) and induce cell death in most tumor cells analyzed at low doses, as revealed by colony survival assays and cell cycle analyses (Fig. 2, 3 and Table 1) and Annexin-V staining (Fig. 4 and 5). We found that OLC induces cell death on multiple tissues except lung carcinoma cell lines. Hematopoietic tumor cell lines, and T cell leukemias in particular, are most sensitive to OLC-induced death (Fig. 3, 4, 5 and 9). It is remarkable that non-tumor cells were resistant to the OLC-mediated proapoptotic effects, thus suggesting that OLC interferes with a critical signaling pathway of tumor biology. This could be of importance to establish putative chemotherapeutic approaches with reduced toxicity.
The observed ROS production and Δψm, lead to the opening of the mitochondrial permeability transition pore which, together with the rapid activation and cleavage of initiator caspases, are key elements of the intrinsic pathway of apoptosis.23 The critical role of caspases in the OLC-mediated death was further reinforced by the protection observed in cells overexpressing anti-apoptotic genes or pre-treated with a pan-caspase inhibitor. The structure of OLC makes it plausible that the compound triggers apoptosis after opening a mitochondrial pore and subsequent production of apoptotic mediators.
Cell cycle analyses (sub-G1 fraction) and Annexin-V staining are considered reliable methods for detecting apoptotic cells.20,21 Our results obtained in parallel by both methods, however, did not fully correlate, since the percentage of cells stained with Annexin-V was always higher than that of sub-G1 cells. Furthermore, the protection conferred by Z-VAD-FMK pretreatment was more extensively detected by cell cycle analyses than in Annexin-V staining. Although externalization of PS has been considered a distinctive phenomenon of apoptosis, growing evidence indicates that other processes may also trigger this translocation24 in a caspase-independent mechanism.25,26 Hence, collective data now clearly support that PS translocation is not restricted to apoptotic cells and it could also be observed in other cell death mechanisms such as necroptosis.27 To ascertain that OLC triggers cell death by apoptosis, and because apoptosis-mediated translocation of PS is dependent on caspase activation, we characterized the most relevant mediators involved in apoptotic pathways. Although our cumulative data clearly sustain the involvement of caspase-mediated apoptosis, the fact that complete blockade of caspases does not prevent PS appearance on the cell membrane (Fig. 11), together with the complete inhibition of colony formation on OLC-treated cells (Fig. 2) strongly suggest a complexity on the OLC-mediated death.
5. Conclusion
Taken together, our results support that OLC preferentially targets hematopoietic tumor cell lines and triggers at least two cell death mechanisms: the first being dependent on caspase activation and other mediators of the intrinsic pathway of apoptosis; and a second being independent of caspases but able to translocate PS to the cell membrane. Although necroptosis is a candidate for this second mechanism, a thorough research is needed to clarify this point, particularly in hematopoietic cells because these appear to be the main target of OLC.Author contributions
CP, STR, JOV, MJL and II performed investigation. SS, JA, MS and IJM contributed to conceptualization of the work. IJM performed investigation, supervised the overall research and wrote the paper.Conflicts of interest
There are no conflicts of interest to declare.Acknowledgements
This work was supported by grants A-CTS-480-UGR18 and B.CTS.690.UGR20 from Universidad de Granada-Junta de Andalucía and AAT-8GRA02 from Action for AT, United Kingdom charity.References
- R. Estruch, E. Ros, J. Salas-Salvado, M. I. Covas, D. Corella, F. Aros, E. Gomez-Gracia, V. Ruiz-Gutierrez, M. Fiol, J. Lapetra, R. M. Lamuela-Raventos, L. Serra-Majem, X. Pinto, J. Basora, M. A. Munoz, J. V. Sorli, J. A. Martinez, M. Fito, A. Gea, M. A. Hernan and M. A. Martinez-Gonzalez, Primary Prevention of Cardiovascular Disease with a Mediterranean Diet Supplemented with Extra-Virgin Olive Oil or Nuts, N. Engl. J. Med., 2018, 378, e34 CrossRef CAS.
- G. Montedoro, M. Servili, M. Baldioli, R. Selvaggini, E. Miniati and A. Macchioni, Simple and hydrolyzable compounds in virgin olive oil. 3. Spectroscopic characterizations of the secoiridoid derivatives, J. Agric. Food Chem., 1993, 41, 2228–2234 CrossRef CAS.
- G. K. Beauchamp, R. S. Keast, D. Morel, J. Lin, J. Pika, Q. Han, C. H. Lee, A. B. Smith and P. A. Breslin, Phytochemistry: ibuprofen-like activity in extra-virgin olive oil, Nature, 2005, 437, 45–46 CrossRef CAS.
- K. L. Pang and K. Y. Chin, The Biological Activities of Oleocanthal from a Molecular Perspective, Nutrients, 2018, 10, 570 CrossRef.
- A. Segura-Carretero and J. A. Curiel, Current Disease-Targets for Oleocanthal as Promising Natural Therapeutic Agent, Int. J. Mol. Sci., 2018, 19, 2899 CrossRef PubMed.
- A. Cusimano, D. Balasus, A. Azzolina, G. Augello, M. R. Emma, S. C. Di, R. Gramignoli, S. C. Strom, J. A. McCubrey, G. Montalto and M. Cervello, Oleocanthal exerts antitumor effects on human liver and colon cancer cells through ROS generation, Int. J. Oncol., 2017, 51, 533–544 CrossRef CAS.
- T. Pei, Q. Meng, J. Han, H. Sun, L. Li, R. Song, B. Sun, S. Pan, D. Liang and L. Liu, (-)-Oleocanthal inhibits growth and metastasis by blocking activation of STAT3 in human hepatocellular carcinoma, Oncotarget, 2016, 7, 43475–43491 CrossRef PubMed.
- Y. Gu, J. Wang and L. Peng, (-)-Oleocanthal exerts anti-melanoma activities and inhibits STAT3 signaling pathway, Oncol. Rep., 2017, 37, 483–491 CrossRef.
- M. A. Khanfar, S. K. Bardaweel, M. R. Akl and K. A. El Sayed, Olive Oil-derived Oleocanthal as Potent Inhibitor of Mammalian Target of Rapamycin: Biological Evaluation and Molecular Modeling Studies, Phytother. Res., 2015, 29, 1776–1782 CrossRef CAS.
- M. M. Mohyeldin, B. A. Busnena, M. R. Akl, A. M. Dragoi, J. A. Cardelli and K. A. El Sayed, Novel c-Met inhibitory olive secoiridoid semisynthetic analogs for the control of invasive breast cancer, Eur. J. Med. Chem., 2016, 118, 299–315 CrossRef CAS PubMed.
- N. M. Ayoub, A. B. Siddique, H. Y. Ebrahim, M. M. Mohyeldin and K. A. El Sayed, The olive oil phenolic (-)-oleocanthal modulates estrogen receptor expression in luminal breast cancer in vitro and in vivo and synergizes with tamoxifen treatment, Eur. J. Pharmacol., 2017, 810, 100–111 CrossRef CAS PubMed.
- R. Díez-Bello, I. Jardin, J. J. Lopez, H. M. El, J. Ortega-Vidal, J. Altarejos, G. M. Salido, S. Salido and J. A. Rosado, (-)Oleocanthal inhibits proliferation and migration by modulating Ca2+ entry through TRPC6 in breast cancer cells, Biochim. Biophys. Acta, Mol. Cell Res., 2019, 1866, 474–485 CrossRef.
- O. LeGendre, P. A. Breslin and D. A. Foster, (-)-Oleocanthal rapidly and selectively induces cancer cell death via lysosomal membrane permeabilization, Mol. Cell. Oncol., 2015, 2, e1006077 CrossRef.
- L. Goren, G. Zhang, S. Kaushik, P. A. S. Breslin, Y. N. Du and D. A. Foster, (-)-Oleocanthal and (-)-oleocanthal-rich olive oils induce lysosomal membrane permeabilization in cancer cells, PLoS One, 2019, 14, e0216024 CrossRef CAS PubMed.
- G. Kroemer, N. Zamzami and S. A. Susin, Mitochondrial control of apoptosis, Immunol. Today, 1997, 18, 44–51 CrossRef CAS.
- G. S. Salvesen and V. M. Dixit, Caspase activation: the induced-proximity model, Proc. Natl. Acad. Sci. U. S. A., 1999, 96, 10964–10967 CrossRef CAS.
- Y. Wang and T. D. Kanneganti, From pyroptosis, apoptosis and necroptosis to PANoptosis: A mechanistic compendium of programmed cell death pathways, Comput. Struct. Biotechnol. J., 2021, 19, 4641–4657 CrossRef CAS.
- C. Ruiz-Ruiz, G. K. Srivastava, D. Carranza, J. A. Mata, I. Llamas, M. Santamaria, E. Quesada and I. J. Molina, An exopolysaccharide produced by the novel halophilic bacterium Halomonas stenophila strain B100 selectively induces apoptosis in human T leukaemia cells, Appl. Microbiol. Biotechnol., 2011, 89, 345–355 CrossRef CAS.
- D. Carranza, S. Torres-Rusillo, G. Ceballos-Pérez, E. Blanco-Jimenez, M. Muñoz-López, J. L. García-Pérez and I. J. Molina, Reconstitution of the Ataxia-Telangiectasia cellular phenotype with lentiviral vectors, Front. Immunol., 2018, 9, 2703 CrossRef PubMed.
- Z. Darzynkiewicz, S. Bruno, B. G. Del, W. Gorczyca, M. A. Hotz, P. Lassota and F. Traganos, Features of apoptotic cells measured by flow cytometry, Cytometry, 1992, 13, 795–808 CrossRef CAS.
- G. Koopman, C. P. Reutelingsperger, G. A. Kuijten, R. M. Keehnen, S. T. Pals and M. H. van Oers, Annexin V for flow cytometric detection of phosphatidylserine expression on B cells undergoing apoptosis, Blood, 1994, 84, 1415–1420 CrossRef CAS.
- A. Y. Elnagar, P. W. Sylvester and K. A. El Sayed, (-)-Oleocanthal as a c-Met inhibitor for the control of metastatic breast and prostate cancers, Planta Med., 2011, 77, 1013–1019 CrossRef CAS PubMed.
- M. Redza-Dutordoir and D. A. verill-Bates, Activation of apoptosis signalling pathways by reactive oxygen species, Biochim. Biophys. Acta, 2016, 1863, 2977–2992 CrossRef CAS.
- L. J. Bendall and D. R. Green, Autopsy of a cell, Leukemia, 2014, 28, 1341–1343 CrossRef CAS.
- C. Ferraro-Peyret, L. Quemeneur, M. Flacher, J. P. Revillard and L. Genestier, Caspase-independent phosphatidylserine exposure during apoptosis of primary T lymphocytes, J. Immunol., 2002, 169, 4805–4810 CrossRef PubMed.
- K. Balasubramanian, B. Mirnikjoo and A. J. Schroit, Regulated externalization of phosphatidylserine at the cell surface: implications for apoptosis, J. Biol. Chem., 2007, 282, 18357–18364 CrossRef CAS.
- I. Shlomovitz, M. Speir and M. Gerlic, Flipping the dogma - phosphatidylserine in non-apoptotic cell death, Cell Commun. Signaling, 2019, 17, 139 CrossRef.
| This journal is © The Royal Society of Chemistry 2022 |

