 Open Access Article
Addition of grapes to both a standard and a high-fat Western pattern diet modifies hepatic and urinary metabolite profiles in the mouse†
Diren
Beyoğlu
 a,
Eun-Jung
Park
a,
Adolfo
Quiñones-Lombraña
a,
Eun-Jung
Park
a,
Adolfo
Quiñones-Lombraña
 ab,
Asim
Dave
a,
Falguni
Parande
a,
John M.
Pezzuto
 c and
Jeffrey R.
Idle
 *a
*a
aArnold & Marie Schwartz College of Pharmacy and Health Sciences, Long Island University, Brooklyn, New York, USA. E-mail: jeffidle@gmail.com
bDarwin Research Facility, Division of Biosciences, University College London, London, UK
cCollege of Pharmacy and Health Sciences, Western New England University, Springfield, Massachusetts, USA
First published on 20th July 2022
Abstract
The benefits of fruit and vegetable dietary consumption are largely defined in epidemiological terms. Relatively little is known about the discrete effects on metabolic pathways elicited by individual dietary fruits and vegetables. To address this, grape powder was added to both a standard and a high-fat Western pattern diet given to 10-week-old female C57BL/6J mice for a period of 91 days, whereupon 24 h urines were collected and the mice euthanized after a 12 h fast for the collection of liver tissue. Alterations in hepatic and urinary metabolite patterns were determined by gas chromatography-mass spectrometry-based metabolomics. Urinary excretion of the gut microbiota metabolites 4-hydroxyphenylacetic acid, 5-hydroxyindole, glyceric acid, gluconic acid and myo-inositol was attenuated when grape was added to the standard diet but the gut microbiota metabolites gluconic acid, scyllo-inositol, mannitol, xylitol, 5-hydroxyindole and 2-deoxyribonic acid were increased in urine when grape was added to the high-fat diet. Increased hepatic ascorbic acid and 5-oxoproline levels indicated the anti-oxidant effect of grape powder on the liver. Pathway enrichment analysis demonstrated that for both standard and high-fat diets, grape addition significantly upregulated the malate-aspartate shuttle indicating enhanced hepatic utilization of glucose via cytosolic glycolysis for mitochondrial ATP production. It is concluded that a grape diet reprogrammes gut microbiota metabolism, attenuates the hepatic oxidative stress of a high-fat diet and increases the efficiency of glucose utilization by the liver for energy production.
Introduction
It has long been suspected that diet is a contributor to overall cancer incidence and to mortality, but the results of prospective cohort studies have been inconclusive.1 In a meta-analysis and systematic review of cardiovascular disease mortality and cancer incidence in vegetarians, it was reported that vegetarians had a significantly lower ischemic heart disease mortality (−29%) and overall cancer incidence (−18%) than non-vegetarians.1 Various other dietary practices have reported associated health benefits, for example, a vegan diet,2 a ketogenic diet,3 a calorie restriction diet4 and a Mediterranean diet.5 One particular dietary custom that appears to provide long-term health benefits is consumption of up to 5 servings per day of fruit and vegetables.6 Unfortunately, the current average among US adults is 1 serving of fruit and 1.5 serving of vegetables, which is considered sub-optimal.7A recently emergent tool with which to investigate the biological effects of diet is metabolomics that studies the low molecular weight metabolites (<1.5 kDa) found in cells and organisms, usually through the analysis of plasma/serum or urine using mainly mass spectrometry or nuclear magnetic resonance spectroscopy technologies.8,9 For example, vegans and omnivores have been compared using metabolomics combined with metagenomic methods to characterize the gut microbiota. The study showed that plasma metabolite profiles were largely dependent upon diet rather than the composition of the gut microbiota.10 A targeted metabolomics investigation that evaluated plasma concentrations of 333 metabolites in persons consuming hypocaloric diets reported that diacylglycerides, triacylglycerides and branched-chain amino acids were biomarkers for individual diets, for example, low-fat diet versus low glycemic index diet versus very-low-carbohydrate diet.11 Metabolomic studies on the Mediterranean diet have been reviewed. Although the five studies had very different designs, a common feature was in plasma phospholipids with changes in gut microbial cometabolites, such as hippuric acid, phenacetylglutamine and p-cresol.11 Again, diet was the principal determinant of plasma metabolite profile, with some metabolites produced by the gut microflora.
The recent concept of precision nutrition or a precision diet seems to have been introduced in relation to the seasonal adjustment of diet to yield the maximum milk production in dairy cattle.12 More recently for humans, it has been recognized that population averages, upon which dietary guidelines are based, may not be best suited to an individual with, say, type 2 diabetes. Therefore, new public health precision nutrition strategies have been proposed with the aim of preventing type 2 diabetes and its complications.13 In order to evaluate an individual's response to individual foods or dietary patterns, metabolomics has been proposed as vital to nearly every aspect of precision nutrition, from characterizing the thousands of chemicals in foods to monitoring biochemical responses to certain foods or to particular diets.14 In relation to this, the concept of biomarkers of food intake (BFI) has emerged. One particular example is development of metabolomic biomarkers for the consumption of various types of berry and of grapes, with resveratrol and tartaric acid proposed as BFIs for grape consumption.15
In relation to the health benefits of dietary fruit consumption, many investigations have focussed on grapes and their chemical constituents.16 For example, human grape consumption improved endothelial dysfunction and reduced plasma lipids,17 both risk factors for ischaemic heart disease. The biological and clinical activities of grapes are thought to be due to phenolic compounds that comprise less than 0.05% of the overall grape composition. These include simple phenols, simple phenolic acids, cinnamic acids, stilbenes, proanthocyanidins, anthocyanins, flavonoids, flavans, resveratrol and carotenoids.18 There exists a vast literature on the effects of these natural phenols on health and disease. Of particular note are studies of the stilbene resveratrol that is found in the skin of grapes. The landmark discovery that resveratrol inhibited tumorigenesis in a mouse skin cancer model19 was followed by two decades of research focused on the cancer preventative role of resveratrol in breast, cervical, uterine, blood, kidney, liver, eye, bladder, thyroid, esophageal, prostate, brain, lung, skin, gastric, colon, head and neck, bone, ovarian, and cervical cancer.20 There is growing scepticism that the biological effects of a diet enhanced with grape powder are due to resveratrol, which itself is rapidly metabolized and poorly bioavailable.21 For this reason alone, a metabolomic understanding of dietary grape consumption is indicated.
In order to understand better the metabolic effects conferred by grapes, we have investigated in mice the addition of grape powder to both a standard mouse diet and a high-fat Western pattern diet. In this investigation, metabolomic profiles of plasma and liver elicited by the addition of grape powder to both the standard (STD) and high-fat diets (HFD) are reported.
Materials and methods
Diets and animals
To study the potential impact of dietary grapes we have used freeze-dried grape powder as a surrogate for fresh grapes to ensure consistency and continuity in clinically translational experimental research. The grape powder is composed of fresh seeded and seedless red, green and black grapes that are freeze-dried and ground to retain their bioactive compounds.22 The product is subjected to chemical and microbial analyses to assure quality.For the current study, standardized freeze-dried grape powder was supplied in vacuum-sealed packets by the California Table Grape Commission (Fresno, CA) and stored at −20° C. Based on the composition of grapes, isocaloric diets were custom designed and produced by Envigo (Madison, WI), as follows: 4% fat standard diet (STD), STD + 5% (w/w) standardized grape powder (STD5GP), 42% fat high-fat diet (HFD) and HFD + 5% (w/w) standardized grape powder (HFD5GP) (Table 1). As described previously, the addition of grape powder in this fashion to this diet does not significantly affect the consumption rate.23
| Constituent | STD | STD5GP | HFD | HFD5GP |
|---|---|---|---|---|
| Formula | g kg−1 | g kg−1 | g kg−1 | g kg−1 |
| Casein | 195 | 195 | 195 | 195 |
| D,L-Methionine | 3 | 3 | 3 | 3 |
| Sucrose | 191 | 191 | 191 | 191 |
| Dextrose, anhydrous | 66.5 | 44.3 | 64.5 | 44.3 |
| Fructose | 66.5 | 44.3 | 64.5 | 44.3 |
| Corn starch | 235 | 232 | 167 | 161 |
| Maltodextrin | 100 | 100 | 0 | 0 |
| Anhydrous milk fat | 30 | 29.9 | 210 | 210 |
| Soybean oil | 10 | 10 | 0 | 0 |
| Cholesterol | 0 | 0 | 1.5 | 1.5 |
| Cellulose | 50 | 50 | 50 | 50 |
| Mineral mix AIN-76 (170915) | 35 | 35 | 35 | 35 |
| Potassium citrate monohydrate | 4.0 | 2.7 | 4.0 | 2.7 |
| Calcium carbonate | 4 | 4 | 4 | 4 |
| Vitamin mix, Teklad (40060) | 10 | 10 | 10 | 10 |
| Ethoxyquin, antioxidant | 0.04 | 0.04 | 0.04 | 0.04 |
| Grape powder, freeze-dried | 0 | 50 | 0 | 50 |
Forty female C57BL/6J mice were obtained from The Jackson Laboratory (Bar Harbor, ME) at 6-weeks-of-age and placed on the STD. At 10-weeks-of-age, the mice were randomly divided into four groups (n = 10 per each group). One group was continued on the STD, and the remaining three and were placed on STD5GP, HFD, or HFD5GP (Table 1) for 91 days. The mice were housed in temperature and humidity-controlled cages with HEPA filters and were provided with bio-huts and wooden blocks for rodent enrichment. Water and food were provided ad libitum. A chip with a unique identification number was implanted in each mouse. The body weight for each mouse was recorded each week until the sacrifice. This study was approved by the Animal Care and Use Committee of Long Island University (protocol number 19-07).
Urine and tissue collection
After receiving the respective diets for a period of 91 days, mice were individually placed in Tecniplast metabolic chambers designed for a single mouse (with single chamber feeder). Chambers were placed in a temperature (22 °C) and humidity controlled room. Food and water were provided ad libitum and consumption was recorded. After allowing for acclimation to housing in a metabolic cage, 24-hour urine specimens were collected. Accordingly, urine appearing in the collection chamber, as well as any droplets on the support guide or the collection funnel, was placed in a glass vial. Any urine droplets which were solidified in the collection funnel were recovered with water. Next, water was added to the specimens such that final volume of each sample was 3 mL. Samples were then placed in 15 mL conical tubes and stored at −20 °C prior to further processing and metabolomic analysis. Following urine collection, euthanasia was performed with 100% CO2 gas, after fasting for 12 h. Liver was harvested, the right lateral and caudate lobes were removed by dissection, snap frozen (liquid nitrogen) and stored at −80 °C prior to metabolomic analysis.For preparation of liver extracts for gas chromatography-mass spectrometry (GCMS) analysis, approximately 50 mg of each mouse liver (weighed accurately) was homogenized in aqueous methanol (50![[thin space (1/6-em)]](https://www.rsc.org/images/entities/char_2009.gif) :
:![[thin space (1/6-em)]](https://www.rsc.org/images/entities/char_2009.gif) 50 v/v; 1.0 mL) containing 4-chlorophenylacetic acid (4-CPAA; 0.1 mM) as internal standard for GCMS. All samples were kept on ice and homogenized for 20 s with a Fisherbrand bead homogenizer, spun at 14
50 v/v; 1.0 mL) containing 4-chlorophenylacetic acid (4-CPAA; 0.1 mM) as internal standard for GCMS. All samples were kept on ice and homogenized for 20 s with a Fisherbrand bead homogenizer, spun at 14![[thin space (1/6-em)]](https://www.rsc.org/images/entities/char_2009.gif) 500g for 20 min at 4 °C. Supernatants were split into 2 × 400 μL aliquots to each of which was added acetonitrile (400 μL), vortexed and stood on ice for 20 min and then spun at 14
500g for 20 min at 4 °C. Supernatants were split into 2 × 400 μL aliquots to each of which was added acetonitrile (400 μL), vortexed and stood on ice for 20 min and then spun at 14![[thin space (1/6-em)]](https://www.rsc.org/images/entities/char_2009.gif) 500g for 20 min at 4 °C. Supernatants (700 μL each) were kept at −20 °C until analysis. QC samples were prepared by pooling equal aliquots of each sample.
500g for 20 min at 4 °C. Supernatants (700 μL each) were kept at −20 °C until analysis. QC samples were prepared by pooling equal aliquots of each sample.
GCMS analysis
For the analysis of thawed urines, aliquots (100 μL) were incubated at room temperature for 30 min with an aqueous solution (1 mg mL−1) of urease type III (Sigma-Aldrich, St Louis, MO) (100 μL), followed by addition of 800 μL cold methanol and centrifugation at 14![[thin space (1/6-em)]](https://www.rsc.org/images/entities/char_2009.gif) 500g for 20 min at 4 °C.24 Each supernatant from liver or urine was transferred to a screw-top glass tube to which was added acetonitrile (1 mL) and then reduced to dryness in a Savant evaporating centrifuge in vacuo at 40 °C for 2 h. To each dry residue was added ultra-pure pyridine (100 μL) and BSTFA containing 1% TMCS (100 μL), the tubes tightly capped, vortexed and heated at 75 °C for 30 min to silylate amino acids, organic acids and sugars to render them volatile for analysis by GCMS. Samples were analysed by GCMS using slight variations of our published methods.25–28 All samples were analysed in duplicate. A typical run involved injection of a solvent blank, followed by five QC samples, nine randomized analytical samples, one QC, nine randomized analytical samples, one QC, and finally four randomized analytical samples, ending with a QC sample. Samples (0.2 μL) were injected into an Agilent 7890B gas chromatograph interfaced with an Agilent 5977B MSD using an Agilent 7693 autosampler. Samples were injected in splitless mode at 250 °C into a 30 m HP-5MS column (250 μm i.d; 0.25 μm film thickness). The carrier gas was Helium (1 ml min−1). The oven was programmed at 70 °C initial temperature for 5 min, then 7 °C min−1 to 250 °C and held for 8.3 min. The total run time was 39 min. Spectral data were collected throughout the chromatogram from 45–600 m/z at 5 scans per sec. Metabolites were identified from a QC sample using the AutoQuant routine of Agilent's ChemStation software by matching spectra with authentic metabolite spectra in the NIST 14 spectral library which comprises 242
500g for 20 min at 4 °C.24 Each supernatant from liver or urine was transferred to a screw-top glass tube to which was added acetonitrile (1 mL) and then reduced to dryness in a Savant evaporating centrifuge in vacuo at 40 °C for 2 h. To each dry residue was added ultra-pure pyridine (100 μL) and BSTFA containing 1% TMCS (100 μL), the tubes tightly capped, vortexed and heated at 75 °C for 30 min to silylate amino acids, organic acids and sugars to render them volatile for analysis by GCMS. Samples were analysed by GCMS using slight variations of our published methods.25–28 All samples were analysed in duplicate. A typical run involved injection of a solvent blank, followed by five QC samples, nine randomized analytical samples, one QC, nine randomized analytical samples, one QC, and finally four randomized analytical samples, ending with a QC sample. Samples (0.2 μL) were injected into an Agilent 7890B gas chromatograph interfaced with an Agilent 5977B MSD using an Agilent 7693 autosampler. Samples were injected in splitless mode at 250 °C into a 30 m HP-5MS column (250 μm i.d; 0.25 μm film thickness). The carrier gas was Helium (1 ml min−1). The oven was programmed at 70 °C initial temperature for 5 min, then 7 °C min−1 to 250 °C and held for 8.3 min. The total run time was 39 min. Spectral data were collected throughout the chromatogram from 45–600 m/z at 5 scans per sec. Metabolites were identified from a QC sample using the AutoQuant routine of Agilent's ChemStation software by matching spectra with authentic metabolite spectra in the NIST 14 spectral library which comprises 242![[thin space (1/6-em)]](https://www.rsc.org/images/entities/char_2009.gif) 466 spectra. A total of 89 chromatographic peaks were matched to library spectra. In cases of ambiguity, where the spectra were similar, for example with isomeric sugars, such as glucose, galactose, fructose and mannose, authentic standards were employed to determine retention times. These manipulations were conducted using the AutoQuant feature of ChemStation, whereby peak identification was made and peak area calculated by comparison of a target ion and three qualifier ions with the NIST 14 spectral library. An Excel spreadsheet was then created using Quant Browser that contained peak area ratios (area of peak/area of I.S. peak, equivalent to relative concentrations) for all identified metabolites. This data matrix was then imported into SIMCA 17 in order to conduct multivariate data analysis. Univariate data analysis was performed by the nonparametric Mann Whitney test using GraphPad Prism 9.3.1. p-Values were adjusted for multiple comparisons using the Bonferroni correction. Data were plotted as means ± s.e.m. Pathway enrichment analysis was conducted using MetaboAnalyst 5.0 (https://www.metaboanalyst.ca/MetaboAnalyst/home.xhtml).
466 spectra. A total of 89 chromatographic peaks were matched to library spectra. In cases of ambiguity, where the spectra were similar, for example with isomeric sugars, such as glucose, galactose, fructose and mannose, authentic standards were employed to determine retention times. These manipulations were conducted using the AutoQuant feature of ChemStation, whereby peak identification was made and peak area calculated by comparison of a target ion and three qualifier ions with the NIST 14 spectral library. An Excel spreadsheet was then created using Quant Browser that contained peak area ratios (area of peak/area of I.S. peak, equivalent to relative concentrations) for all identified metabolites. This data matrix was then imported into SIMCA 17 in order to conduct multivariate data analysis. Univariate data analysis was performed by the nonparametric Mann Whitney test using GraphPad Prism 9.3.1. p-Values were adjusted for multiple comparisons using the Bonferroni correction. Data were plotted as means ± s.e.m. Pathway enrichment analysis was conducted using MetaboAnalyst 5.0 (https://www.metaboanalyst.ca/MetaboAnalyst/home.xhtml).
Statistical analysis
Multivariate data analysis was conducted using SIMCA 17 (Sartorius Stedim Data Analytics AB, Umeå, Sweden). Means of paired samples for each mouse, together with the QC samples, were first analyzed by unsupervised principal components analysis (PCA) to observe the general shape of the data, the presence of any outliers and the position of the QC samples in the PCA scores plot. Next, the data were analyzed by supervised orthogonal projection to latent structures-discriminant analysis (OPLS-DA) and the findings expressed as a scores plot and a loadings S-plot. To ensure that the data were not overmodeled a PLS-DA model for each data set was built and subjected to leave-one-out cross validation with 200 permutations. Values of R2 and Q2 that decayed below 0.3 and zero, respectively, indicated lack of overmodeling.Univariate statistics were conducted using GraphPad Prism (v. 9.4.0; GraphPad Software, San Diego, CA) using unpaired Student's t-test with Bonferroni correction for multiple comparisons.
Results
Mouse body weight
Starting at the age of 91 days, the difference in body weight between the STD group (21.00 ± 1.57 g) and the HFD group (23.57 ± 2.45 g) achieved statistical significance (p = 0.012). As summarized in Table 2, at the end of the experimental period, the body weight difference between the STD and the STD5GP groups did not differ, nor did the difference between the HFD and the HFD5GP groups. The body weights of the HFD groups were significantly greater than the respective groups placed on STD or STD5GP.| Diet groups | Average ± SD (in g) | Median (in g) | Number |
|---|---|---|---|
| STD | 24.13 ± 1.67 | 23.58 | 10 |
| STD5GP | 22.93 ± 2.30 | 23.36 | 10 |
| HFD | 33.23 ± 4.48 | 33.27 | 10 |
| HFD5GP | 32.07 ± 5.79 | 30.91 | 10 |
STD vs. STD5GP, p = 0.1985; HFD vs. HFD5GP, p = 0.6224; STD vs. HFD, p < 0.0001; STD5GP vs. HFD5GP, p = 0.0002.
Effect on the urine metabolite profile by the addition of 5% grape powder to the standard diet (STD → STD5GP)
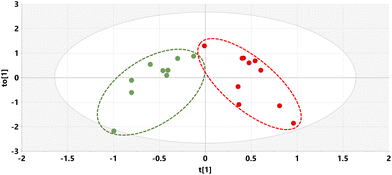
The relative concentrations of the 89 identified chromatographic peaks from GCMS analysis were analysed for the urines (n = 10) for both the STD and STD5GP groups of mice using multivariate data analysis. This generated an orthogonal projection to latent structures-discriminant analysis (OPLS-DA) scores plot (Fig. 1) and loadings S-plot (Fig. 2) as described.25–28 A principal components analysis (PCA) scores plot showing clustering of the QC sample scores is shown in ESI Fig. S1.†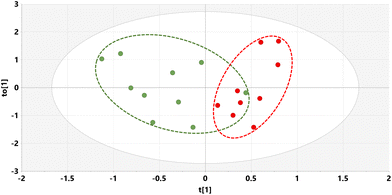 | ||
| Fig. 1 OPLS-DA scores plot for mouse urine on STD (green) and STD5GP diets (red) with one outlier (red) excluded. | ||
The OPLS-DA model gave an almost complete separation and a clustering of the two urine sets. The data were tested for over-fitting to the model using 200 permutations of a leave-one-out cross-validation25 and the model found to be valid (ESI Fig. S2†).
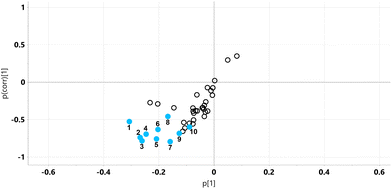
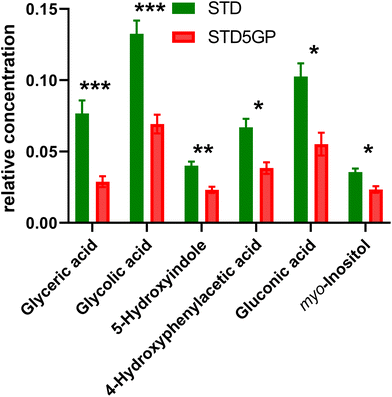
The relative concentrations of the altered metabolites identified in the OPLS-DA loadings S-plot (Fig. 2), after Bonferroni correction of their p-values, are displayed in Fig. 3.
Major fold changes were observed for the urinary glucose oxidation product gluconic acid and the most statistically significant decreases (corrected p < 0.001) were for the related small metabolites glyceric acid and glycolic acid. Two downregulated metabolites were derived from gut microbiota metabolism, 5-hydroxyindole and 4-hydroxyphenylacetic acid.
Effect on the liver metabolite profile by the addition of 5% grape powder to the standard diet (STD → STD5GP)
Supernatants from mouse liver homogenates were also investigated by GCMS and the resulting raw data analyzed by multivariate analysis yielding an OPLS-DA scores plot (Fig. 4) and a loadings S-plot (Fig. 5).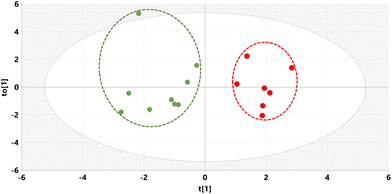 | ||
| Fig. 4 OPLS-DA scores plot for mouse liver on STD (green) and STD5GP diets (red) with outliers deleted. | ||
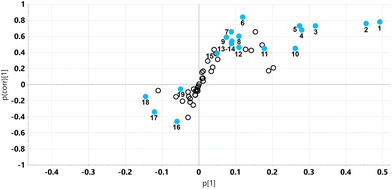
As can be seen from the scores plot, there is clustering and complete separation of the mouse liver homogenates from the STD and STD5GP diets. The data were found not to be over-fitted to the OPLS-DA model (ESI Fig. S3†). Examination of the loadings S-plot (Fig. 5) revealed 15 upregulated and four downregulated metabolites in liver related to the addition of grape powder to the mouse diet (uncorrected p < 0.05).
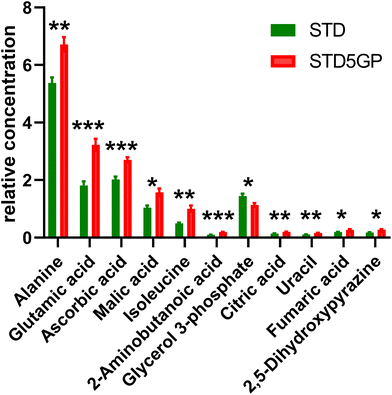
The relative concentrations of the altered metabolites identified in the OPLS-DA loadings S-plot (Fig. 5) are displayed in Fig. 6.
The two most abundant metabolites found in mouse liver, glucose and galactose, were not altered by addition of grape powder to the diet, as was the TCA cycle metabolite succinic acid (data not shown). However, two other TCA metabolites, malic acid and fumaric acid, were both elevated by grape powder. An end product of cytosolic glycolysis, alanine, was elevated in the liver by the grape diet. Increase in other hepatic amino acids due to the grape diet was also observed, including glutamic acid, isoleucine and glycine (in the form of the analytical artefact formed from dimerization of glycine,29 2,5-dihydroxypyrazine). Hepatic ascorbic acid was also upregulated by the grape diet.
Effect on the urine metabolite profile by the addition of 5% grape powder to the high-fat Western pattern diet (HFD → HFD5GP)
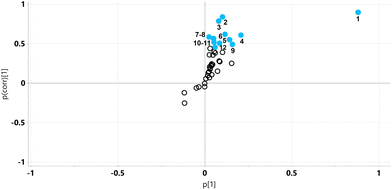
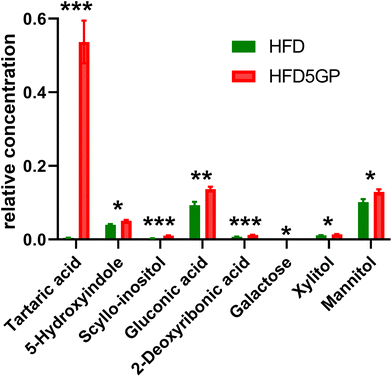
The relative concentrations of the 89 identified chromatographic peaks from GCMS analysis were analysed for the urines (n = 10) for both the HFD and HFD5GP groups of mice using multivariate data analysis. This generated an OPLS-DA scores plot (Fig. 7) and loadings S-plot (Fig. 8). Cross-validation showed that the OPLS-DA model was valid (ESI Fig. S4†).The relative concentrations of the altered metabolites identified in the OPLS-DA loadings S-plot (Fig. 8) are shown in Fig. 9.
Urinary tartaric acid levels were elevated 120-fold in mice fed the HFD after the addition of the grape diet (HFD5GP), consistent with the concept that tartaric acid is a BFI (see above) for grape consumption.15 Among the gut microbiota metabolites, 5-hydroxyindole was elevated but not 4-hydroxyphenylacetic acid. Several urinary polyols were elevated by grape, including xylitol, mannitol and scyllo-inositol. The glucose oxidation product gluconic acid was also elevated after addition of grape powder to the diet.
Effect on the liver metabolite profile by the addition of 5% grape powder to the high-fat Western pattern diet (HFD → HFD5GP)
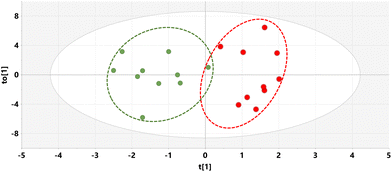
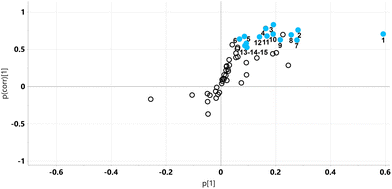
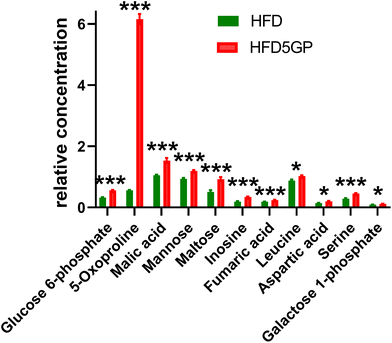
The relative concentrations of the 89 identified chromatographic peaks from GCMS analysis were analysed in liver homogenates (n = 10) for both the HFD and SHFD5GP groups of mice using multivariate data analysis. This generated an OPLS-DA scores plot (Fig. 10) and loadings S-plot (Fig. 11). The OPLS-DA model was shown to be valid by cross-validation (ESI Fig. S5†).The relative concentrations of the altered metabolites identified in the OPLS-DA loadings S-plot (Fig. 11) are shown in Fig. 12.
The key observation of the addition of grape powder to the high-fat diet was 12-fold increase in hepatic 5-oxoproline levels (Fig. 12). We determined the mRNA expression for each study group using qPCR. However, no differences in gene expression for this enzyme were found. The data are shown in ESI Fig. S6†. Hepatic amino acids leucine, aspartic acid and serine were also elevated, together with mannose, maltose, glucose 6-phosphate and galactose 1-phosphate. The TCA intermediates malic acid and fumaric acid were also elevated in liver after addition of grape powder.
The addition of grape powder to a standard and to a high-fat diet had a differential impact on both the urinary and hepatic metabolomes (Table 3). The effect of grapes on the urinary metabolite pattern differed greatly between the standard diet and the high-fat diet, with not one single metabolic change congruent between the two. The general pattern for the STD to STD5GP transition was a decline in the concentrations of urinary metabolites, while for the HFD to HFD5GP transition, the general pattern was an elevation in urinary metabolites. The effect of grapes on hepatic metabolites was more similar between the two diets, with upregulation of fumaric acid and malic acid when grape powder was included in either the standard or the high-fat diet. Tartaric acid, a biomarker of grape consumption, interestingly appeared elevated in urine only for mice fed the high-fat diet. In order to gain better insights into the differences elicited by grape powder in healthy and fatty livers, pathway enrichment analysis was employed using the upregulated metabolites. The findings are shown in Fig. 13. Of intense interest was the finding that the malate-aspartate shuttle was the most prominent statistically significantly elevated pathway for both the healthy and fatty livers treated with a grape diet.
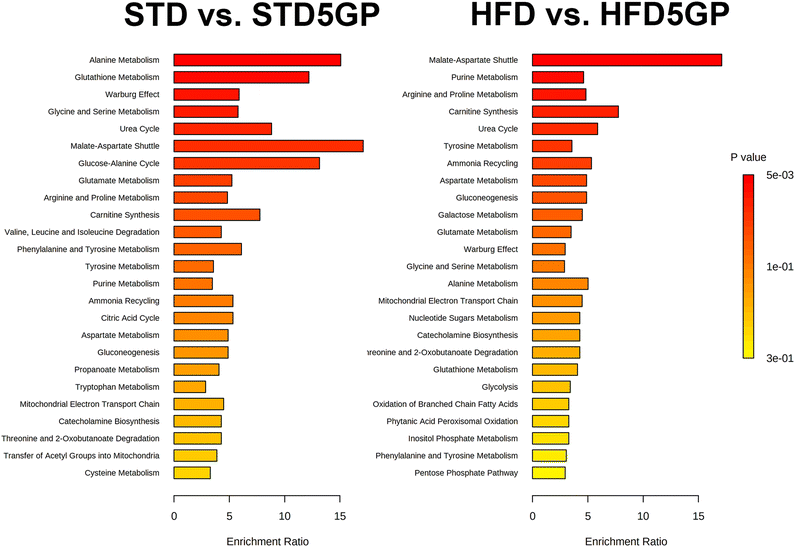 | ||
| Fig. 13 Pathway enrichment analysis for the effect of grape powder on the metabolic pathways of the liver. | ||
| Metabolite | STD → STD5GP | HFD → HFD5GP | ||
|---|---|---|---|---|
| Urine | Liver | Urine | Liver | |
| Galactose | ↑ | |||
| Mannose | ↑ | |||
| Maltose | ↑ | |||
| Glucose 6-phosphate | ↑ | |||
| Galactose 1-phosphate | ↑ | |||
| Gluconic acid | ↓ | ↑ | ||
| myo-Inositol | ↓ | |||
| scyllo-Inositol | ↑ | |||
| Ascorbic acid | ↑ | |||
| Mannitol | ↑ | |||
| Xylitol | ↑ | |||
| Alanine | ↑ | |||
| Glutamic acid | ↑ | |||
| Isoleucine | ↑ | |||
| 2-Aminobutanoic acid | ↑ | |||
| Leucine | ↑ | |||
| Aspartic acid | ↑ | |||
| Serine | ↑ | |||
| Glycine | ↑ | |||
| 5-Oxoproline | ↑ | |||
| Pyruvic acid | ||||
| Fumaric acid | ↑ | ↑ | ||
| Malic acid | ↑ | ↑ | ||
| Citric acid | ↑ | |||
| Glycerol 3-phosphate | ↓ | |||
| Inosine | ↑ | |||
| Uracil | ↑ | |||
| Glyceric acid | ↓ | |||
| Glycolic acid | ↓ | |||
| 2-Deoxyribonic acid | ↑ | |||
| tartaric acid | ↑ | |||
| 5-Hydroxyindole | ↓ | ↑ | ||
| 4-Hydroxyphenylacetic acid | ↓ | |||
Discussion
Metabolites occupy the focal point between the downstream output of the genome (endogenous metabolites) and the upstream input from the environment (exogenous metabolites).30 When a drug is administered to animals or humans, urine for example contains both metabolites formed directly from the drug (exogenous metabolites) and metabolites arising from biochemical pathways that have been altered by the drug (endogenous metabolites). In order to distinguish between these two types of metabolite, we introduced a novel procedure called “mass isotopomer-guided decluttering of metabolomic data” that requires the second administration of a stable isotope-labelled dose of the drug.8 This methodology was successful in separating and identifying the exogenous metabolites from the endogenous metabolites after Acetaminophen (paracetamol) administration to the mouse.8 However, in the case of metabolomic investigation of dietary manipulation, these methods cannot be applied. Nonetheless, because the principal biochemical constituents of table grapes were known,22 it was possible to identify urinary and hepatic metabolites that derived directly from the STD5GP and HFD5GP diets. For example, tartaric acid represented the majority of the organic acids in grape berries, together with citric, fumaric and lactic acids.31 Interestingly, tartaric acid displayed a 120-fold increase in urine with HFD → HFD5GP, but did not increase in urine for STD → STD5GP or in the liver tissues for both these experiments. Tartaric acid undergoes microbial degradation, as first observed by Pasteur, who found that (+)-tartaric acid was consumed by microorganisms in preference to (−)-tartaric acid.32 A number of bacterial species have been reported to metabolize tartaric acid to oxaloacetic, glyoxylic and glyceric acids.33,34 The administration of HFD to mice is known to reduced microbial diversity, abundance of butyric acid-producing bacteria, and some other beneficial bacteria, including Lactobacillus, Clostridium sensu stricto, Prevotella, and Alloprevotella, but increased conditional pathogenic bacteria, such as Bacteroides, Alistipes, and Anaerotruncus.35 It would appear that the HFD resulted in the abolition of presystemic microbial metabolism of tartaric acid, resulting in its considerably increased urinary excretion. However, the addition of grape powder to the HFD abolished this effect of dysbiosis, reducing urinary excretion to that seen for the STD and STD5GP diets. Therefore, investigations into the composition of the gut microbiota after administration of diets containing grape powder will be required.The addition of grape powder to the standard diet (STD → STD5GP) produced a simple outcome, the attenuated urinary excretion of gut microbiota metabolites, in particular, 4-hydroxyphenylacetic acid (from polyphenols36), 5-hydroxyindole (from 5-hydroxytryptophan37), glyceric acid (from tartaric acid34), gluconic acid (from fructose38) and myo-inositol (from phytic acid39). Interestingly, this pattern of diminished gut microbiota metabolites was not recapitulated when grape powder was added to the high-fat diet (HFD → HFD5GP). In stark contrast, the urinary excretion of certain gut microbiota metabolites, such as gluconic acid, scyllo-inositol, mannitol, xylitol,40 5-hydroxyindole and 2-deoxyribonic acid41 was enhanced.
Regarding hepatic metabolites, the patterns for the two experiments STD → STD5GP and HFD → HFD5GP were more similar than the urinary patterns. Neither showed changes in glucose and galactose, but grape powder elevated hepatic glucose 6-phosphate and galactose 1-phosphate in the HFD livers, indicating that the principal monosaccharides glucose and galactose31 in grape powder lead to increased production of their phosphate esters. Glucose 6-phosphate is an intermediate in both glycolysis and the pentose phosphate pathway. Of interest are the patterns of amino acids elevated in both healthy and fatty livers after the addition of grape powder to the diet. In the case of STD → STD5GP, the amino acids glycine, alanine, isoleucine and 2-aminobutanoic acid were elevated. In the case of HFD → HFD5GP, leucine, aspartic acid and serine were upregulated, both essential and nonessential amino acids. One likely source of amino acids is the cow's milk casein present in the diet. The major amino acids comprising casein are leucine, lysine, valine and isoleucine.42 Effects of grape on the digestion of casein and other dietary protein is unlikely to explain the amino acid changes observed.
The major metabolic alteration in liver when grape powder was added to the HFD, was the 12-fold increase (corrected p < 0.001) in hepatic 5-oxoproline. As measured by mRNA expression of the Ggct gene, no increased breakdown of glutathione could be inferred by γ-glutamyl cyclotransferases.43 Nevertheless this may be a measure of increased turnover of glutathione in response to oxidative stress caused by the HFD and consistent with our observation in another study that expression of glutathione S-transferase P1 was upregulated 5-fold.44 By analysis of the upregulated hepatic metabolites using MetaboAnalyst, it was found that the malate-aspartate shuttle was the predominant pathway altered by the addition of grape in both the standard diet and high-fat diet experiments. This shuttle exists to transfer electrons in the form of NADH from the cytosol, where that are produced by glycolysis, across the inner membrane of the mitochondrion, to be used by oxidative phosphorylation to produce ATP. The mitochondrial inner membrane is impermeable to NADH. Oxaloacetate + NADH are used to make malate + NAD+ and the malate crosses into the mitochondrial matrix where it is converted back to oxaloacetate + NADH.45 A secondary NADH trans-mitochondrial membrane transporter is the glycerol 3-phosphate shuttle.46 In the livers of mice receiving the STD5GP diet, the levels of glycerol 3-phosphate were diminished, suggesting a dominance of the malate-aspartate shuttle in connecting cytosolic glucose metabolism with mitochondrial energy production. It is apparent that a major consequence of the addition of grape powder to the diet of mice, both on a standard and on a high-fat diet was the upregulation of the malate-aspartate shuttle that should permit elevated mitochondrial ATP production.
In another report, we have investigated using global gene expression analysis on dietary grape consumption by mice also maintained on a standard diet and on a high-fat diet. The HFD mice developed fatty liver, which was ameliorated by the administration of the grape powder. The results suggested the potential of dietary grapes to modulate hepatic gene expression, prevent oxidative damage, induce fatty acid metabolism, ameliorate NAFLD, and increase longevity, when co-administered with a high-fat diet.44
Conclusions
It is concluded that the addition of grape powder to both STD and HFD induces measurable changes to the urinary and hepatic metabolic phenotypes of female C57BL/6J mice. Of particular note was an attenuation in urinary excretion of gut microbiota metabolites when grape was added to the STD but an increase in urinary excretion of other gut microbiota metabolites when grape was added to the HFD. As a measure of reduced oxidative stress in the liver by addition of grape to either diet, hepatic ascorbic acid levels were increased. Similarly, glutathione turnover was increased, as measured by hepatic 5-oxoproline levels. Pathway enrichment analysis showed that the malate-aspartate shuttle was the principal statistically significantly enhanced metabolic pathway by addition of grape to either diet. This demonstrates that a grape diet increases hepatic utilisation of glucose via cytosolic glycolysis linked with mitochondrial energy production.Author contributions
Conceptualization, DB, JMP, JRI; funding acquisition, DB, JMP, JRI; project administration, DB, EJP, JMP, JRI; investigation, DB, EJP, AQL, AD, FP; writing – original draft, JRI; writing – review & editing, DB, JMP.Conflicts of interest
JMP serves on the scientific advisory board of the California Table Grape Commission. There are no other conflicts to declare.Acknowledgements
DB and JRI acknowledge grant support from the California Table Grape Commission and seed grant funding from Long Island University. The California Table Grape Commission was not involved: in the preparation of the article; in study design; in the collection, analysis and interpretation of data; in the writing of the report; and in the decision to submit the article for publication.References
- T. Huang, B. Yang, J. Zheng, G. Li, M. L. Wahlqvist and D. Li, Cardiovascular disease mortality and cancer incidence in vegetarians: a meta-analysis and systematic review, Ann. Nutr. Metab., 2012, 60, 233–240 CrossRef CAS PubMed.
- G. Marrone, C. Guerriero, D. Palazzetti, P. Lido, A. Marolla, F. Di Daniele and A. Noce, Vegan Diet Health Benefits in Metabolic Syndrome, Nutrients, 2021, 13, 817 CrossRef CAS PubMed.
- K. Dowis and S. Banga, The Potential Health Benefits of the Ketogenic Diet: A Narrative Review, Nutrients, 2021, 13, 1654 CrossRef CAS PubMed.
- A. Napoleao, L. Fernandes, C. Miranda and A. P. Marum, Effects of Calorie Restriction on Health Span and Insulin Resistance: Classic Calorie Restriction Diet vs. Ketosis-Inducing Diet, Nutrients, 2021, 13, 1302 CrossRef CAS PubMed.
- M. Guasch-Ferre and W. C. Willett, The Mediterranean diet and health: a comprehensive overview, J. Intern. Med., 2021, 290, 549–566 CrossRef CAS PubMed.
- D. D. Wang, Y. Li, S. N. Bhupathiraju, B. A. Rosner, Q. Sun, E. L. Giovannucci, E. B. Rimm, J. E. Manson, W. C. Willett, M. J. Stampfer and F. B. Hu, Fruit and Vegetable Intake and Mortality: Results From 2 Prospective Cohort Studies of US Men and Women and a Meta-Analysis of 26 Cohort Studies, Circulation, 2021, 143, 1642–1654 CrossRef CAS PubMed.
- Z. Conrad, K. Chui, L. Jahns, C. J. Peters and T. S. Griffin, Characterizing trends in fruit and vegetable intake in the USA by self-report and by supply-and-disappearance data: 2001-2014, Public Health Nutr., 2017, 20, 3045–3050 CrossRef PubMed.
- D. Beyoglu, Y. Zhou, C. Chen and J. R. Idle, Mass isotopomer-guided decluttering of metabolomic data to visualize endogenous biomarkers of drug toxicity, Biochem. Pharmacol., 2018, 156, 491–500 CrossRef CAS PubMed.
- D. Beyoglu and J. R. Idle, Metabolomic and Lipidomic Biomarkers for Premalignant Liver Disease Diagnosis and Therapy, Metabolites, 2020, 10, 50 CrossRef CAS PubMed.
- G. D. Wu, C. Compher, E. Z. Chen, S. A. Smith, R. D. Shah, K. Bittinger, C. Chehoud, L. G. Albenberg, L. Nessel, E. Gilroy, J. Star, A. M. Weljie, H. J. Flint, D. C. Metz, M. J. Bennett, H. Li, F. D. Bushman and J. D. Lewis, Comparative metabolomics in vegans and omnivores reveal constraints on diet-dependent gut microbiota metabolite production, Gut, 2016, 65, 63–72 CrossRef CAS PubMed.
- Q. Jin, A. Black, S. N. Kales, D. Vattem, M. Ruiz-Canela and M. Sotos-Prieto, Metabolomics and Microbiomes as Potential Tools to Evaluate the Effects of the Mediterranean Diet, Nutrients, 2019, 11, 207 CrossRef CAS PubMed.
- R. R. White and J. L. Capper, Precision diet formulation to improve performance and profitability across various climates: Modeling the implications of increasing the formulation frequency of dairy cattle diets, J. Dairy Sci., 2014, 97, 1563–1577 CrossRef CAS PubMed.
- D. D. Wang and F. B. Hu, Precision nutrition for prevention and management of type 2 diabetes, Lancet Diabetes Endocrinol., 2018, 6, 416–426 CrossRef PubMed.
- M. LeVatte, A. H. Keshteli, P. Zarei and D. S. Wishart, Applications of Metabolomics to Precision Nutrition, Lifestyle Genomics, 2022, 15, 1–9 CrossRef PubMed.
- M. Ulaszewska, M. Garcia-Aloy, N. Vazquez-Manjarrez, M. T. Soria-Florido, R. Llorach, F. Mattivi and C. Manach, Food intake biomarkers for berries and grapes, Genes Nutr., 2020, 15, 17 CrossRef CAS PubMed.
- J. M. Pezzuto, Grapes and Health, Springer International Publishing AG, Switzerland, 2016, DOI:10.1007/978-3-319-28995-3.
- M. L. Fernandez and J. Barona, in Grapes and Health, ed. J. M. Pezzuto, Springer International Publishing, Switzerland, 2016, DOI:10.1007/978-3-319-28995-3_4.
- M. Gross, in Grapes and Health, ed. J. M. Pezzuto, Springer International Publishing AG, Switzerland, 2016, DOI:10.1007/978-3-319-28995-3_3.
- M. Jang, L. Cai, G. O. Udeani, K. V. Slowing, C. F. Thomas, C. W. Beecher, H. H. Fong, N. R. Farnsworth, A. D. Kinghorn, R. G. Mehta, R. C. Moon and J. M. Pezzuto, Cancer chemopreventive activity of resveratrol, a natural product derived from grapes, Science, 1997, 275, 218–220 CrossRef CAS PubMed.
- A. Rauf, M. Imran, M. S. Butt, M. Nadeem, D. G. Peters and M. S. Mubarak, Resveratrol as an anti-cancer agent: A review, Crit. Rev. Food Sci. Nutr., 2018, 58, 1428–1447 CrossRef PubMed.
- A. P. Singh, R. Singh, S. S. Verma, V. Rai, C. H. Kaschula, P. Maiti and S. C. Gupta, Health benefits of resveratrol: Evidence from clinical studies, Med. Res. Rev., 2019, 39, 1851–1891 CrossRef CAS PubMed.
- R. B. van Breemen, B. Wright, Y. Li, D. Nosal and T. Burton, in Grapes and Health, ed. J. M. Pezzuto, Springer Nature, Switzerland, 2016, pp. 17–26, DOI:10.1007/978-3-319-28995-3.
- T. Joshi, I. Patel, A. Kumar, V. Donovan and A. S. Levenson, Grape Powder Supplementation Attenuates Prostate Neoplasia Associated with Pten Haploinsufficiency in Mice Fed High-Fat Diet, Mol. Nutr. Food Res., 2020, 64, e2000326 CrossRef PubMed.
- F. Palmas, M. Mussap and C. Fattuoni, Urine metabolome analysis by gas chromatography-mass spectrometry (GC-MS): Standardization and optimization of protocols for urea removal and short-term sample storage, Clin. Chim. Acta, 2018, 485, 236–242 CrossRef CAS PubMed.
- D. Beyoglu, S. Imbeaud, O. Maurhofer, P. Bioulac-Sage, J. Zucman-Rossi, J. F. Dufour and J. R. Idle, Tissue metabolomics of hepatocellular carcinoma: tumor energy metabolism and the role of transcriptomic classification, Hepatology, 2013, 58, 229–238 CrossRef CAS PubMed.
- N. Semmo, T. Weber, J. R. Idle and D. Beyoglu, Metabolomics reveals that aldose reductase activity due to AKR1B10 is upregulated in hepatitis C virus infection, J. Viral Hepatitis, 2015, 22, 617–624 CrossRef CAS PubMed.
- M. Wang, A. Keogh, S. Treves, J. R. Idle and D. Beyoglu, The metabolomic profile of gamma-irradiated human hepatoma and muscle cells reveals metabolic changes consistent with the Warburg effect, PeerJ, 2016, 4, e1624 CrossRef PubMed.
- J. R. Idle, K. Seipel, U. Bacher, T. Pabst and D. Beyoglu, (2R,3S)-Dihydroxybutanoic Acid Synthesis as a Novel Metabolic Function of Mutant Isocitrate Dehydrogenase 1 and 2 in Acute Myeloid Leukemia, Cancers, 2020, 12, 2842 CrossRef CAS PubMed.
- L. J. Haffenden and V. A. Yaylayan, Mechanism of formation of redox-active hydroxylated benzenes and pyrazine in 13C-labeled glycine/D-glucose model systems, J. Agric. Food Chem., 2005, 53, 9742–9746 CrossRef CAS PubMed.
- D. S. Wishart, Emerging applications of metabolomics in drug discovery and precision medicine, Nat. Rev. Drug Discovery, 2016, 15, 473–484 CrossRef CAS PubMed.
- W. M. Kliewer, Sugars and Organic Acids of Vitis vinifera, Plant Physiol., 1966, 41, 923–931 CrossRef CAS PubMed.
- J. Gal, The discovery of biological enantioselectivity: Louis Pasteur and the fermentation of tartaric acid, 1857–a review and analysis 150 years later, Chirality, 2008, 20, 5–19 CrossRef CAS PubMed.
- R. E. Hurlbert and W. B. Jakoby, Tartaric Acid Metabolism. I. Subunits of L(+)-Tartaric Acid Dehydrase, J. Biol. Chem., 1965, 240, 2772–2777 CrossRef CAS PubMed.
- L. D. Kohn and W. B. Jakoby, Tartaric acid metabolism. 3. The formation of glyceric acid, J. Biol. Chem., 1968, 243, 2465–2471 CrossRef CAS PubMed.
- C. Kong, R. Gao, X. Yan, L. Huang and H. Qin, Probiotics improve gut microbiota dysbiosis in obese mice fed a high-fat or high-sucrose diet, Nutrition, 2019, 60, 175–184 CrossRef CAS PubMed.
- S. Bazzocco, I. Mattila, S. Guyot, C. M. Renard and A. M. Aura, Factors affecting the conversion of apple polyphenols to phenolic acids and fruit matrix to short-chain fatty acids by human faecal microbiota in vitro, Eur. J. Nutr., 2008, 47, 442–452 CrossRef CAS PubMed.
- B. Waclawikova, A. Bullock, M. Schwalbe, C. Aranzamendi, S. A. Nelemans, G. van Dijk and S. El Aidy, Gut bacteria-derived 5-hydroxyindole is a potent stimulant of intestinal motility via its action on L-type calcium channels, PLos Biol., 2021, 19, e3001070 CrossRef CAS PubMed.
- M. Zhang, L. Gu, C. Cheng, J. Ma, F. Xin, J. Liu, H. Wu and M. Jiang, Recent advances in microbial production of mannitol: utilization of low-cost substrates, strain development and regulation strategies, World J. Microbiol. Biotechnol., 2018, 34, 41 CrossRef PubMed.
- S. E. Wu, S. Hashimoto-Hill, V. Woo, E. M. Eshleman, J. Whitt, L. Engleman, R. Karns, L. A. Denson, D. B. Haslam and T. Alenghat, Microbiota-derived metabolite promotes HDAC3 activity in the gut, Nature, 2020, 586, 108–112 CrossRef CAS PubMed.
- L. C. Lew, Y. Y. Hor, M. H. Jaafar, A. S. Lau, B. Y. Khoo, S. Sasidharan, S. B. Choi, K. L. Ong, T. Kato, Y. Nakanishi, H. Ohno and M. T. Liong, Effects of Potential Probiotic Strains on the Fecal Microbiota and Metabolites of D-Galactose-Induced Aging Rats Fed with High-Fat Diet, Probiotics Antimicrob. Proteins, 2020, 12, 545–562 CrossRef CAS PubMed.
- L. Chen, C. Y. Cheng, H. Choi, M. K. Ikram, C. Sabanayagam, G. S. Tan, D. Tian, L. Zhang, G. Venkatesan, E. S. Tai, J. J. Wang, P. Mitchell, C. M. Cheung, R. W. Beuerman, L. Zhou, E. C. Chan and T. Y. Wong, Plasma Metabonomic Profiling of Diabetic Retinopathy, Diabetes, 2016, 65, 1099–1108 CrossRef CAS PubMed.
- S. Rafiq, N. Huma, I. Pasha, A. Sameen, O. Mukhtar and M. I. Khan, Chemical Composition, Nitrogen Fractions and Amino Acids Profile of Milk from Different Animal Species, Asian-Australas. J. Anim. Sci., 2016, 29, 1022–1028 CrossRef CAS PubMed.
- A. Kumar, S. Tikoo, S. Maity, S. Sengupta, S. Sengupta, A. Kaur and A. K. Bachhawat, Mammalian proapoptotic factor ChaC1 and its homologues function as gamma-glutamyl cyclotransferases acting specifically on glutathione, EMBO Rep., 2012, 13, 1095–1101 CrossRef CAS PubMed.
- A. Dave, E. J. Park, A. Kumar, F. Parande, D. Beyoglu, J. R. Idle and J. M. Pezzuto, Consumption of grapes modulates gene expression, reduces non-alcoholic fatty liver disease, and extends longevity in female C57BL/6J mice provided with a high-fat western-pattern dietConsumption of grapes modulates gene expression, reduces non-alcoholic fatty liver disease, and extends longevity in female C57BL/6J mice provided with a high-fat western-pattern diet, Foods, 2022, 11, 1984 CrossRef CAS PubMed.
- P. Borst, The malate-aspartate shuttle (Borst cycle): How it started and developed into a major metabolic pathway, IUBMB Life, 2020, 72, 2241–2259 CrossRef CAS PubMed.
- S. Liu, S. Fu, G. Wang, Y. Cao, L. Li, X. Li, J. Yang, N. Li, Y. Shan, Y. Cao, Y. Ma, M. Dong, Q. Liu and H. Jiang, Glycerol-3-phosphate biosynthesis regenerates cytosolic NAD(+) to alleviate mitochondrial disease, Cell Metab., 2021, 33, 1974–1987.e9 CrossRef CAS PubMed.
Footnote |
| † Electronic supplementary information (ESI) available. See DOI: https://doi.org/10.1039/d2fo00961g |
| This journal is © The Royal Society of Chemistry 2022 |

