
 Open Access Article
 This Open Access Article is licensed under a
 Creative Commons Attribution 3.0 Unported Licence
Oral processing behaviours of liquid, solid and composite foods are primarily driven by texture, mechanical and lubrication properties rather than by taste intensity
Karina
Gonzalez-Estanol
 *abc,
Maddalena
Libardi
b,
Franco
Biasioli
a and
Markus
Stieger
bd
*abc,
Maddalena
Libardi
b,
Franco
Biasioli
a and
Markus
Stieger
bd
aDepartment of Food Quality and Nutrition, Edmund Mach Foundation, San Michele all'Adige, TN, Italy. E-mail: karina.gonzalezestanol@fmach.it
bFood Quality and Design, Wageningen University, Wageningen, The Netherlands
cDepartment of Agri-food and Environmental Sciences, Trento University, Trento, Italy
dDivision of Human Nutrition and Health, Wageningen University, Wageningen, The Netherlands
First published on 12th April 2022
Abstract
The aim of this study was to understand the influence of saltiness and sweetness intensity on oral processing behaviours of liquid, solid and composite foods. As salty foods, tomato sauce (liquid), penne pasta (solid) and their combination (composite food) were used at two levels of saltiness intensity (low/high). As sweet foods, strawberry sauce (liquid), milk gels (solid) and their combination (composite foods) were used at two levels of sweetness intensity (low/high). Saltiness, sweetness, hardness, chewiness, and liking were quantified using generalized labelled magnitude scales (gLMS). Oral processing behaviours were determined using video recordings (n = 39, mean age 25 ± 3 years) in a home-use-test (HUT) providing fixed bite sizes for all foods. As expected, taste intensity differed significantly between samples within the same food category. No significant effects of taste intensity on oral processing behaviours were found for sweet and salty foods. As expected, consistency strongly affected the consumption time per bite, number of chews per bite, number of chews per gram and eating rate. Solid foods were masticated for the longest time with the highest number of chews per bite, followed by composite foods as the liquid added to the solid foods enhanced lubrication. Liquid foods were masticated for the shortest time. We conclude that large differences in saltiness and sweetness intensity of liquid, solid and composite foods cause no differences in oral processing behaviours. We suggest that oral processing behaviours are primarily driven by texture, mechanical and lubrication properties of foods rather than by their taste intensity.
1. Introduction
Food oral processing behaviour plays an important role in taste and texture perception of foods.1,2 The combined action of mastication and salivation leads to breakdown of foods and bolus formation allowing a safe swallow.3,4 During oral processing of many solid foods, the total surface area of food particles increases, which facilitates the release of taste compounds from the food matrix into saliva, enhancing taste perception.5–7 Differences in oral processing behaviours can cause changes in sensory perception of foods. Doyennette et al. (2019) showed that dynamic texture and flavour perception of ice creams depends on consumption style.8 Similarly, Devezeaux de Lavergne et al. showed that dynamic sensory perception of sausages differs between consumers varying in eating speed.2Oral processing behaviours not only depend on anatomical and physiological consumer characteristics9,10 but also depend on physicochemical, rheological, mechanical and tribological properties of foods.11,12 Wee et al. (2018) determined instrumental texture properties and oral processing behaviours of a wide range of solid foods (n = 59). They reported that less adhesive, more springy, chewy and resilient solid foods require a greater number of chews.54 Aguayo-Mendoza et al. (2018) showed that for liquid and semi-solid foods, oral behaviours were driven by rheological food properties. Consumption time of liquid and semi-solid foods correlated positively with consistency (viscosity at shear rate of 1 s−1), while for solid foods, positive correlations between oral behaviours such as number of chews and eating rate and Young's modulus were found.13 Other authors found positive relationships between hardness of solid foods and oral behavioural parameters such as masticatory force, jaw muscle activity, movement of the lower jaw and chewing cycle duration.11,14,15 It was also shown that dry foods require more chewing cycles compared to moist foods, since incorporation of saliva into the bolus is needed to prepare a food bolus that is sufficiently lubricated to be swallowed safely.11,16 Mechanical properties of foods do not only impact oral behaviours, but also sensory properties. For a variety of foods, increasing food hardness resulted in decreased flavour intensity.17–22 While it is well known that rheological, mechanical, texture and lubrication properties of foods strongly affect oral behaviours and sensory perception, less attention has been paid to the effect of taste properties on oral processing behaviours. It has been shown that mild bitterness of model gels does not affect chewing muscle activity and chewing frequency.23 In a follow up study, Neyraud et al. (2005) used viscoelastic gels with varying concentration of quinine and measured masticatory muscle activities. A shorter mastication time (fewer bites, less muscle effort) and longer clearance time was observed with increasing bitterness.24 Using salted chewing gums, Neyraud et al. (2003) observed that with incrementing saltiness intensity, chewing activity and salivation increased.25 De Wijk et al. (2006) used M-mode ultrasound imaging to characterize oral movements during the consumption of custards differing in viscosity and sweetness. A higher sweetness intensity resulted in an increased oral processing time and oral movements. However, oral movements were quantified as the relative change in the ultrasound images from one moment to the next and were not reported in terms of numbers of chews or eating rate.26 Bolhuis et al. (2011) showed that oro-sensory exposure time was not influenced by saltiness intensity of soups.27 More recently, Lasschuijt et al. (2017) demonstrated that neither number of chews, chewing duration, chewing rate nor eating rate were affected by sweetness intensity of model gels.28 The afore summarized literature shows that the mechanisms underlying the influence of taste intensity on oral processing behaviours are not fully understood and largely depend on the food studied, stressing the complexity of the phenomena involved. When modifications of the taste properties are accompanied by changes in the texture or mechanical properties of the foods, then an increase in muscular activity or changes in oral processing behaviour can be caused by an adaptation of oral behaviour to the changes in food texture. When modifications of the taste properties are realized while maintaining texture or mechanical properties of the foods, then peripheral information originating from temperature and taste receptors might be signalled in the brain which could affect mastication behaviour.29 Thus, it has been suggested that cognitive processes, in addition to reflex control, can influence oral processing and mastication behaviour of foods with similar texture and mechanical properties but differing in taste properties.26,30,31 Nevertheless, only few studies accounted for food liking and/or familiarity when assessing oral processing behaviours. Results have been inconsistent and largely depend on the food that was studied. Forde et al. (2017) and Bellisle and Le Magnen (1980) showed that for solid foods, liking was negatively correlated with chews per bite and chewing time.32,33 However, other studies showed no relationships between liking and oral processing behaviours.34,35 Brown and Braxton (2000) identified that individuals use different mechanisms for the oral breakdown of food, and thus suggested that individual differences in the ability to manipulate and manage the product in the mouth may influence individual preferences of food.36 Bellisle et al. (2000) showed that highly palatable foods were swallowed after minimal chewing, although the meal duration was longer with more palatable foods.37 More recently, Aguayo-Mendoza et al. (2018) showed that liking, familiarity, and consumption frequency had little impact on oral processing behaviours in comparison to rheological and mechanical properties of foods.13
Most studies investigating the relations between oral processing behaviours and sensory properties of foods have been conducted with model foods or single foods. However, in reality, foods are most commonly consumed in combination with other foods, thus studying heterogeneous foods, composite foods and meals and their impact on oral processing behaviours resembles closer the natural consumption context.38 Composite foods are usually characterized by a product composed of various single foods which differ in composition, mechanical properties and sensory characteristics.39 Oral processing behaviours of composite foods differ from those of single foods.39 Differences are attributed to the influence that one food component can have on the breakdown and lubrication properties of the accompanying food during oral processing.40,41 For example, the addition of spreads such as butter, cheese spread and mayonnaise to a dry carrier such as bread, toast or cracker, decreased number of chewing cycles and increased eating rate compared to the dry carriers alone.39,42 It was also shown that an increase in hardness and viscosity of composite foods reduced eating rate.38,39,43
To the best of our knowledge, oral processing behaviours of liquid, solid and composite foods varying in taste intensity have not been studied systematically yet. The aim of this study was to understand the influence of saltiness and sweetness intensity on oral processing behaviours of liquid, solid and composite foods. In addition, potential differences in oral processing behaviours between composite foods and solid foods and the effect of liking on oral processing behaviours were explored in a home-use-test (HUT). We hypothesize that (i) taste intensity influences oral behaviours of liquid foods as texture properties are less dominant in liquid foods, and that (ii) taste intensity has no effect on oral behaviours of solid and composite foods as their mechanical properties are the main driver of oral behaviour. Lastly, we hypothesize that (iii) solid foods require longer chewing time per bite and greater number of chews per bite compared to composite foods, as the liquid food assists in lubricating the bolus.
2. Materials and methods
2.1 Samples
An overview of all foods and their bite sizes is provided in Table 1. Two sets of foods differing in taste modality (sweet, salty) were investigated. Within each set, foods varying in consistency (3 levels: liquid, solid, composite) and tastant concentration (2 levels: low, high) were prepared. As salty foods, tomato sauce (liquid), penne pasta (solid) and their combination (composite food) were used at two levels of saltiness intensity (low, high). As sweet foods, strawberry sauce (liquid), milk gels (solid) and their combination (composite foods) were used at two levels of sweetness intensity (low, high). Fig. 1 displays how foods were provided for the home-use-test (HUT). | ||
| Fig. 1 Visualization of all salty (A) and sweet (B) foods used in the home-use-test (HUT). | ||
| Taste modality | Consistency | Food | Taste intensity | Code | Bite/sip size |
|---|---|---|---|---|---|
| Salty foods | Liquid | Tomato sauce | Low | T_LS | 10 mL |
| High | T_HS | 10 mL | |||
| Solid | Pasta penne | Low | P_LS | Three pieces of penne (9 g in total) | |
| High | P_HS | Three pieces of penne (9 g in total) | |||
| Composite | Pasta penne + tomato sauce | Low | PT_LS | Three pieces of penne + 10 mL of sauce (19 g in total) | |
| High | PT_HS | Three pieces of penne + 10 mL of sauce (19 g in total) | |||
| Sweet foods | Liquid | Strawberry sauce | Low | S_LSW | 10 mL |
| High | S_HSW | 10 mL | |||
| Solid | Milk gel | Low | M_LSW | One milk gel cube (8 g) | |
| High | M_HSW | One milk gel cube (8 g) | |||
| Composite | Milk gel + strawberry sauce | Low | MS_LSW | One milk gel cube + 10 mL of sauce (18 g in total) | |
| High | MS_HSW | One milk gel cube + 10 mL of sauce (18 g in total) | |||
Commercially available tomato sauce was used (Albert Heijn, Tomaten Passata). For the low salt condition, the original tomato sauce was used (0.5 w/w% NaCl). For the high salt condition, table salt was added to the tomato sauce (3.0 w/w% NaCl). Both tomato sauces were cooked in a pot until boiling, after which they were left at room temperature to cool down, then refrigerated overnight (4 °C) and poured into serving cups (10 mL) for the evaluations. Commercially available pasta penne were used (Albert Heijn, Penne). 500 g of pasta penne (4.5 × 1.4 cm (length × diameter); 3 g per piece) were cooked for 11 minutes in 2 L of boiling water (100 °C) and sieved. For the low salt condition, 250 g of the cooked pasta penne were put in 62.5 mL of salted water (1% w/w NaCl), cooled to room temperature, refrigerated overnight (4 °C), sieved and put in serving containers (9 pieces, 27 g in total) for HUT evaluations. For the high salt condition, 250 g of the cooked pasta was put in 62.5 mL of salted water (10% w/w NaCl), let cool at room temperature, refrigerated overnight (4 °C), sieved and put in serving containers (9 pieces, 27 g in total) for HUT evaluations.
To prepare the salty composite foods, 9 pieces of penne (27 g) were combined with 30 mL of tomato sauce. Pasta penne were always combined with tomato sauce of the same saltiness intensity condition, so low/low or high/high. To avoid changes in the consistency of the pasta during storage caused by addition of tomato sauce, composite foods were placed in separate containers and were only mixed right before tasting by the participant at their home.
To prepare liquid strawberry sauces differing in sweetness, an aqueous solution of 0.5 w/w% (low sweetness condition) or 3.5 w/w% (high sweetness condition) sweetener (Stevia, Albert Heijn, The Netherlands) was added to commercially available strawberry jam (Céréal, Glucoregul) in a 1![[thin space (1/6-em)]](https://www.rsc.org/images/entities/char_2009.gif) :1 ratio and mixed with an electric mixer (Bourgini, 500 W) for 10 s. The strawberry sauce was poured into containers (10 mL) for HUT evaluations. As sweet solid foods, milk gel cubes (2 × 2 × 2 cm (length × width × height); 8 g per cube) were prepared. Full fat milk (Albert Heijn, The Netherlands) was boiled with 4 w/w% granulated sugar (Albert Heijn, The Netherlands) and 5 w/w% gelatine (Dr Oetker, The Netherlands) in a pot. Low sweetness milk gel cubes were prepared by adding 0.3 w/w% stevia (Albert Heijn, The Netherlands) and high sweetness milk gel cubes by adding 3.5 w/w% stevia to the hot liquid. The hot, liquid mixture was poured into cubic moulds, solidified in the refrigerator (4 °C) overnight and put in the evaluation containers (3 cubes, 24 g in total). Composite foods were prepared by adding 30 mL of strawberry sauce to three milk gel cubes (24 g in total) of similar sweetness intensity (low/low; high/high). To avoid any changes in consistency of solid foods, composite foods were kept separately and were only mixed by the participants at home immediately before tasting.
:1 ratio and mixed with an electric mixer (Bourgini, 500 W) for 10 s. The strawberry sauce was poured into containers (10 mL) for HUT evaluations. As sweet solid foods, milk gel cubes (2 × 2 × 2 cm (length × width × height); 8 g per cube) were prepared. Full fat milk (Albert Heijn, The Netherlands) was boiled with 4 w/w% granulated sugar (Albert Heijn, The Netherlands) and 5 w/w% gelatine (Dr Oetker, The Netherlands) in a pot. Low sweetness milk gel cubes were prepared by adding 0.3 w/w% stevia (Albert Heijn, The Netherlands) and high sweetness milk gel cubes by adding 3.5 w/w% stevia to the hot liquid. The hot, liquid mixture was poured into cubic moulds, solidified in the refrigerator (4 °C) overnight and put in the evaluation containers (3 cubes, 24 g in total). Composite foods were prepared by adding 30 mL of strawberry sauce to three milk gel cubes (24 g in total) of similar sweetness intensity (low/low; high/high). To avoid any changes in consistency of solid foods, composite foods were kept separately and were only mixed by the participants at home immediately before tasting.
All salty and sweet foods were placed in separate closed containers and kept in the refrigerator (4 °C) until the testing session. The bite size for the evaluation of each sample was fixed (Table 1) and determined in a preliminary study with a focus group who was not taking part in the main study (n = 10, 60% female). In the preliminary study participants were served with larger amounts of all foods and were asked to consume the solid and composite foods with a fork as they would normally do and to consume the liquid foods by drinking from a cup as they would normally do. The weight balance before and after consumption was determined to obtain the natural bite size for each food in the preliminary study which was then fixed for the main study (Table 1).
2.2 Participants
Fifty-five naive participants were recruited for this study via social media and posters. After recruitment, participants filled in an online screening questionnaire (Qualtrics, USA, September 2020). Inclusion criteria included to be non-smoker, good dental health, no missing teeth (except wisdom teeth), no piercings or braces in the mouth, no dental surgery in the last six months, no food allergies to the products of the study (i.e. no lactose intolerance) and not being pregnant nor lactating. Participants should not have a history of olfactory, gustatory, swallowing or chewing disorders (self-reported). After inclusion, participants gave written informed consent before the start of the study and received financial compensation for their participation. From the fifty-five recruited participants, six were not eligible. From the forty-nine eligible, n = 39 naive and untrained participants completed the HUT study (25 ± 3 years; 28 females). Most of the participants were students of Wageningen University.2.3 Experimental design
The study consisted of two HUT sessions: one for the sensory assessment (section 2.3.1) and one for the characterization of oral processing behaviours (section 2.3.2). The order of both HUT sessions was counterbalanced across participants and there was a wash out period of one week in between HUT sessions.On the day of each HUT session, participants were asked to collect the samples at Wageningen University campus and to perform the test within 2 hours at their home. In each HUT session, participants evaluated all samples (six salty foods, six sweet foods). Participants were randomly assigned to start either with the salty or the sweet foods and were instructed to take a 10 min break between the two sets. Within each set, the order of samples was randomised across food consistency (liquid, solid and composite food) and tastant concentration (high and low). All samples were coded with random three-digit codes.
2.4 Data analysis
Normality of all dependent variables was checked, and non-normal distributed data was subjected to either square or log10 transformation for data analysis.46 All results are reported as mean and standard deviation on the original data as they are considered more representative than the transformed data used for the statistical data analysis. All analyses were done separately for salty and sweet foods. Unless stated otherwise, statistical analysis was done using R software (R Core Team, 2020). A level of significance of p < 0.05 was chosen. Data were checked for the effect of presentation order in which the sensory or oral behaviour characterization HUT session was done and for hunger level before evaluations and neither had a significant effect on any of the sensory attributes (p > 0.05). To determine whether saltiness and sweetness manipulations affected taste and perceived texture, mean intensity scores of each of the sensory attributes (saltiness, sweetness, hardness, chewiness) were calculated and a linear mixed model (LMM)46,47 was performed for each attribute individually for salty and sweet foods. Food consistency (liquid, solid, composite foods), gender (female, male), level of tastant concentration (high, low), liking scores and the interaction between food consistency and tastant concentration, were considered as fixed effects while participant was treated as random effect. Pairwise comparisons were conducted using Tukey post hoc tests when significant differences were present. To determine whether liking scores were affected by perceived taste and consistency, mean liking scores of each sample were calculated. LMM was performed individually for salty and sweet foods. Food consistency (liquid, solid, composite foods), gender (female, male), level of tastant concentration (high, low), and the interaction between food consistency and tastant concentration were considered as fixed effects while participant was treated as random effect. Pairwise comparisons were conducted using Tukey post hoc tests when significant differences were present.To determine whether tastant intensity manipulation affected oral behaviours, means of consumption time per bite (s), consumption time per gram (s g−1), chewing rate (chews per s), number of chews per bite (-), number of chews per gram (chews per g) and eating rate (g min−1) were calculated and analysed individually using LMM. For each model, tastant concentration (high, low), food consistency (liquid, solid, composite), gender (female, male), liking scores and the interaction between tastant intensity and food consistency were set as fixed effects and participants as random effect. Pairwise comparisons were conducted using Tukey post hoc tests when significant differences were present. Pearson correlation coefficients were calculated to assess inter-relationships between all oral processing behaviour variables.
3. Results
3.1 Sensory evaluation
Saltiness intensity was significantly and considerably higher for the high salt liquid, solid and composite foods compared to their low salt counterparts (Fig. 2A) (F(1200.84) = 513.06, p < 0.001). The interaction between sweetness intensity and consistency was significant (F(2186.09) = 12.42, p < 0.001). High sweet liquid and solid foods were perceived significantly (p < 0.05) sweeter than their low sweet counterparts (Fig. 2C) whereas sweetness did not differ significantly (p > 0.05) between high and low sweet composite foods. Sweet foods differed to a lesser extent in taste intensity compared to salty foods (Fig. 2A and C).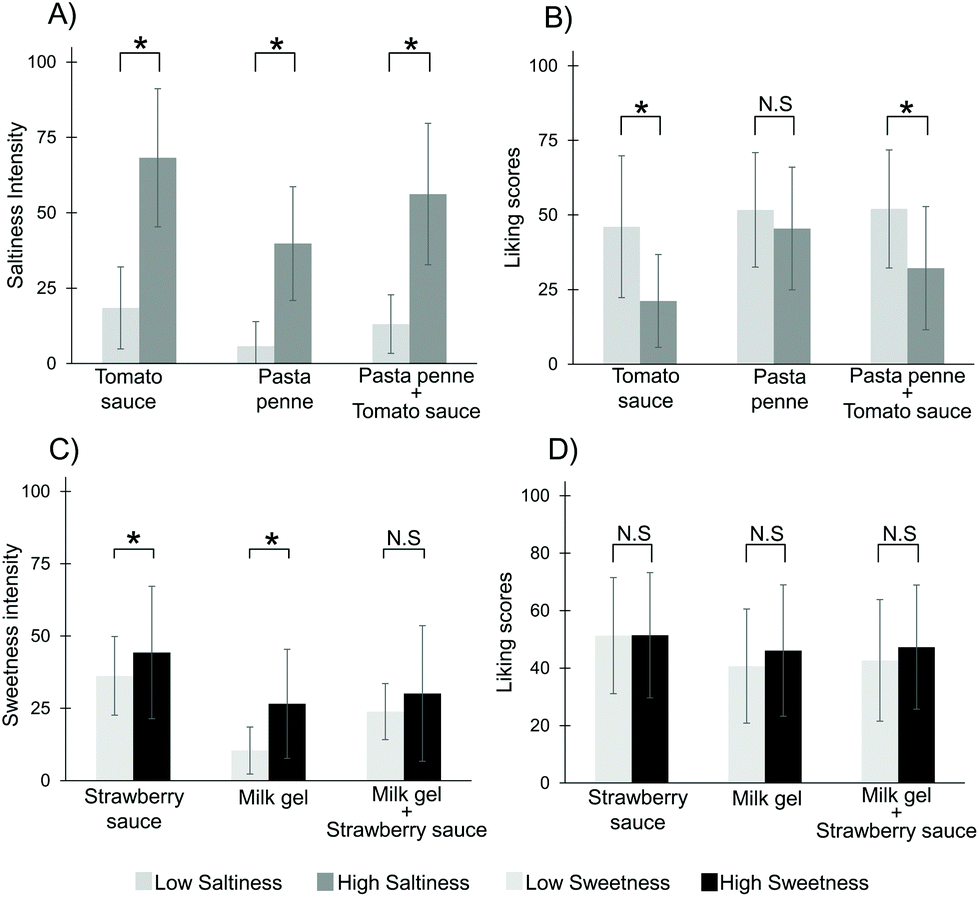 | ||
| Fig. 2 Mean scores and standard deviations of taste intensity and liking scores for salty (A and B) and sweet (C and D) foods. Data analysis was conducted on the squared transformed data. Means and standard deviations are reported on original data. N.S. – means are not significantly different according to linear mixed model (p ≥ 0.05). * means are significantly different according to linear mixed model (p < 0.05). | ||
For salty foods, the interaction between liking scores and consistency was significant (F(2190) = 6.40, p = 0.002). For liquid and composite foods, liking was significantly higher (p < 0.001) for the low salt foods compared to their high salt counterparts. For solid salty foods, no significant difference in liking was found between the high and low salty foods (p = 0.47) (Fig. 2B). For sweet food, the interaction between sweetness intensity and consistency did not significantly affect liking so that the high and low sweet foods were liked similarly (F(2190) = 0.8324, p = 0.43) (Fig. 2D).
No significant differences were found for hardness and chewiness intensity between the high and low taste intensity of salty (hardness: F(2190.815) = 0.67, p = 0.93; chewiness: F(2190.27) = 0.247, p = 0.78) and sweet foods (hardness: F(2189.80) = 0.06, p = 0.94; chewiness: F(2189.76) = 0.41, p = 0.66) across all food consistencies (Fig. 3A and B).
 | ||
| Fig. 3 Mean scores and standard deviations of hardness (A) and chewiness (B) intensity for salty and sweet foods. Data analysis was conducted on the squared transformed data. Means and standard deviations are reported on original data. N.S. – means are not significantly different according to linear mixed model (p ≥ 0.05). * means are significantly different according to linear mixed model (p < 0.05). | ||
These results confirm that samples differed in taste intensity between the low and high tastant concentration condition as intended apart from the sweet composite foods (milk gel cubes with strawberry sauce). As intended, texture perception was not affected by the taste manipulations. As food texture is known to modulate food oral processing behaviours, it was important to demonstrate that sensory texture was not affected by taste manipulations.
3.2 Oral processing behaviours
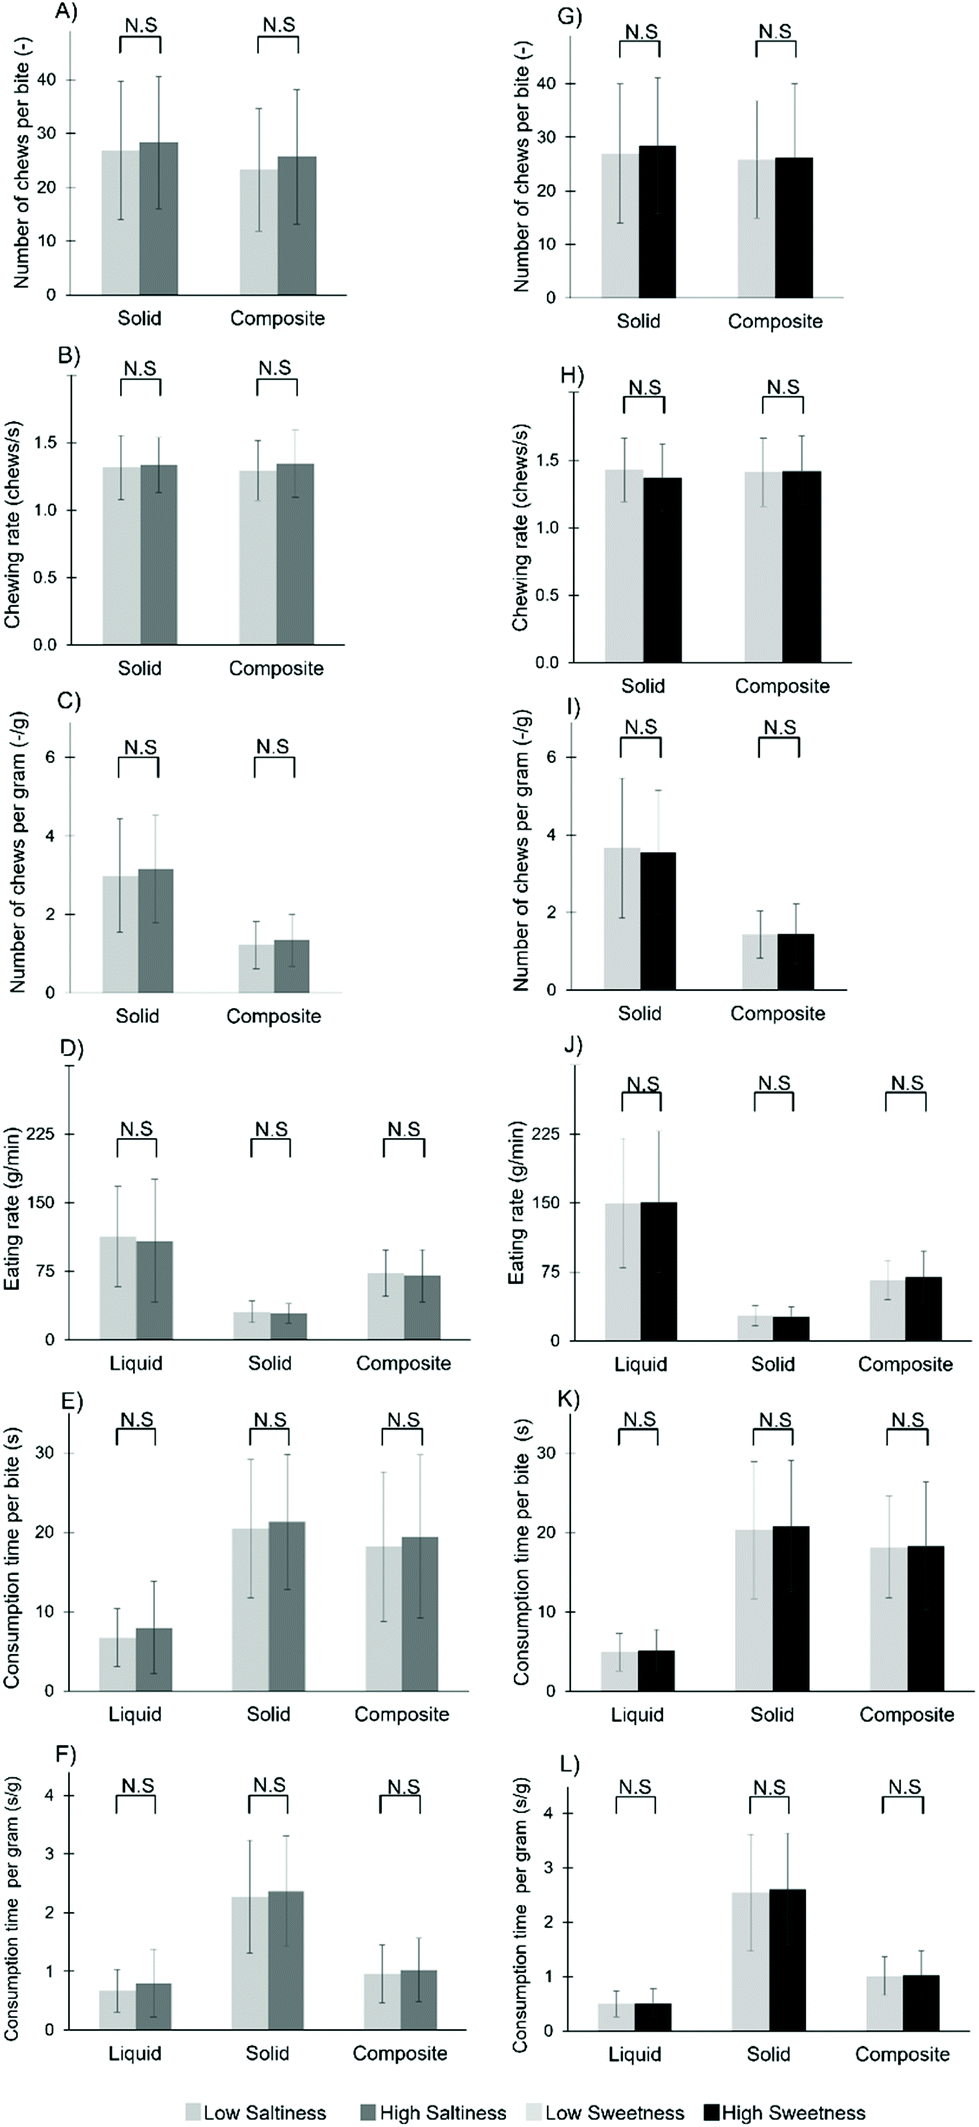 | ||
| Fig. 4 Mean scores and standard deviations of number of chews per bite, chewing rate, number of chews per gram, eating rate, consumption time per bite and consumption time per gram for salty (A–F) and sweet (G–L) foods. Data analysis was conducted on the log10 transformed data. Means and standard deviations are reported on original data. Means and standard deviations are reported on original data. N.S. – means are not significantly different according to linear mixed model (p ≥ 0.05). * means are significantly different according to linear mixed model (p < 0.05). | ||
Fig. 4G displays the number of chews per bite for sweet foods. No significant interaction effect between sweetness intensity and food consistency on number of chews per bite was found (F(1108.167) = 0.1233, p = 0.73), nor was the main effect of taste intensity significant (F(1109.45) = 0.4946, p = 0.48). Food consistency displayed a significant effect on number of chews per bite (F(1108.77) = 18.41, p < 0.001) with composite foods requiring 10% (2.9 chews) fewer chews per bite than solid foods.
As for the sweet foods, neither the interaction between tastant concentration and consistency (F(1108.17) = 0.12, p = 0.72) nor the main effect of tastant concentration (F(1109.45) = 0.49, p = 0.48) were significant. Nevertheless, consistency had a significant effect (F(1108.77) = 1690.44, p < 0.001) on number of chews per gram, with sweet composite foods being masticated with 60% (2.2 chews per g) fewer chews per gram than solid sweet foods.
For sweet foods there was no significant effect of the interaction between taste intensity and consistency (F(2178.17) = 0.16, p = 0.85) nor the main effect of taste intensity (F(1179.36) = 0.002, p = 0.96). The main effect of consistency on eating rate was significant (F(2181.96) = 484.44, p < 0.001). Eating rate of sweet composite foods was 151% (40.8 g min−1) higher compared to sweet solid foods. Eating rate of sweet liquid foods was 456% (123.3 g min−1) and 122% (82.5 g min−1) higher compared to sweet solid and composite foods, respectively.
A similar trend was observed for sweet foods. No significant effect of taste intensity on consumption time per gram was observed (F(1178.9) = 0.019, p = 0.89). Consistency of the foods had a significant effect on consumption time per gram (F(2181.19) = 574.08, p < 0.001). Solid sweet foods required the longest time per gram to be consumed. Sweet composite and liquid foods required 61% (1.6 s g−1) and 80% (2.1 s g−1) less time per gram than solid foods, respectively. Liquids required 50% (0.5 s g−1) less time per grams to be consumed than composite foods (Fig. 4L).
 | ||
| Fig. 5 Pearson correlation coefficients for the parameters describing oral processing behaviors. All correlations are significant at p < 0.05. | ||
4. Discussion
Many studies investigated the effect of food texture on oral processing behaviours while little attention has been paid on how taste could impact oral processing behaviours. The aim of this study was to understand the influence of saltiness and sweetness intensity on oral processing behaviours of liquid, solid and composite foods. In addition, potential differences in oral processing behaviours between composite foods and solid foods and the effect of liking on oral processing behaviours were explored in a home-use-test (HUT).We hypothesized that (i) taste intensity influences oral behaviours of liquid foods as texture properties are less dominant in liquid foods. For both, liquid salty and sweet foods, consumption time per bite and eating rate were not affected by taste intensity, thus our first hypothesis is rejected. This finding is in line with a study of Bolhuis et al. in which oro-sensory exposure time was not influenced by saltiness intensity of soups.27 As for solid and composite foods, we hypothesized that (ii) taste intensity has no effect on oral processing behaviours since their mechanical, texture and lubrication properties are the main drivers of oral behaviour. We did not find differences in number of chews per bite, chewing rate, chews per gram, eating rate nor consumption time per bite between high and low taste intensities of solid and composite sweet and salty foods. This is in accordance with a study of Lasschuijt et al. where neither number of chews, chewing duration, chewing rate nor eating rate, were significantly affected by sweetness intensity of model gels.28 On the contrary, food consistency displayed a large effect on oral processing behaviours. As expected, liquid foods were consumed with the shortest consumption time per bite, as oral processing behaviour of liquid foods requires minimal effort, consisting mainly of moving the fluid from the front to the back of the mouth.10,13,41,49 In contrast, an increase in consumption time per bite for solid foods was expected as solid foods require to be fragmented into smaller particles during mastication and to be lubricated with saliva until a bolus is formed that is safe to be swallowed.13 As expected, there was no effect of food consistency on chewing rate (chews per s) in agreement with previous studies.13,37 Our results clearly demonstrate that mainly rheological, mechanical, texture and lubrication properties of foods determine oral behaviours rather than taste properties, thus our second hypothesis is accepted.
Furthermore, it was hypothesized (iii) that oral behaviours of solid foods require longer chewing time per bite and greater number of chews per bite compared to composite foods, as the liquid foods assist in bolus formation. Indeed, our findings showed a decrease of 11% and 10% in consumption time per bite of sweet and salty composite foods compared to the solid foods. A similar trend was also observed for number of chews per bite. Lastly, chews needed per gram of composite foods decreased by more than 50% for salty and sweet foods compared to solid foods. This implies that liquids influenced the mastication behaviour of solid foods. These results are in line with those of Gavião et al. (2004) and Engelen et al. (2005) who showed that spreading butter on toast decreased the time and number of chewing cycles until swallowing. Similarly, van Eck et al. (2019), showed that bread and crackers, when combined with cheese spread and mayonnaise, were chewed shorter and with fewer chews than single bread and crackers as these toppings contributed to a faster bolus formation by providing moisture, so that less saliva was incorporated into the bolus during mastication. In those studies, it was hypothesized that toppings facilitated saliva in the bolus formation of carriers leading to boli that are broken down and lubricated enough to be safely swallowed after shorter mastication times and less chews.39,42,50 This is confirmed by the results of our current study. Our results show that the liquid component in the composite foods assists in lubrication and bolus formulation, and consequently less time had to be spent on reducing structure and increasing lubrication to reach the swallowing threshold.
It is interesting to note that the bite size of the solid foods was 9 g for the salty and 8 g for the sweet foods while the bite size of the composite foods was roughly twice the weight (19 g for the salty and 18 g for the sweet composite foods) (Table 1). Thus, even though addition of the liquid to the solid foods doubled the weight-based bite size, sweet and salty composite foods were masticated with fewer chews per bite and shorter consumption time per bite than solid foods. Eating rate of sweet and salty composite foods also increased by more than two-fold compared to solid foods (salty foods 139%, sweet foods 151%) demonstrating the strong effect that addition of a liquid lubricant has on oral processing behaviours.
It is well known that food texture and degree of lubrication affect eating rate.28,35,43,51,52 Foods that require more chewing and lubrication will take more time to be orally processed and therefore will have a lower eating rate, since liquid foods facilitate lubrication of solid foods. It is reasonable that eating rate increases for composite foods compared with solid foods, which is in line with the reduction of number of chews per bite and consumption time per bite even though weight of the bite size was doubled. For the relationships between taste intensity and eating rate, some studies have shown that taste intensity is inversely associated with eating rate. Bolhuis et al. (2011) showed that longer oro-sensory exposure and higher saltiness intensity both decreased food intake, although oro-sensory exposure had more impact than taste intensity. In the current study taste intensity had no effect on eating rate, as described by Lasschuijt et al. (2017) where it was demonstrated that oral behaviour was not affected by sweetness intensity of model gels.27,28,33,53
For the concentrations considered in our study, differences in saltiness intensity between salty foods were larger than differences in sweetness intensity between sweet foods. However, not even a rather strong dislike of the high saltiness tomato sauce influenced oral processing behaviours. While we observed significant differences in liking between the low and high saltiness foods, we acknowledge that the study might have lacked power to find smaller differences in liking between the low and high sweetness stimuli to be significant. Forde et al. (2017) and Bellisle and Le Magnen (1980) reported that as liking increased, chewing time decreased and fewer chews were needed for mastication of solid foods.32,33 Bellisle et al., (2000) and Aguayo-Mendoza et al., (2018) showed a similar behaviour.13,37 However, other studies reported no relation between food liking and oral processing behaviours.34,35 It should be acknowledged that we did not measure mechanical and rheological properties of the foods, so we cannot exclude with certainty that foods differing in taste intensity differed in rheological and mechanical properties. However, our sensory data strongly suggests that potential differences in mechanical properties were not perceivable, thus we assume they can be neglected.
In our study, sensory data and the oral processing data were collected in a home use test (HUT). To the best of our knowledge, it is the first time that a HUT approach was used to collect oral processing behaviours of foods. Our data demonstrates that differences in oral processing behaviours between liquid, solid and composite foods were observed in the HUT study (n = 39, triplicate) in agreement with previous studies that determined oral processing behaviours in research facilities. This suggests that HUT is a valid approach to characterize oral processing behaviours of consumers. The HUT approach allows to study oral processing behaviours in a somewhat more realistic setting than sensory booths or laboratory settings, since consumers eat the foods at home while sitting in front of a computer with a camera. A limitation of the HUT approach in our study was that the dropout rate was fairly high (20%) mainly because participants felt the task was very long and lost motivation in the course of the study. Furthermore, participants were instructed to taste three times samples of a fixed bite size. This was done to avoid that participants had to weigh the samples at home to determine bite size, which might have provide stronger cues towards the aim of the study. Bite size can vary across consumers, depending on liking, familiarity and satiation as well as across food type, sensory stimuli and digestive responses.9 In our study, these interindividual variations in bite size were excluded as bite size was fixed. Future studies should explore the potential of HUT approaches to quantify oral processing and eating behaviours further.
5. Conclusions
We investigated oral processing behaviours with real foods and composite foods in a HUT and demonstrated that oral processing behaviours are determined primarily by rheological, mechanical, texture and lubrication properties of foods rather than by taste intensity. We showed that large differences in saltiness and sweetness intensity of liquid, solid and composite foods cause no or very small differences in oral processing behaviours. Differences in oral processing behaviours between solid and composite foods were highlighted, validating that consumption time per bite and number of chews per bite of composite foods is shorter compared to solid foods as the added liquid foods provide lubrication and reduce mastication time needed to form a safe to swallow bolus. The results suggest that texture manipulations or combining different foods to composite foods can be an efficient strategy to modulate oral processing behaviours while modulations of taste properties have a negligible effect on oral processing behaviours. It is well-known that oral processing behaviours impact satiation and food intake, so future research should focus on understanding the role that each single food plays in a heterogenous food or a meal context in oral processing behaviour. This will further help to capture the complex nature of the mastication process and support the design of foods that can lead to lower overall energy intake while maintaining good sensory characteristics, fullness and satiety.Conflicts of interest
The authors have declared that no competing interests exist.Acknowledgements
The authors are grateful to João Paulo for her valuable support with data analysis. Special thanks to Filippo Guerra, Jolie Willems and Tomer First for their help with sample preparations.Notes and references
- J. Chen, Food oral processing-A review, Food Hydrocolloids, 2009, 23(1), 1–25, DOI:10.1016/j.foodhyd.2007.11.013.
- M. D. de Lavergne, J. A. M. Derks, E. C. Ketel, R. A. de Wijk and M. Stieger, Eating behaviour explains differences between individuals in dynamic texture perception of sausages, Food Qual. Prefer., 2015, 41, 189–200 CrossRef.
- C. Salles, M. C. Chagnon and G. Feron, et al., In-mouth mechanisms leading to flavor release and perception, Crit. Rev. Food Sci. Nutr., 2011, 51(1), 67–90, DOI:10.1080/10408390903044693.
- G. Feron and C. Salles, Food oral processing in humans: Links between physiological parameters, release of flavour stimuli and flavour perception of food, Int. J. Food Stud., 2018, 7(1), 1–12, DOI:10.7455/ijfs/7.1.2018.a1.
- A. Braud and Y. Boucher, Intra-oral trigeminal-mediated sensations influencing taste perception: A systematic review, J. Oral Rehabil., 2020, 47(2), 258–269, DOI:10.1111/joor.12889.
- D. Liu, Y. Deng, L. Sha, M. Abul Hashem and S. Gai, Impact of oral processing on texture attributes and taste perception, J. Food Sci. Technol., 2017, 54(8), 2585–2593, DOI:10.1007/s13197-017-2661-1.
- A. C. Mosca, F. van de Velde, J. H. F. Bult, M. A. J. S. van Boekel and M. Stieger, Taste enhancement in food gels: Effect of fracture properties on oral breakdown, bolus formation and sweetness intensity, Food Hydrocolloids, 2015, 43, 794–802 CrossRef CAS.
- M. Doyennette, M. G. Aguayo-Mendoza, A. M. Williamson, S. I. F. S. Martins and M. Stieger, Capturing the impact of oral processing behaviour on consumption time and dynamic sensory perception of ice creams differing in hardness, Food Qual. Prefer., 2019, 78, 103721, DOI:10.1016/J.FOODQUAL.2019.103721.
- R. A. de Wijk, I. A. Polet, W. Boek, S. Coenraad and J. H. Bult, Food aroma affects bite size, Flavour, 2012, 1(1), 3, DOI:10.1186/2044-7248-1-3.
- E. C. Ketel, M. G. Aguayo-Mendoza, R. A. de Wijk, C. de Graaf, B. Piqueras-Fiszman and M. Stieger, Age, gender, ethnicity and eating capability influence oral processing behaviour of liquid, semi-solid and solid foods differently, Food Res. Int., 2019, 119, 143–151, DOI:10.1016/j.foodres.2019.01.048.
- J. Chen and L. Engelen, Food Oral Processing: Fundamentals of Eating and Sensory Perception, Wiley, 2012, DOI:10.1002/9781444360943.
- C. Muñoz-González, G. Feron and F. Canon, Physiological and oral parameters contribute prediction of retronasal aroma release in an elderly cohort, Food Chem., 2021, 342, 128355, DOI:10.1016/j.foodchem.2020.128355.
- M. G. Aguayo-Mendoza, E. C. Ketel, E. Van Der Linden, C. G. Forde, B. Piqueras-Fiszman and M. Stieger, Oral processing behavior of drinkable, spoonable and chewable foods is primarily determined by rheological and mechanical food properties. Published online 2018. DOI:10.1016/j.foodqual.2018.06.006.
- O. Plesh, B. Bishop and W. McCall, Effect of gum hardness on chewing pattern, Exp. Neurol., 1986, 92(3), 502–512, DOI:10.1016/0014-4886(86)90292-X.
- T. Horio and Y. Kawamura, Effects of texture of food on chewing patterns in the human subject, J. Oral Rehabil., 1989, 16(2), 177–183, DOI:10.1111/j.1365-2842.1989.tb01331.x.
- D. J. Anderson, M. P. Hector and R. W. Linden, The possible relation between mastication and parotid secretion in the rabbit, J. Physiol., 1985, 364(1), 19–29, DOI:10.1113/jphysiol.1985.sp015726.
- Y. Mälkki, R. L. Heiniö and K. Autio, Influence of oat gum, guar gum and carboxymethyl cellulose on the perception of sweetness and flavour, Top. Catal., 1993, 6(6), 525–532, DOI:10.1016/S0268-005X(09)80076-3.
- Z. V. Baines and E. R. Morris, Flavour/taste perception in thickened systems: the effect of guar gum above and below c*, Top. Catal., 1987, 1(3), 197–205, DOI:10.1016/S0268-005X(87)80003-6.
- C. M. Christensen, Effects of solution viscosity on perceived saltiness and sweetness, Percept. Psychophys., 1980, 28(4), 347–353, DOI:10.3758/BF03204394.
- R. M. Pangborn, I. M. Trabue and A. S. Szczesniak, EFFECT OF HYDROCOLLOIDS ON ORAL VISCOSITY AND BASIC TASTE INTENSITIES, J. Texture Stud., 1973, 4(2), 224–241, DOI:10.1111/j.1745-4603.1973.tb00666.x.
- H. R. Moskowitz and P. Arabie, TASTE INTENSITY AS A FUNCTION OF STIMULUS CONCENTRATION AND SOLVENT VISCOSITY, J. Texture Stud., 1970, 1(4), 502–510, DOI:10.1111/j.1745-4603.1970.tb00748.x.
- M. Vaisey, R. Brunon and J. Cooper, Some Sensory Effects of Hydrocolloid Sols on Sweetness, J. Food Sci., 1969, 34(5), 397–400, DOI:10.1111/j.1365-2621.1969.tb12788.x.
- M. Alfonso, E. Neyraud, O. Blanc, M. A. Peyron and E. Dransfield, Relationship between taste and chewing patterns of visco–elastic model foods, J. Sens. Stud., 2002, 17(2), 193–206 CrossRef.
- E. Neyraud, M. A. Peyron, C. Vieira and E. Dransfield, Influence of bitter taste on mastication pattern, J. Dent. Res., 2005, 84(3), 250–254, DOI:10.1177/154405910508400308.
- E. Neyraud, J. Prinz and E. Dransfield, NaCl and sugar release, salivation and taste during mastication of salted chewing gum, Physiol. Behav., 2003, 79(4–5), 731–737, DOI:10.1016/S0031-9384(03)00187-2.
- R. A. de Wijk, F. Wulfert and J. F. Prinz, Oral processing assessed by M-mode ultrasound imaging varies with food attribute, Physiol. Behav., 2006, 89(1), 15–21, DOI:10.1016/j.physbeh.2006.05.021.
- D. P. Bolhuis, C. M. M. Lakemond, R. A. de Wijk, P. A. Luning and C. de Graaf, Both longer oral sensory exposure to and higher intensity of saltiness decrease ad libitum food intake in healthy normal-weight men, J. Nutr., 2011, 141(12), 2242–2248 CrossRef CAS PubMed.
- M. P. Lasschuijt, M. Mars, M. Stieger, S. Miquel-Kergoat, C. De Graaf and P. A. M. Smeets, Comparison of oro-sensory exposure duration and intensity manipulations on satiation, Physiol. Behav., 2017, 176, 76–83 CrossRef CAS PubMed.
- G. Schwartz and J. P. Lund, Modification of rhythmical jaw movements by noxious pressure applied to the periosteum of the zygoma in decerebrate rabbits, PAIN®, 1995, 63(2), 153–161 CrossRef CAS PubMed.
- C. L. Campbell, T. B. Wagoner and E. A. Foegeding, Designing foods for satiety: The roles of food structure and oral processing in satiation and satiety, Food Struct., 2017, 13, 1–12 CrossRef.
- A. Woda, K. Foster, A. Mishellany and M.-A. Peyron, Adaptation of healthy mastication to factors pertaining to the individual or to the food, Physiol. Behav., 2006, 89(1), 28–35 CrossRef CAS PubMed.
- F. Bellisle and J. Le Magnen, The analysis of human feeding patterns: the edogram, Appetite, 1980, 1(2), 141–150, DOI:10.1016/S0195-6663(80)80018-3.
- C. G. Forde, C. Leong, E. Chia-Ming and K. McCrickerd, Fast or slow-foods? Describing natural variations in oral processing characteristics across a wide range of Asian foods, Food Funct., 2017, 8(2), 595–606, 10.1039/C6FO01286H.
- D. Ferriday, M. L. Bosworth and N. Godinot, et al., Variation in the oral processing of everyday meals is associated with fullness and meal size; A potential nudge to reduce energy intake?, Nutrients, 2016, 8(5), 315, DOI:10.3390/nu8050315.
- C. G. Forde, N. van Kuijk, T. Thaler, C. de Graaf and N. Martin, Oral processing characteristics of solid savoury meal components, and relationship with food composition, sensory attributes and expected satiation, Appetite, 2013, 60(1), 208–219, DOI:10.1016/j.appet.2012.09.015.
- W. E. Brown and D. Braxton, Dynamics of food breakdown during eating in relation to perceptions of texture and preference: a study on biscuits, Food Qual. Prefer., 2000, 11(4), 259–267 CrossRef.
- F. Bellisle, B. Guy-Grand and J. Le Magnen, Chewing and swallowing as indices of the stimulation to eat during meals in humans: Effects revealed by the edogram method and video recordings, Neurosci. Biobehav. Rev., 2000, 24(2), 223–228, DOI:10.1016/S0149-7634(99)00075-5.
- A. van Eck and M. Stieger, Oral processing behavior, sensory perception and intake of composite foods, Trends Food Sci. Technol., 2020, 106, 219–231, DOI:10.1016/j.tifs.2020.10.008.
- A. van Eck, N. Hardeman, N. Karatza, V. Fogliano, E. Scholten and M. Stieger, Oral processing behavior and dynamic sensory perception of composite foods: Toppings assist saliva in bolus formation, Food Qual. Prefer., 2019, 71, 497–509 CrossRef.
- D. S. Larsen, J. Tang, L. Ferguson, M. P. Morgenstern and B. J. James, Oral Breakdown of Texturally Complex Gel-Based Model Food, J. Texture Stud., 2016, 47(3), 169–180, DOI:10.1111/jtxs.12146.
- S. C. Hutchings, K. D. Foster, J. E. Bronlund, R. G. Lentle, J. R. Jones and M. P. Morgenstern, Mastication of heterogeneous foods: Peanuts inside two different food matrices, Food Qual. Prefer., 2011, 22(4), 332–339, DOI:10.1016/j.foodqual.2010.12.004.
- L. Engelen, A. Fontijn-Tekamp and A. Van Der Bilt, The influence of product and oral characteristics on swallowing, Arch. Oral Biol., 2005, 50(8), 739–746, DOI:10.1016/j.archoralbio.2005.01.004.
- D. P. Bolhuis, C. G. Forde, Y. Cheng, H. Xu, N. Martin and C. de Graaf, Slow Food: Sustained Impact of Harder Foods on the Reduction, in Energy Intake over the Course of the Day, ed. D. Tomé, PLoS One, 2014, vol. 9, no. (4), p. e93370. DOI:10.1371/journal.pone.0093370.
- B. G. Green, P. Dalton, B. Cowart, G. Shaffer, K. Rankin and J. Higgins, Evaluating the “Labeled Magnitude Scale” for Measuring Sensations of Taste and Smell, Chem. Senses, 1996, 21, 323–334 CrossRef CAS PubMed.
- J. J. Kalva, C. A. Sims, L. A. Puentes, D. J. Snyder and L. M. Bartoshuk, Comparison of the hedonic general labeled magnitude scale with the hedonic 9-point scale, J. Food Sci., 2014, 79(2), S238–S245, DOI:10.1111/1750-3841.12342.
- A. Gałecki and T. Burzykowski, Linear Mixed-Effects Model, in Linear mixed-effects models using R, Springer, New York, NY, 2013, pp. 245–273. DOI:10.1007/978-1-4614-3900-4_13.
- D. Bates, M. Mächler, B. Bolker and S. Walker, Fitting linear mixed-effects models using lme4, arXiv Prepr arXiv: 14065823. Published online 2014.
- A. Fogel, A. T. Goh and L. R. Fries, et al., A description of an ‘obesogenic'eating style that promotes higher energy intake and is associated with greater adiposity in 4.5 years-old children: Results from the GUSTO cohort, Physiol. Behav., 2017, 176, 107–116 CrossRef CAS PubMed.
- K. Hiiemae, Mechanisms of food reduction, transport and deglutition: how the texture of food affects feeding behavior, J. Texture Stud., 2004, 35(2), 171–200 CrossRef.
- M. B. D. Gavião, L. Engelen and A. Van Der Bilt, Chewing behavior and salivary secretion, Eur. J. Oral Sci., 2004, 112(1), 19–24, DOI:10.1111/J.0909-8836.2004.00105.X.
- K. McCrickerd, C. M. H. Lim, C. Leong, E. M. Chia and C. G. Forde, Texture-based differences in eating rate reduce the impact of increased energy density and large portions on meal size in adults, J. Nutr., 2017, 147(6), 1208–1217 CrossRef CAS PubMed.
- N. Zijlstra, R. de Wijk, M. Mars, A. Stafleu and C. de Graaf, Effect of bite size and oral processing time of a semisolid food on satiation, Am. J. Clin. Nutr., 2009, 90(2), 269–275 CrossRef CAS PubMed.
- C. G. Forde, N. Van Kuijk, T. Thaler, C. De Graaf and N. Martin, Texture and savoury taste influences on food intake in a realistic hot lunch time meal, Appetite, 2013, 60, 180–186 CrossRef CAS PubMed.
- M. S. M. Wee, A. T. Goh, M. Stieger and C.G. Forde, Correlation of instrumental texture properties from textural profile analysis (TPA) with eating behaviours and macronutrient composition for a wide range of solid foods, Food Funct., 2018, 9(10), 5301–5312 RSC.
| This journal is © The Royal Society of Chemistry 2022 |