
 Open Access Article
 This Open Access Article is licensed under a
 Creative Commons Attribution 3.0 Unported Licence
The bioaccessibility of folate in breads and the stability of folate vitamers during in vitro digestion†
Fengyuan
Liu
 *,
Minnamari
Edelmann
,
Vieno
Piironen
and
Susanna
Kariluoto
*,
Minnamari
Edelmann
,
Vieno
Piironen
and
Susanna
Kariluoto
Department of Food and Nutrition, University of Helsinki, Agnes Sjöbergin katu 2, FI-00014, Finland. E-mail: fengyuan.liu@helsinki.fi; minnamari.edelmann@helsinki.fi; vieno.piironen@helsinki.fi; susanna.kariluoto@helsinki.fi
First published on 18th February 2022
Abstract
Both the liberation and stability of endogenous folate are relevant to the bioaccessibility of folate. Since folates are unstable, in addition to studying the natural folate content in foods, bioaccessibility should be considered. To understand folate changes during digestion, a mixture of standard folate compounds was subjected to a static in vitro gastrointestinal digestion assay. Next, different types of bread were analysed to study how food matrices influence folate bioaccessibility. Folates were identified and quantitated by a UHPLC-PDA/FL method. Folic acid and 10-formylfolic acid were stable throughout the digestion, and the conversions among formyl folates and 5,10-methenyltetrahydrofolate were triggered at the gastric phase. Tetrahydrofolate began to degrade during the oral phase and was lost completely during the gastric phase. During the intestinal phase, 5-methyltetrahydrofolate began to degrade and suffered a 60% loss. With bread matrices, folate conversions and the decrease of reduced folates were also common, but the extent of changes varied. Generally, rye breads had the highest (80–120%) bioaccessibility of folate, while oat breads had the lowest (31–102%). The high proportion of 5-methyltetrahydrofolate could result in low bioaccessibility because of its relatively low stability during digestion in bread matrices. An increase in 10-formylfolic acid content was observed for all the breads, but 10-formyldihydrofolate seemed to be more stable in rye breads than in oat and wheat breads. The results showed that folates undergo significant changes during digestion and that food matrices could be modified to affect these changes towards better folate bioaccessibility.
1. Introduction
Folate is essential for amino acid and nucleotide metabolism. Folate deficiency results in health disorders, such as megaloblastic anaemia and neural tube defects.1 The mandatory fortification of flours with folic acid (a form of synthesised folate) is carried out in many countries, such as the USA, Canada and Australia.2 However, most European countries do not practice mandatory folate fortification. Additionally, since adverse effects may occur with a high intake of folic acid, such as the masking of vitamin B12 deficiency,3 it is important to study folate from natural sources.Bread is one of the most common staple foods in many regions. The ingredients as well as the processing methods used for bread-making, play an important role in the characteristics of bread products. In addition, breads differ widely in size, shape, and texture. Regardless of the differences, bread is the main source of energy for many people and a rich source of B vitamins.
Since bread is consumed in high quantities, even moderate enhancement of folate in bread is relevant to the folate intake of the population. Popular approaches to improving natural folate levels in bread are germination and fermentation, which have been proven to be effective for compensating for folate loss during bread-making.4 Furthermore, some researchers have enhanced folate content in bread by including spinach or Swiss chard as one of the ingredients.5 However, due to the instability of natural folate, whether folate could be delivered to the small intestine without degradation remains a question to be answered. This question relates to the bioaccessibility or bioavailability of folate, meaning the proportion of folate that can be absorbed or utilised by human beings.
There is a wide range of human studies supporting the idea that folic acid or 5-methyltetrahydrofolate in fortified cereal products is well bioavailable,6–9 and bread has been used as a good vehicle to deliver folic acid. However, information about the bioaccessibility or bioavailability of endogenous folate in bread is rare, and the results vary due to the different study approaches. Vahteristo et al.10 reported good bioavailability of folate from rye meals consisting of rye products (breads and muesli) and orange juice, similar to that of folic acid from fortified white bread. Ohrvik et al.11 reported over 75% folate bioaccessibility in different types of whole-meal bread using the TIM (TNO Gastro-Intestinal Model) and over 90% in a breakfast meal (with wheat bread, fruits and other foods). Furthermore, a paper reported 100% bioaccessibility of endogenous folic acid and 5-methyltetrahydrofolate in bread samples using a Caco-2 cell absorption model.12
Both the liberation and stability of endogenous folate are relevant to the bioaccessibility of folate in food matrices. Our previous study showed that both ingredient and thermal treatments can affect the bioaccessibility of folate in simple faba bean and cereal matrices.13 It is hypothesised that the bioaccessibility of folate in breads could be linked to their ingredients. Antioxidants from foods may protect folate during digestion.14 Additionally, folate composition can be critical because of the varied stability of endogenous folate vitamers.15–17 A recent comprehensive study reported around 20–50% folate bioaccessibility in wheat germ, spinach and cheese.14 With the information on folate vitamers, they showed that the bioaccessibility of food folate depends on folate stability during in vitro digestion. Another hypothesis is that the processing method could affect the bioaccessibility of folate by modifying the structure of the food. Bationo et al.18 studied the bioaccessibility of folate in seven types of African cereal-based products and found that those with dense structures had the highest folate bioaccessibility (57–81%). Moreover, a recent report by Hiolle et al.19 stated that the release of added folic acid during the gastric phase was faster for biscuit and sponge cake than for custard and pudding, although they were made from the same materials. Their further research showed that food structure can significantly affect folate bioavailability in human adults and that custard had the lowest folate bioavailability, followed by biscuits.20 In the case of custard, they suspected that interactions of folate with the matrix components took place in the gastrointestinal tract, causing a delayed plasma folate peak. For biscuits, they suggested that their relatively low folate bioavailability could be due to the overall inefficient digestion of nutrients. Indeed, folate can bind to macronutrients, such as starch and protein. Thus, efficient digestion of food components could release folate from food matrices, improving folate bioavailability or bioaccessibility.
Since bioavailability studies are expensive and time-consuming, bioaccessibility studies are useful for generating hypotheses and for sample screening. Hence, this study aimed to compare the bioaccessibility of endogenous folate in twelve types of commercial breads using a standardised static in vitro digestion model.21 The breads were made from different cereal ingredients and varied in shape and structure. Additionally, the bioaccessibility of folate was investigated in oat breads, which were baked in the laboratory using different oat cultivars, but the same baking process. Finally, since we have previously reported that in vitro digestion induces the interconversion and degradation of folate in faba bean and cereal matrices,13in vitro digestion of the standard mixture was carried out to understand the changing patterns of folate vitamers throughout digestion and analysis. Thus, this study will provide insights on the bioaccessibility of folate from the aspects of folate stability and folate liberation during the in vitro digestion.
2. Materials and methods
2.1 Enzymes and calibrants
The following enzymes and bile extract were purchased from Sigma-Aldrich (St Louis, MO, USA): α amylase from Aspergillus oryzae (A9857), pepsin (P7125), bile from bovine and ovine (B8381), trypsin (T0303), chymotrypsin (C4129) and protease (P8811). For the calibrants, (6S)-tetrahydrofolate (H4folate, sodium salt), (6S)-5-methyltetrahydrofolate (5-CH3-H4folate, calcium salt), (6R,S)-5,10-methenyltetrahydrofolate hydrochloride (5,10-CH+-H4folate) and (6S)-5-formyltetrahydrofolate (5-HCO-H4folate, sodium salt) were obtained from Eprova AG (Schaffhausen, Switzerland). 10-Formylfolic acid (10-HCO-PGA) and folic acid (PGA) were obtained from Schirck's Laboratories (Jona, Switzerland). 10–formyldihydrofolate (10-HCO-H2folate) was synthesised from 5,10-CH+-H4folate according to Kariluoto et al.22 Calibrants were prepared into 50 mM sodium borate solution with 0.4% 2-mercaptoethanol (approximately 1 mg mL−1), and ultrasonic agitation was applied when necessary. The concentrations of the standards were determined and confirmed spectrophotometrically (Table S1†), according to Kariluoto et al.22 Stock solutions for each folate standard were prepared by diluting (1![[thin space (1/6-em)]](https://www.rsc.org/images/entities/char_2009.gif) :10) the calibrant solution into 50 mM sodium borate solution with 1% ascorbic acid and stored at −20 °C.
:10) the calibrant solution into 50 mM sodium borate solution with 1% ascorbic acid and stored at −20 °C.
2.2 Samples
 | ||
| Fig. 1 Images of the bread. The radius of the white plate is about six centimetres. The round rye bread was torn into smaller pieces. a)–l) were were commercial breads. m)–o) were whole-grain oat breads prepared in the laboratory using different oat cultivars, labeled as LOA, LOB and LOC. | ||
| Bread | Fat | Carbo-hydrates | Dietary fibre | Protein | Grain ingredients | Note |
|---|---|---|---|---|---|---|
| Whole-grain rye toast (RT) | 5.1 | 38 | 8.8 | 11 | Whole-grain rye (flour, groats, malt), endosperm rye flour (lestyruisjauho), sunflower seed, linseed, barley malt extract, 100% rye, 52% whole-grain | Added yeast |
| Added wheat gluten | ||||||
| Whole-grain oat toast (OT) | 3.5 | 37 | 6 | 13 | Whole-grain oats (flour, groats, flake), wheat flour, oat bran, oat fibre, wheat germ, 51% whole-grain oats | Added yeast |
| Added wheat gluten | ||||||
| White wheat toast (WT) | 2.2 | 49 | 4 | 8.4 | Wheat flour | Added yeast |
| Added wheat gluten | ||||||
| Dried wheat sourdough | ||||||
| Rye flat portion bread (RF) | 1.7 | 43 | 12 | 10 | Whole-grain rye (groats, flour, malt), wheat flour, potato flake, 87% whole-grain rye | Added yeast |
| Added wheat gluten | ||||||
| Sourdough process | ||||||
| Oat flat portion bread (OF) | 5.7 | 36 | 7.2 | 8.6 | Whole-grain oats (flake, flour, grain), potato flake, oat bran, 100% oats | Added yeast |
| Whole-grain wheat toast (WGT) | 3.6 | 43 | 7.3 | 9.3 | 35% wholemeal wheat flour, wheat flour, wheat bran, 56% whole-grain | Added yeast |
| Added wheat gluten | ||||||
| Dried wheat sourdough | ||||||
| Rye flat portion bread with germinated rye (RGF) | 1.7 | 42 | 11 | 9.4 | Whole-grain rye (germinated grain, flour, groats, malt), wheat flour, potato flake, 82% whole-grain rye, 36% germinated rye | Added yeast |
| Added wheat gluten | ||||||
| Sourdough process | ||||||
| Traditional Finnish round rye bread (RR) | 1.3 | 40.4 | 9.7 | 6.6 | 100% whole-grain, rye sourdough, rye flour | Added yeast |
| Sourdough process | ||||||
| Round rye bread with softer texture where wheat flour was added (RRW) | 1.7 | 46.6 | 12 | 6.8 | Whole-grain 80% of grain raw materials, 57% whole-grain rye flour, wheat flour, psyllium fibre | Rye and wheat |
| Added yeast | ||||||
| Sourdough process | ||||||
| Rye crispbread (RC) | 2.5 | 58 | 20 | 10 | 88% whole-grain rye flour, water, 4% rye bran | Added yeast |
| Round rye bread without added yeast (RRNY) | 1.5 | 42.8 | 13.3 | 7.4 | 73% wholemeal rye flour | No added yeast |
| Round rye bread baked in the afterheat of the oven (RRAO) | 2.1 | 51 | 15 | 8.2 | 85% organic whole-grain rye flour, gluten, 100% whole grains | Added yeast |
| After oven | ||||||
| Sourdough process |
2.3 In vitro digestion
A static in vitro digestion model, as described by Minekus et al.,21 was applied in this study with small modifications. Individual enzymes were used for intestinal digestion, and α-amylase from Aspergillus oryzae was used for starch hydrolysis instead of human salivary α-amylase and porcine pancreatic α-amylase. Lipase was not included in this assay, as in a preliminary experiment, the exclusion of lipase in the intestinal phase did not have a significant effect on the bioaccessibility of folate in the selected samples with a relatively high lipid level (Fig. S1†). The simulated salivary fluid (SSF, pH 7), simulated gastric fluid (SGF, pH 3) and simulated intestinal fluid (SIF, pH 7) were prepared according to the protocol described by Minekus et al.21 Additionally, the concentration of bile acid and the activities of individual enzymes were determined before the assay (Table S2†) according to the INFOGEST protocol.21The static in vitro digestion included three steps: the oral phase, gastric phase and intestinal phase. First, 5 g of the sample (or 5 mL of the standard mixture) was mixed with 4 mL of SSF with α-amylase. The total volume was brought to 10 mL by adding CaCl2 and Milli-Q water (W/V = 5/5). The mixture was incubated at 37 °C for 2 min under shaking. Second, 8 mL of SGF with pepsin was added. After the pH was adjusted to 3, CaCl2 and Milli-Q water were added to bring the total volume to 20 mL. The solution was then incubated at 37 °C for 2 h with constant shaking. Thirdly, 6 mL of SIF with α-amylase and 10 mL of SIF with bile extract were added to the tube, and the pH was adjusted to 7 subsequently. The chymotrypsin and trypsin were added, and the final volume was determined to be 40 mL by adding CaCl2 and Milli-Q water. The digesta was obtained after centrifugation and kept at −20 °C until analysis. A blank control was carried out to determine the amount of folate in the enzymes in each batch of the digestion. The amounts of enzymes added were based on the analysed enzyme activities and the reference values (units per mL) described by Minekus et al.21
2.4 Extraction and purification of folate
A tri-enzyme treatment described previously was applied to the extraction of folate.24 In brief, 2 g of the ground bread sample was mixed with 15 mL of CHES/HEPES buffer (pH 7.85) with sodium ascorbate (2%) and 2-mercaptoethanol (10 mM). Then, the mixture was brought to a boiling water bath for 10 min. After cooling down on the ice, the pH was adjusted to 4.9, and 20 mg of α-amylase, as well as 1 mL of hog kidney conjugase, were added. The extract was then incubated by shaking at 37 °C for 3 h. After incubation, the pH was adjusted to 7, and 4 mg of protease was added. The solution was again incubated by shaking at 37 °C for 1 h. The enzymes were then inactivated by 5 min boiling in a water bath. The final extract was collected by centrifugation (12000 rpm, 10 min) and filtered through a 0.45 μm syringe filter.
The extraction of digesta was carried out similarly except for not using α-amylase and protease. In short, 10 mL of digesta was mixed with 10 mL of extraction buffer and placed in a boiling water bath for 10 min. The pH was then adjusted to 4.9, and 1 mL of hog kidney conjugase was added. The mixture was incubated at 37 °C for 3 h, after which the enzymes were inactivated for 5 min in a boiling water bath, and the final extract was obtained in the same ways as previously described.
The purification of the extracts was achieved by affinity chromatography, as described previously.24 Affinity columns with folate-binding protein (Scripps Laboratories, San Diego, CA) bound with Affinity agarose gel (Affi-Gel 10, Bio-Rad Laboratories, Richmond, CA) were prepared. Folates were eluted with 0.02 M trifluoracetic acid/0.01 M dithiothreitol into a 5 mL volumetric flask with piperazine (60 μmol mL−1), ascorbic acid (2 mg mL−1) and 2-mercaptoethanol (0.1%). The concentrated folate extracts were filtered through 0.2 μm syringe filters, flushed with nitrogen and kept at −20 °C for no more than 7 days.
The extraction was carried out in triplicate for non-digested samples. For the digesta, since triplicate digestion was carried out, the extraction process was performed in duplicate. Furthermore, duplicate blank controls during extraction were also carried out in each batch to determine the endogenous folate in the enzymes.
2.5 Stability test with the folate standard mixture
Folate standards were subjected to in vitro assay and extraction processes to understand their stability during the analysis. The standard mixture was exposed to different treatments before, during and after the digestion (Fig. 2): no treatments or control (N); a heat treatment in a boiling water bath for 5 min (B); a heat treatment in a boiling water bath for 5 min and purification by affinity columns (A); in vitro oral digestion followed by 5 min of boiling and purification by gastric affinity columns (O); in vitro oral and gastric digestion followed by 5 min of boiling and purification by affinity columns (G); in vitro oral, gastric and intestinal digestion followed by 5 min boiling and purification by affinity columns (I); in vitro oral, gastric and intestinal digestion, followed by the folate extraction process, 5 min boiling and purification by affinity columns (IE). The folate extraction process included 10 min of boiling in a water bath, pH adjustment to 4.9, 3-hour incubation with shaking at 37 °C (flushed with nitrogen) and 5 min of boiling in a water bath. All the standard mixture samples were filtered through 0.2 μm syringe filters, flushed with nitrogen, and kept at −20 °C for no more than 7 days.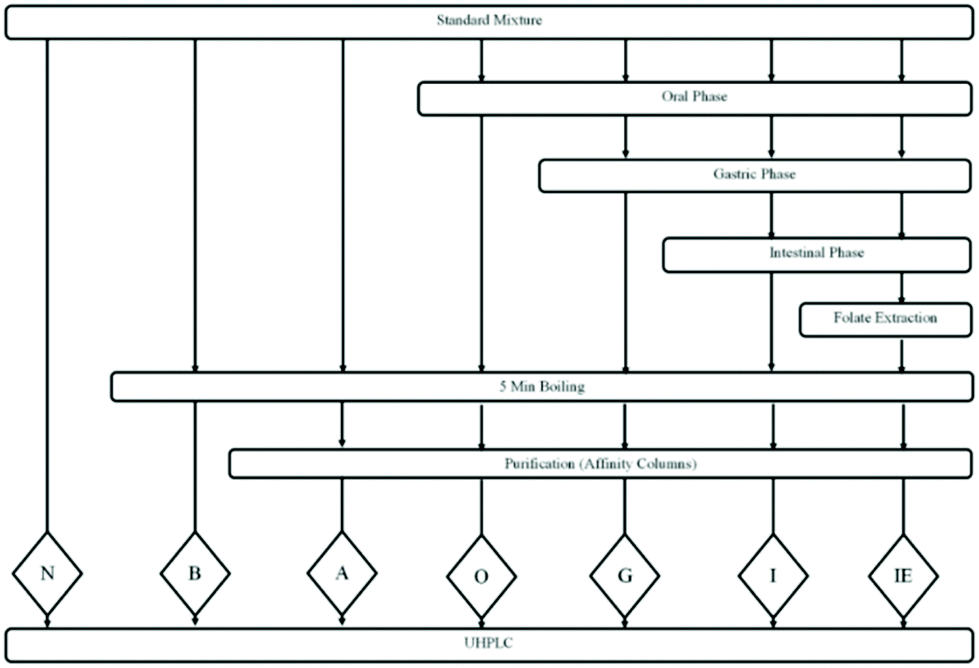 | ||
| Fig. 2 Flow chart of the digestion of standard mixture solution. Folate extraction process included 10 min in a boiling water bath, pH adjustment, 3-hour incubation with shaking under 37 °C (flushed with nitrogen), and 5 min boiling. Seven groups of the standard mixture subjected to different treatments are represented by the capital letters: N, no treatments; B, 5 min in a boiling water bath; A, 5 min in a boiling water bath and purification by affinity columns; O, treated by in vitro oral digestion followed by 5 min in a boiling water bath and purification by affinity columns; G, treated by in vitro oral and gastric digestion followed by 5 min in a boiling water bath and purification by affinity column; I, treated by in vitro oral, gastric and intestinal digestion followed by 5 min in a boiling water bath and purification by affinity columns; IE, treated by in vitro oral, gastric and intestinal digestion followed by the folate extraction process, 5 min in a boiling water bath and purification by affinity columns. UHPLC, ultra-high performance liquid chromatography. | ||
2.6 Quantification of folate
A reversed-phase ultra-high-performance liquid chromatography (UHPLC) method, which was developed and validated by our laboratory,24 was applied to determine the folate vitamer contents. The column was HSS T3 manufactured by Waters (1.8 μm, 2.1 × 150 mm; Waters, Milford, MA). During the UHPLC analysis, the samples were kept in a dark autosampler at 4 °C. The mobile phases were 30 mM potassium phosphate buffer (A, pH 2.2) and acetonitrile (B). The following gradient elution was applied: 95% A from 0 to 2.16 min, 95–93.1% A from 2.16 to 4.71 min, 93.1–84.6% A from 4.71 to 7.47 min, 84.6% A from 7.47 to 7.87 min and, finally, to initial conditions, 84.6%–95% A from 7.87 to 8.3 min, with reconditioning of the column to 95% A from 8.3 to 11 min. The flow rate was 0.4 mL min−1, and the column temperature was 30 °C.Folate vitamers were quantified using a combination of a fluorescence (FL) detector and a photodiode array (PDA) detector. In specific, H4folate (tetrahydrofolate) and 5-CH3-H4folate (5-methyltetrahydrofolate) were detected by FL (excitation wavelength: 290 nm; emission wavelength: 356 nm); 10-HCO-PGA (10-formylfolic acid) was determined by FL (excitation wavelength: 360 nm; emission wavelength: 465 nm); 10-HCO-H2folate (10-formyldihydrofolate), PGA (folic acid) and 5-HCO-H4folate (5-formyltetrahydrofolate) were determined by PDA (290 nm); and 5,10-CH+-H4folate (5,10-methenyltetrahydrofolate) was determined by PDA (360 nm). The construction of standard curves was illustrated by Edelmann et al.24 The identification of the monoglutamate folates was carried out by comparing the retention times of the sample peaks to those of the standard peaks (Fig. S2†). Additionally, the ultraviolet (UV) spectra of the standard peaks and the sample peaks were checked to confirm the vitamers. Quantification was achieved using external calibration curves, with peak areas on the x-axis and the folate amount (ng) on the y-axis. For rye breads, 5-HCO-H4folate and PGA peaks were often masked by unknown impurities, hindering the accurate quantification of these vitamers.
2.7 Calculation and statistical analysis
The folate content was expressed as the mean ± standard deviation (μg/100 g, n = 3) on a fresh matter (FM) basis. The total folate content was calculated as the sum of folate vitamers. Folate bioaccessibility (%) was obtained by dividing the total folate content after digestion (μg/100 g FM) by the total folate content before digestion (μg/100 g FM). Data visualisation and analysis were carried out using the R Studio platform. Two sample t-tests were selected to study the differences between folate contents before and after in vitro digestion. For multigroup comparisons, one-way analysis (ANOVA) of variance and Tukey's honestly significant difference (HSD) post hoc test were used. Principle component analysis (PCA) was carried out to provide insight into the factors that could influence folate bioaccessibility. The contents of fat, protein, carbohydrates and dietary fibre were obtained from the package labels. 5-CH3-H4folate, 10-HCO-H2folate and 10-HCO-PGA were selected because they were the predominant folate vitamers of the commercial breads in this study. The total folate and folate bioaccessibility are important indexes for evaluating the nutritional value of folate in the samples. Before the analysis, the data were centred by subtracting the column means of x from their corresponding columns and scaled by dividing the centred columns of x by their standard deviations.3. Results and discussion
3.1 The stability of folate vitamers without food matrices
To understand the baseline of the changes in folates throughout the analysis, the in vitro digestion of the standard mixture solution was carried out, and the results are shown in Table 2. Samples N, B, A and IE were used to study the recovery of folates during the extraction, while samples O, G and I were used to study folate interconversion or degradation during in vitro digestion.| Folates | N | B | A | O | G | I | IE |
|---|---|---|---|---|---|---|---|
| Folate contents are expressed as mean ± standard deviation (μg), n = 3; values within the same row with different letters differed significantly (p < 0.05). Seven groups of the standard mixture subjected to different treatments are represented by the capital letters: N, no treatments; B, kept in a boiling water bath for 5 min; A, kept in a boiling water bath for 5 min and purified by affinity columns; O, treated by in vitro oral digestion followed by 5 min in a boiling water bath and purification by affinity columns; G, treated by in vitro oral and gastric digestion followed by 5 min in a boiling water bath and purification by affinity columns; I, treated by in vitro oral, gastric and intestinal digestion followed by 5 min in a boiling water bath and purification by affinity columns; IE, treated by in vitro oral, gastric and intestinal digestion followed by the folate extraction process, 5 min in a boiling water bath and purification by affinity columns. | |||||||
| PGA | 0.69 ± 0.02 (9%) a | 0.70 ± 0.01 (10%) a | 0.58 ± 0.02 (9%) a | 0.69 ± 0.02 (11%) a | 0.55 ± 0.02 (11%) a | 0.59 ± 0.01 (12%) a | 0.53 ± 0.01 (10%) a |
| 10-HCO-H2folate | 2.27 ± 0.13 (30%) a | 2.52 ± 0.10 (34%) a | 2.13 ± 0.17 (34%) a | 2.28 ± 0.17 (35%) a | 1.21 ± 0.01 (24%) b | 3.02 ± 0.01 (58%) c | 2.91 ± 0.01 (56%) c |
| 10-HCO-PGA | 0.91 ± 0.01 (12%) a | 0.88 ± 0.01 (12%) a | 0.75 ± 0.02 (12%) a | 0.77 ± 0.02 (12%) a | 0.77 ± 0.02 (16%) a | 0.88 ± 0.01 (17%) a | 0.86 ± 0.01 (17%) a |
| H4folate | 0.88 ± 0.03 (12%) a | 0.67 ± 0.01 (9%) b | 0.36 ± 0.04 (6%) c | 0.25 ± 0.04 (4%) d | — | — | — |
| 5-CH3-H4folate | 1.00 ± 0.01 (13%) a | 0.98 ± 0.01 (13%) a | 0.79 ± 0.01 (13%) b | 0.79 ± 0.01 (12%) b | 0.70 ± 0.02 (14%) b | 0.32 ± 0.01 (6%) c | 0.51 ± 0.01 (10%) d |
| 5-HCO-H4folate | 1.10 ± 0.02 (15%) a | 1.06 ± 0.01(15%) a | 0.86 ± 0.01 (14%) b | 0.87 ± 0.01 (14%) b | 0.51 ± 0.02 (10%) c | 0.27 ± 0.01 (5%) d | 0.25 ± 0.01 (5%) d |
| 5,10-CH+-H4folate | 0.65 ± 0.07 (9%) a | 0.50 ± 0.01 (7%) a | 0.71 ± 0.08 (12%) b | 0.79 ± 0.08 (12%) b | 1.24 ± 0.02 (25%) c | 0.11 ± 0.01 (2%) d | 0.13 ± 0.01 (2%) d |
| Total | 7.50 ± 0.21 a | 7.31 ± 0.11 a | 6.19 ± 0.05 a | 6.43 ± 0.05 a | 4.97 ± 0.09 b | 5.19 ± 0.02 b | 5.18 ± 0.01 b |
The recovery of folates during extraction was high. The levels of total folate in sample N (7.50 ± 0.21 μg) and B (7.31 ± 0.11 μg) were similar, indicating that 5-minute boiling was safe for most of the folate vitamers. The folate distributions were similar, too, except for H4folate, which showed a significant decrease by 24% (p < 0.05) in sample B. H4folate is inherently unstable. A previous study reported that H4folate could be totally degraded within one hour under 37 °C, even with the presence of antioxidants.23 Therefore, rapid degradation of H4folate in a boiling water bath in this study was expected. Nevertheless, the 5-minute boiling, which was used to inactivate the enzymes (α-amylase, hog kidney conjugase and protease) in this study, should not cause any significant loss of most of the vitamers. Similarly, the extraction process, including 10-minute boiling, adjustment of pH and 3-hour incubation under 37 °C, had little impact on the total folate amount as well as the folate distribution, which can be seen by comparing samples I and IE. Six folate vitamers were detected in these samples, and only 5-CH3-H4folate showed a significant difference (p < 0.05), with a higher amount in sample IE (0.51 ± 0.01 μg) than in sample I (0.32 ± 0.01 μg). Since ascorbate and mercaptoethanol were included in the extraction process, these antioxidants could have protected 5-CH3-H4folate from oxidation. Indeed, the stabilizing effect of antioxidants, such as ascorbate and ascorbic acid, on 5-CH3-H4folate has been demonstrated in previous research.25,26 Therefore, the extraction method used in this study can efficiently protect folate from being degraded and simultaneously prevent interconversions among folate vitamers. This is consistent with the results published earlier by our group, which showed folate recoveries of 85–99% using a similar extraction process.24
In vitro digestion induced folate interconversion and degradation. Folates were stable during the oral phase, except for H4folate, as shown in Table 2 (samples A and O). H4folate underwent further degradation and was completely degraded during gastric digestion due to its inherent lability (samples O and G). Additionally, the interconversion of formyl folates began at the gastric stage. A considerably higher amount (p < 0.05) of 5,10-CH+-H4folate was observed in sample G (1.24 ± 0.02 μg), compared to sample O (0.79 ± 0.08 μg), while the amount of 5-HCO-H4folate and 10-HCO-H2folate decreased significantly (p < 0.05).
Consequently, the distribution of folate was altered. After oral digestion, 10-HCO-H2folate (34%) was the dominant vitamer (sample O), but 5,10-CH+-H4folate (35%) became the dominant folate during gastric digestion (sample G) due to the change in pH from the oral phase (pH = 7) to the gastric phase (pH = 3). 5-HCO-H4folate is stable in a neutral environment, but it will convert to 5,10-CH+-H4folate easily in an acidic solution.17 Since there was only a trace amount of reducing agent (coming from the stock solution) in the standard mixture, conversion from 10-HCO-H2folate to 5,10-CH+-H4folate was unlikely. Rather, a part of 10-HCO-H2folate could have been oxidised or cleaved into biologically inactive products.
The intestinal digestion triggered further changes to the folate vitamers, although the total folate amount remained similar. Considerably decreases (p < 0.05) were observed for 5-HCO-H4folate and 5,10-CH+-H4folate. Especially for 5,10-CH+-H4folate, a plummet of 91% was detected. Meanwhile, an increase in the amount of 10-HCO-H2folate from 1.21 ± 0.01 μg (sample G) to 3.02 ± 0.01 μg (sample I) was observed, making it the dominant vitamer (58%) in sample I. Seemingly, most 5,10-CH+-H4folate was converted to 10-HCO-H2folate during the intestinal phase (pH 7), as 5,10-CH+-H4folate is unstable at neutral pH.16 The amount of 5-CH3-H4folate started to decrease significantly (p < 0.05) in the intestinal phase, from 0.70 ± 0.02 μg (sample G) to 0.32 ± 0.01 μg (sample I), indicating that 5-CH3-H4folate was less sensitive to an acidic pH in the gastric phase than formyl folates, as previously reported by Lucock et al.27 Further, De Brouwer et al.28 reported that 5-CH3-H4folate was stable at 37 °C for 2 hours under a wide range of pH with the protection of antioxidants.
Additionally, unlike formyl folates, 5-CH3-H4folate has no interconversions but can be degraded to para-aminobenzoylglutamate (pABG)29 or be oxidised to an oxidation product: a pyrazino-s-triazine derivative of 4α-hydroxy-5-methyltetrahydrofolate called MeFox.30,31 However, neither pABG nor MeFox bound to the folate binding protein in the affinity column, and therefore we could not identify these degradation products with our current method. At the stage of intestinal digestion, the contribution of reduced folates (H4folate, 5-CH3-H4folate, 5-HCO-H4folate and 5,10-CH+-H4folate) was merely 13% (sample I), whereas it had been 45% (sample A) before the in vitro digestion. On the other hand, the fully oxidised folates (PGA, 10-HCO-PGA) were stable throughout the digestion and folate analyses.
The interconversion and degradation of single vitamers have been studied by Ringling and Rychlik (2017),14 but with a different in vitro digestion model. Overall, our results were in line with their results when digestion was carried out without the added ascorbic acid: the recoveries of PGA and 10-HCO-PGA were high (around 100%), and those of 5-CH3-H4folate and H4folate were low (0.2–4%). Moreover, they confirmed that the increases of 5,10-CH+-H4folate and 10-HCO-H2folate during the gastric phase and intestinal phase originated mainly from the conversion of 5-HCO-H4folate and 5,10-CH+-H4folate, respectively, which is also consistent with our results. One discrepancy was that we observed a decrease of 5-HCO-H4folate during intestinal digestion, whereas this vitamer was reported to be stable in their study. The reason for this could be the different pH adjustment methods used. Ringling and Rychlik14 used an automatic titrator in their model, and the pH was adjusted manually in our study. Since 5-HCO-H4folate is extremely sensitive to pH, more 5-HCO-H4folate could have been lost due to a less controllable pH adjustment in this study.
3.2 Total folate and folate bioaccessibility in bread
Table 3 summarises the total folate content and bioaccessibility of folate in the bread samples. Eight were rye breads, with total folate levels ranging from 14.0 ± 0.6 to 41.6 ± 1.8 μg/100 g FM. Four were oat (2) or wheat (2) breads, and their total folate content was between 11.9 ± 0.7 and 26.7 ± 3.2 μg/100 g FM. Three oat breads were baked in the laboratory, with the highest total folate content in LOB (18.8 ± 3.9 μg/100 g FM), followed by LOA (17.8 ± 3.6 μg/100 g FM) and LOC (11.5 ± 0.9 μg/100 g FM). Rye crispbread (RC), which contained 88% whole-grain rye flour and 4% rye bran (Table 1), had the highest total folate content, while white wheat toast (WT) had the lowest. Previous research has shown that folate in cereal grains is concentrated in the germ and bran.32 Therefore, whole-grain breads contain higher total folate levels than those with white flour. Comparable results can be found in a study by Patring et al.,33 who analysed the folate contents of 32 commercial bread samples from Norway and Sweden. They reported that the folate content ranged from 14 to 40 μg folic acid equivalents/100 g FW in soft breads and from 40 to 80 μg folic acid equivalents/100 g FW in crispbreads.| Bread | Total folate content (μg/100 g FM) | Folate bioaccessibility (%) | Contribution (%) of bioaccessible folate in 100 g bread to RDA | |
|---|---|---|---|---|
| Before digestion | After digestion | |||
| Values are expressed as mean ± standard deviation. For total folate contents before digestion, the standard deviations represent variation among three analytical replicates; for total folate contents after digestion and folate bioaccessibility, the standard deviations represent variation among triplicate digestions. Additionally, statistical differences between the folate contents before and after digestion are marked with * (p < 0.05) or ** (p < 0.01). LOA, LOB and LOC are whole-grain oat breads prepared in the laboratory using different oat cultivars. RDA means recommended dietary allowance, and RDA of folate is 400 μg for healthy adults.34 | ||||
| Whole-grain rye toast (RT) | 14.0 ± 0.6 | 11.5 ± 0.7** | 82 ± 5 | 2.9 |
| Whole-grain oat toast (OT) | 18.0 ± 2.5 | 14.1 ± 0.3 | 78 ± 2 | 3.5 |
| White wheat toast (WT) | 11.9 ± 0.7 | 9.4 ± 1.2* | 79 ± 10 | 2.4 |
| Rye flat portion bread (RF) | 15.9 ± 2.3 | 16.4 ± 1.1 | 103 ± 7 | 4.1 |
| Oat flat portion bread (OF) | 26.7 ± 3.2 | 16.1 ± 3.1* | 60 ± 12 | 4.0 |
| Whole-grain wheat toast (WGT) | 13.5 ± 1.1 | 12.7 ± 0.6 | 94 ± 4 | 3.2 |
| Rye flat portion bread with germinated rye (RGF) | 16.2 ± 2.8 | 15.3 ± 1.4 | 94 ± 9 | 3.8 |
| Traditional Finnish round rye bread (RR) | 18.2 ± 1.6 | 14.7 ± 1.2* | 81 ± 6 | 3.7 |
| Round rye bread with softer texture where wheat flour was added (RRW) | 15.9 ± 1.4 | 15.4 ± 2.2 | 97 ± 14 | 3.9 |
| Rye crispbread (RC) | 41.6 ± 1.8 | 33.1 ± 2.5* | 80 ± 6 | 8.3 |
| Round rye bread without added yeast (RRNY) | 18.5 ± 7.8 | 14.2 ± 0.8 | 77 ± 4 | 3.6 |
| Round rye bread baked in the afterheat of the oven (RRAO) | 15.7 ± 0.7 | 18.8 ± 0.6** | 120 ± 4 | 4.7 |
| LOA | 17.8 ± 3.6 | 5.5 ± 0.2* | 31 ± 1 | 1.4 |
| LOB | 18.8 ± 3.9 | 8.7 ± 0.6* | 46 ± 3 | 2.2 |
| LOC | 11.5 ± 0.9 | 11.7 ± 1.3 | 102 ± 11 | 2.9 |
The bioaccessibility of folate in the commercial breads varied from 60% ± 12% to 120% ± 4%, with 77% ± 4% to 120 ± 4% in rye breads, 60% ± 12% to 78% ± 2% in oat breads and 79% ± 10% to 94% ± 4% in wheat breads (Table 3). As for wheat bread, whole-grain wheat toast (WGT) had a higher bioaccessibility of folate than white wheat toast (WT). Similarly, rye breads with a higher proportion of whole-grain flour had higher folate bioaccessibility. For example, round rye bread baked in the afterheat of the oven (RRAO) contained 85% whole-grain rye flour (Table 1) and had the highest folate bioaccessibility of 120 ± 4%, while round rye bread without added yeast (RRNY) contained 73% wholemeal rye flour (Table 1) and had the lowest folate bioaccessibility among rye breads (77% ± 4%). Whole-grain bread was reported to have a higher content and bioaccessibility of phenolic compounds than white bread, and phenolic compounds are the main antioxidant in many cereal grains.35 Phenolic compounds could act as antioxidants and protect folates from oxidation during digestion, consequently resulting in a higher bioaccessibility of folate in bread.
Oat flat portion bread (OF) had the lowest folate bioaccessibility among commercial breads: 60% ± 12%. Additionally, the bioaccessibility of folate in whole-grain oat toast (OT) was not high (78% ± 2%). As for the oat bread prepared in the laboratory, significantly (p < 0.05) lower total folate contents were measured in LOA and LOB digesta, which resulted in the lowest folate bioaccessibility values: 31% ± 1% and 46% ± 3%, respectively. However, the bioaccessibility of folate in LOC was high with 102% ± 11%. Data about the baking quality of LOA, LOB and LOC has been reported by Sammalisto et al. (referred to F16, F25, F19 respectively),36 and LOC had the lowest crumb hardness value. Low bioaccessibility of folate in oat bread compared to the other breads could be linked to the existence of beta-glucan, which can slow down the in vitro digestion of starch by hindering the efficiency of amylase.37 This could influence the extractability of folate from bread matrices during digestion. Furthermore, as shown in Fig. 1(m–o), LOC had a more porous crumb structure compared to LOA and LOB. However, the differences between LOA and LOB were less obvious. Porous bread has been reported to be more accessible to digestive enzymes, which is related to thinner cell walls in porous bread than in bread with dense crumbs.38,39 The in vitro digestion of LOC could have been more complete than that of LOA and LOB. Therefore, more folate could have been released from the LOC than from the LOA and LOB, resulting in high folate bioaccessibility in the LOC.
Previous studies on folate bioaccessibility or bioavailability in bread have mainly focused on folate-fortified wheat bread, and the results showed that added PGA or 5-CH3-H4folate was well bioaccessible or bioavailable.9,12,40,41 For endogenous folate, folate from rye products and orange juice was shown to have a good bioavailability that was similar to folic acid from fortified white bread.10 Similarly, Ohrvik et al.11 reported 76% and 77% bioaccessibility of endogenous folates in wholemeal bread and rye bran bread, respectively, but 94% in a breakfast meal that contained bread, orange juice and kiwifruit. These results, together with the results of this study, imply that endogenous antioxidants in foods could stabilise folate during digestion and thus improve bioaccessibility or bioavailability.
3.3 Folate stability in breads during in vitro digestion
Due to the variation in the stability of folate vitamers, the distribution of folate in the commercial breads underwent significant changes during in vitro digestion, as shown in the pie charts of Fig. 3. The proportion of reduced folates (H4folate, 5-CH3-H4folate, 5-HCO-H4folate or 5,10-CH+-H4folate) in the commercial breads varied from 24% to 61%. 5-CH3-H4folate was the main contributor in whole-grain rye toast (RT, 36%), whole-grain oat flat portion bread (OF, 39%) and rye crispbread (RC, 32%), while in whole-grain oat flat portion bread (OT), it was 5-HCO-H4folate (28%). For the rest of the eight types of bread, the main vitamer was 10-HCO-H2folate or 10-HCO-PGA. In the bread digesta, the contribution of oxidised folates (10-HCO-H2folate, 10-HCO-PGA or PGA) was 72–97%, and 10-HCO-PGA became the dominant vitamer in all the bread samples (40–67%), except for rye crispbread (RC), where 10-HCO-H2folate was the main vitamer (53%). | ||
| Fig. 3 (a) Folate vitamer contents and (b) folate vitamer distributions in the commercial breads before and after digestion. The error bars of breads and bread digesta represent the standard deviation among triplicate analysis and triplicate digestions, respectively. In addition, * or ** indicates a significant difference in vitamer contents before and after digestion at a level of p < 0.05 or p < 0.01, respectively. A, RT, whole-grain rye toast; B, OT, whole-grain oat toast; C, WT, white wheat toast; D, RF, rye flat portion bread; E, OF, oat flat portion bread; F, WGT, whole-grain wheat toast; G, RGF, rye flat portion bread with germinated rye; H, RR, traditional Finnish round rye bread; I, RRW, round rye bread with a softer texture where wheat flour was added; J, RC, rye crispbread; K, RRNY, round rye bread without added yeast; L, RRAO, round rye bread baked in the afterheat of the oven. | ||
The decrease of reduced folates (H4folate, 5-CH3-H4folate, 5-HCO-H4folate or 5,10-CH+-H4folate) was common during the digestion for the commercial breads (Fig. 3). H4folate was detected only in rye crispbread (RC). 5-CH3-H4folate was detected in all commercial breads, but its content decreased significantly (p < 0.05) during digestion in most of the bread samples. Similarly, 5-HCO-H4folate was present in all the studied samples, but a decreasing trend was observed, except for whole-grain rye toast (RT) and round rye bread baked in the afterheat of the oven (RRAO), where 5-HCO-H4folate was shown to be stable. 5,10-CH+-H4folate was detected in all the bread samples, and for most samples, it was unstable during the digestion. The patterns of the reduced vitamers were in line with those from the experiment with the standard mixture. This indicated that potential endogenous antioxidants from the bread could not completely protect the reduced folates from degradation or conversion during in vitro digestion. 5-CH3-H4folate in bread matrices was stable in other studies,11,12 possibly because of the inclusion of sodium ascorbate or ascorbic acid in the digestion models. Although ascorbic acid is secreted into the human stomach,42 its capability as an antioxidant to protect folate during digestion is uncertain. Ringling and Rychlik14 found that the protective effect of the physiological concentration of ascorbic acid depended on the food matrices, and its protective effect towards 5-CH3-H4folate in wheat germ was limited. Additionally, our previous study showed that the physiological concentration of ascorbic acid did not significantly protect folates in cereal and legume flours during in vitro digestion.13 Therefore, the role of ascorbic acid in protecting endogenous folates in bread should be elucidated in future studies.
The changing patterns of oxidised folates (10-HCO-H2folate, 10-HCO-PGA or PGA) during in vitro digestion varied among the commercial breads (Fig. 3). 10-HCO-PGA in commercial bread was stable, which agrees with the conclusion from the digestion of the standard mixture. However, for several samples, significantly larger amounts of 10-HCO-PGA were detected in the bread digesta than in bread. This may be caused by the catalysation effect of metal ions, such as iron, in bread matrices. Iron compounds can catalyse the oxidation of formyl folates, for example, 10-HCO-H4folate to 10-HCO-H2folate.43 10-HCO-H2folate could be further oxidised to 10-HCO-PGA, resulting in an increase of 10-HCO-PGA in the digesta samples. On the other hand, the content of 10-HCO-H2folate in wheat and oat breads decreased during digestion, while in rye bread it was stable, and its content increased significantly (p < 0.05) in some samples (RC and RRAO). One possible explanation is the rich formyl folate pool in the rye. 10-HCO-H2folate could originate from the conversion of 5,10-CH+-H4folate or the oxidation of 10-HCO-H4folate. Furthermore, since the determination of 5-HCO-H4folate from rye samples was influenced by impurities in this study, its content could have been underestimated, as previous studies have reported that the level of 5-HCO-H4folate in rye bread was higher than that in wheat or oat bread.22,33 As for PGA, no significant difference was found between oat bread and digesta. In wheat bread, it seems to be degraded during digestion. However, the amount of PGA in wheat bread was low. In rye breads, PGA was not determined due to the masking by the impurities. Nevertheless, these material-dependent changing patterns of oxidised folates during in vitro digestion should be studied more in the future.
The changes in folate vitamers in whole-grain oat bread baked in the laboratory were consistent with those of the commercial breads (Fig. 4). The reduced folates decreased considerably (p < 0.05) during the digestion. 5,10-CH+-H4folate was relatively stable, but its level was low in the oat bread. 10-HCO-H2folate decreased in different degrees, with a plummet (p < 0.05) in LOA, but only a slight decrease in LOB and LOC. PGA was not detected in LOB, but its content was significantly (p < 0.05) higher in the digesta of LOA and LOC than in the respective bread samples. 10-HCO-PGA was stable as expected, and a significantly higher (p < 0.05) content of this vitamer was observed in the LOC digesta than in the bread, possibly due to a better release of folate from the LOC matrix than LOA and LOB. Oxidised folates accounted for 39–42% of the total folates in these breads, and their contribution was raised to 71–75% in the bread digesta.
 | ||
| Fig. 4 (A–C) (a) folate vitamer contents and (b) folate vitamer distributions in the whole-grain oat bread baked in the laboratory before and after digestion. The error bars of breads and bread digesta represent the standard deviation among triplicate analysis and triplicate digestions, respectively. The results are expressed as means ± standard deviation. In addition, * or ** indicates a significant difference in folate contents before and after digestion at a level of p < 0.05 or p < 0.01, respectively. | ||
3.4 Implications of macronutrient content and folate distribution for folate bioaccessibility
The commercial breads were separated into five main groups according to the PCA (Fig. 5). Rice crispbread (RC) was separated solely from other breads, mainly because of its high total folate level. In contrast, wheat breads (WT and WGT) were grouped mainly because of their relatively low total folate levels. Oat breads (OT and OF) formed a cluster mainly because of their higher fat content compared to the other breads in this study. Interestingly, whole-grain rye toast bread (RT) was also included in this cluster, which could be due to the inclusion of sunflower seeds as one of the ingredients (Table 1), yielding extra fat in the bread. Round rye breads (RR, RRW, RRNY and RRAO) were also clustered as a group, mainly because of their relatively high 10-HCO-PGA content and folate bioaccessibility. Rye flat portion breads (RF and RGF) were grouped in the middle of the biplot, with no significant correlation to any variables.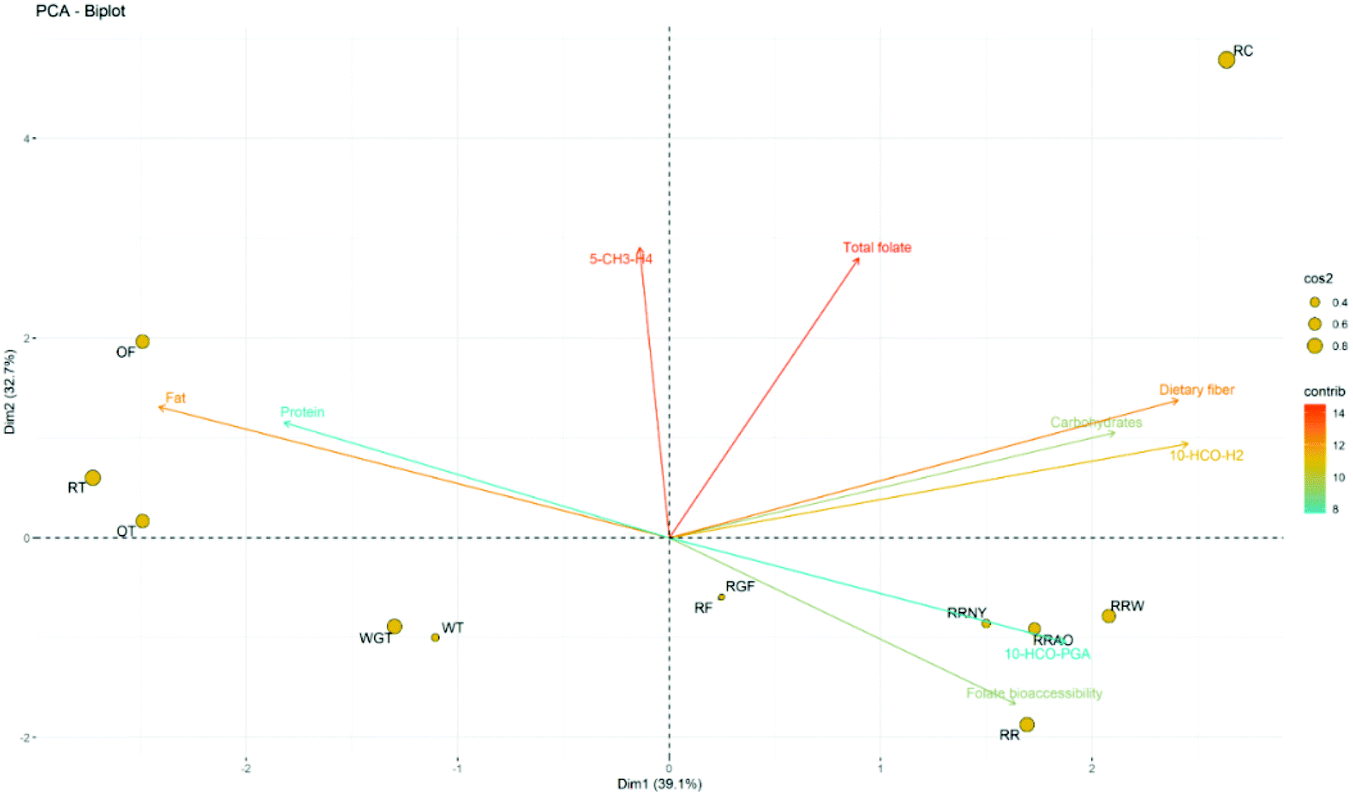 | ||
| Fig. 5 The biplot (dim 1–2) from the PCA of commercial bread. Dimensions 1 and 2 represent 39.1% and 32.7% of the total variances of the variables, respectively; cos2 comprises how well the individual was represented in this dim 1–2 biplot; contrb comprises the contribution of the variable to the dim 1–2 biplot. RT, whole-grain rye toast; OT, whole-grain oat toast; WT, white wheat toast; RF, rye flat portion bread; OF, oat flat portion bread; WGT, whole-grain wheat toast; RGF, rye flat portion bread with germinated rye; RR, traditional Finnish round rye bread; RRW, round rye bread with softer texture where wheat flour was added; RC, rye crispbread; RRNY, round rye bread without added yeast; RRAO, round rye bread baked in the afterheat of the oven. | ||
The directions of the arrows indicate the correlations among the variables (Fig. 5). Folate bioaccessibility and fat or protein content were negatively associated, while carbohydrate (starch) and dietary fibre content seemed to have a positive influence on folate bioaccessibility. Starch is the major component of bread. The presence of proteins and lipids in food matrices can decrease the digestibility of starch compared to those matrices with pure starch.44 Therefore, bread with high lipid or protein contents would be less digestible, and folate cannot be fully liberated during digestion, resulting in lower folate bioaccessibility. On the other hand, bioaccessibility was independent of total folate content. This echoes the findings of Seyoum and Selhub45 that foods with high folate contents did not necessarily have high folate bioavailability and vice versa.
5-CH3-H4folate correlated to the total folate content in the commercial bread to some extent but could impair folate bioaccessibility (Fig. 5). 5-CH3-H4folate was the main vitamer in whole-grain oat flat portion bread (OF), and this vitamer was lost completely during digestion, causing lower folate bioaccessibility (60% ± 12%) than that of whole-grain oat toast (OT, 78% ± 2%). Similarly, the folate bioaccessibility of whole-grain rye toast (RT, 82% ± 5%) and rye crispbread (RC, 80% ± 6%) was relatively low, and both had 5-CH3-H4folate as their dominant vitamer. Furthermore, rye flat portion bread (RF) and rye flat portion bread with germinated rye (RGF) were similar products in terms of their shape and textural characteristics. The latter bread contained more 5-CH3-H4folate than the former one. Previous research reported that germination improved the level of 5-CH3-H4folate in rye seeds.46 However, the bioaccessibility of folate in RGF (94% ± 9%) was lower than in RF (103% ± 7%), as most of the 5-CH3-H4folate was degraded during the digestion. From the results with the standard mixture, it is known that the loss of 5-CH3-H4folate occurred in the intestinal phase, where the absorption of folate takes place.47 5-CH3-H4folate is the most abundant folate vitamer in many plant materials.48 Based on the lability of 5-CH3-H4folate observed in this study, if this vitamer could not be protected before absorption, the bioavailability of folate would be undermined. An early study pointed out that 5-CH3-H4folate might be of less nutritional value due to its instability.49 To the best of our knowledge, studies on the changes in endogenous folate distribution during in vitro digestion are rare. Ringling et al.14 reported that the stability of 5-CH3-H4folate affected the bioaccessibility of folate in wheat germ. Therefore, combined with the results of this study, foods that are rich in 5-CH3-H4folate may have low bioaccessibility or bioavailability.
10-HCO-PGA and folate bioaccessibility were positively correlated (Fig. 5). Furthermore, breads with high folate bioaccessibility had a small proportion of reduced folates (H4folate, 5-CH3-H4folate, 5-HCO-H4folate or 5,10-CH+-H4folate), but on the other hand, a small proportion of reduced folates in the folate composition did not guarantee high folate bioaccessibility in the bread matrices. All the round rye breads in this study had small reduced-folate content, with percentages ranging from 28% to 38%. Round rye bread is a traditional Finnish bread with a dense and hard structure. It has a larger heating surface area than other breads in the oven; therefore, the reduced folates could have been oxidised or degraded during the processing. Nevertheless, this could improve folate bioaccessibility, as the folates would be stable enough to survive digestion. However, the round rye bread with a softer texture where wheat flour was added (RRW) had a relatively low folate bioaccessibility of 77% ± 4% in this study, and the traditional Finnish round rye bread (RR) had a bioaccessibility of 81% ± 6%. In these two types of bread, the content of 10-HCO-PGA did not increase during digestion as it did in the round rye bread without added yeast (RRNY) and round rye bread baked in the afterheat of the oven (RRAO), as shown in Fig. 3 (H, I, K and L). 10-HCO-PGA was stable during the in vitro digestion (Table 2); therefore, the increase in 10-HCO-PGA could be due to the different formyl folate pools in the round rye bread. The folates that were not studied in this paper, such as 10-HCO-H4folate,49 could contribute to the total folate, although it was determined to be 10-HCO-H2folate and 10-HCO-PGA in this study. In this case, for the bread with 10-HCO-PGA increasing during digestion, folate bioaccessibility could be overestimated.
3.5 Hypothesised pathway of folate interconversion and degradation during digestion
Based on the results from this study, together with those from previous reports,14–17,50 the possible interconversion and oxidation pathways of food folates are summarised in Fig. 6. H4folate in foods could undergo losses during mastication and then complete degradation in the gastric phase. Since the pH will drop significantly in the stomach, interconversions of formyl folates will be triggered. 5-HCO-H4folate would be converted to 5,10-CH+-H4folate. 10-HCO-H4folate (not studied in this paper) would also be converted to 5,10-CH+-H4folate. 10-HCO-H2folate could be oxidised to 10-HCO-PGA or degraded during this stage. However, with the presence of antioxidants from food matrices, 10-HCO-H2folate could be reduced to 10-HCO-H4folate, which would be further converted to 5,10-CH+-H4folate. Likewise, the original 5-CH3-H2folate present in food matrices could be reduced to 5-CH3-H4folate by endogenous antioxidants. In the intestinal phase, where the pH is neutral, 5,10-CH+-H4folate would be converted back to 5-HCO-H4folate or 10-HCO-H4folate, and 10-HCO-H4folate could be degraded or oxidised to 10-HCO-H2folate and, subsequently, to 10-HCO-PGA. In some food matrices with high levels of metal ions, more 10-HCO-H2folate would be oxidised to 10-HCO-PGA because of the catalytic effect. Additionally, 10-HCO-H4folate could also undergo isomerisation to 5-HCO-H4folate under long-term incubation at 37 °C. Losses of 5-CH3-H4folate would begin in the intestine, and 5-CH3-H4folate would be degraded or oxidised to 5-CH3-H2folate and MeFox. Many food matrices have been reported to be rich in MeFox, which is the main oxidation product of 5-CH3-H4folate.51,52 However, MeFox does not have bioactivity. PGA, which has been reported to be the most stable folate, could also suffer from losses in some food matrices during the intestinal phase. | ||
| Fig. 6 Hypothesized pathway of the folate interconversion and degradation during digestion. | ||
4. Conclusion
This study investigated the bioaccessibility of folate in bread and changes in vitamer patterns during in vitro digestion. Folate bioaccessibility varied among bread types, ranging from 31 ± 1 to 120 ± 4%. The data of the individual folate vitamers revealed three major trends in terms of folate stability during in vitro digestion: (1) the decrease of reduced folates (5-CH3-H4folate, 5-HCO-H4folate and 5,10-CH+-H4folate); (2) the interconversion among formyl folates (5-HCO-H4folate, 10-HCO-H2folate and 5,10-CH+-H4folate; and (3) the high stability of the oxidised folates (PGA and 10-HCO-PGA). These trends could be universal for all samples, but the degree of change would vary among the different materials, as demonstrated by the data from the bread matrices in this study. Therefore, to improve the bioaccessibility of folate, we could (1) stabilise the reduced folates during digestion and (2) increase the contribution of oxidised folates to the total folate in foods. Additionally, the results from the whole-grain oat breads prepared in the laboratory indicated that the digestibility of foods can play an important role in the bioaccessibility of endogenous folates.Although the prediction of folate bioaccessibility is complex, we discovered some common changing patterns of folate vitamers during in vitro digestion. Factors that could influence the stability of folates during digestion should be studied, such as the antioxidant capacity and buffer capacity of foods. Furthermore, the food structure can affect the digestibility of foods, which would further influence the extractability of endogenous folates during digestion. In the future, more studies should be carried out to systematically investigate the effects of the above-mentioned factors on folate bioaccessibility or bioavailability.
Author contributions
Fengyuan Liu: conceptualization, investigation, data curation, visualization, writing – original draft. Susanna Kariluoto: conceptualization, writing – review & editing, supervision. Minnamari Edelmann: writing – review & editing, supervision. Vieno Piironen: writing – review & editing, supervision.Conflicts of interest
There are no conflicts to declare.Acknowledgements
The authors would like to thank Miikka Olin for his kind help in UHPLC analysis, Saara Sammalisto for baking oat bread in the laboratory, the China Scholarship Council (CSC) for financial support for the PhD project of Fengyuan Liu, and the Finnish Food Research Foundation for a research grant.References
- R. Obeid, K. Oexle, A. Rißmann, K. Pietrzik and B. Koletzko, Folate status and health: challenges and opportunities, J. Perinat. Med., 2016, 44, 261–268 CAS.
- S. Cauvain, Technology of Breadmaking, Springer International Publishing, Cham, 2015, Bread: the product, pp. 1–22 Search PubMed.
- A. D. Smith, Folic acid fortification: the good, the bad, and the puzzle of vitamin B-12, Am. J. Clin. Nutr., 2007, 85, 3–5 CrossRef CAS PubMed.
- H. Boz, Effect of processing on cereal folates, J. Cereal Sci., 2021, 99, 103202 CrossRef CAS.
- R. Lopez-Nicolas, C. Frontela-Saseta, R. Gonzalez-Abellan, A. Barado-Piqueras, D. Perez-Conesa and G. Ros-Berruezo, Folate fortification of white and whole-grain bread by adding Swiss chard and spinach. Acceptability by consumers, LWT–Food Sci. Technol., 2014, 59, 263–269 CrossRef CAS.
- P. M. Finglas, C. M. Witthoft, L. Vahteristo, A. J. A. Wright, S. Southon, F. A. Mellon, B. Ridge and P. Maunder, Use of an oral/intravenous dual-label stable-isotope protocol to determine folic acid bioavailability from fortified cereal grain foods in women, J. Nutr., 2002, 132, 936–939 CrossRef CAS PubMed.
- T. J. Green, Y. Z. Liu, S. Dadgar, W. Y. Li, R. Bohni and D. D. Kitts, Wheat rolls fortified with microencapsulated L-5-methyltetrahydrofolic acid or equimolar folic acid increase blood folate concentrations to a similar extent in healthy men and women, J. Nutr., 2013, 143, 867–871 CrossRef CAS PubMed.
- M. Johansson, C. M. Witthoft, A. Bruce and M. Jagerstad, Study of wheat breakfast rolls fortified with folic acid - The effect on folate status in women during a 3-month intervention, Eur. J. Nutr., 2002, 41, 279–286 CrossRef CAS PubMed.
- V. E. Ohrvik, B. E. Buttner, M. Rychlik, E. Lundin and C. M. Witthoft, Folate bioavailability from breads and a meal assessed with a human stable-isotope area under the curve and ileostomy model, Am. J. Clin. Nutr., 2010, 92, 532–538 CrossRef PubMed.
- L. Vahteristo, S. Kariluoto, S. Barlund, M. Karkkainen, C. Lamberg-Allardt, H. Salovaara and V. Piironen, Functionality of endogenous folates from rye and orange juice using human in vivo model, Eur. J. Nutr., 2002, 41, 271–278 CrossRef CAS PubMed.
- V. Ohrvik, H. Ohrvik, J. Tallkvist and C. Witthoft, Folates in bread: retention during bread-making and in vitro bioaccessibility, Eur. J. Nutr., 2010, 49, 365–372 CrossRef PubMed.
- M. V. Chandra-Hioe, R. Addepalli, S. A. Osborne, I. Slapetova, R. Whan, M. P. Bucknall and J. Arcot, Transport of folic acid across Caco-2 cells is more effective than 5-methyltetrahydrofolate following the in vitro digestion of fortified bread, Food Res. Int., 2013, 53, 104–109 CrossRef CAS.
- F. Liu, S. Kariluoto, M. Edelmann and V. Piironen, Bioaccessibility of folate in faba bean, oat, rye and wheat matrices, Food Chem., 2021, 350, 129259 CrossRef CAS PubMed.
- C. Ringling and M. Rychlik, Simulation of food folate digestion and bioavailability of an oxidation product of 5-Methyltetrahydrofolate, Nutrients, 2017, 9, 969 CrossRef PubMed.
- J. Jastrebova, M. Axelsson, H. S. Strandler and M. Jägerstad, Stability of dietary 5-formyl-tetrahydrofolate and its determination by HPLC: a pilot study on impact of pH, temperature and antioxidants on analytical results, Eur. Food Res. Technol., 2013, 237, 747–754 CrossRef CAS.
- H. S. Strandler, J. Patring, M. Jagerstad and J. Jastrebova, Challenges in the determination of unsubstituted food folates: impact of stabilities and conversions on analytical results, J. Agric. Food Chem., 2015, 63, 2367–2377 CrossRef CAS PubMed.
- M. Jagerstad and J. Jastrebova, Occurrence, stability, and determination of formyl folates in foods, J. Agric. Food Chem., 2013, 61, 9758–9768 CrossRef PubMed.
- F. Bationo, C. Humblot, L. T. Songré-Ouattara, F. Hama-Ba, M. Le Merrer, M. Chapron, S. Kariluoto and Y. M. Hemery, Total folate in West African cereal-based fermented foods: Bioaccessibility and influence of processing, J. Food Compos. Anal., 2020, 85, 103309 CrossRef CAS.
- M. Hiolle, V. Lechevalier, J. Floury, N. Boulier-Monthéan, C. Prioul, D. Dupont and F. Nau, In vitro digestion of complex foods: How microstructure influences food disintegration and micronutrient bioaccessibility, Food Res. Int., 2020, 128, 108817 CrossRef CAS PubMed.
- C. Buffiere, M. Hiolle, M. A. Peyron, R. Richard, N. Meunier, C. Batisse, D. Remond, D. Dupont, F. Nau, B. Pereira and I. Savary-Auzeloux, Food matrix structure (from Biscuit to Custard) has an impact on folate bioavailability in healthy volunteers, Eur. J. Nutr., 2021, 60, 411–423 CrossRef CAS PubMed.
- M. Minekus, M. Alminger, P. Alvito, S. Ballance, T. Bohn, C. Bourlieu, F. Carriere, R. Boutrou, M. Corredig, D. Dupont, C. Dufour, L. Egger, M. Golding, S. Karakaya, B. Kirkhus, S. Le Feunteun, U. Lesmes, A. Macierzanka, A. Mackie, S. Marze, D. J. McClements, O. Menard, I. Recio, C. N. Santos, R. P. Singh, G. E. Vegarud, M. S. J. Wickham, W. Weitschies and A. Brodkorb, A standardised static in vitro digestion method suitable for food - an international consensus, Food Funct., 2014, 5, 1113–1124 RSC.
- S. Kariluoto, L. Vahteristo, H. Salovaara, K. Katina, K. H. Liukkonen and V. Piironen, Effect of baking method and fermentation on folate content of rye and wheat breads, Cereal Chem., 2004, 81, 134–139 CrossRef CAS.
- I. Jokinen, J.-M. Pihlava, A. Puganen, T. Sontag-Strohm, K. M. Linderborg, U. Holopainen-Mantila, V. Hietaniemi and E. Nordlund, Predicting the properties of industrially produced oat flours by the characteristics of native oat grains or non-heat-treated groats, Foods, 2021, 10, 1552 CrossRef CAS PubMed.
- M. Edelmann, S. Kariluoto, L. Nystrom and V. Piironen, Folate in oats and its milling fractions, Food Chem., 2012, 135, 1938–1947 CrossRef CAS PubMed.
- M. L. Jones and P. F. Nixon, Tetrahydrofolates are great stabilized by binding to bovine milk folate-binding protein, J. Nutr., 2002, 132, 2690–2694 CrossRef CAS PubMed.
- A. L. Herbig, N. Delchier, L. Striegel, M. Rychlik and C. Renard, Stability of 5-methyltetrahydrofolate in fortified apple and carrot purees, LWT–Food Sci. Technol., 2019, 107, 158–163 CrossRef CAS.
- M. D. Lucock, M. Green, R. Hartley and M. I. Levene, Physicochemical and biological factors influencing methylfolate stability: use of dithiothreitol for HPLC analysis with electrochemical detection, Food Chem., 1993, 47, 79–86 CrossRef CAS.
- V. De Brouwer, G. F. Zhang, S. Storozhenko, D. Van Der Straeten and W. E. Lambert, pH stability of individual folates during critical sample preparation steps in prevision of the analysis of plant folates, Phytochem. Anal., 2007, 18, 496–508 CrossRef CAS PubMed.
- X. W. Ng, M. Lucock and M. Veysey, Physicochemical effect of pH and antioxidants on mono-and triglutamate forms of 5-methyltetrahydrofolate, and evaluation of vitamin stability in human gastric juice: Implications for folate bioavailability, Food Chem., 2008, 106, 200–210 CrossRef CAS.
- C. Ringling and M. Rychlik, Origins of the difference between food folate analysis results obtained by LC-MS/MS and microbiological assays, Anal. Bioanal. Chem., 2017, 409, 1815–1825 CrossRef CAS PubMed.
- G. R. Gapski, J. M. Whiteley and F. M. Huennekens, Hydroxylated derivatives of 5-methyl-5,6,7,8-tetrahydrofolate, Biochemistry, 1971, 10, 2930–2934 CrossRef CAS PubMed.
- M. Edelmann, S. Kariluoto, L. Nystrom and V. Piironen, Folate in barley grain and fractions, J. Cereal Sci., 2013, 58, 37–44 CrossRef CAS.
- J. Patring, M. Wandel, M. Jägerstad and W. Frølich, Folate content of Norwegian and Swedish flours and bread analysed by use of liquid chromatography–mass spectrometry, J. Food Compos. Anal., 2009, 22, 649–656 CrossRef CAS.
- World Health Organization, Vitamin and Mineral Requirements in Human Nutrition, Report of a Joint FAO/WHO Expert Consultation, World Health Organization, Bangkok, Thailand, 2004 Search PubMed.
- D. Angelino, M. Cossu, A. Marti, M. Zanoletti, L. Chiavaroli, F. Brighenti, D. Del Rio and D. Martini, Bioaccessibility and bioavailability of phenolic compounds in bread: a review, Food Funct., 2017, 8, 2368–2393 RSC.
- S. Sammalisto, M. Laitinen and T. Sontag-Strohm, Baking quality assessment of twenty whole grain oat cultivar samples, Foods, 2021, 10, 2461 CrossRef CAS PubMed.
- H. J. Kim and P. J. White, Interactional effects of β-glucan, starch, and protein in heated oat slurries on viscosity and in vitro bile acid binding, J. Agric. Food Chem., 2012, 60, 6217–6222 CrossRef CAS PubMed.
- S. Pentikainen, N. Sozer, J. Narvainen, S. Ylatalo, P. Teppola, J. Jurvelin, U. Holopainen-Mantila, R. Torronen, A. M. Aura and K. Poutanen, Effects of wheat and rye bread structure on mastication process and bolus properties, Food Res. Int., 2014, 66, 356–364 CrossRef CAS.
- V. Mathieu, A. F. Monnet, S. Jourdren, M. Panouille, C. Chappard and I. Souchon, Kinetics of bread crumb hydration as related to porous microstructure, Food Funct., 2016, 7, 3577–3589 RSC.
- D. A. Neves, K. B. de Sousa Lobato, R. S. Angelica, J. T. Filho, G. P. R. de Oliveira and H. T. Godoy, Thermal and in vitro digestion stability of folic acid in bread, J. Food Compos. Anal., 2019, 84, 103311 CrossRef CAS.
- C. M. Witthöft, K. Forssén, L. Johannesson and M. J. N. Jägerstad, Folates-food sources, analyses, retention and bioavailability, Food Nutr. Res., 1999, 43, 138–146 Search PubMed.
- G. M. Sobala, C. J. Schorah, M. Sanderson, M. F. Dixon, D. S. Tompkins, P. Godwin and A. T. R. Axon, Ascorbic acid in the human stomach, Gastroenterology, 1989, 97, 357–363 CrossRef CAS.
- J. E. Baggott, C. B. Robinson, I. Eto, G. L. Johanning and P. E. Cornwell, Iron compounds catalyze the oxidation of 10-formyl-5,6,7,8-tetrahydrofolic acid to 10-formyl-7,8-dihydrofolic acid, J. Inorg. Biochem., 1998, 71, 181–187 CrossRef CAS PubMed.
- J. Singh, A. Dartois and L. Kaur, Starch digestibility in food matrix: a review, Trends Food Sci. Technol., 2010, 21, 168–180 CrossRef CAS.
- E. Seyoum and J. Selhub, Properties of Food Folates Determined by Stability and Susceptibility to Intestinal Pteroylpolyglutamate Hydrolase Action, J. Nutr., 1998, 128, 1956–1960 CrossRef CAS PubMed.
- S. Kariluoto, K. H. Liukkonen, O. Myllymaki, L. Vahteristo, A. Kaukovirta-Norja and V. Piironen, Effect of germination and thermal treatments on folates in rye, J. Agric. Food Chem., 2006, 54, 9522–9528 CrossRef CAS PubMed.
- A. M. Reisenauer, C. L. Krumdieck and C. H. Halsted, Folate conjugase: two separate activities in human jejunum, Science, 1977, 198, 196–197 CrossRef CAS PubMed.
- A. D. Hanson and J. F. Gregory, Folate bosynthesis, turnover, and transport in plants, Annu. Rev. Plant Biol., 2011, 62, 105–125 CrossRef CAS PubMed.
- J. D. Obroin, I. J. Temperley, J. P. Brown and J. M. Scott, Nutritional stability of various naturally occurring monoglutamate derivatives of folic-acid, Am. J. Clin. Nutr., 1975, 28, 438–444 CrossRef CAS PubMed.
- L. Gmelch, D. Wirtz, M. Witting, N. Weber, L. Striegel, P. Schmitt-Kopplin and M. Rychlik, Comprehensive vitamer profiling of folate mono- and polyglutamates in baker's yeast (Saccharomyces cerevisiae) as a function of different sample preparation procedures, Metabolites, 2020, 10, 301 CrossRef CAS PubMed.
- M. Shahid, T. Lian, X. Wan, L. Jiang, L. D. Han, C. Y. Zhang and Q. J. Liang, Folate monoglutamate in cereal grains: Evaluation of extraction techniques and determination by LC-MS/MS, J. Food Compos. Anal., 2020, 91, 103510 CrossRef CAS.
- H. X. Zhang, A. B. Jha, T. D. Warkentin, A. Vandenberg and R. W. Purves, Folate stability and method optimization for folate extraction from seeds of pulse crops using LC-SRM MS, J. Food Compos. Anal., 2018, 71, 44–55 CrossRef CAS.
Footnote |
| † Electronic supplementary information (ESI) available. See DOI: 10.1039/d1fo03352b |
| This journal is © The Royal Society of Chemistry 2022 |