 Open Access Article
Creative Commons Attribution 3.0 Unported Licence
Diffraction contrast in cryo-scanning transmission electron tomography reveals the boundary of hemozoin crystals in situ†
Debakshi
Mullick
 a,
Katya
Rechav
 b,
Leslie
Leiserowitz
 c,
Neta
Regev-Rudzki
 d,
Ron
Dzikowski
 e and
Michael
Elbaum
 *a
*a
aDepartment of Chemical and Biological Physics, Faculty of Chemistry, Weizmann Institute of Science, Rehovot, Israel. E-mail: debakshi.mullick@weizmann.ac.il; debakshimullick@gmail.com; michael.elbaum@weizmann.ac.il
bElectron Microscopy Unit, Chemical Research Support, Weizmann Institute of Science, Rehovot, Israel
cDepartment of Molecular Chemistry and Materials Science, Faculty of Chemistry, Weizmann Institute of Science, Rehovot, Israel
dDepartment of Biomolecular Sciences, Faculty of Biochemistry, Weizmann Institute of Science, Rehovot, Israel
eDepartment of Microbiology and Molecular Genetics, Institute for Medical Research Israel-Canada, and The Kuvin Center for the Study of Infectious and Tropical Diseases, The Hebrew University-Hadassah Medical School, Jerusalem, Israel
First published on 27th May 2022
Abstract
Malaria is a potentially fatal infectious disease caused by the obligate intracellular parasite Plasmodium falciparum. The parasite infects human red blood cells (RBC) and derives nutrition by catabolism of hemoglobin. As amino acids are assimilated from the protein component, the toxic heme is released. Molecular heme is detoxified by rapid sequestration to physiologically insoluble hemozoin crystals within the parasite's digestive vacuole (DV). Common antimalarial drugs interfere with this crystallization process, leaving the parasites vulnerable to the by-product of their own metabolism. A fundamental debate with important implications on drug mechanism regards the chemical environment of crystallization in situ, whether aqueous or lipid. This issue had been addressed previously by cryogenic soft X-ray tomography. We employ cryo-scanning transmission electron tomography (CSTET) to probe parasite cells throughout the life cycle in a fully hydrated, vitrified state at higher resolution. During the acquisition of CSTET data, Bragg diffraction from the hemozoin provides a uniquely clear view of the crystal boundary at nanometer resolution. No intermediate medium, such as a lipid coating or shroud, could be detected surrounding the crystals. The present study describes a unique application of CSTET in the study of malaria. The findings can be extended to evaluate new drug candidates affecting hemozoin crystal growth.
1 Introduction
Malaria remains one of the most serious and life-threatening infectious diseases in the present times. The global burden of the disease estimated in 2020 by the WHO was 241 million cases, with a death toll of 896![[thin space (1/6-em)]](https://www.rsc.org/images/entities/char_2009.gif) 000.1 The causative agent of malaria is a unicellular protozoan parasite Plasmodium, which is transmitted by the bite of an infected female Anopheles spp. mosquito. Among the five parasite species that can infect humans, malaria caused by P. falciparum is the most fatal. The high mortality rate is attributed to multiple complications, of which cerebral malaria (CM) is the most severe.2 Even when CM improves upon treatment with potent antimalarial drugs, survivors can experience debilitating after-effects such as seizures and neurocognitive deficits, especially in pediatric patients.2–4
000.1 The causative agent of malaria is a unicellular protozoan parasite Plasmodium, which is transmitted by the bite of an infected female Anopheles spp. mosquito. Among the five parasite species that can infect humans, malaria caused by P. falciparum is the most fatal. The high mortality rate is attributed to multiple complications, of which cerebral malaria (CM) is the most severe.2 Even when CM improves upon treatment with potent antimalarial drugs, survivors can experience debilitating after-effects such as seizures and neurocognitive deficits, especially in pediatric patients.2–4
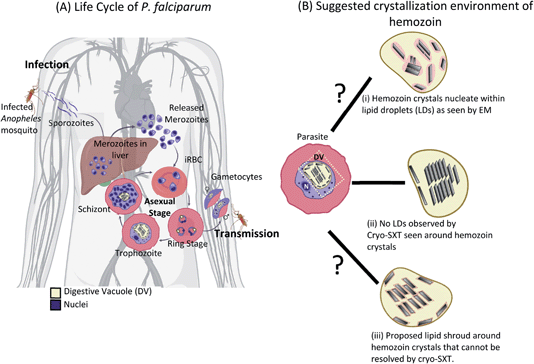
Within the human host, after a brief asymptomatic phase within liver cells, P. falciparum parasites infect and thrive within red blood cells (RBC), giving rise to the clinical phase of malaria. The life cycle within the infected RBC (iRBC) lasts for about 48 hours (intraerythrocytic developmental cycle or IDC).5 During this time, the parasite undergoes distinct developmental transformations, i.e., ring, trophozoite, and schizont stages (Fig. 1A), throughout which the developing parasite derives most of its nutrition from hemoglobin within a digestive vacuole (DV).6,7 Catabolism of hemoglobin results in the assimilation of amino acids8 and the release of the iron-containing heme.9,10 The released heme is toxic to the parasite as it can catalyze the formation of reactive oxygen species causing damage to lipids and proteins.11 Instead, heme is rapidly detoxified by sequestration to physiologically insoluble hemozoin crystals within the DV.12,13 Hemozoin is often referred to as the ‘malaria pigment’. Hemozoin crystals remain within the DV until the daughter parasites burst out of the iRBC, at which point the crystals spill out into the bloodstream eliciting an immune response in the host.14
Disruption of the heme detoxification processes is an important target for many existing antimalarial drugs.15–19 The spread of resistance to these drugs20–22 motivates a search for new treatments.23 Given that hemozoin is a chemically fixed structure whose production is both indispensable and unique to the parasite, inhibition of heme detoxification processes still remains an essential drug target.17,24 An improved understanding of the mechanism of hemozoin formation will be crucial in discovering new drug candidates.
The crystallization environment of hemozoin within the DV has been the subject of a long-standing debate in the field (Fig. 1B). At first, hemozoin was considered a polymer that resulted from the sequestration of heme within the DV.25,26 Later studies on hemozoin with X-ray diffraction and electron paramagnetic resonance (EPR) confirmed the crystalline nature of hemozoin, which comprises regularly repeated dimers of β-hematin with a (FeIII–protoporphyrin-IX)2 center.27,28 Given the hydrophobic nature of heme porphyrin, it was proposed that its crystallization, and before that, hemozoin ‘polymerization’ occur within lipid droplets.29,30 Moreover, biochemical fractionations of infected red blood cells (iRBCs) identify neutral lipids associated with the hemozoin crystals.31,32 Consistently, in vitro assays yielding the synthetic analog β-hematin require a fraction of octanol to dissolve the heme in water.33 Direct observation of a phospholipid layer surrounding synthetic β-hematin was made with cryogenic transmission electron microscopy (cryo-TEM), and it was suggested that this lipid layer aided the crystal formation.34
However, similar observations were not made in hemozoin crystals enclosed within the DV of the parasite. The absence of evidence by electron microscopy for a lipid environment surrounding hemozoin in iRBCs was explained by the harsh protocols used to prepare plastic-embedded blocks. In particular, it was proposed that dehydration using an organic solvent might extract the lipid. Upon treatment with the lipid-stabilizing reagent malachite green, a pool of stained material was detected surrounding hemozoin crystals inside the DV, and this was identified as the lipid droplet.29 However, subsequent studies of intact parasites by soft X-ray cryo-tomography (SXT) found no evidence of lipid surrounding the hemozoin in intact parasites.35–37 Soft X-ray microscopy and tomography are well suited to whole-cell investigations of Plasmodium due to the long penetration depth and the quantitative nature of the contrast.38–41 SXT is doubly suited to detecting lipid bodies: (a) physical fixation by vitrification retains both morphology and composition of the specimen, and (b) the image contrast is fundamentally based on atomic absorption of low energy X-rays by carbon. It is impossible to hide lipid if present, so the absence of contrast against water is clear evidence of the absence of lipid surrounding the crystals. Crystals were observed to float in the aqueous environment directly and possibly grow from the DV's inner membrane.35 Indeed, it would be challenging to observe heme crystals with sharp facets had they been immersed within a lipid drop (refer to Fig. 4 Kapishnikov et al., 2021).41 The spatial resolution of SXT is limited to about 25 nm, however, and therefore it was suggested to reconcile the models by the presence of a thin ‘lipid shroud’ surrounding the crystals.42,43
Here we address the nature of the hemozoin–water interface in biogenic hemozoin using an orthogonal cryo-tomography method, Cryogenic Scanning Transmission Electron Tomography (CSTET). This method has been developed in complement to conventional wide-field cryo-electron tomography44,45 and is highly sensitive to crystallinity. Based on scanning transmission electron microscopy (STEM), a focused probe rasters across the specimen while transmitted electrons are detected on the opposite side. The contrast reflects the scattering of electrons away from the incident illumination direction. Proper configuration of the STEM modality enables imaging of thick specimens (even 1 μm or more) without the need for plastic embedding or the addition of heavy metal stains. A series of projection images are obtained by tilting the specimen through a range of angles, and three-dimensional reconstructions are generated from the tilt-series.
We used ring, trophozoite and schizont stage parasites for CSTET imaging of hemozoin crystals within the DV of intact iRBCs. In the aligned tilt-series, the crystals become suddenly dark at particular tilt angles where Bragg diffraction conditions are met. This sudden change in contrast helps us look for a putative ‘lipid shroud’ surrounding the hemozoin crystals.
2 Experimental section
2.1 Parasite culture and isolation of stages
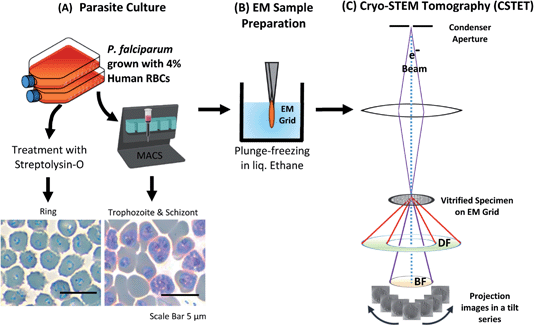
Plasmodium falciparum (NF54) culture was maintained in RPMI supplemented with hypoxanthine and AlbuMAX™ II Lipid-Rich BSA. at 4% hematocrit (packed cell volume of RBCs) at 37 °C using a gas mixture of 1% oxygen, 5% carbon dioxide in a nitrogenous atmosphere. The parasites were synchronized using sorbitol treatment.46 The trophozoite stage with well-developed hemozoin was enriched magnetically using MACS® columns (Miltenyi Biotech).47 Ring-stage parasites were selected by streptolysin-O (SLO) treatment48 and given an hour to recover before sample preparation for electron microscopy (Fig. 2).2.2 Preparation of EM samples
Intact iRBCs were applied to standard Quantifoil™ R 3.5/1 on 200 copper mesh EM grids having holes of 3.5 μm diameter, blotted with filter paper from behind, and plunged into liquid ethane for vitrification using the Leica EM-GP Plunger (Leica Microsystems). As the hole size is smaller than the iRBC, the cells tend to lodge. Often, they burst, exposing the parasites. Sometimes the parasites also burst, spreading the contents onto the surrounding area. We have used intact as well as burst-out hemozoin for our studies. Focused ion beam (FIB) milling was performed in the CrossBeam-500 FIB-SEM (Zeiss, Germany) scanning electron microscope (SEM) to create a thin lamella (300 nm thickness) from iRBCs plunged on Quantifoil™ R 2/2 on 200 copper mesh EM grids with holes of 2 μm diameter.2.3 CSTET acquisition and analysis
Tomographic series of tilted STEM images were collected using different microscopes – Talos Arctica/Tecnai T20F (200 kV) or Titan Krios (300 kV) microscopes (Thermo Fisher Scientific). A focused-probe beam of 1.2 mrad semi-convergence angle (∼2 nm diameter) was used, over a typical tilt range from −60 to 60 degrees with an interval of 2-degree tilt, with a frame size of 2048 × 2048 pixels. The same imaging parameters were maintained for CSTET while using FIB milled lamellae as well. The series were aligned using IMOD software and reconstructed by weighted back-projection and SIRT-like filter with 30 iterations.49 It was visualized using UCSF Chimera50 and analyzed using FIJI.513 Results and discussion
3.1 Trophozoite stage hemozoin crystals align together within the DV and are not surrounded by an observable lipid shroud
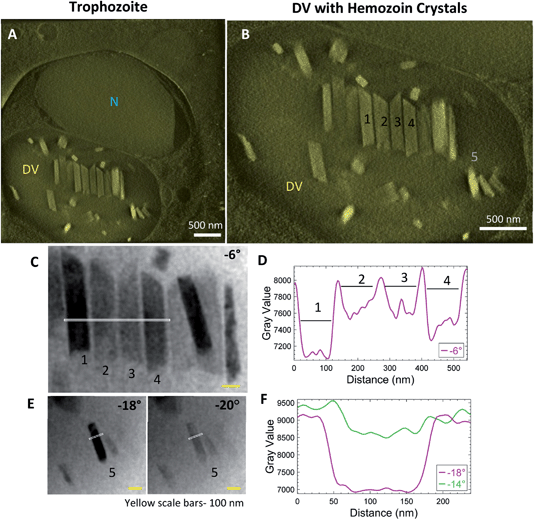
Synchronized P. falciparum cultures were smeared and stained with Giemsa to verify the stage before subjecting to MACS for enrichment. Tilt-series reconstruction from intact, plunge-frozen parasites showed DVs enclosing hemozoin crystals. Fig. 3 shows an example of a trophozoite stage parasite with a single large nucleus (Fig. 3A; N) with parallel, aligned crystals (Fig. 3B; Fig. S1A and B; Movie SV2†); some isolated ones dispersed within the DV are also observed. It was suggested that this aligned arrangement of crystals indicates their templated nucleation at a common surface.52 The tilt-series could be used to study the crystals and their boundaries directly, even prior to tomographic reconstruction. Bragg reflections cause crystals to appear dark at certain tilt-angles where the scattering away from the bright-field detector is strong (Fig. 3C; crystals #1 and 4 at −6°; Movie SV1†). The line-profile for intensities highlights the boundaries of the crystals (Fig. 3D). Often, crystals that go dark at one tilt reappear as bright at the next angle (Fig. 3E; crystal #5 at −18° and −20°, respectively). Note the identical widths in bright and dark states (Fig. 3F). Had there been a surrounding lipid shroud, each crystal should have appeared narrower when dark (diffracting) than when light, as the lipid medium would not meet Bragg conditions (Fig. 3D and F).Additionally, a variety of crystal sizes was observed at this stage, signifying that each crystal was at a different phase of growth. This is expected as the parasites are at their metabolic peak during the trophozoite stage. They continuously catabolize hemoglobin and other host factors for obtaining nutrition.53,54 It is also interesting to note the asymmetric ends of the crystals, with one end appearing slanted and sharp, and the other broken or ragged. Similar asymmetric shapes have been observed previously in biogenic hemozoin, without comment55,56 or with a suggestion that they may represent drug-sensitive growth sites.54 The fact that the crystals grow with a constant or even decreasing aspect ratio implies that growth occurs in all orientations.
3.2 A visible lipid shroud is not detected in cell-free crystals
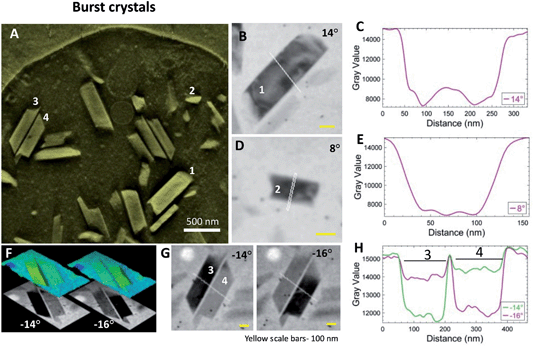
Cell-free samples of crystals liberated from burst DVs are thinner than intact cells and provide a higher resolution view. While the bursting is evidently destructive to the cell, the time interval from blotting to plunging is at most a few seconds. Whatever hydrophobic lipid layer the crystals within DV might carry with them would have to be retained upon release into the surrounding aqueous medium. Fig. 4A shows a thick volume slice from a reconstructed tomogram containing crystals from a burst cell. A few crystals (#1–4) were selected for closer inspection. Projection images from the aligned tilt-series (Fig. 4B and D) show crystals #1 and 2 blinking dark at 14° and 8°, respectively. The line profiles show the boundaries of the individual crystals (Fig. 4C and E).Crystals #3 and 4 are a pair of antiparallel hemozoin crystals that are otherwise similar in orientation. They blink conveniently at adjacent stage tilts. These images are compared in Fig. 4F as 2D gray level and false-color surface topography. By morphology, the c axis (long-axis)57 lies in the plane of view. Bragg diffraction arises when the zonal axis of the crystal is perpendicular to the illumination, i.e., perfectly vertical. Fig. 4G shows that the crystals blink at adjacent tilts and the intensity profiles across the sharp crystal boundaries are clear in Fig. 4H. Similar to observations in intact cells, the crystal boundaries do not hint at the presence of a lipid layer.
3.3 Hemozoin crystals are closely packed within the DVs of schizont stage parasites
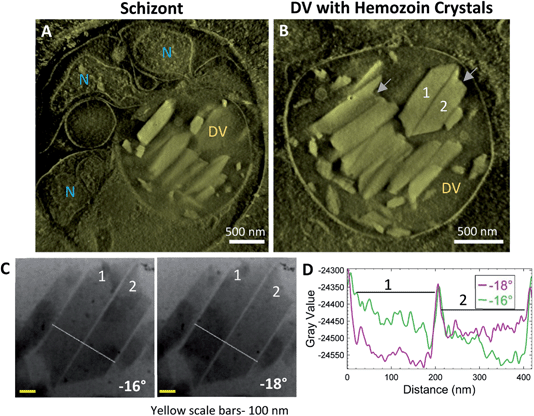
Schizonts are characterized by multiple daughter nuclei embedded within a common cytoplasm. Fig. 5A shows developing daughter nuclei with an intact DV magnified in Fig. 5B (Movie SV3†). Large crystals within the DV are closely packed at this stage. As mentioned above, many crystals appear to have a ragged end on one side and a smoother slanted end opposite (Fig. 5B; grey arrows). An antiparallel pair of otherwise similar orientations blink conveniently at adjacent stage tilts (Fig. 5C), and their intensity profiles are compared (Fig. 5D; Movie SV4†). The orientation of the crystals is very similar to that observed previously in Fig. 4F. The boundaries are clear, and there is no indication of a lipid shroud around them.3.4 Ring stage parasites have multiple proto-DVs with hemozoin crystals lining the inner membrane
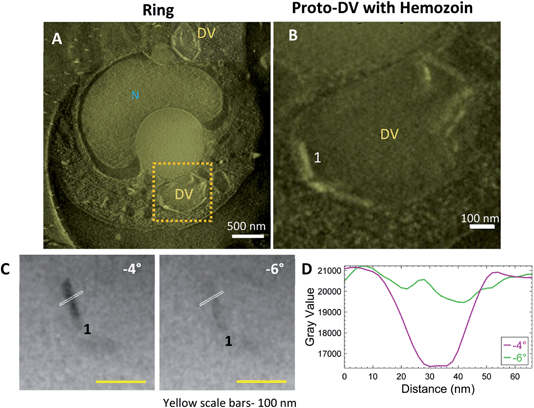
Streptolysin-O (SLO) treated cultures with the enriched ring stage parasites were plunge-frozen and imaged by CSTET. A thick volume section from the reconstruction in Fig. 6A shows the parasite with a single nucleus and multiple small precursors of the DV (proto-DVs) (Fig. 6A; Fig. S2A†). The hemozoin crystals at this stage are small, and Bragg diffraction is not as apparent as in the later stages. However, adjacent angles from the aligned tilt-series show flickering hemozoin crystals (Movie SV5†). The crystals have a notably higher aspect ratio and are almost exclusively localized to the inner surface of the proto-DV (Fig. 6B; Movie SV6†). This is consistent with previous reports that the initial nucleation occurs on the DV inner membrane and likely involves a lipid medium in some way.35 The crystal boundaries do not appear as sharp as in the later stages (Fig. 6C and D). However, we should recall that the crystal width dimensions are on the order of ten unit cells,57 and they are imaged in projection through the entire cell thickness (in this example, the cell was 1.12 μm thick).3.5 The parasite's endogenous lipid membrane does not show differential contrast across changing angles of the tilt-series
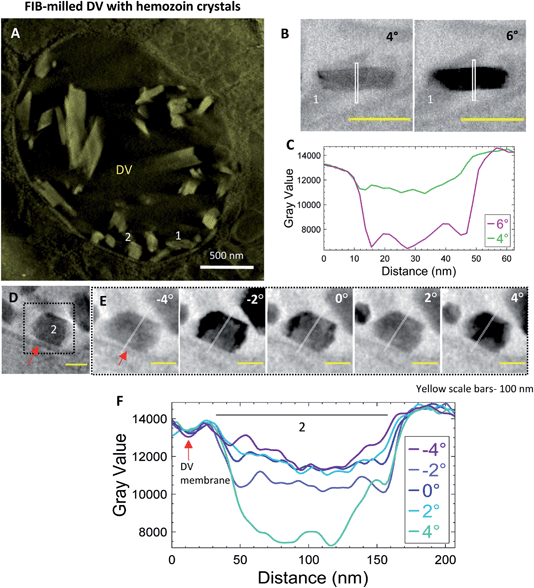
Intact iRBCs can sometimes be too thick to analyze membrane contrast in the raw tilt-series datasets. Reducing the specimen thickness of the vitrified specimen by employing cryo-FIB milling prior to electron tomography can be a potential solution. In the present example (Fig. 7), a lamella was milled in the DV of a trophozoite cell to a thickness of 300 nm prior to CSTET. Fig. 7A is a thick volume representation of the reconstructed tomogram (Movie SV7†) showing the DV enclosing the hemozoin crystals of varied sizes is visible. An example of an endogenous lipid membrane is the DV membrane itself, and we chose two crystals adjacent to it (#1 and 2; Fig. 7A). Consistent with data from whole cells, crystal #1 blinks bright and dark between adjacent tilts (Fig. 7B). The line profile was limited to the immediate surroundings and showed the expected differences in the intensity (Fig. 7C) as observed in previous datasets. Fig. 7D shows crystal #2 in a minimum-intensity projection of a thick volume from the reconstruction, together with the neighboring DV membrane (indicated by a red arrow). Intensity line profiles of the projection images were extended to include this membrane as well (Fig. 7E). The contrast changes were analyzed across a more extensive range of tilt-angles (−4° to 4°; Fig. 7E). While domains of crystal #2 blink across the progressive tilt angles from the aligned tilt-series (Movie SV8†), the contrast of the DV membrane remains constant, as indicated by the overlapping troughs in the intensity plots (Fig. 7F; red arrow). This validates our assertion that had there been a lipid membrane enclosing hemozoin crystals, it would appear as a feature in the contrast that is insensitive to the Bragg diffraction.4 Conclusion
We have systematically studied P. falciparum hemozoin crystals in situ across the various developmental stages during the asexual phase in iRBCs. During the early phase of infection (ring-stage), the parasite has multiple vacuoles within which the small-sized growing crystals line the inner membrane. It is known that these proto-DVs would fuse to form one large DV in the trophozoite stages.58 In the trophozoite stage, the crystals may appear aligned side by side within the DV. Additionally, we have analyzed crystals from cells that burst upon blotting of the grid, as well as crystals exposed in cryo-sections formed as FIB-milled lamellae from intact cells. Diffraction contrast reveals the extent of the crystals, which turn suddenly dark when Bragg conditions are met during the tilt series. Had there been an enveloping lipid shroud, the darkened crystal would have been enclosed within a wider envelope, similar to observing the solar corona during an eclipse. From 15 tomographic datasets that we have analyzed in detail, we have never observed a contrast halo surrounding the crystals that might be interpreted as a lipid shroud or any lipid sub-phase in the DV. Antimalarial drugs can thus access the crystal surface directly from the aqueous medium.19Author contributions
DM prepared samples and acquired EM data. KR optimized cryo-FIB lamella production from iRBCs. DM, LL, and ME analyzed data. NR-R and RD provided essential materials and support. DM and ME wrote the paper.Conflicts of interest
There are no conflicts to declare.Acknowledgements
DM acknowledges the kind assistance of members of the NRR lab, particularly Anna Rivkin, Yifat Ofir-Birin, and Paula Abou Karam, for assistance with parasite culture and handling. Panels of Fig. 1, 2 and contents entry graphics were created using BioRender.com. This work was supported in part by research grants from the Minerva Research Foundation, the Israel Science Foundation (grant no. 1696/18), and the Estate of David Levinson. Participation of RD was supported by Israel Science Foundation grant no. 1523/18, the Ministry of Science and Technology grant no. 103240 and by the United States-Israel Binational Science Foundation (BSF) grant no. 2019236. RD is also supported by the Dr Louis M. Leland and Ruth M. Leland Chair in Infectious Diseases. ME is the Head of the Irving and Cherna Moskowitz Center for Nano and Bionano Imaging and incumbent of the Sam and Ayala Zacks Professorial Chair in Chemistry.References
- World Malaria Report 2021, World Health Organization, Geneva, 2021 Search PubMed.
- N. Schiess, et al., Pathophysiology and neurologic sequelae of cerebral malaria, Malar. J., 2020, 19, 266 CrossRef.
- N. K. Mita-Mendoza, et al., Dimethyl fumarate reduces TNF and Plasmodium falciparum induced brain endothelium activation in vitro, Malar. J., 2020, 19, 376 CrossRef CAS.
- M. J. Boivin, et al., Cognitive impairment after cerebral malaria in children: a prospective study, Pediatrics, 2007, 119, e360 CrossRef PubMed.
- A. F. Cowman, D. Berry and J. Baum, The cellular and molecular basis for malaria parasite invasion of the human red blood cell, J. Cell Biol., 2012, 198, 961–971 CrossRef CAS.
- D. E. Goldberg, A. F. Slater, A. Cerami and G. B. Henderson, Hemoglobin degradation in the malaria parasite Plasmodium falciparum: an ordered process in a unique organelle, Proc. Natl. Acad. Sci. U. S. A., 1990, 87, 2931–2935 CrossRef CAS PubMed.
- L. H. Bannister, J. M. Hopkins, R. E. Fowler, S. Krishna and G. H. Mitchell, A brief illustrated guide to the ultrastructure of Plasmodium falciparum asexual blood stages, Parasitol. Today, 2000, 16, 427–433 CrossRef CAS PubMed.
- J. A. Bonilla, et al., Effects on growth, hemoglobin metabolism and paralogous gene expression resulting from disruption of genes encoding the digestive vacuole plasmepsins of Plasmodium falciparum, Int. J. Parasitol., 2007, 37, 317–327 CrossRef CAS PubMed.
- A. C. Chou and C. D. Fitch, Mechanism of hemolysis induced by ferriprotoporphyrin IX, J. Clin. Invest., 1981, 68, 672–677 CrossRef CAS PubMed.
- S. H. Vincent, Oxidative effects of heme and porphyrins on proteins and lipids, Semin. Hematol., 1989, 26, 105–113 CAS.
- S. Kumar and U. Bandyopadhyay, Free heme toxicity and its detoxification systems in human, Toxicol. Lett., 2005, 157, 175–188 CrossRef CAS PubMed.
- D. Jani, et al., HDP—a novel heme detoxification protein from the malaria parasite, PLoS Pathog., 2008, 4 DOI:10.1371/journal.ppat.1000053.
- I. Weissbuch and L. Leiserowitz, Interplay Between Malaria, Crystalline Hemozoin Formation, and Antimalarial Drug Action and Design, 1991, DOI:10.1021/cr078274t.
- M. Olivier, K. Van Den Ham, M. T. Shio, F. A. Kassa and S. Fougeray, Malarial pigment hemozoin and the innate inflammatory response, Front. Immunol., 2014, 5, 25 Search PubMed.
- K. N. Olafson, M. A. Ketchum, J. D. Rimer and P. G. Vekilov, Mechanisms of hematin crystallization and inhibition by the antimalarial drug chloroquine, Proc. Natl. Acad. Sci. U. S. A., 2015, 112, 4946–4951 CrossRef CAS.
- A. V. Pandey, B. L. Tekwani, R. L. Singh and V. S. Chauhan, Artemisinin, an endoperoxide antimalarial, disrupts the hemoglobin catabolism and heme detoxification systems in malarial parasite, J. Biol. Chem., 1999, 274, 19383–19388 CrossRef CAS PubMed.
- K. Y. Fong and D. W. Wright, Hemozoin and antimalarial drug discovery, Future Med. Chem., 2013, 5, 1437–1450 CrossRef CAS PubMed.
- I. Solomonov, et al., Crystal nucleation, growth, and morphology of the synthetic malaria pigment β-hematin and the effect thereon by quinoline additives: the malaria pig-ment as a target of various antimalarial drugs [J. Am. Chem. Soc.2007, 129, 2615–2627], J. Am. Chem. Soc., 2007, 129, 5779 CrossRef CAS.
- S. Kapishnikov, et al., Mode of action of quinoline antimalarial drugs in red blood cells infected by Plasmodium falciparum revealed in vivo, Proc. Natl. Acad. Sci. U. S. A., 2019, 116, 22946–22952 CrossRef CAS PubMed.
- R. E. Martin, et al., Chloroquine transport via the malaria parasite's chloroquine resistance transporter, Science, 2009, 325, 1680–1682 CrossRef CAS.
- D. K. Raj, et al., Disruption of a Plasmodium falciparum multidrug resistance-associated protein (PfMRP) alters its fitness and transport of antimalarial drugs and glutathione, J. Biol. Chem., 2009, 284, 7687–7696 CrossRef CAS PubMed.
- N. Suresh and K. Haldar, Mechanisms of artemisinin resistance in Plasmodium falciparum malaria, Curr. Opin. Pharmacol., 2018, 42, 46–54 CrossRef CAS PubMed.
- K. Yadav, et al., Repurposing of existing therapeutics to combat drug-resistant malaria, Biomed. Pharmacother., 2021, 136, 111275 CrossRef CAS PubMed.
- K. A. de Villiers and T. J. Egan, Heme Detoxification inthe Malaria Parasite: A Target for Antimalarial Drug Development, Acc. Chem. Res., 2021, 54, 2649–2659 CrossRef CAS.
- A. F. Slater, et al., An iron-carboxylate bond links the heme units of malaria pigment, Proc. Natl. Acad. Sci. U. S. A., 1991, 88, 325–329 CrossRef CAS PubMed.
- D. J. Sullivan Jr, H. Matile, R. G. Ridley and D. E. Goldberg, A common mechanism for blockade of heme polymerization by antimalarial quinolines, J. Biol. Chem., 1998, 273, 31103–31107 CrossRef CAS.
- S. Pagola, P. W. Stephens, D. S. Bohle, A. D. Kosar and S. K. Madsen, The structure of malaria pigment beta-haematin, Nature, 2000, 404, 307–310 CrossRef CAS PubMed.
- A. Sienkiewicz, et al., Multi-frequency high-field EPR study of iron centers in malarial pigments, J. Am. Chem. Soc., 2006, 128, 4534–4535 CrossRef CAS.
- J. M. Pisciotta and D. Sullivan, Hemozoin: oil versus water, Parasitol. Int., 2008, 57, 89–96 CrossRef CAS PubMed.
- C. D. Fitch, G.-Z. Cai, Y.-F. Chen and J. D. Shoemaker, Involvement of lipids in ferriprotoporphyrin IX polymerization in malaria, Biochim. Biophys. Acta, Mol. Basis Dis., 1999, 1454, 31–37 CrossRef CAS.
- D. Kuter, et al., Insights into the initial stages of lipid-mediated haemozoin nucleation, CrystEngComm, 2016, 18, 5177–5187 RSC.
- J. M. Pisciotta, et al., The role of neutral lipid nanospheres in Plasmodium falciparum haem crystallization, Biochem. J., 2007, 402, 197–204 CrossRef CAS.
- M. A. Ketchum, K. N. Olafson, E. V. Petrova, J. D. Rimer and P. G. Vekilov, Hematin crystallization from aqueous and organic solvents, J. Chem. Phys., 2013, 139, 121911 CrossRef PubMed.
- N. T. Huy, et al., Phospholipid Membrane-Mediated Hemozoin Formation: The Effects of Physical Properties and Evidence of Membrane Surrounding Hemozoin, PLoS One, 2013, 8, e70025 CrossRef CAS.
- S. Kapishnikov, et al., Oriented nucleation of hemozoin at the digestive vacuole membrane in Plasmodium falciparum, Proc. Natl. Acad. Sci. U. S. A., 2012, 109, 11188–11193 CrossRef CAS.
- S. Kapishnikov, et al., Biochemistry of malaria parasite infected red blood cells by X-ray microscopy, Sci. Rep., 2017, 7, 802 CrossRef CAS PubMed.
- S. Kapishnikov, et al., Unraveling heme detoxification in the malaria parasite by in situ correlative X-ray fluorescence microscopy and soft X-ray tomography, Sci. Rep., 2017, 7, 1–12 CrossRef PubMed.
- V. L. Hale, et al., Parasitophorous vacuole poration precedes its rupture and rapid host erythrocyte cytoskeleton collapse in Plasmodium falciparum egress, Proc. Natl. Acad. Sci. U. S. A., 2017, 114, 3439–3444 CrossRef CAS.
- E. Hanssen, et al., Soft X-ray microscopy analysis of cell volume and hemoglobin content in erythrocytes infected with asexual and sexual stages of Plasmodium falciparum, J. Struct. Biol., 2012, 177, 224–232 CrossRef PubMed.
- C. Magowan, et al., Intracellular structures of normal and aberrant Plasmodium falciparum malaria parasites imaged by soft x-ray microscopy, Proc. Natl. Acad. Sci. U. S. A., 1997, 94, 6222–6227 CrossRef CAS PubMed.
- S. Kapishnikov, E. Hempelmann, M. Elbaum, J. Als-Nielsen and L. Leiserowitz, Malaria Pigment Crystals: The Achilles' Heel of the Malaria Parasite, ChemMedChem, 2021, 16, 1515–1532 CrossRef CAS.
- K. N. Olafson, T. Q. Nguyen, J. D. Rimer and P. G. Vekilov, Antimalarials inhibit hematin crystallization by unique drug–surface site interactions, Proc. Natl. Acad. Sci. U. S. A., 2017, 114, 7531–7536 CrossRef CAS.
- P. G. Vekilov, J. D. Rimer, K. N. Olafson and M. A. Ketchum, Lipid or aqueous medium for hematin crystallization?, CrystEngComm, 2015, 17, 7790–7800 RSC.
- M. Elbaum, Expanding horizons of cryo-tomography to larger volumes, Curr. Opin. Microbiol., 2018, 43, 155–161 CrossRef PubMed.
- S. G. Wolf, L. Houben and M. Elbaum, Cryo-scanning transmission electron tomography of vitrified cells, Nat. Methods, 2014, 11, 423–428 CrossRef CAS PubMed.
- C. Lambros and J. P. Vanderberg, Synchronization of Plasmodium falciparum erythrocytic stages in culture, J. Parasitol., 1979, 65, 418–420 CrossRef CAS PubMed.
- C. Ribaut, et al., Concentration and purification by magnetic separation of the erythrocytic stages of all human Plasmodium species, Malar. J., 2008, 7, 1–5 CrossRef PubMed.
- K. E. Jackson, et al., Selective permeabilization of the host cell membrane of Plasmodium falciparum-infected red blood cells with streptolysin O and equinatoxin II, Biochem. J., 2007, 403, 167–175 CrossRef CAS PubMed.
- J. R. Kremer, D. N. Mastronarde and J. R. McIntosh, Computer visualization of three-dimensional image data using IMOD, J. Struct. Biol., 1996, 116, 71–76 CrossRef CAS PubMed.
- E. F. Pettersen, et al., UCSF Chimera – a visualization system for exploratory research and analysis, J. Comput. Chem., 2004, 25, 1605–1612 CrossRef CAS PubMed.
- J. Schindelin, et al., Fiji: an open-source platform for biological-image analysis, Nat. Methods, 2012, 9, 676–682 CrossRef CAS PubMed.
- S. Kapishnikov, et al., Aligned hemozoin crystals in curved clusters in malarial red blood cells revealed by nanoprobe X-ray Fe fluorescence and diffraction, Proc. Natl. Acad. Sci. U. S. A., 2012, 109, 11184–11187 CrossRef CAS PubMed.
- N. A. Counihan, J. K. Modak and T. F. de Koning-Ward, How malaria parasites acquire nutrients from their host, Front. Cell Dev. Biol., 2021, 9, 649184 CrossRef PubMed.
- C. Wendt, et al., High-Resolution Electron Microscopy Analysis of Malaria Hemozoin Crystals Reveals New Aspects of Crystal Growth and Elemental Composition, Cryst. Growth Des., 2021, 21, 5521–5533 CrossRef CAS.
- M. A. Ambele, B. T. Sewell, F. R. Cummings, P. J. Smith and T. J. Egan, Synthetic Hemozoin (β-Hematin) Crystals Nucleate at the Surface of Neutral Lipid Droplets that Control Their Sizes, Cryst. Growth Des., 2013, 13, 4442–4452 CrossRef CAS.
- G. S. Noland, N. Briones and D. J. Sullivan Jr, The shape and size of hemozoin crystals distinguishes diverse Plasmodium species, Mol. Biochem. Parasitol., 2003, 130, 91–99 CrossRef CAS.
- T. Straasø, et al., The role of the four stereoisomers of the heme Fe–O cyclic dimer in the crystalline phase behavior of synthetic hemozoin: relevance to native hemozoin crystallization, Cryst. Growth Des., 2011, 11, 3342–3350 CrossRef.
- A. R. Dluzewski, et al., Formation of the food vacuole in Plasmodium falciparum: a potential role for the 19 kDa fragment of merozoite surface protein 1 (MSP1(19)), PLoS One, 2008, 3, e3085 CrossRef PubMed.
Footnote |
| † Electronic supplementary information (ESI) available. See https://doi.org/10.1039/d2fd00088a |
| This journal is © The Royal Society of Chemistry 2022 |

