 Open Access Article
 This Open Access Article is licensed under a Creative Commons Attribution-Non Commercial 3.0 Unported Licence
Time-resolved photoluminescence studies of perovskite chalcogenides
Kevin
Ye
a,
Boyang
Zhao
b,
Benjamin T.
Diroll
 c,
Jayakanth
Ravichandran
bd and
R.
Jaramillo
*a
c,
Jayakanth
Ravichandran
bd and
R.
Jaramillo
*a
aDepartment of Materials Science and Engineering, Massachusetts Institute of Technology, Cambridge, MA 02139, USA. E-mail: rjaramil@mit.edu
bMork Family Department of Chemical Engineering and Materials Science, University of Southern California, Los Angeles, California 90089, USA
cCenter for Nanoscale Materials, Argonne National Laboratory, Lemont, IL 60439, USA
dMing Hsieh Department of Electrical and Computer Engineering, University of Southern California, Los Angeles, California 90089, USA
First published on 15th July 2022
Abstract
Chalcogenides in the perovskite and related crystal structures (“chalcogenide perovskites” for brevity) may be useful for future optoelectronic and energy-conversion technologies inasmuch as they have good excited-state, ambipolar transport properties. In recent years, several studies have suggested that semiconductors in the Ba–Zr–S system have slow non-radiative recombination rates. Here, we present a time-resolved photoluminescence (TRPL) study of excited-state carrier mobility and recombination rates in the perovskite-structured material BaZrS3, and the related Ruddlesden–Popper phase Ba3Zr2S7. We measure state-of-the-art single crystal samples, to identify properties free from the influence of secondary phases and random grain boundaries. We model and fit the data using a semiconductor physics simulation, to enable more direct determination of key material parameters than is possible with empirical data modeling. We find that both materials have Shockley–Read–Hall recombination lifetimes on the order of 50 ns and excited-state diffusion lengths on the order of 5 μm at room temperature, which bodes well for ambipolar device performance in optoelectronic technologies including thin-film solar cells.
1. Introduction
Understanding excited-state charge transport properties and recombination rates is central to semiconductor materials selection and device design for optoelectronic and energy-conversion technologies. Time-resolved photoluminescence (TRPL) is a technique that can probe excited-state recombination dynamics, including effective carrier lifetimes. However, the inferred lifetimes typically correspond to a host of radiative and non-radiative recombination processes taking place simultaneously and varying spatially through the probed material. Advanced modeling and fitting of transient data can be useful to distinguish the rates of various recombination processes, especially between bulk and surface effects.1–3In this paper we present TRPL data measured on chalcogenide perovskites in the Ba–Zr–S system, and a data analysis method that enables accurate study of recombination processes. Chalcogenide perovskites are a family of promising semiconductors for optoelectronics.4–9 These chalcogenide materials have direct band gap (Eg) tunable from the visible to near-infrared (NIR), strong optical absorption and luminescence, and reports of slow non-radiative recombination rates.4–6,10–13 They feature inexpensive and non-toxic elements, combined with thermal stability up to at least 550 °C.14,15 We have recently demonstrated synthesis of large-area, atomically-smooth, epitaxial thin films of BaZrS3 by pulsed laser deposition (PLD) and molecular beam epitaxy (MBE).16,17
Here we study single-crystal samples of the perovskite-structured material BaZrS3, and the related Ruddlesden–Popper phase Ba3Zr2S7.18 BaZrS3 is a semiconductor with direct band gap of energy Eg = 1.9 eV.17 Ba3Zr2S7 is an indirect-band gap semiconductor with Eg = 1.25 eV, and strong NIR absorption due to a direct, allowed transition near 1.3 eV.6 We measure TRPL data for varying temperature and illumination conditions. We model and fit TRPL data using a semiconductor physics simulation, using the program PC-1D.19 PC-1D allows parametrization of recombination processes including bulk non-radiative Shockley–Read–Hall (SRH), surface, and Auger. We incorporate the models simulated by PC-1D into a MATLAB routine to perform global, nonlinear, least-squares fitting on the measured TRPL data sets. We find that both materials have bulk SRH recombination lifetimes (τSRH) on the order of 50 ns, and excited-state diffusion lengths on the order of 5 μm at room temperature, which bode well for device performance in optoelectronic technologies including thin-film solar cells.
2. Methods
2.1. Experimental methods
We synthesized crystals using the flux method, according to previously-reported procedures.18 We ground and mixed 1 g of BaCl2 powder (Alfa Aesar, 99.998%) together with 0.5 g of stoichiometric mixtures of precursor powders (BaS, Zr, and S), and loaded the resulting powder into a quartz tube, as for powder synthesis. For BaZrS3 crystal growth we heated to 1050 °C at a rate of 1.6 °C min−1, held at 1050 °C for 100 h, cooled to 800 °C at a rate of 0.1 °C min−1, and then cooled to room temperature in an uncontrolled manner by shutting off the furnace. To make Ba3Zr2S7 crystals we heated to 1050 °C at a rate of 0.3 °C min−1, held at 1050 °C for 40 h, cooled to 400 °C at a rate of 1 °C min−1, and then cooled to room temperature uncontrolled. The samples obtained we washed repeatedly with deionized water and isopropyl alcohol to remove excess flux before drying in airflow. The crystal dimensions are on the order of ∼100 μm.18 For the experiments reported here, these are effectively infinitely thick, and the rear surface plays no role. In our models and fits we fix the thickness at 100 μm.We perform steady-state PL and TRPL measurements using pulsed laser diodes (Picoquant 450 nm and 705 nm), focused on the samples using an optical microscope equipped with a cryogenic stage. The spot size for TRPL measurements was approximately 2.2 μm (Gaussian FWHM, determined using Air Force target), and the pulse FWHM was approximately 100 ps. The repetition rate was 5 MHz and 2.5 MHz for BaZrS3 and Ba3Zr2S7 samples, respectively. The measurement spot on the sample was kept constant by aligning to camera images of unique marks. We control the pump intensity using a continuously-variable attenuator. The emitted light is analyzed using a spectrometer and CCD for steady-state spectra, or directed to an avalanche photodiode for TRPL.
The spectrometer and the Si CCD have wavelength-dependent efficiency. To account for these, we convolve these instrument response curves to create a spectral correction curve, which we then use to scale the measured data. We use the resulting spectrally-corrected data for further analysis.
2.2. Data analysis methods
To model the TRPL data (Fig. 1), we assume an absorber layer with an SRH lifetime τSRH (the low-injection limit) and ambipolar mobility μ (related to ambipolar diffusivity Davia the Einstein relation). We model surface recombination via surface recombination velocity (S), and Auger recombination via an Auger coefficient (B). τSRH and S are injection-dependent according to typical semiconductor statistics.19,20 We assume that excited-state charge transport during TRPL experiments is best-modeled as ambipolar, because of the high injection levels reached, and because the chalcogenide perovskites have very low carrier concentrations at equilibrium in the dark.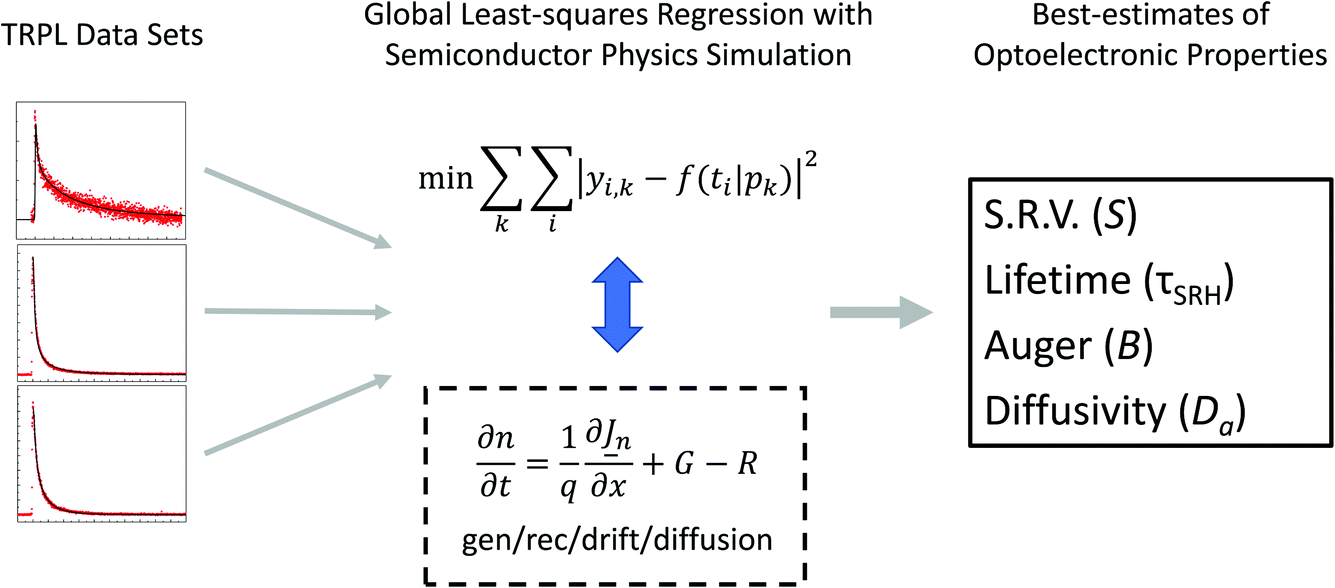 | ||
| Fig. 1 Flow chart of TRPL data analysis. Multiple data sets are acquired at a given temperature with varying pump fluence and/or wavelength. The data are modeled using a generation–recombination–drift–diffusion solver in one spatial dimension, and the model is refined using global least-squares minimization of all data sets (indexed by k) with customizable parameter sets (pk). The results are best-estimates of properties such as surface recombination velocity (S), non-radiative recombination lifetime (τSRH), and ambipolar diffusivity (Da) that are directly relevant to optoelectronic performance. | ||
The model is refined using a nonlinear, least-squares fitting routine in MATLAB. We refine the model globally across multiple data sets, collected at a fixed temperature but with varying illumination wavelength and pump fluence, to more accurately distinguish the different recombination rates. The physical semiconductor model is implemented in software PC-1D, which considers generation, recombination, drift, and diffusion along one spatial dimension.19 PC-1D calculates spatial profiles of charge carriers at discrete time steps. We integrate the PL emission for each spatial profile at each time step to produce a model of TRPL. All software configuration settings are set to ‘PC1D5’, to avoid the implementation of empirical models not applicable to chalcogenide perovskites. In the PC1D input file, we use an effective mass ratio (majority to minority carriers) of 2 for both BaZrS3 and Ba3Zr2S7. In our models and fits we fix the thickness at 100 μm. We also assume that the front and back surface recombination rates are equal. We approximate the unknown majority carrier concentration and intrinsic carrier density using values typical for silicon, e.g., Na = 1016 cm−3, ni(300 K) = 1010 cm−3; numerical studies demonstrate that our results here are insensitive to these approximations within very wide ranges covering all reasonable values.
3. Results: steady-state photoluminescence
The steady-state PL spectra contain information on the band-to-band emission, defect level emission, and other recombination processes. We present in Fig. 2a and b the results of steady-state PL measurements on Ba3Zr2S7 at temperatures ranging from 78 to 275 K. The PL peak position, peak shape, and intensity all vary with temperature. The data presented in Fig. 2a are raw data, as-measured. In Fig. 2b we present the data after applying a spectral correction, which accounts for the wavelength-dependent detection efficiency of our equipment. After this correction, it is clear that the PV emission develops a two-peak structure that depends on temperature. At lower temperature, the dominant peak is at 1011 nm (1.227 eV). As the temperature is raised, the high-energy shoulder develops into a distinct peak at approximately 997 nm (1.244 eV). We hypothesize that this is the direct band-to-band transition, placed at 1.28 eV in our earlier work based on PL at room temperature.6 The peak separation is approximately 17 meV. Not enough is known about the excitonic properties and the defect chemistry of chalcogenide perovskites to identify the origin of this peak splitting. However, we note that 17 meV is comparable to the free exciton binding energy of halide perovskites, which have similar band gap and large dielectric susceptibility to the chalcogenide perovskites.8,21 Therefore, it seems possible that the principal, lower-energy peak represents radiative recombination of free excitons. It is clear from the data, and from the small energy scale, that the two emissive states are in rapid thermal communication at room temperature.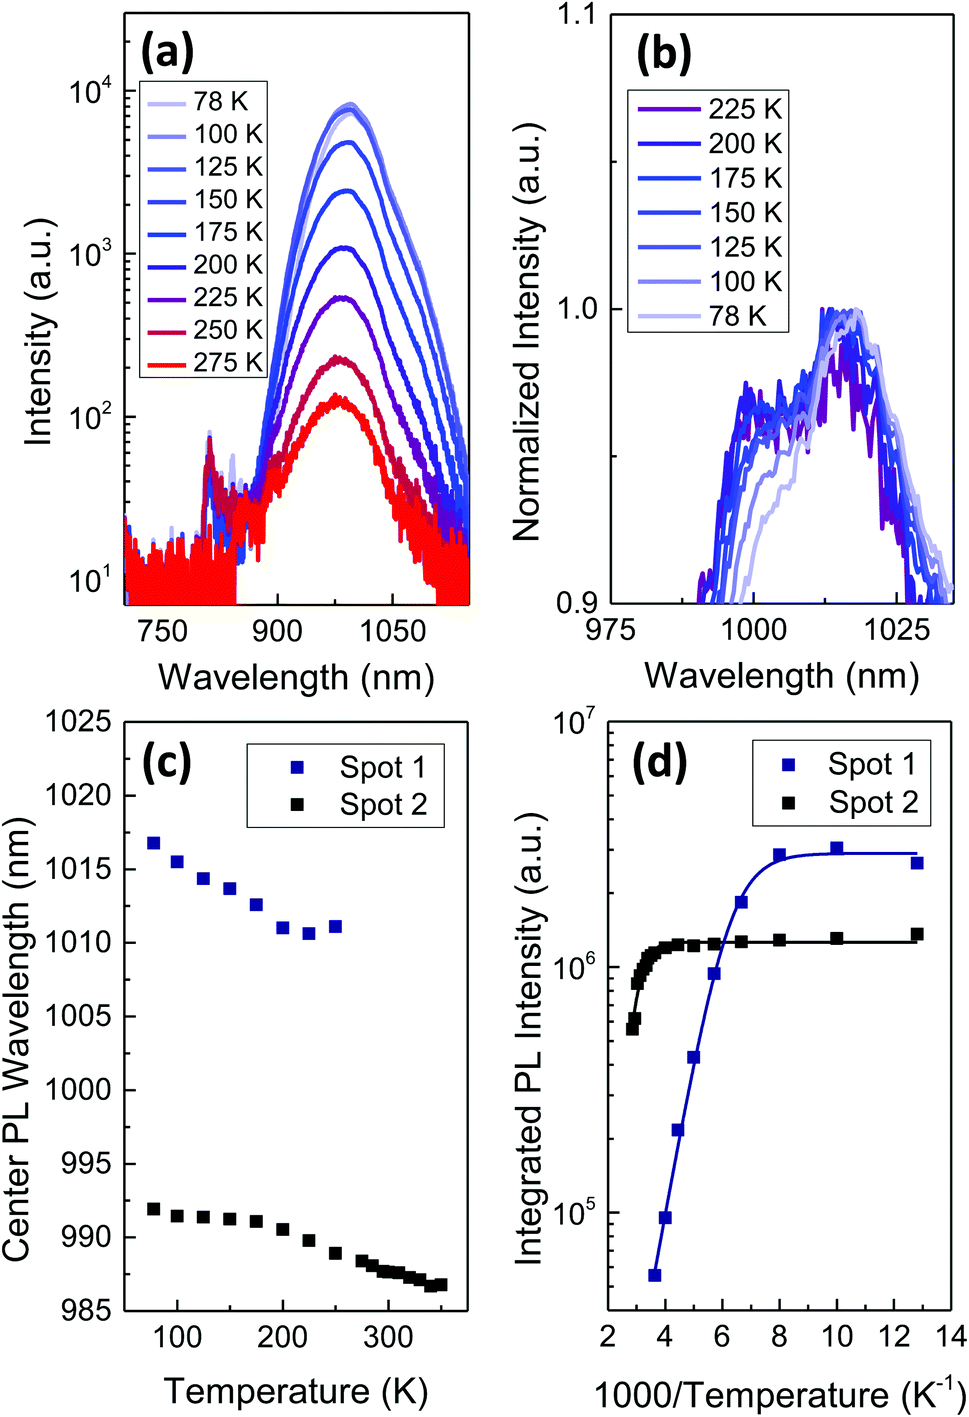 | ||
| Fig. 2 Steady-state PL results measured with an excitation wavelength of 705 nm on a Ba3Zr2S7 single-crystal. (a) Temperature-dependent spectra, plotting the absolute measured intensity. (b) Temperature-dependent spectra, plotting spectrally-corrected, normalized intensity. (c and d) Analysis of the temperature-dependent PL spectra, for two measurement spots, the first of which being the data shown in (a) and (b). (c) Peak positions as a function of temperature, estimated by fitting a single Gaussian curve to the data at each temperature. (d) Arrhenius plot of the integrated intensity (points) fitted with a model of a single non-radiative recombination process (solid lines). | ||
In Fig. 2c and d we present further analysis of the spectrally-corrected PL data. We analyze the data presented in Fig. 2a and b as well as data measured on a second spot on the sample. In Fig. 2c, we plot the PL peak positions, determined by fitting a single Gaussian curve to the spectrally-corrected data at each temperature and spot. There is an offset of approximately 28 meV between the data measured on two separate spots, apparently resulting from sample heterogeneity. The negative slope of all data suggests that Eg increases with increasing temperature. Conventional, tetrahedrally-coordinated, sp3-bonded semiconductors have negative band gap temperature coefficients: Eg decreases with increasing temperature. A positive temperature coefficient is observed in less conventional and more ionic materials semiconducting compounds, including binary lead chalcogenides and halide perovskites.22–24 dEg/dT > 0 is favorable for solar cells, that typically experience temperature higher during operation (e.g., in desert locations) than during early-stage laboratory testing.
In Fig. 2d we plot the integrated PL signal vs. inverse temperature. We fit the PL intensity (I) to an Arrhenius model of a single non-radiative recombination process, using the expression:25
 | (1) |
 , and a = τR/τ0 where τR is the radiative recombination lifetime which is assumed temperature-independent. We estimate EA = 130.0 ± 19.0 meV and 306 ± 1 meV for the two measurement spots. EA determined in this way likely represents an average of multiple, temperature-dependent recombination processes, rather than a single process. The spatial heterogeneity in the temperature-dependence, expressed by the substantial difference in EA, likely derives from varying surface conditions; Ba3Zr2S7 crystal surfaces are faceted and we measure the samples as-grown, without post-growth polishing or surface passivation.18 These differences notwithstanding, from the data and analysis we conclude that the dominant thermally-activated recombination process (or processes) in our Ba3Zr2S7 crystals have activation energy well above 100 meV. When we apply an Arrhenius model to the Gaussian-best-fit intensities of the two peaks in each spectrum, we find that the thermal activation energies are statistically indistinguishable: 129.22 ± 12.33 and 129.79 ± 8.35 meV for the higher- and lower-energy peaks, respectively, for the data measured at spot 1, and 321.19 ± 40.97 and 373.64 ± 167.87 meV for the higher- and lower-energy peaks measured at spot 2. The fact that similar activation energies are observed, within statistical confidence, can result from both features reflecting the same thermal distribution (i.e., being in thermal equilibrium with each other).
There are multiple scenarios that could produce a thermally-activated rate of non-radiative recombination. Carrier capture by recombination centers could be phonon-assisted, resulting in an activation energy characteristic of the most relevant phonon mode.26 The temperature-dependence may also result from shallow, non-radiative traps that temporarily capture photo-generated carriers.27 In this case, the activation energy does not represent the recombination process itself, but rather the energy for trap emission to the relevant band. Unfortunately, not enough is known about the defect chemistry of chalcogenide perovskites to distinguish between these scenarios. We further discuss below the possible influence of shallow traps on the TRPL results.
4. Results: time-resolved photoluminescence
We present representative TRPL data and best-fit models in Fig. 3, for BaZrS3 and Ba3Zr2S7 crystals. In Fig. 3a, we show results for BaZrS3 at room temperature, measured with 450 nm illumination and a 505 nm long-pass filter. The inset shows the steady-state PL spectrum, with a peak consistent with Eg = 1.9 eV. The feature near 500 nm (cutoff by the long-pass filter) also contributes to the measured TRPL data, which is not wavelength-resolved. This feature is of unknown origin, but fortunately it makes only a minor contribution to the integrated PL intensity. From the data we estimate τSRH = 55.2 ± 28.1 ns, S = 1.87 × 10⁴ ± 1.14 × 104 cm s−1, and μ = 146.2 ± 525.6 cm2 V−1 s−1. The large uncertainty in the mobility highlights the value for global fitting across multiple data sets with varying experimental parameters, to more precisely estimate material parameters. In Fig. 3b, we show a global fit of three TRPL data sets measured on a Ba3Zr2S7 crystal at 200 K with varying levels of pump fluence. From the data we estimate τSRH = 112.9 ± 1.5 ns, S = 3.69 × 10⁴ ± 2.9 × 102 cm s−1, and μ = 2607.47 ± 85.5 cm2 V−1 s−1. The global-fit routine results in much-reduced fractional uncertainty in the best-fit estimate of μ.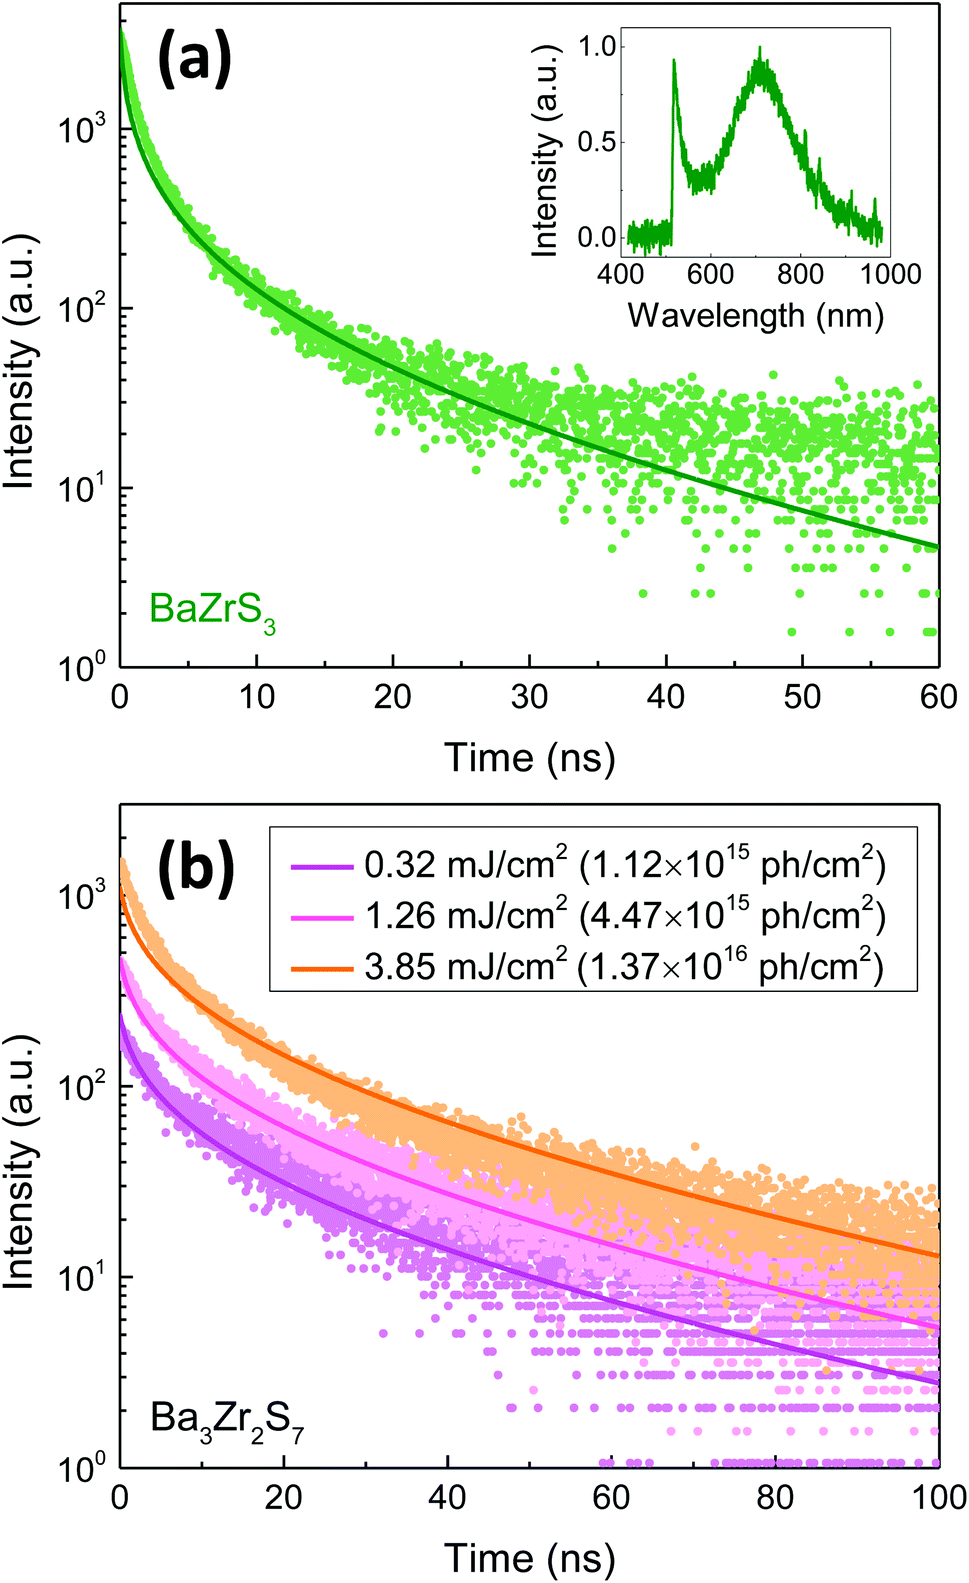 | ||
| Fig. 3 TRPL data (points) and best-fit models (lines) for BaZrS3 and Ba3Zr2S7. (a) TRPL measured on BaZrS3 at 300 K, measured with pump wavelength 450 nm and pump fluence of 0.04 mJ cm−2 (1.02 × 10¹⁴ ph cm−2) per pulse. The inset shows the steady-state PL spectra measured with pump wavelength 450 nm. (b) TRPL measured on Ba3Zr2S7 at 200 K, measured with pump wavelength 705 nm and varying pump fluence. | ||
We next discuss temperature-dependent results on Ba3Zr2S7. In Fig. 4, we show normalized TRPL spectra and the best-fit models for temperature from 78 to 300 K (the data is normalized here for visualization, but the fitting routines were run on the raw data). It is apparent that the decay rate increases with increasing temperature. In Fig. 5 and Table 1 we present the details of the data analysis. We do not find a notable temperature-dependence for the mobility within the temperature range from 78 to 300 K, which suggests that the mobility is limited by defect scattering throughout this range. The two non-radiative recombination processes, SRH and surface recombination, both accelerate with increasing temperature. The temperature-dependence of the surface recombination process (S) is far more pronounced than that of the bulk process (τSRH). This, combined with the large and position-dependent activation energy for non-radiative recombination determined from static PL (Fig. 2d), suggests that the temperature-dependence is dominated by processes at the sample surface, further discussed below.
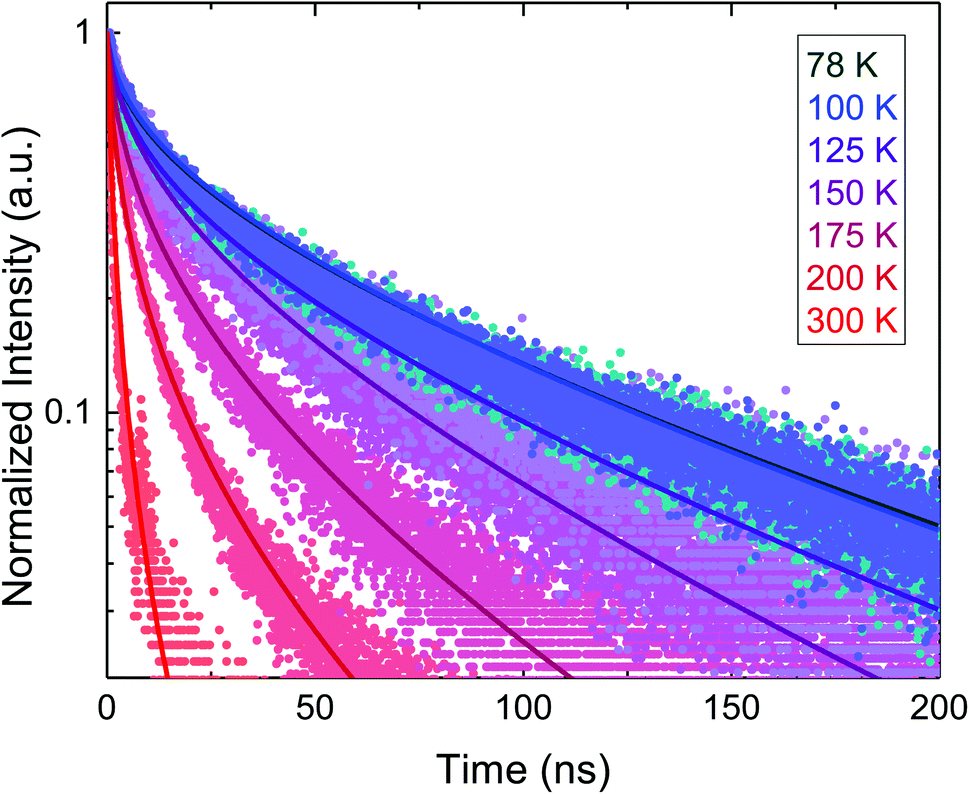 | ||
| Fig. 4 TRPL spectra measured on a Ba3Zr2S7 crystal for temperature between 78 and 300 K, measured with pump wavelength 705 nm and pump fluence of 3.85 mJ cm−2 (1.37 × 10¹⁶ ph cm−2) per pulse. The TRPL data (points) and best-fit models (lines) are normalized to accentuate the rise in decay rate with increasing temperature. | ||
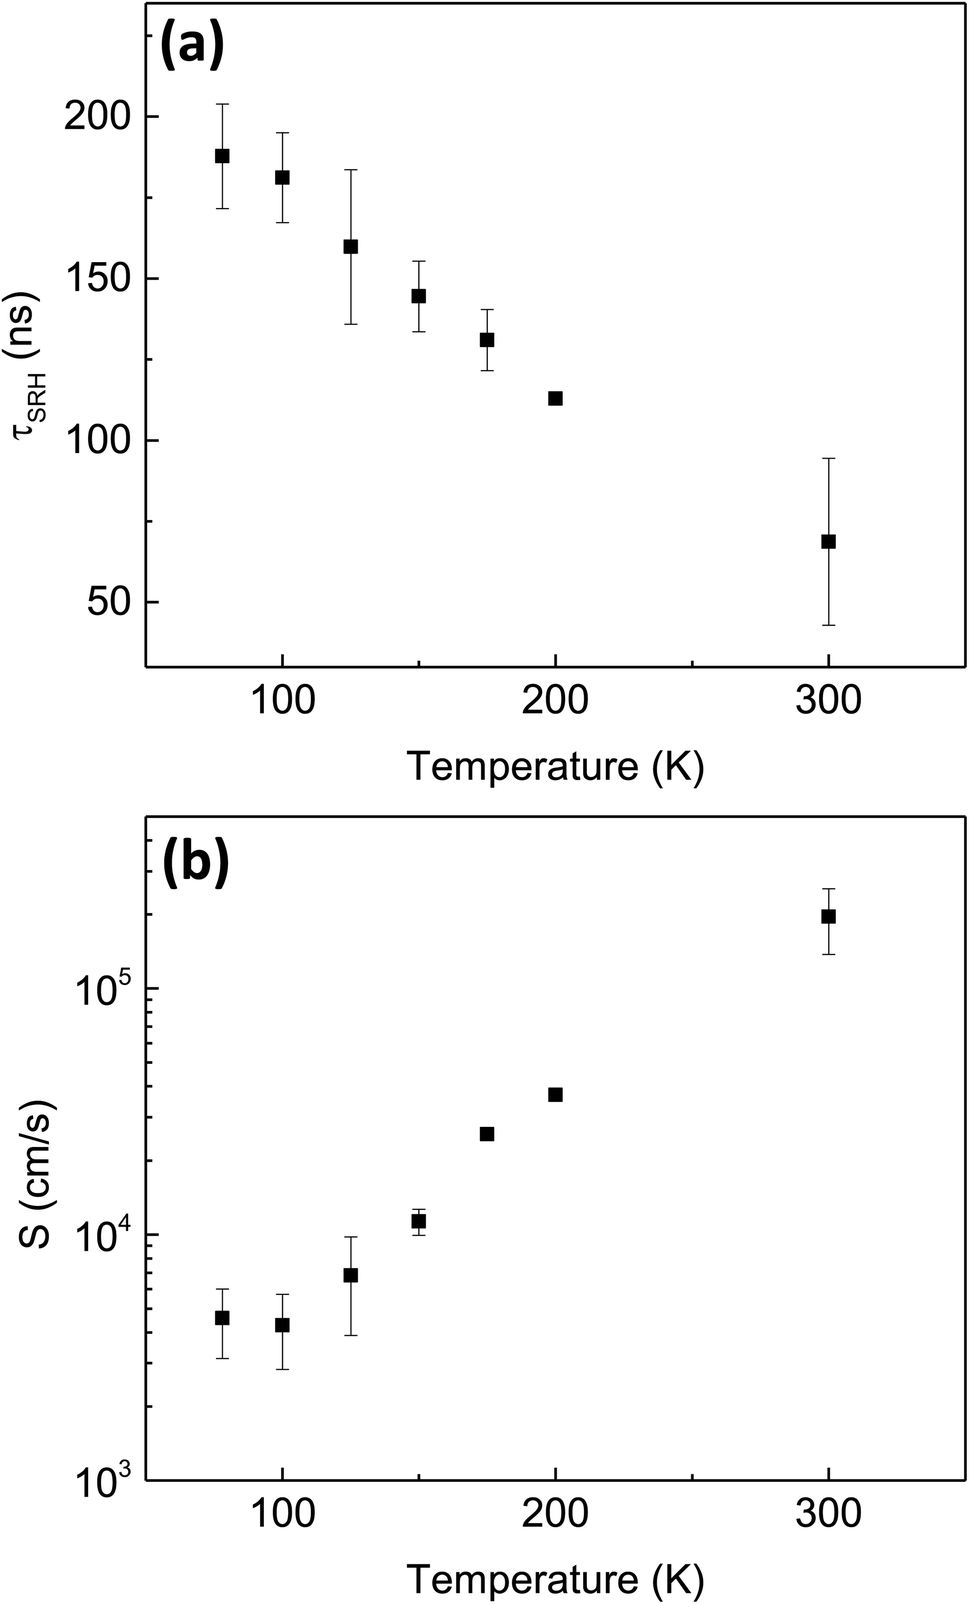 | ||
| Fig. 5 Temperature-dependence of (a) τSRH, and (b) S, for Ba3Zr2S7 determined from the data and models shown in Fig. 4. | ||
| T (K) | τ SRH (ns) | S (cm s−1) | B (cm6 s−1) | D a (cm2 s−1) | μ (cm2 V−1 s−1) |
|---|---|---|---|---|---|
| 78 | 187.7 ± 16.1 | 4.6 × 10³ ± 1.4 × 10³ | 5.6 × 10⁻³⁵ ± 1.9 × 10⁻³⁴ | 15.8 ± 2.2 | 2.3 × 10³ ± 3.2 × 10² |
| 100 | 181.1 ± 13.9 | 4.3 × 10³ ± 1.4 × 10³ | 1.1 × 10⁻³⁵ ± 8.6 × 10⁻³⁴ | 18.7 ± 2.4 | 2.1 × 10³ ± 2.8 × 10² |
| 125 | 159.7 ± 23.9 | 6.8 × 10³ ± 2.9 × 10³ | 5.1 × 10⁻³⁵ ± 3.7 × 10⁻³⁴ | 29.4 ± 7.4 | 2.7 × 10³ ± 6.8 × 10² |
| 150 | 144.5 ± 10.9 | 1.1 × 10⁴ ± 1.4 × 10³ | 1.2 × 10⁻³⁴ ± 5.5 × 10⁻³⁴ | 24.9 ± 4.0 | 1.9 × 10³ ± 3.0 × 10² |
| 175 | 131.0 ± 9.4 | 2.6 × 10⁴ ± 1.4 × 10³ | 7.4 × 10⁻³⁵ ± 7.9 × 10⁻³⁴ | 31.5 ± 5.3 | 2.1 × 10³ ± 3.6 × 10² |
| 200 | 112.9 ± 1.5 | 3.7 × 10⁴ ± 2.9 × 10² | 1.0 × 10⁻³⁵ ± 2.8 × 10⁻³³ | 44.9 ± 1.5 | 2.6 × 10³ ± 8.5 × 101 |
| 300 | 68.7 ± 25.8 | 2.0 × 10⁵ ± 5.9 × 10⁴ | 3.7 × 10⁻³⁰ ± 5.2 × 10⁻³¹ | 7.3 ± 1.5 | 2.8 × 10² ± 5.7 × 101 |
5. Discussion
Based on the TRPL analysis for BaZrS3 and Ba3Zr2S7, we can obtain best-estimates of semiconductor parameters relevant for optoelectronic and energy-conversion device performance. For thin-film solar cells, the excited-state diffusion length (LD) is a critical parameter, as it describes the ability of a material to support a photocurrent and photovoltage even in the absence of a depletion region. We estimate LD as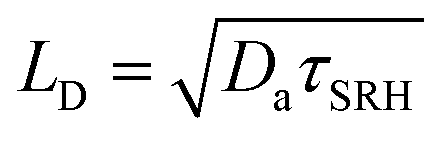 ; we find at 300 K that LD = 4.6 ± 6.2 μm for BaZrS3, LD = 7.1 ± 2.0 μm for Ba3Zr2S7. These are promising results because they are larger than a typical absorber thickness for a thin-film solar cell, and because they were measured on crystals with no attempt at point defect control or surface passivation.
It is interesting to compare our results to more well-established photovoltaic (PV) absorber materials. In Fig. 6a, we locate our measured room-temperature values of τSRH for BaZrS3 and Ba3Zr2S7 on a plot of τSRHvs. solar cell efficiency (η) for a number of PV materials.28 In each case, we represent τSRH and η reported by the same research groups, and measured on as close to the same material as possible. A large τSRH is a necessary prerequisite for high-performance, and the data for BaZrS3 and Ba3Zr2S7 are comparable to the best-performing, established materials: CdTe, CIGS, and lead halide perovskites. We note that, for a particular device, the effective lifetime (i.e., not τSRH) is what determines the Fermi level splitting and the photovoltage, and ultimately the performance. The effective lifetime depends on thickness and interfaces, in addition to the bulk properties. However, as more parameters are included in any given figure of merit, the quantity and diversity of published data becomes more limited. In making Fig. 6a, we choose to focus on a bulk property relevant to materials selection, as appropriate for chalcogenide perovskites at this early stage of development.
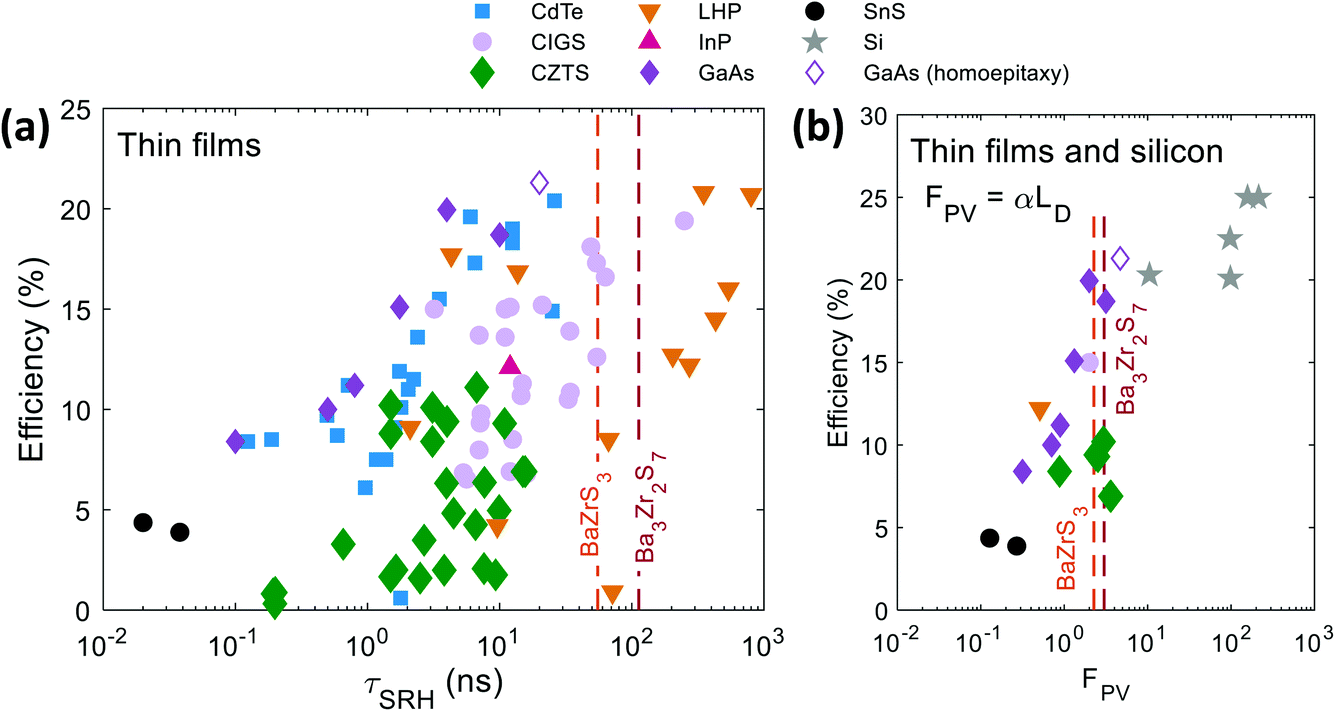 | ||
| Fig. 6 SRH lifetime (τSRH) and solar cell figure of merit FPV = αLDvs. energy conversion efficiency for various photovoltaic materials. BaZrS3 and Ba3Zr2S7 are plotted as dashed lines corresponding to the best-estimates of our TRPL data analysis; no solar cells of either material have yet been reported. In (a), we only show data for which τSRH and device measurements were performed on samples that were synthesized in the same laboratory and using as close to the same procedure as is reasonably possible; in (b), we additionally require that D and α are reported on comparable samples, with the exception of silicon and GaAs for which we use tabulated values. Data are adapted from ref. 28 and 30–32. | ||
In Fig. 6b we plot η vs. a solar cell figure-of-merit, FPV = αLD, where α is an optical absorption coefficient.28 For each material, we calculate FPV using α as measured at the knee in the curve of log10(α(E)). For BaZrS3 and Ba3Zr2S7, we use values 4940 cm−1 (at 636 nm) and 4240 cm−1 (at 861 nm), respectively. FPV is a comparison of length scales: the depth required to absorb light (1/α) compared to the distance that excited-state charge carriers can diffuse before non-radiative recombination (LD). FPV > 1 is a requirement for high-performance solar cells. We find that FPV ≈ 10 for both BaZrS3 and Ba3Zr2S7, placing these chalcogenide perovskites among the very best candidates for thin-film solar cells. It remains to be seen whether these results, measured on microscopic single-crystals, bear out in thin films and in solar cell devices.
Our analysis enables us to disentangle the contributions of surface and bulk recombination in TRPL spectra. However, the recombination parameters determined in this way (τSRH and S) likely are effective parameters, representing multiple simultaneous processes, that could not be distinguished without a more complex model and more, complementary experiments. We highlight in particular the possible effect of shallow traps. Shallow traps that momentarily capture excited carriers can forestall radiative recombination, making the rate of non-radiative recombination appear slower than it actually is. Several approaches are available to assess the effect of shallow traps on TRPL data, including varying the injection level and the temperature.27 Our temperature-dependent results (Fig. 2c and 5) suggest that surface processes have the strongest temperature dependence, and it is quite possible that the activation energy modeled in Fig. 2d represents thermal emission from near-surface traps. The bulk SRH recombination times τSRH determined here may also be artificially elongated due to trapping effects, although the data suggest that such effects are less prominent in the bulk than at the surface. Our injection-dependent measurements (Fig. 3b) also do not indicate an effect of carrier trapping on τSRH. Trap-assisted slowing down of TRPL decay is related to trap-assisted persistent photoconductivity.29 We suggest for future work that a comparison of photoconductive and photoluminescent transients under varying injection and temperature, combined with a more full-fledged model, could enable estimation of trap occupancy and the quasi-Fermi level splitting.
In the context of Fig. 6a, we care about τSRH inasmuch as it predicts solar cell performance. A high concentration of traps with a large thermal emission energy, well above kBT, will greatly suppress the quasi-Fermi level splitting, the open-circuit voltage, and device performance. However, shallow traps that remain in rapid thermal communication with the nearby band edge will have a lesser effect, likely manifesting as a slight suppression in carrier mobility and diffusion length. We expect that future work making and testing chalcogenide perovskite solar cells will quantify these effects.
Our estimates for Auger recombination are likely not reliable, as evidenced by the large best-fit uncertainty ranges. These uncertainties originate from the possible contribution of extraneous signal to the TRPL data at very short times.
Our estimates of LD are larger than the illumination spot size in our experiments. This represents a deficiency in the modeling, and likely introduces inaccuracy in the results. For instance, a measurement spot size smaller than the diffusion length may artificially reduce the inferred lifetime (i.e., accelerate the apparent decay to equilibrium) because diffusion of excess carriers out of the measurement spot is an additional, unaccounted-for mechanism that locally reduces the excess carrier concentration. In a preliminary attempt to estimate these effects, we repeated measurements on the same spot with objectives with varying magnification, to vary the spot size. We do observe differences in the decay at short time, but no significant change in the long-time decay kinetics. We leave for future work a full study including modeling in two dimensions.
6. Conclusion
We use steady-state and time-resolved photoluminescence to study chalcogenide perovskites in the Ba–Zr–S system. We demonstrate a data analysis workflow for TRPL that allows a direct extraction of the material parameters that describe excited-state charge carrier dynamics, using a semiconductor physics model embedded in a global nonlinear-least-squares regression routine. We show that BaZrS3 and Ba3Zr2S7 have bulk Shockley–Read–Hall lifetime (τSRH) on the order of 50 ns, and ambipolar diffusion length (LD) on the order of 5 μm. These results suggest that chalcogenide perovskites may support very high-performance solar cells. Our results were obtained by measurements on microscopic single-crystals, and it remains to be seen what properties and performance can be measured in thin films and solar cells.Conflicts of interest
There are no conflicts to declare.Acknowledgements
We acknowledge support from the National Science Foundation under grant no. 1751736, “CAREER: Fundamentals of Complex Chalcogenide Electronic Materials”, and the Graduate Research Fellowship Program, grant no. 1745302. This project was supported in part by the Skolkovo Institute of Science and Technology as part of the MIT-Skoltech Next Generation Program. The work at USC was supported by the Army Research Office under award no. W911NF-19-1-0137, the Army Research Office MURI grant under award no. W911NF-21-1-0327, and by the USC Provost New Strategic Directions for Research Award. Work performed at the Center for Nanoscale Materials, a U.S. Department of Energy Office of Science User Facility, was supported by the U.S. DOE, Office of Basic Energy Sciences, under Contract No. DE-AC02-06CH11357.References
- K. L. Luke and L.-J. Cheng, J. Appl. Phys., 1987, 61, 2282–2293 CrossRef CAS.
- P. B. Klein, J. Appl. Phys., 2008, 103, 033702 CrossRef.
- N. Đorđević, J. S. Beckwith, M. Yarema, O. Yarema, A. Rosspeintner, N. Yazdani, J. Leuthold, E. Vauthey and V. Wood, ACS Photonics, 2018, 5, 4888–4895 CrossRef.
- Y. Nishigaki, T. Nagai, M. Nishiwaki, T. Aizawa, M. Kozawa, K. Hanzawa, Y. Kato, H. Sai, H. Hiramatsu, H. Hosono and H. Fujiwara, Sol. RRL, 2020, 4, 1900555 CrossRef CAS.
- K. Hanzawa, S. Iimura, H. Hiramatsu and H. Hosono, J. Am. Chem. Soc., 2019, 141, 5343–5349 CrossRef CAS PubMed.
- S. Niu, D. Sarkar, K. Williams, Y. Zhou, Y. Li, E. Bianco, H. Huyan, S. B. Cronin, M. E. McConney, R. Haiges, R. Jaramillo, D. J. Singh, W. A. Tisdale, R. Kapadia and J. Ravichandran, Chem. Mater., 2018, 30, 4882–4886 CrossRef CAS.
- R. Jaramillo and J. Ravichandran, APL Mater., 2019, 7, 100902 CrossRef.
- S. Filippone, B. Zhao, S. Niu, N. Z. Koocher, D. Silevitch, I. Fina, J. M. Rondinelli, J. Ravichandran and R. Jaramillo, Phys. Rev. Mater., 2020, 4, 091601 CrossRef CAS.
- K. V. Sopiha, C. Comparotto, J. A. Márquez and J. J. S. Scragg, Adv. Opt. Mater., 2022, 10, 2101704 CrossRef CAS.
- X. Wei, H. Hui, C. Zhao, C. Deng, M. Han, Z. Yu, A. Sheng, P. Roy, A. Chen, J. Lin, D. F. Watson, Y.-Y. Sun, T. Thomay, S. Yang, Q. Jia, S. Zhang and H. Zeng, Nano Energy, 2020, 68, 104317 CrossRef CAS.
- S. Niu, H. Huyan, Y. Liu, M. Yeung, K. Ye, L. Blankemeier, T. Orvis, D. Sarkar, D. J. Singh, R. Kapadia and J. Ravichandran, Adv. Mater., 2017, 29, 1604733 CrossRef PubMed.
- W. Li, S. Niu, B. Zhao, R. Haiges, Z. Zhang, J. Ravichandran and A. Janotti, Phys. Rev. Mater., 2019, 3, 101601 CrossRef CAS.
- S. Sharma, Z. Ward, K. Bhimani, K. Li, A. Lakhnot, R. Jain, S.-F. Shi, H. Terrones and N. Koratkar, ACS Appl. Electron. Mater., 2021, 3, 3306–3312 CrossRef CAS.
- S. Niu, J. Milam-Guerrero, Y. Zhou, K. Ye, B. Zhao, B. C. Melot and J. Ravichandran, J. Mater. Res., 2018, 33, 4135–4143 CrossRef CAS.
- V. K. Ravi, S. H. Yu, P. K. Rajput, C. Nayak, D. Bhattacharyya, D. S. Chung and A. Nag, Nanoscale, 2021, 13, 1616–1623 RSC.
- M. Surendran, H. Chen, B. Zhao, A. S. Thind, S. Singh, T. Orvis, H. Zhao, J.-K. Han, H. Htoon, M. Kawasaki, R. Mishra and J. Ravichandran, Chem. Mater., 2021, 33, 7457–7464 Search PubMed.
- I. Sadeghi, K. Ye, M. Xu, Y. Li, J. M. LeBeau and R. Jaramillo, Adv. Funct. Mater., 2021, 31, 2105563 CrossRef CAS.
- S. Niu, B. Zhao, K. Ye, E. Bianco, J. Zhou, M. E. McConney, C. Settens, R. Haiges, R. Jaramillo and J. Ravichandran, J. Mater. Res., 2019, 34, 3819–3826 CrossRef CAS.
- D. A. Clugston and P. A. Basore, Conf. Rec. Twenty Sixth IEEE Photovolt. Spec. Conf. – 1997, 1997, pp. 207–210 Search PubMed.
- S. M. Sze and K. K. Ng, Physics of Semiconductor Devices, Wiley-Interscience, Hoboken, N.J., 3rd edn, 2006 Search PubMed.
- X. Chen, H. Lu, Y. Yang and M. C. Beard, J. Phys. Chem. Lett., 2018, 9, 2595–2603 CrossRef CAS PubMed.
- Z. M. Gibbs, H. Kim, H. Wang, R. L. White, F. Drymiotis, M. Kaviany and G. Jeffrey Snyder, Appl. Phys. Lett., 2013, 103, 262109 CrossRef.
- G. Mannino, I. Deretzis, E. Smecca, A. La Magna, A. Alberti, D. Ceratti and D. Cahen, J. Phys. Chem. Lett., 2020, 11, 2490–2496 CrossRef CAS PubMed.
- C. Yu, Z. Chen, J. J. Wang, W. Pfenninger, N. Vockic, J. T. Kenney and K. Shum, J. Appl. Phys., 2011, 110, 063526 CrossRef.
- M. Leroux, N. Grandjean, B. Beaumont, G. Nataf, F. Semond, J. Massies and P. Gibart, J. Appl. Phys., 1999, 86, 3721–3728 CrossRef CAS.
- A. Schenk, Solid-State Electron., 1992, 35, 1585–1596 CrossRef CAS.
- M. Maiberg, T. Hölscher, S. Zahedi-Azad and R. Scheer, J. Appl. Phys., 2015, 118, 105701 CrossRef.
- R. Jaramillo, M.-J. Sher, B. K. Ofori-Okai, V. Steinmann, C. Yang, K. Hartman, K. A. Nelson, A. M. Lindenberg, R. G. Gordon and T. Buonassisi, J. Appl. Phys., 2016, 119, 035101 CrossRef.
- R. H. Bube, Photoconductivity of Solids, Wiley, 1960 Search PubMed.
- J.-P. Correa-Baena, Y. Luo, T. M. Brenner, J. Snaider, S. Sun, X. Li, M. A. Jensen, N. T. P. Hartono, L. Nienhaus, S. Wieghold, J. R. Poindexter, S. Wang, Y. S. Meng, T. Wang, B. Lai, M. V. Holt, Z. Cai, M. G. Bawendi, L. Huang, T. Buonassisi and D. P. Fenning, Science, 2019, 363, 627–631 CrossRef CAS PubMed.
- D. Bi, W. Tress, M. I. Dar, P. Gao, J. Luo, C. Renevier, K. Schenk, A. Abate, F. Giordano, J.-P. C. Baena, J.-D. Decoppet, S. M. Zakeeruddin, M. K. Nazeeruddin, M. Grätzel and A. Hagfeldt, Sci. Adv., 2016, 2, e1501170 CrossRef PubMed.
- Z. Liu, L. Krückemeier, B. Krogmeier, B. Klingebiel, J. A. Márquez, S. Levcenko, S. Öz, S. Mathur, U. Rau, T. Unold and T. Kirchartz, ACS Energy Lett., 2019, 4, 110–117 CrossRef CAS.
| This journal is © The Royal Society of Chemistry 2022 |