 Open Access Article
Advancing the understanding of mainstream shortcut nitrogen removal: resource efficiency, carbon redirection, and plant capacity†
Kester
McCullough
 *ab,
Stephanie
Klaus
 a,
Michael
Parsons
a,
Christopher
Wilson
a and
Charles B.
Bott
a
a,
Michael
Parsons
a,
Christopher
Wilson
a and
Charles B.
Bott
a
aModelEAU, Département de génie civil, Pavillon Pouliot, Université Laval, Québec G1K 7P4, QC, Canada
bHampton Roads Sanitation District, 1434 Air Rail Avenue, Virginia Beach, VA 23455, USA
First published on 2nd September 2022
Abstract
Mainstream shortcut nitrogen removal processes show potential for reducing operational costs, reducing carbon footprints, allowing increased carbon capture, and increasing treatment plant capacity. Shortcut nitrogen removal has been successful in sidestream applications where it is well documented and well understood. However, very little full-scale mainstream shortcut nitrogen removal operational or performance data exists. Both the presence of significant organic carbon in wastewater influent and the limitations of mainstream plant capacity alter the theoretical basis for the analysis of the benefits of shortcut nitrogen removal when applied to the mainstream. Extant literature frequently ignores the role of influent carbon and the discussion of capacity increases from anammox processes is absent. This study addresses both these gaps in the literature. Using a generalizable (process configuration agnostic) mass balance method for understanding nitrogen removal in mainstream conditions, we demonstrate that 1) the resource requirements (oxygen, carbon and alkalinity) of mainstream nitrogen removal processes are functions of the efficient use of influent COD for the reduction of oxidized nitrogen species. 2) The analysis of resource requirements provides the theoretical basis for understanding and quantifying potential upstream carbon capture, a significant driver for shortcut nitrogen removal implementation. Additionally, through simple kinetic modeling we show that 3) the reduction in required aerobic SRT provided by mainstream anammox processes can provide increased plant capacity, reduced design safety factors, or additional anoxic or anaerobic treatment volume, which can further enhance the beneficial use of influent carbon. Partial-nitrification anammox (PNA) and partial-denitrification anammox (PdNA) provide comparable reductions in oxygen, alkalinity, and carbon requirements, although the gain in resource efficiency between any nitrogen removal process diminishes as influent carbon is used more efficiently for nitrogen reduction. Nitrite shunt processes provide similar resource efficacy benefits, but do provide the capacity increase (reduced aerobic SRT requirements) afforded by PNA and PdNA.
Water impactShortcut nitrogen removal can reduce the carbon, electricity, and chemical costs of wastewater treatment; increase plant capacity; and allow for carbon capture for energy production. Process stake-holders need the confidence and understanding to implement these next-generation nitrogen removal processes. To facilitate implementation, this study provides a more complete framework for understanding these processes than is currently available in the literature. |
1 Introduction
Biological nutrient removal (BNR) processes that shorten the conventional nitrification/denitrification pathway, broadly referred to as shortcut nitrogen removal, have been the target of significant research interest for over 30 years.1,2 Proposed methods for achieving shortcut nitrogen removal include nitritation/denitritation (nitrite shunt), patrial-nitritation anammox (PNA), and, most recently, partial-denitrification anammox (PdNA). The purported benefits of shortcut nitrogen removal are reductions in operating and capital costs and increased sustainability via: decreased aeration demands for nitrification, decreased supplemental carbon demands for denitrification, decreased alkalinity demands, decreased biomass production, and a lower required C/N ratio allowing for upstream carbon redirection and thus decreased aerobic treatment volume.3,4 Additionally, as demonstrated in this work, mainstream processes that incorporate anammox allow for significant aerobic solids retention time (SRT) reduction, as only a fraction of the influent ammonia must be oxidized aerobically.These processes have found significant application in sidestream treatment,5,6 and the theoretical and observed benefits of these sidestream processes are well established. Despite this, mainstream implementation of shortcut nitrogen removal remains elusive at full-scale.3 With little full-scale long-term mainstream operational data to rely on, the analysis and discussion of the benefits of shortcut nitrogen removal remain mostly theoretical however, the presence of significant chemical oxygen demand (COD) in mainstream wastewater, which must be removed along with the nitrogen, significantly alters the theoretical basis for understanding these processes and estimating their benefits. The literature describing the theoretical benefits of shortcut nitrogen removal frequently bases calculations of resource requirements (primarily oxygen and carbon) on a pure implementation of the subject process i.e. 60% decrease in aeration requirements for PNA assumes that 100% of the nitrogen removed is through PNA and disregards the impact of oxidized nitrogen species reduction with influent COD.3,7–24 In other words, the assumption of complete carbon diversion is implicit, but impossible from a practical standpoint. Comparison of nitrogen removal processes based on these assumptions leads to erroneous conclusions about the resource efficiency (i.e. the mass of oxygen, supplemental COD, and alkalinity required per mass of nitrogen removed) of each nitrogen removal pathway. Daigger4 addressed this directly, demonstrating that, with respect to aeration requirements, a fraction of the oxygen used for nitrification is recovered when oxidized nitrogen species serve as electron acceptors for COD oxidation. This analysis showed that the net electron transfer for the conversion of ammonia to dinitrogen gas is equivalent among processes (although PdNA was not included) when complete Total Inorganic Nitrogen (TIN) reduction is done with influent COD, but this may be unlikely to occur in practice.
The theoretical and practical benefits of shortcut nitrogen removal in mainstream BNR processes thus remains an open question when considering real applications; this study seeks to quantitatively address this question. The resource efficiency (oxygen, carbon and alkalinity requirements) of mainstream nitrogen removal is determined by how efficiently influent COD is used for the reduction of oxidized nitrogen species. We demonstrate that the requirements for oxygen, COD, and alkalinity for nitrogen removal are actually a continuum between the oft-presumed conditions that none or all of the oxidized nitrogen will be reduced with influent COD. The efficiency of influent COD use for oxidized nitrogen reduction also determines the potential for carbon capture that may be done without compromising nitrogen removal for each pathway. Finally, the reduction in required aerobic SRT provided by mainstream anammox processes must be included in the full analysis of the benefits of shortcut nitrogen removal. Reduced aerobic SRT requirements can provide increased plant capacity or additional anoxic or anaerobic treatment volume, which can further enhance the beneficial use of influent COD.
In this study, the efficiency of the conventional nitrification/denitrification process was compared to shortcut nitrogen removal processes (Nitrite Shunt, PNA, and PdNA) in the context of typical process configurations with respect to aeration, supplemental carbon, alkalinity, minimum influent C/N ratio required, and aerobic SRT (capacity) requirements. Stoichiometric tables were developed from the existing literature in a manner compatible with established Activated Sludge Model (ASM) matrices.25 Mass balances were developed for each nitrogen removal process that included the fraction of oxidized nitrogen reduced via influent COD to perform these comparisons. The calculations are presented within a general mass-balance framework that can be modified for varying yields and stoichiometries and can be adapted to new nitrogen removal process configurations. In addition, an ASM process model was used to demonstrate the impact of shortcut nitrogen removal on aerobic SRT requirements.
2 Materials and methods
To compare resource usage and efficiency among nitrogen removal pathways, the supplemental COD, oxygen, and alkalinity requirements were calculated from stoichiometry and mass balances based on process configurations. These tools were also used to develop the minimum carbon-to-nitrogen ratios for each process. The analysis of aerobic SRT requirements was developed using the SUMO1 1-step nitrification model (Dynamita SARL Nyons, France).2.1 Stoichiometry
To perform mass balances for each nitrogen removal pathway, a table of stoichiometry (Table 2) was developed based on ASM126,27 extended for two-step nitrification and denitrification (Table 1), with anammox stoichiometry adapted from Strous et al. (1998).28 Six biological processes (growth of OHO on oxygen, nitrite, and nitrate, AOB growth, NOB growth, and anammox growth), and six substrates (oxygen, ammonia, nitrite, nitrate, COD, and alkalinity) were considered. As the mass balances were conducted around nitrogen species, the stochiometric ratios are shown normalized to nitrite-nitrogen, nitrate-nitrogen, or oxygen.| (j) | 1 | 2 | 3 | 4 | 5 | 6 | |
|---|---|---|---|---|---|---|---|
| (i) | Process | S B (g COD) | S O2 (g COD) | S NHx (g N) | S NO2 (g N) | S NO3 (g N) | S ALK (g CaCO3) |
| 1 | OHO growth, O2 | −3.03 | −1 | −0.14 | −0.51 | ||
| 2 | OHO growth, NO2 | −3.72 | −0.14 | −1 | 3.07 | ||
| 3 | OHO growth, NO3 | −2.48 | −0.09 | 1 | −1 | −0.34 | |
| 4 | AOB growth | −3.28 | −1.01 | 1 | −7.18 | ||
| 5 | NOB growth | −1.05 | −0.01 | −1 | 1 | −0.02 | |
| 6 | Anammox growth | −0.76 | −1 | 0.20 | 0.16 |
This table of stoichiometry includes electron balances, biomass yields, and nitrogen assimilation. A similar table could be developed from only electron balances and yield to simplify the calculations, which is appropriate if nitrogen assimilation into biomass and ammonification of influent organic nitrogen are assumed to be approximately equivalent.30
2.2 Mass balances for nitrogen removal processes
The mass balances for each nitrogen removal pathway were calculated assuming complete nitrogen removal. Calculations were developed as functions of the fraction of influent nitrogen that, once oxidized to nitrite or nitrate (NOx), is then reduced with influent COD. To express this fraction, the term NOxRo is used, defined as the ratio of oxidized nitrogen (NOx) reduced with influent COD to the total influent nitrogen. NOxRo is a value between 0 and 1, representing how efficiently influent COD is used for denitrification, and has significant impacts on the oxygen, alkalinity, and supplemental COD required. In practice, NOxRo may be determined by a number of factors including process configuration, internal recycle configuration, and influent COD speciation. In this manner, the calculations covered the range of possible process conditions for comparison, including complete NOx reduction with influent COD (NOxRo = 1), as demonstrated in Daigger;4 no NOx reduction with influent COD (TINRO = 0), as is often implicit in the literature; and the range in between, which is more representative of full scale plant performance. Additionally, as only the efficiency of influent COD use for NOx removal needs to be known to perform the mass balance, the results are broadly applicable to a range of process configurations.Similarly for denitratation:
These process steps and the associated mass balance are shown in Table 3 (Conventional Nitrification/Denitrification) and Table 4 (Nitrite Shunt). These tables show stoichiometries, from Table 2, and the associated process factor (explained below); to obtain the mass balance the process factors are multiplied across each row, and the columns for each substrate are totaled. The final values for each substrate can then be normalized to ammonia–nitrogen basis. A graphical representation of the mass balance is shown in Fig. 1.
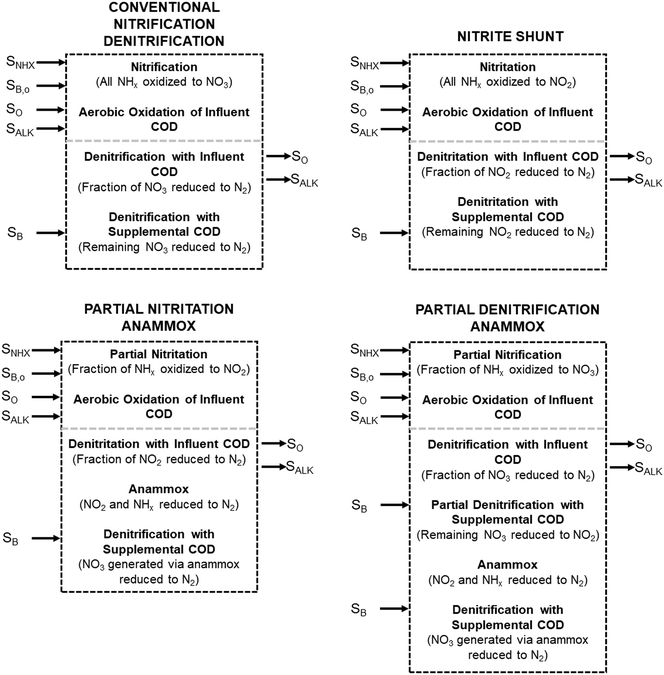 | ||
| Fig. 1 Schematic of mass balances for each nitrogen removal process. Process descriptions and variables correspond to those in Tables 3–6. | ||
In the first process step (nitrification or nitritation), the process factor is 1.0 as complete nitrification or nitritation is assumed. The process factor for the second step is NOxRo, by definition, and the final process step is NOxRo, again assuming full nitrogen removal.
As detailed previously, oxygen recovery via denitrification is considered when influent COD is oxidized, but not when supplemental COD is oxidized. Additionally, alkalinity generation is not included in the denitrification step with supplemental COD, as it is assumed that in a post anoxic denitrification system or second stage denitrification system (such as a filter or MBBR) little or none of the alkalinity generated will be returned to the nitrifying portion of the process. The oxygen, alkalinity, and supplemental COD requirements are thus functions of NOxRo.
If NOxRo, the ratio of nitrite and ammonia required by anammox, and the nitrate produced by anammox metabolism are known, the process factors for each step can be calculated; derivation of these calculations is provided in the ESI.† The process steps and associated mass balance are shown in Table 5 (PNA) and Table 6 (PdNA). A graphical representation of the mass balance is shown in Fig. 1. The mass balance is then calculated in the manner described previously, with the same assumptions for oxygen and alkalinity recovery through denitrification.
2.3 SRT requirements
To demonstrate the relationship between effluent ammonia concentration and SRT for the aerobic nitrification portion of nitrogen removal processes, a set of tanks-in-series ASM models were employed. As the purpose of the model was to understand effluent ammonia concentration, the 1-step nitrification SUMO1 model was chosen for simplicity. The model consisted of a primary clarifier, aerobic tanks-in-series, and a secondary clarifier with activated sludge recycle. The model was run at 10 °C, and had a 10 hour aerobic HRT, varied SRTs, and a typical DO concentration of 2.0 mg O2 L−1. These values were selected to simulate a typical full-scale nitrification system's operation including some temperature limitations. The kinetic values selected were taken from the SUMO1 model defaults. The SUMO process model is widely used31 and open source. Model parameters and important nitrifier kinetics for the model are shown in Table 7.| Model parameters | Value | Units |
|---|---|---|
| Influent flow | 24![[thin space (1/6-em)]](https://www.rsc.org/images/entities/char_2009.gif) 000 000 |
m3 d−1 |
| Aerobic treatment volume | 10![[thin space (1/6-em)]](https://www.rsc.org/images/entities/char_2009.gif) 000 000 |
m3 |
| No. of aerobic tanks-in-series | 1, 2, 4, or 8 | |
| Aerobic hydraulic residence time | 10 | Hour |
| Influent temperature | 10 | °C |
| DO setpoint | 2.0 | mg O2 L−1 |
| Influent tCOD concentration | 500 | mg COD L−1 |
| Influent TKN concentration | 40 | mg N L−1 |
| Influent ammonium concentration | 28 | mg N L−1 |
| Model kinetics | ||
|---|---|---|
| μ ANO,MAX | 0.9 | 1 d−1 |
| K NHx,ANO | 0.7 | mg NHx–N L−1 |
| θ μ,ANO | 1.07 | |
3 Results
3.1 Nitrogen removal resource efficiency
The net oxygen, alkalinity, and supplemental COD requirements for each nitrogen removal pathway developed from the mass balances are shown in Fig. 2–4 as functions of the fraction of NOx removed with influent COD (NOxRo). The differences in resource requirements for each process are maximized when no influent COD is used for NOx removal (NOxRo = 0) (i.e. complete influent carbon diversion), as no oxygen is recovered, no alkalinity is recovered, and supplemental COD is required for NOx removal. This demonstrates that the efficient use of influent COD is not only critical for process efficiency, but is a necessary basis for process comparison.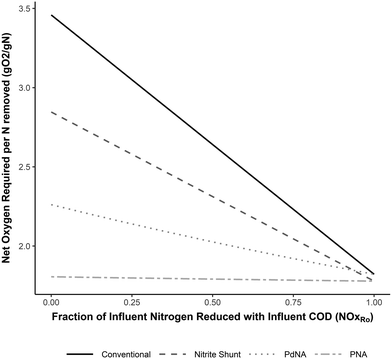 | ||
| Fig. 2 Net oxygen required per N removed for complete nitrogen removal for each nitrogen removal pathway as a function of the fraction of NOx reduced with influent COD (NOxRo). Developed from the equations in Tables 3–6. | ||
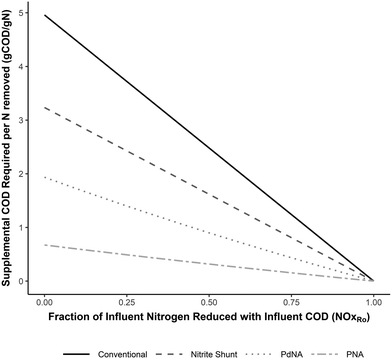 | ||
| Fig. 3 Supplemental COD required per N removed for complete nitrogen removal for each nitrogen removal pathway as a function of the fraction of NOx reduced with influent COD (NOxRo). Developed from the equations in Tables 3–6. | ||
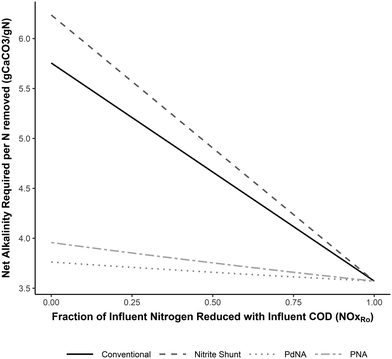 | ||
| Fig. 4 Alkalinity required per N removed for complete nitrogen removal for each nitrogen removal pathway as a function of the fraction of NOx reduced with influent COD (NOxRo). Developed from the equations in Tables 3–6. | ||
These results demonstrate that over a range of conditions, PNA is the most resource efficient nitrogen removal pathway, followed closely by PdNA. However, as NOx removal with influent COD is maximized, the process efficiencies converge.
Fig. 2 shows the oxygen requirements for complete nitrogen removal. When complete NOx reduction is achieved with influent COD (NOxRo = 1), the oxygen requirements for each pathway are nearly identical at approximately 1.8 g O2 g−1 N removed, as expected. If only the electron balance is considered (growth and assimilation are neglected), the oxygen requirements in this case would be exactly equal at 1.7 g O2 g−1 N.4
The oxygen requirements for PNA and nitrite shunt converge to the same value, as a PNA system performing complete NOx reduction with influent COD is only performing nitrite shunt and no anammox metabolism is involved. Similar logic applies to the convergence of PdNA and conventional oxygen requirements.
When no NOx removal occurs with influent COD (NOxRo = 0), the oxygen savings for shortcut nitrogen removal are most apparent. The conventional nitrification/denitrification pathway requires 3.5 g O2 g−1 N removed, and shortcut nitrogen removal decreases this requirement by 18% (nitrite shunt), 35% (PdNA), or 50% (PNA). As NOx removal with influent COD increases the oxygen savings benefit is reduced. For example, when NOxRo = 0.5, conventional nitrification/denitrification recovers 24% of the oxygen required for nitrification, and the net oxygen requirement for shortcut pathways is reduced by only 12% (nitrite shunt), 23% (PdNA), and 32% (PNA). While these reduced oxygen requirement reductions are not as drastic as an analysis neglecting oxygen recovery would indicate, they may still be significant for full-scale plants, and this benefit of shortcut nitrogen removal should not be discounted.
The slopes of the functions in Fig. 2 provide additional valuable insight. Increasing the efficient use of influent COD for NOx removal (a higher value of NOxRo) has the most significant impact on the oxygen requirements for conventional nitrification/denitrification. Conversely, this has almost no impact on the oxygen requirements for PNA, as the oxygen requirement is already near the theoretical minimum required for the oxidation state change of nitrogen in ammonia to nitrogen gas.
Fig. 3 shows the supplemental COD required for each nitrogen removal pathway. As more NOx is removed with influent COD, the supplemental COD requirement for complete nitrogen removal decreases and ultimately converges to zero for each nitrogen removal pathway (as all NOx is reduced with influent COD).
Conventional nitrification/denitrification requires approximately 5 g COD g−1 N removed when no NOx is reduced with influent COD, and this value decreases linearly as more influent COD is used for NOx removal. The relative reduction in supplemental COD requirements for shortcut nitrogen removal are similar across NOxRo values (35% for nitrite shunt, 61–65% for PdNA, and 86–88% for PNA).
Nitrite shunt requires slightly more alkalinity than conventional nitrification/denitrification on a per-nitrogen mass removed basis. This is due to the inclusion of nitrogen assimilation into biomass for this analysis. The overall alkalinity consumption/generation for the two processes are almost identical, as most of this occurs during the oxidation and reduction of nitrite, but a greater mass of nitrogen is removed through heterotrophic growth and assimilation in conventional nitrification/denitrification.
3.2 Carbon-to-nitrogen ratio required and potential for carbon redirection
Shortcut nitrogen removal allows for upstream carbon redirection by decreasing the overall carbon requirements of the nitrogen removal process. Alongside increased resource efficiency of shortcut nitrogen removal, carbon redirection allows for generation of power from redirected COD and increased plant capacity.The mass balances developed for analyzing resource efficiency can also be used to determine the minimum carbon-to-nitrogen ratio (C/N Ratio) required for complete nitrogen removal in each nitrogen removal pathway. Fig. 5 shows the minimum C/N Ratio requirements for each nitrogen removal pathway for complete nitrogen removal. Shortcut nitrogen removal processes require 35% (Nitrite Shunt), 61% (PdNA), or 86% (PNA) less carbon per nitrogen removed, regardless of whether the carbon comes from the influent wastewater or supplemental sources. These values are equivalent to the supplemental COD required in Fig. 3 when NOxRo. Although PNA is a completely autotrophic process, carbon is still required to reduce the small amount of nitrate produced by anammox metabolism.
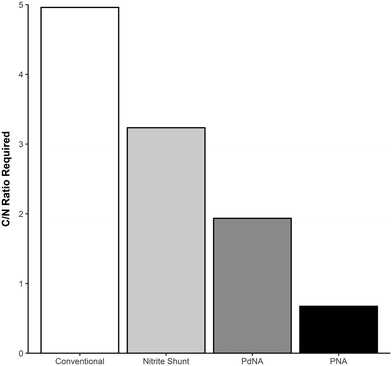 | ||
| Fig. 5 Total carbon-to-nitrogen ratio required for each nitrogen removal pathway for complete nitrogen removal. | ||
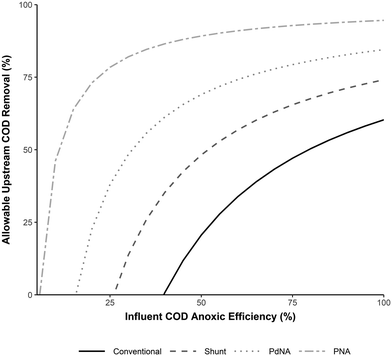
The potential allowable upstream carbon capture for each nitrogen removal process can be calculated based on these required C/N ratios (C/Nrequired), the influent wastewater C/N (C/Ninfluent), and how efficiently influent COD is used for TIN removal in the process (the Influent COD Anoxic Efficiency, or, the ratio of influent COD that is oxidized anoxically vs. aerobically). Assuming complete nitrogen removal and no supplemental COD addition, the allowable upstream COD removal is then given by: 1 − C/Nrequired/Influent COD Anoxic Efficiency/C/Ninfluent. Fig. 6 shows the results of this calculation for a typical wastewater influent (C/N Ratio = 12.5). The less efficiently influent COD is utilized (more is oxidized aerobically), the less carbon can be captured from the influent without compromising nitrogen removal. However, this can be offset by using a more carbon efficient shortcut nitrogen removal process.
For example, in a process with 60% influent COD anoxic efficiency (the other 40% influent COD is oxidized aerobically), conventional nitrification–denitrification, nitrite shunt, PdNA, and PNA would allow for 30%, 60%, 75%, and 90% upstream carbon capture/diversion, respectively. As the influent COD anoxic efficiency decreases, the potential for carbon redirection decreases, but is still possible with shortcut nitrogen removal processes, especially PNA. In a conventional nitrification–denitrification process, the influent COD anoxic efficiency must be >40% for carbon capture to be possible, and below this efficiency supplemental COD will be required. The point at which influent COD will not be sufficient for complete nitrogen reduction and supplemental COD will be required is the x-intercept for each process curve in Fig. 6.
To completely offset the energy costs of conventional treatment, approximately 65% of influent COD must be captured upstream.33 In the given scenario this is not possible in conventional nitrification–denitrification. Incorporating anammox into the nitrogen removal process makes this possible, and would require only 45% (PdNA) or 15% (PNA) influent COD anoxic efficiency. Additionally, if an upstream COD removal process removed significant amounts of nitrogen along with COD, these results would differ proportionally as the C/N ratio is effected by both COD removal and nitrogen removal.
3.3 SRT, safety factor, and plant capacity
In the anammox based processes (PNA and PdNA), some fraction of ammonia oxidation is carried out anaerobically instead of aerobically, which decreases the required aerobic SRT for a given treatment level. The decrease in required aerobic SRT for nitrification is a function of the nitrifier Monod kinetics and the effluent ammonia required for the downstream anammox process. In a PNA or PdNA process some fraction of ammonia oxidation will be done aerobically, and some fraction will be done anaerobically, and by decreasing the fraction of aerobic ammonia oxidation required, the aerobic SRT can be reduced.The relationship between aerobic SRT and effluent ammonia concentration was modeled as a simple fully aerobic activated sludge system in the 1-step nitrification SUMO1 model. The results are shown in Fig. 7 for a simple CSTR (N = number of Tanks-In-Series = 1) and multiple Tanks-In-Series (N = 2, 4, or 8) configurations.
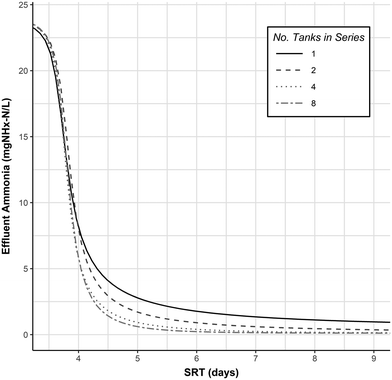 | ||
| Fig. 7 Effluent ammonia as a function of SRT and number of tanks-in-series at 10 °C from the SUMO1 nitrification model. Model parameters and kinetics are provided in Table 7. Additional model parameters were left as SUMO1 default values. | ||
The preceding mass balance analysis considered the idealized case of complete nitrogen removal. This is not possible in practice, and effluent ammonia concentrations are driven largely by permit requirements. Considering the case where an effluent ammonia concentration of 1.0 mg N L−1 must be attained, a conventional nitrification or nitritation process would require, irrespective of the influent ammonia concentration, an aerobic SRT of 4.7 (N = 8) to 8.7 days (N = 1). In a PNA or PdNA process where the same effluent ammonia concentration is achieved with downstream anammox treatment, the nitrification process could have a much higher effluent ammonia. For example, in a best case scenario aerobic ammonia oxidation is minimized, and no TIN removal done with influent COD (i.e. NOxRo = 0). Assuming an influent ammonia concentration of 25 mg N L−1 and using an NHx–N/NOx–N ratio of 0.76 from the stoichiometry in Table 2, the effluent from the nitrification process should have a NOx concentration of 14 mg N L−1 and an ammonia concentration of 11 mg N L−1 to satisfy the requirements of the downstream anammox process. The aerobic SRT required for this level of nitrification (11 mg N L−1) is approximately 3.8 days (for all cases of N), leading to a decreased aerobic SRT requirement of 20% (N = 8) to 56% (N = 1).
These theoretical results have also been demonstrated at full-scale. Although there is little full-scale mainstream PNA data available, recent implementation of a stable full-scale mainstream PdNA process has demonstrated significant aerobic SRT reduction. In this study, the WRRF transitioned from conventional nitrification/denitrification to PdNA by converting the post polishing denitrifying sand filters to PdNA filters. The upstream activated sludge process transitioned from fully nitrifying to only nitrifying a fraction of the influent ammonia, and in doing so reduced the operating aerobic SRT by 33% (from 7.5 to 5.0 days).34
Inspection of Fig. 7 reveals an additional benefit of operating the nitrification process at a lower SRT and higher effluent ammonia concentration: increased effluent ammonia sensitivity at lower SRTs (indicated by a steeper slope) allows for more control of the process with smaller SRT changes. This can justify smaller safety factors in design, which normally accommodate the large SRT changes required for relatively small changes in effluent ammonia when operating at low effluent ammonia concentrations.
A critical component to the SRT selection procedure is the selection of nitrifier kinetics, especially the maximum growth rate (μANO,Max); lower values of μANO,Max are often used to account for uncertainty or nitrifier inhibition.35 When slower nitrification kinetics are considered, the aerobic SRT benefit from PNA or PdNA is even more apparent, and should allow for the selection of lower safety factors. To demonstrate this, the nitrification model with 4 Tanks-In-Series (N = 4) was run with a range of nitrifier maximum growth rates from 0.6–0.9 d−1. The results of the model are shown in Fig. 8. The reduction in aerobic SRT provided by increasing the effluent ammonia from 1 to 11 mg N L−1 is magnified at lower maximum growth rates. The reduction in aerobic SRT is 1.1 days (4.9 vs. 3.8 days) at μANO,Max = 0.9 d−1 but increases to 3 days (10.6 vs. 7.6 days) at μANO,Max = 0.6 d−1. Under the more conservative assumption, μANO,Max = 0.6 d−1, a 3 day reduction in required aerobic SRT would imply increases in plant capacity or decreased aerobic volume, and would accommodate a lower design safety factor.
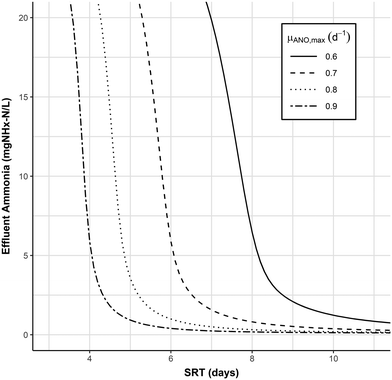 | ||
| Fig. 8 Effluent ammonia as a function of SRT and nitrifier maximum growth rate (μANO,Max) at 10 °C from the SUMO1 nitrification model described previously. Number of tanks-in-series = 4. | ||
Operating at a higher effluent ammonia concentration also decreases the magnitude of the impact of μANO,Max on process performance, which again allows for more efficient plant design. An effluent ammonia concentration of 11 mg N L−1 is attainable at an aerobic SRT of 3.8–7.6 days, suggesting a 3.8 day design SRT with a safety factor of 2 would be reasonable. An effluent ammonia concentration of 1 mg N L−1 is attainable at an aerobic SRT of 4.9–10.6 days, suggesting a safety factor of 2 would be the bare minimum, and possibly too low.
PNA and PdNA allow lower design aerobic SRTs by operating the nitrification process far above limiting substrate (ammonia) conditions. This change further allows for less conservative designs (lower safety factors) through (1) increasing the impact of aerobic SRT changes on effluent ammonia and (2) decreasing the impact of variations in μANO,Max on effluent ammonia.
4 Discussion
4.1 Nitrogen removal resource efficiency
The requirements for oxygen, supplemental COD, and alkalinity for nitrogen removal are indeed different among nitrogen removal pathways, and these differences should not be discounted. While the often-presented values for reduced resource demand via shortcut nitrogen removal are overly-optimistic, and neglect the impact of TIN removal with influent COD, the process efficiencies are only negated in the unlikely scenario that complete TIN removal is done with influent COD. The relative benefits of shortcut nitrogen removal decrease as more TIN is reduced with influent COD, which demonstrates the benefit of increasing the efficient use of influent carbon for any nitrogen removal process. The reduction in alkalinity requirements, which has often been overlooked, are significant for PNA and PdNA.4.2 Carbon-to-nitrogen ratio required
Shortcut nitrogen removal processes require less organic carbon for nitrogen removal. This decreases the required supplemental COD for nitrogen removal, and more importantly allows COD present in the influent to be captured and used without compromising nitrogen removal. This captured carbon can be used for energy generation, which is a critical step energy autarky. As demonstrated, for typical municipal wastewater influents, shortcut nitrogen removal allows sufficient carbon diversion to provide sufficient energy production to achieve energy neutrality.Redirecting influent carbon also allows for increased plant capacity: less influent carbon dictates less heterotrophic growth and thus lower MLSS concentration for a given SRT. Thus a plant that captures significant carbon before the activated sludge process can operate at a higher total SRT or a higher loading.
Ideally, all of the COD needed for nitrogen removal would come from influent COD, obviating the need for exogenous carbon sources. In practice this is unlikely due to process layout requirements; for example, the nitrate produced by anammox would be difficult to remove with influent COD, although research is ongoing on using fermentation products (from COD redirected from influent wastewater) as a carbon source.36
4.3 SRT, safety factor, and plant capacity
BNR design SRTs are based on selected values of nitrifier kinetics, ammonia removal requirements, process configuration (plug-flow vs. CSTR), and various safety factors including peak loading, oxygen, and temperature.29,37 Shortcut nitrogen removal pathways that incorporate anammox (PNA and PdNA) have lower aerobic SRT requirements, as less aerobic ammonia oxidation is required. To meet the required stoichiometry for downstream anammox, the fraction of ammonia that must be aerobically oxidized is dependent on the amount of TIN removed with influent COD, as the ratio of ammonia to nitrite/nitrate going to the anammox process must be maintained. This can be controlled, to some extent, through upstream carbon redirection or process configuration or operational changes, but overall, the aerobic nitrification process will have a significant ammonia residual for downstream anammox treatment.This reduction in aerobic SRT requirements, alone or in combination with a reduced COD load from upstream carbon diversion, provides the significant intensification benefits of shortcut nitrogen removal. Design SRTs and safety factors can be reduced, leading to increased capacity for existing plants and smaller designs for new construction. Plants could opt to maintain their total SRT, and lower required aerobic SRTs allow the conversion of existing aerobic tank volume to anoxic volume, also allowing for step-feed configurations, or transition to intermittent aeration; these modifications would also increase TINRO, leading to further efficiency. Aerobic volume could also be converted to anaerobic volume, allowing for biological phosphorus removal. Decreased aerobic SRT may also be accomplished through decreasing the operating DO, allowing the benefits of SND and shortcut nitrogen removal to be realized together. Control authority over nitrification is also increased in these processes, as smaller changes in SRT lead to larger variations in ammonia concentrations when operating farther away from the half-saturation concentration. Finally, very low aerobic SRT operation may also favor nitrite breakthrough,38 at least seasonally, allowing a downstream PdNA process to also perform PNA and reduce supplemental carbon demands even further. Evidence from a full-scale PdNA sand filter showed it was readily capable of alternating between PNA and PdNA depending on the level of nitrite accumulation achieved in the upstream BNR process.34
Anammox implementations for PNA and PdNA are flexible and robust. Post-polishing nitrogen removal processes appear ripe for conversion to PdNA. The addition of anammox allows for ammonia removal after the aerobic process, which increases redundancy. Polishing anammox implementations (biofilters, MBBRs, etc.) can also be combined with upstream anammox (IFAS or granular sludge) for even greater benefit.
4.4 Comparing shortcut nitrogen removal processes
PNA is the most resource efficient nitrogen removal pathway, but this means little if the process cannot be implemented in mainstream processes at full scale. The main obstacle to full scale mainstream PNA implementation has been maintaining NOB outselection.3 PdNA does not require NOB outselection and provides comparable reduction in resource requirements. Most importantly PdNA has been successfully and continuously implemented in mainstream full-scale processes.34,39 While research on enhancing partial denitrification to support PdNA is ongoing, current work suggests this is relatively simple to control16 and is robust. Full scale PdNA processes also demonstrate the capability to operate as PNA processes if NOB outselection is achieved.34 This provides the flexibility to design processes around PdNA while still pursing PNA; additionally if the PdNA system is implemented as a polishing/two-step process, it can fallback to full denitrification if ever needed. Process flexibility is enhanced, not limited by these more advanced processes: by implementing PdNA, attempting to achieve PNA if possible, and using additional non-aerobic volumes provided by decreased aerobic SRT requirements for swing zones and step-feed operators are provided with maximal optionality. The nitrite shunt process likely still has a roll to play, as it only requires NOB outselection, and no other process modifications to grow and retain anammox. While NOB outselection remains consistently elusive, if it can be maintained at a plant there can be immediate resource efficiency gains.5 Conclusions
A generalized, configuration-agnostic mass balance method was developed to calculate the stochiometric substrate requirements for conventional and shortcut nitrogen removal processes in mainstream conditions. A process model was used to extend this analysis to include SRT requirements for these processes. From this, it was found that:• The oxygen, alkalinity, and supplemental carbon requirements of mainstream nitrogen removal processes are frequently misstated in the literature. These resource requirements are best understood as a function of the fraction of oxidized nitrogen that is reduced with influent carbon. When complete nitrogen reduction is done with influent carbon, there is almost no difference in resource efficiency, but this is unlikely to occur in practice.
• Shortcut nitrogen removal processes require less organic carbon than conventional processes, whether that carbon is from influent wastewater or exogenous sources. Implementing these processes allows for carbon capture/diversion without compromising nitrogen removal. Typical wastewater conditions and process efficiencies are unlikely to allow energy autarky via captured carbon, unless shortcut nitrogen removal is implemented.
• Reduction in required aerobic SRT via anammox is the most overlooked and most significant benefit of implementing PNA or PdNA. Aerobic SRT reduction allows for increased plant capacity, more compact plant designs, reduced safety factors, and more anoxic or anaerobic volume in existing plants.
• While PNA is the most resource efficient process in theoretical terms, PdNA is a very close second. PdNA has successfully and continuously been implemented at full-scale; PNA remains challenging due to the difficulty of sustaining NOB out-selection. PdNA and PNA both offer the benefits of reduced aerobic SRT requirements maximizing potential influent carbon diversion.
Nomenclature
| AvN | Ammonia versus NO2 process factor i.e. the ratio of NHx–N to NO2–N required for anammox metabolism |
| NOxRo | Fraction of NOx removed through reduction with influent COD |
| S B | Readily biodegradable COD concentration |
| S O | Dissolved oxygen concentration |
| S NO2 | NO2–N concentration |
| S NO3 | NO3–N concentration |
| S ALK | Alkalinity concentration |
| S NHx | NHx–N concentration |
| NHx–N | Ammonia and ammonium nitrogen |
| NO2–N | Nitrite nitrogen |
| NO3–N | Nitrate nitrogen |
| NOx–N | Nitrite and nitrate nitrogen |
| AOB | Ammonia oxidizing bacteria |
| NOB | Nitrite oxidizing bacteria |
| OHO | Ordinary heterotrophic organism |
| ANO | Autotrophic nitrifying organisms, used in place of AOB/NOB populations for 1-step nitrification (SUMO1) model |
| Y OHO | OHO biomass yield coefficient |
| Y OHO,Ax | OHO anoxic biomass yield coefficient |
| Y AOB | AOB biomass yield coefficient |
| Y NOB | NOB biomass yield coefficient |
| i N,B | Fraction of nitrogen in biomass |
| μ ANO,MAX | Maximum ANO growth rate |
| K NHx,ANO | ANO substrate half-saturation coefficient |
| θ μ,ANO | Temperature correction factor for ANO growth rate |
Conflicts of interest
There are no conflicts to declare.Acknowledgements
The authors thank the Hampton Roads Sanitation District (HRSD) for providing the facilities and equipment for this research.References
- T. Prakasam and R. Loehr, Microbial nitrification and denitrification in concentrated wastes, Water Res., 1972, 6, 859–869 CrossRef CAS.
- O. Turk and D. S. Mavinic, Preliminary assessment of a shortcut in nitrogen removal from wastewater, Can. J. Civ. Eng., 1986, 13, 600–605 CrossRef.
- Y. Cao, M. C. M. van Loosdrecht and G. T. Daigger, Mainstream partial nitritation–anammox in municipal wastewater treatment: status, bottlenecks, and further studies, Appl. Microbiol. Biotechnol., 2017, 101, 1365–1383 CrossRef CAS PubMed.
- G. T. Daigger, Oxygen and Carbon Requirements for Biological Nitrogen Removal Processes Accomplishing Nitrification, Nitritation, and Anammox, Water Environ. Res., 2014, 86, 204–209 CrossRef CAS PubMed.
- S. Lackner, E. M. Gilbert, S. E. Vlaeminck, A. Joss, H. Horn and M. C. M. van Loosdrecht, Full-scale partial nitritation/anammox experiences – An application survey, Water Res., 2014, 55, 292–303 CrossRef CAS PubMed.
- J. B. Neethling and H. De Clippeleir, Shortcut Nitrogen Removal—Nitrite Shunt and Deammonification, Water Environment Federation, Alexandria, Va, 2015 Search PubMed.
- M. Ali and S. Okabe, Anammox-based technologies for nitrogen removal: Advances in process start-up and remaining issues, Chemosphere, 2015, 141, 144–153 CrossRef CAS PubMed.
- A. S. Arora, A. Nawaz, M. A. Qyyum, S. Ismail, M. Aslam, A. Tawfik, C. M. Yun and M. Lee, Energy saving anammox technology-based nitrogen removal and bioenergy recovery from wastewater: Inhibition mechanisms, state-of-the-art control strategies, and prospects, Renewable Sustainable Energy Rev., 2021, 135, 110126 CrossRef CAS.
- S. Cao, R. Du and Y. Zhou, Coupling anammox with heterotrophic denitrification for enhanced nitrogen removal: A review, Crit. Rev. Environ. Sci. Technol., 2020, 1–34 Search PubMed.
- K. I. Cogert, R. M. Ziels and M. K. H. Winkler, Reducing Cost and Environmental Impact of Wastewater Treatment with Denitrifying Methanotrophs, Anammox, and Mainstream Anaerobic Treatment, Environ. Sci. Technol., 2019, 53, 12935–12944 CrossRef CAS.
- R. Du, Y. Peng, J. Ji, L. Shi, R. Gao and X. Li, Partial denitrification providing nitrite: Opportunities of extending application for anammox, Environ. Int., 2019, 131, 105001 CrossRef CAS PubMed.
- I. Fernández, J. Dosta and J. Mata-Álvarez, A critical review of future trends and perspectives for the implementation of partial nitritation/anammox in the main line of municipal WWTPs, Desalin. Water Treat., 2016, 57, 27890–27898 Search PubMed.
- H. Gao, Y. D. Scherson and G. F. Wells, Towards energy neutral wastewater treatment: methodology and state of the art, Environ. Sci.: Processes Impacts, 2014, 16, 1223–1246 RSC.
- J. Gu, M. Zhang and Y. Liu, A review on mainstream deammonification of municipal wastewater: Novel dual step process, Bioresour. Technol., 2020, 299, 122674 CrossRef CAS PubMed.
- M. S. M. Jetten, S. J. Horn and M. C. M. van Loosdrecht, Towards a more sustainable municipal wastewater treatment system, Water Sci. Technol., 1997, 35, 171–180 CrossRef CAS.
- T. Le, B. Peng, C. Su, A. Massoudieh, A. Torrents, A. Al-Omari, S. Murthy, B. Wett, K. Chandran, C. deBarbadillo, C. Bott and H. D. Clippeleir, Nitrate residual as a key parameter to efficiently control partial denitrification coupling with anammox, Water Environ. Res., 2019, 91, 1455–1465 CrossRef CAS PubMed.
- X. Li, S. Klaus, C. Bott and Z. He, Status, Challenges, and Perspectives of Mainstream Nitritation-Anammox for Wastewater Treatment, Water Environ. Res., 2018, 90, 634–649 CrossRef CAS PubMed.
- Y. Liu, J. Gu and M. Zhang, A-B Processes: Towards Energy Self-sufficient Municipal Wastewater Treatment, IWA Publishing, 2020 Search PubMed.
- B. Ma, S. Wang, S. Cao, Y. Miao, F. Jia, R. Du and Y. Peng, Biological nitrogen removal from sewage via anammox: Recent advances, Bioresour. Technol., 2016, 200, 981–990 CrossRef CAS PubMed.
- S. Magdum and V. Kalyanraman, Existing biological nitrogen removal processes and current scope of advancement, Res. J. Chem. Environ., 2017, 21, 43–53 Search PubMed.
- A. Mulder, The quest for sustainable nitrogen removal technologies, Water Sci. Technol., 2003, 48, 67–75 CrossRef CAS.
- B. Wett, Development and implementation of a robust deammonification process, Water Sci. Technol., 2007, 56, 81–88 CrossRef CAS PubMed.
- M. Zhang, S. Wang, B. Ji and Y. Liu, Towards mainstream deammonification of municipal wastewater: Partial nitrification-anammox versus partial denitrification-anammox, Sci. Total Environ., 2019, 692, 393–401 CrossRef CAS PubMed.
- G. Zhu, Y. Peng, B. Li, J. Guo, Q. Yang and S. Wang, in Reviews of Environmental Contamination and Toxicology, ed. D. M. Whitacre, Springer, New York, NY, 2008, pp. 159–195 Search PubMed.
- M. Henze, W. Gujer, T. Mino and M. C. M. van Loosdrecht, Activated sludge models ASM1, ASM2, ASM2d and ASM3, IWA Publishing, London, UK, 2000 Search PubMed.
- C. P. L. Grady Jr., W. Gujer, M. Henze, G. V. R. Marais and M. Tomonori, A Model for Single-Sludge Wastewater Treatment Systems, Water Sci. Technol., 1986, 18, 47–61 CrossRef.
- M. Henze, C. P. L. Grady Jr., W. E. A. Gujer, G. Marais and T. Matsuo, Activated Sludge Model No 1, IAWQ, London, UK, 1987 Search PubMed.
- M. Strous, J. J. Heijnen, J. G. Kuenen and M. S. M. Jetten, The sequencing batch reactor as a powerful tool for the study of slowly growing anaerobic ammonium-oxidizing microorganisms, Appl. Microbiol. Biotechnol., 1998, 50, 589–596 CrossRef CAS.
- W. C. Hiatt and C. P. L. Grady, An Updated Process Model for Carbon Oxidation, Nitrification, and Denitrification, Water Environ. Res., 2008, 80, 2145–2156 CrossRef CAS.
- A. C. van Haandel and J. G. M. van der Lubbe, Handbook of Biological Wastewater Treatment: Design and Optimisation of Activated Sludge Systems, IWA Publishing, London, UK, 2012 Search PubMed.
- J. Mąkinia and E. Zaborowska, Mathematical modelling and computer simulation of activated sludge systems, 2020 Search PubMed.
- Y. Cao, Mass flow and energy efficiency of municipal wastewater treatment plants, IWA Publishing, London, UK, 2011 Search PubMed.
- Y.-J. Liu, J. Gu and Y. Liu, Energy self-sufficient biological municipal wastewater reclamation: Present status, challenges and solutions forward, Bioresour. Technol., 2018, 269, 513–519 CrossRef CAS.
- R. Fofana, M. Parsons, C. Long, K. Chandran, K. Jones, S. Klaus, B. Trovato, C. Wilson, H. De Clippeleir and C. Bott, Full-scale transition from denitrification to partial denitrification–anammox (PdNA) in deep-bed filters: Operational strategies for and benefits of PdNA implementation, Water Environ. Res., 2022, 94, e10727 CAS.
- C. P. L. Grady, G. T. Daigger and N. G. Love, Biological wastewater treatment, IWA Publishing, London, 2011 Search PubMed.
- P. Ali, N. Zalivina, T. Le, R. Riffat, S. Ergas, B. Wett, S. Murthy, A. Al-Omari, C. deBarbadillo, C. Bott and H. D. Clippeleir, Primary sludge fermentate as carbon source for mainstream partial denitrification–anammox (PdNA), Water Environ. Res., 2021, 93, 1044–1059 CrossRef CAS PubMed.
- O. K. Scheible, M. Mulbarger, P. Sutton, T. Simpkin, G. Daigger, J. Heidman, M. Yoder, D. Schwinn and D. Storrier, Manual nitrogen control, U.S. Environmental Protection Agency, Office of Research and Development, Center for Environmental Research Information, Risk Reduction Engineering Laboratory ; Office of Water, Office of Wastewater Enforcement and Compliance, Cincinnati, Ohio; Washington, D.C., 1993 Search PubMed.
- C. Hellinga, A. A. J. C. Schellen, J. W. Mulder, M. C. M. van Loosdrecht and J. J. Heijnen, The sharon process: An innovative method for nitrogen removal from ammonium-rich waste water, Water Sci. Technol., 1998, 37, 135–142 CrossRef CAS.
- H. Chen, Z. Tu, S. Wu, G. Yu, C. Du, H. Wang, E. Yang, L. Zhou, B. Deng, D. Wang and H. Li, Recent advances in partial denitrification-anaerobic ammonium oxidation process for mainstream municipal wastewater treatment, Chemosphere, 2021, 130436 CrossRef CAS.
Footnote |
| † Electronic supplementary information (ESI) available. See DOI: https://doi.org/10.1039/d2ew00247g |
| This journal is © The Royal Society of Chemistry 2022 |


