
 Open Access Article
 This Open Access Article is licensed under a
 Creative Commons Attribution 3.0 Unported Licence
Efficacy of thermal hydrolysis for boosting specific methane yield depending on temperature-normalized solids retention time in an activated sludge process
J.
Rühl
 *a,
S.
Agrawal
b and
M.
Engelhart
*a
*a,
S.
Agrawal
b and
M.
Engelhart
*a
aTechnical University of Darmstadt, Institute IWAR, Wastewater Technology, Franziska-Braun-Str. 7, 64287 Darmstadt, Germany. E-mail: j.ruehl@iwar.tu-darmstadt.de; m.engelhart@iwar.tu-darmstadt.de
bTechnical University of Darmstadt, Institute IWAR, Water and Environmental Biotechnology, Franziska-Braun-Str. 7, 64287 Darmstadt, Germany
First published on 17th October 2022
Abstract
The impact of varying operating conditions of a full-scale activated sludge process (ASP) on the efficacy of thermal hydrolysis in terms of increasing the specific methane yield (SMY) of waste activated sludge (WAS) during anaerobic digestion was evaluated. For this purpose, batch and semi-continuous anaerobic digestion tests (long-term study) were carried out with untreated and thermal hydrolyzed WAS on a laboratory scale. For the long-term study, thermal hydrolysis was set up at 160 °C for 30 min. A temperature-normalized solids retention time (SRTASP,T) was used to account for varying operating conditions in the ASP. In the semi-continuous experiments, the SMY of WAS decreased by 20% due to endogenous respiration as SRTASP,T increased from 26 d to 60 d. At the same time, thermal hydrolysis increased the SMY of WAS by 31% to 53%. Since the SMY of WAS mainly depends on active organic biomass, non-biodegradable or slowly degradable components are made more bioavailable for anaerobic digestion by thermal hydrolysis.
Water impactThermal hydrolysis can increase energy self-sufficiency by increasing the specific methane yield (SMY) of waste activated sludge. Temperature-normalized solids retention time of the activated sludge process allows assessing the efficacy of thermal hydrolysis of waste activated sludge in terms of boosting the SMY. |
1. Introduction
Anaerobic digestion (AD) is commonly used in wastewater treatment plants (WWTPs) for the stabilization and mass reduction of sewage sludge in order to reduce disposal costs. In addition, the produced biogas is used for energy recovery to increase energy self-sufficiency. For waste activated sludge (WAS), the specific methane yield (SMY) depends on the operating conditions of the upstream activated sludge process (ASP). The most crucial parameter of the ASP is the solids retention time (SRTASP), on which WAS production, composition, and biodegradability depend.1 With increasing SRTASP, specific biogas/methane yield decreases.1–3 Increasing temperatures in the ASP (TASP) have similar effects on the composition of WAS and its methane production.4 Considerable efforts have been made using various pretreatment technologies to improve AD performance in biogas and methane production.5–7 Thermal hydrolysis (≥120 °C) has been investigated intensively to increase both rate and extent of anaerobic biodegradability of sewage sludge.7–10 The success of thermal hydrolysis depends on its operating conditions and sludge type.Many studies on thermal hydrolysis focus on the effects of operating conditions like temperature and reaction time.8,9,11–13 Biodegradability of WAS increased up to ∼165% with increasing temperature up to 190 °C.11 Beyond these temperatures, biodegradability decreases again due to the increased formation of recalcitrant organic compounds like melanoidin by the Maillard reaction.14–16 Donoso-Bravo et al.9 observed that reaction times from 0 to 30 min at 170 °C improved total biogas production by 7%. Sapkaite et al.12 investigated the effect of temperature (130 °C, 150 °C, 180 °C) at varying reaction times (5 min, 30 min, 50 min) and estimated the highest specific methane production in the range of 155–175 °C for 25–45 min. In contrast to the temperature, reaction time has a minor impact on the total biodegradability of thermally hydrolyzed WAS. In summary, the optimal operating conditions range from 140 to 175 °C for 20–30 min.8,9,12,15
In addition, an increase in biodegradability depends on the type of sludge and the sludge properties. Only a few studies deal with primary sludge (PS), showing inconsistent results. While Haug and Stuckey17 found no improvement in biogas production at 175 °C, other authors observed increasing biogas production of 20% to 44% at 170 °C to 175 °C, respectively.18,19 Thermal hydrolysis has a more decisive influence on the biodegradability of WAS. The results of several studies indicate that an increase in biodegradability of WAS is linked to the operating conditions in the ASP. For WAS originating from a high-load ASP, the relative increase in biodegradability ranges from −6% to ∼63% due to thermal hydrolysis at 135–170 °C.11,20 At the same range of pretreatment temperatures, relative biodegradability increases from ∼35% to ∼130% for WAS originating from a low-load (extended aeration) ASP.11,20 In semi-continuous experiments, Pinnekamp14 observed a similar tendency. For WAS originating from high- and low-load ASP, biogas production increased by 42.4% to 123% at pretreatment temperatures of 135 °C, respectively. Accordingly, thermal hydrolysis seems to have a higher effect on increasingly stabilized WAS originating from systems with higher SRTASP.
However, comparing these studies is difficult since the investigated WAS and experimental setups differ. Furthermore, observations are mainly based on studies investigating different single WAS samples and thus are subject to large variations. To assess the impact of the upstream ASP on the efficacy of thermal hydrolysis in terms of SMY, additional specifications of the ASP such as SRTASP and TASP are required. However, these parameters have not yet been systematically studied in this context. Furthermore, complementary long-term studies for WAS generated at varying SRTASP and TASP are missing. Therefore, this study aimed to investigate the impact of the ASP on the efficacy of thermal hydrolysis in terms of SMY. For this purpose and to the authors' best knowledge, a temperature-normalized SRTASP (SRTASP,T) was used for the first time as a reference parameter. In preliminary experiments, the effect of thermal hydrolysis on WAS was investigated. However, the main focus was on the long-term investigation of the impact of SRTASP,T on the SMY of untreated and thermal hydrolyzed WAS (thermal hydrolysis at 160 °C for 30 min) on a laboratory scale (semi-continuous AD experiments).
2. Materials and methods
2.1. Origin of waste activated sludge
The investigated WAS originated from two WWTPs with a size of 240![[thin space (1/6-em)]](https://www.rsc.org/images/entities/char_2009.gif) 000 PE (WWTP_A) and 35000 PE (WWTP_B) located in Germany and designed for biological nitrogen removal with (WWTP_A) and without (WWTP_B) a primary clarifier prior to biological treatment. Phosphorus is removed by simultaneous precipitation. A systematic enhanced biological phosphorus removal is not intended (no anaerobic tank). The generated sewage sludge consisting of WAS and PS for WWTP_A and WAS only for WWTP_B is treated in anaerobic digesters on-site. The return liquor resulting from the digested sludge (DS) dewatering is returned to the ASP. WAS from WWTP_A was used for the semi-continuous experiments and batch tests. WAS from WWTP_B was used for batch tests only (see below). The characteristics of each WAS are summarized in Table 1.
000 PE (WWTP_A) and 35000 PE (WWTP_B) located in Germany and designed for biological nitrogen removal with (WWTP_A) and without (WWTP_B) a primary clarifier prior to biological treatment. Phosphorus is removed by simultaneous precipitation. A systematic enhanced biological phosphorus removal is not intended (no anaerobic tank). The generated sewage sludge consisting of WAS and PS for WWTP_A and WAS only for WWTP_B is treated in anaerobic digesters on-site. The return liquor resulting from the digested sludge (DS) dewatering is returned to the ASP. WAS from WWTP_A was used for the semi-continuous experiments and batch tests. WAS from WWTP_B was used for batch tests only (see below). The characteristics of each WAS are summarized in Table 1.
2.2. Determination of SRTASP,T
Traditionally, total system SRTASP for steady-state conditions is defined as the average time activated sludge remains in the ASP.21 However, WWTPs rarely work in a steady state due to varying operating conditions. Dynamic approaches for determining the SRTASP consider that with variations in sludge withdrawal, the SRTASP does change rather gradually but not immediately.22,23 In brief, to gradually account for changes in the SRTASP, a moving average of SRTASP was used.23 Based on the yearly average SRTASP of 25 ± 6 d for WWTP_A and 13 ± 5 d for WWTP_B, a moving average of 25 d for WWTP_A and 14 d for WWTP_B was used for calculating the SRTASP. To consider seasonal fluctuations of the mixed liquor temperature in the ASP (TASP) and its effect on microbial activity, the SRTASP was related to a reference temperature (Tref) as stated by Clara et al.:24| SRTASP,T = SRTASP·1.072(T−Tref) | (1) |
2.3. Thermal hydrolysis
A double-walled pressure reactor (V = 8 L) equipped with thermal oil was used for thermal pretreatment. For continuous mixing, the pressure reactor was equipped with a stirrer using a magnetic bearing (Cyclone 300, Büchi AG, Switzerland). Thermal oil was heated by a heat transfer system (STO 1-DO, Single Temperiertechnik GmbH, Germany) and was controlled due to temperature measurement in the heat transfer unit and the pressure reactor. Pressure was monitored via a manometer (0–10 bar). Temperature and pressure were manually recorded in 5 min intervals. For preliminary experiments, WAS samples were treated for 30 min at approximately 120 °C, 140 °C, and 160 °C each at the corresponding pressure. For the long-term study, WAS samples were treated at approx. 160 °C and corresponding pressure of approx. 6 bar for 30 min. For evaluation of the efficacy of thermal pretreatment, COD solubilization (SCOD) and anaerobic biodegradation (semi-continuous and batch experiments) of the samples were determined using eqn (2) and (3): | (2) |
 | (3) |
S COD,g: gross COD solubilization in %
CODt: total COD of WAS in mg L−1
CODs0: soluble COD of WAS before thermal hydrolysis in mg L−1
CODsp: soluble COD of WAS after thermal hydrolysis in mg L−1
Due to low CODs in the raw WAS, SCOD,n of 39.5 ± 2.9% (n = 6) and SCOD,g of 39.3 ± 2.8% (n = 6) show similar results and thus only SCOD,g is considered in the following.
2.4. Anaerobic digestion tests and experimental procedures
Semi-continuous anaerobic digestion experiments were performed on a laboratory scale using two digesters with a volume of 16 L each. The experimental temperature was kept constant at 37 °C as the digesters were placed in a climate chamber. The digesters were inoculated with digested sludge from the full-scale digester of WWTP_A. One digester was fed with WAS, the other with thermal hydrolyzed WAS (WASTH). After a start phase of 33 d, the performance of each digester was evaluated over 300 d. Feeding was carried out once a day, except for day 202 to day 258, during which feeding was carried out 5 d a week. Anaerobic digestion was operated at a calculative SRTDig of 18–20 d. As stated by Kapp,26 feeding on a 7 d per week or 5 d per week regime at an SRTDig of 20 d leads to comparable anaerobic digestion performances for WAS. WAS from WWTP_A was thermally hydrolyzed directly after sampling. The corresponding WAS and WASTH samples were fed to the digesters over feeding periods of 11 to 33 d due to the availability of thermal hydrolysis and storage capacities for the sludge samples. Digester performance was evaluated for each feeding period. For proper manual feeding and storing over such long periods, WAS and WASTH samples were frozen batchwise at −18 to −24 °C and thawed at room temperature one day before use. For WASTH, storing had no further impact on TS, VS and SCOD,g. In contrast, a small part of the organic matter of WAS broke down, resulting in SCOD,g = 6.5 ± 1.8%. For a separate sample, the impact of storing was evaluated. SCOD,g was 4.2% and BMP increased by only 6.3%. However, considering the deviation of BMP batch tests and the variability of semi-continuous experiments, this effect was comparatively low and will not be considered in this paper.Biogas flow rates were measured continuously (type TG 0.5, Dr.-Ing. Ritter Apparatebau GmbH & Co. KG, Germany). Methane and carbon dioxide concentrations of biogas were measured continuously in the moist biogas every two weeks for a period of one week (BlueSens gas sensor GmbH, Germany). Ambient pressure was determined daily by using a handheld device. Methane concentration was calculated for dry gas according to VDI 4630.27 Biogas production was normalized to standard conditions according to VDI 4630.27
Total solids (TS) were measured according to DIN EN 12880:2011-02,28 total volatile solids (VS) according to DIN EN 15935:2012-11,29 and total COD (CODt) in analogy to DIN 38414-9:1986-09.30 pH was measured using a pH meter (type 197 WTW GmbH, Germany). After filtering the samples with 0.45 μm syringe filters (polyethersulfone), soluble COD (CODs), ammonium (NH4-N), volatile fatty acids (VFAs), and orthophosphate (PO4-P) were measured using cuvette tests (Hach Lange GmbH, Germany). Analyses of feed were conducted right after sampling (TS, VS, soluble parameters) and after freezing and thawing (TS, VS, CODt, CODs, NH4-N, PO4-P). Analyses of the effluent were conducted at least once a week (CODt, TS, VS, CODs, NH4-N, VFA, PO4-P).
Cumulative SMY over each evaluating period was calculated as follows:
 | (4) |
Q gas: flow rate of biogas in NL d−1
CH4: concentration of methane in %
Q in: influent flow rate in L d−1
c COD,in: influent total COD in kg L−1
n: duration of evaluation period
As the concentration of CH4 was not measured daily, the mean concentrations of the measurement days were used in eqn (4). In most cases, evaluating and feeding periods match (Table 2). However, operational breakdowns arose in the first four feeding periods, which distorted the results. Therefore, only a continuous evaluation period without operational breakdowns is used in these cases, which is shorter than the feeding period. The COD balance gap for an evaluation period was calculated as follows:
 | (5) |
CODgas: COD in produced biogas in g (NL CH4/(350 NL CH4 per kg COD × 1000)
CODout: effluent total COD in g
CODin: influent total COD in g
c COD,DS: concentration of total COD in the digested sludge in g per L
V D: volume of digester in L
| Charge | SRTASP,T | Feeding/evaluation period | WAS | WASTH | ||||
|---|---|---|---|---|---|---|---|---|
| OLR | SMY | ΔCOD | OLR | SMY | ΔCOD | |||
| d | d | g COD per (L d) | NL CH4 per kg CODadded | % | g COD per (L d) | NL CH4 per kg CODadded | % | |
| a Feeding on a 5 d per week regime; values in brackets represent calculated organic loading rate (OLR) for feeding on a 7 d per week regime. | ||||||||
| 1 | 29 | 32/19 | 3.1 ± 0.05 | 120.2 | −5.5 | 3.1 ± 0.06 | 156.7 | −11.9 |
| 2 | 26 | 30/19 | 3.2 ± 0.02 | 127.3 | 4.4 | 3.2 ± 0.01 | 162.6 | −1.7 |
| 3 | 26 | 29/6 | 2.3 ± 0.02 | 121.3 | 4.6 | 2.2 ± 0.01 | 159.5 | −6.0 |
| 4 | 37 | 27/21 | 2.8 ± 0.02 | 113.2 | 1.4 | 3.0 ± 0.02 | 148.8 | −5.9 |
| 5 | 38 | 11/11 | 2.7 ± 0.01 | 117.4 | 9.3 | 2.7 ± 0.01 | 166.3 | 2.0 |
| 6 | 39 | 24/24 | 2.8 ± 0.02 | 110.3 | −10.3 | 2.8 ± 0.01 | 159.9 | −6.9 |
| 7 | 53 | 18/18 | 3.1 ± 0.11 | 102.9 | 4.4 | 3.1 ± 0.09 | 149.1 | −7.7 |
| 8 | 46 | 17/17 | 3.0 ± 0.02 | 111.6 | −16.9 | 3.0 ± 0.13 | 158.0 | −6.5 |
| 9 | 48 | 14/14 | 3.0 ± 0.02 | 108.9 | −3.0 | 2.9 ± 0.02 | 157.6 | −1.0 |
| 10 | 48 | 14/14 | 4.1 ± 0.07 (2.9)a | 106.5 | 3.5 | 4.1 ± 0.02 (2.9)a | 159.3 | 9.6 |
| 11 | 50 | 14/14 | 4.5 ± 0.03 (3.2)a | 99.3 | −4.1 | 4.5 ± 0.02 (3.2)a | 149.4 | −11.4 |
| 12 | 49 | 14/14 | 4.1 ± 0.02 (3.0)a | 101.4 | −11.8 | 4.2 ± 0.02 (3.0)a | 144.7 | −15.6 |
| 13 | 51 | 14/14 | 3.7 ± 0.03 (2.7)a | 103.2 | −0.5 | 3.8 ± 0.02 (2.7)a | 153.7 | −10.7 |
| 14 | 60 | 14/14 | 1.9 ± 0.02 | 107.1 | −3.5 | 1.9 ± 0.01 | 154.6 | −11.6 |
| 15 | 46 | 14/14 | 2.9 ± 0.02 | 92.6 | 2.2 | 2.9 ± 0.01 | 145.1 | −1.2 |
| 16 | 31 | 14/14 | 2.7 ± 0.02 | 116.4 | −10.7 | 2.7 ± 0.01 | 152.6 | −7.8 |
During anaerobic degradation, especially in combination with thermal hydrolysis, compounds like CODs, NH4-N, and PO4-P are released from organic matter. To compare the liquor qualities of the digesters, the average specific release of CODs, NH4-N and PO4-P was calculated over the entire experimental trial:
 | (6) |
Q out: effluent flow rate in L d−1
c x: concentration of compound x (CODs, NH4-N, PO4-P) in the effluent in g L−1
m: duration of complete experimental trial
2.5. Biomethane potential tests
Biomethane potential (BMP) batch tests were conducted according to Holliger et al.31 and VDI 4630.27 Digested sludge for inoculation was degassed at temperatures around 37 °C to ensure low endogenous methane production of <50 NL CH4 per kg VS. Test bottles were flushed with nitrogen prior to incubation. BMP tests were conducted at 37 °C in triplicate until daily methane production was less than 1% of the total methane volume. The automated methane potential test system (AMPTS II, BPC Instruments AB, Sweden) was used.2.6. Determining the effect of thermal pretreatment on viable and non-viable cells
For determining the fraction of viable and non-viable cells, the LIVE/DEAD BacLight bacterial viability kit (L-7012, Molecular Probes) was used. The BacLight bacterial viability kit consists of green fluorescent nucleic acid stain SYTO 9 and red fluorescent nucleic acid stain propidium iodide (PI). SYTO 9 dyes all bacteria with intact and damaged membranes, whereas PI dyes only bacteria with damaged membranes. Therefore, viable cells with intact membranes dye green, and non-viable cells with damaged membranes dye red. One WAS sample of WWTP_A and WWTP_B and the corresponding thermal hydrolyzed sludge samples at different treatment temperatures (120 °C, 140 °C, and 160 °C) were used to determine the viable and non-viable cells. After dilution, samples were analyzed in triplicate using a microplate reader (Tecan Spark, Switzerland). The fluorescence intensity (FI) of viable and non-viable cells of WASTH was compared to that of the original WAS samples to evaluate the effect of thermal hydrolysis on viable and non-viable cells. Lower FI would indicate a higher reduction of viable and non-viable cells due to thermal hydrolysis. The reduction of FI for viable and non-viable cells is calculated by: | (7) |
FIWASTH: mean value of WASTH (viable/non-viable cells) in RFU
FIWAS: mean value of WAS (viable/non-viable cells) in RFU
In brief, in this study, viable cells correspond to active biomass (XH).
2.7. Statistical analysis
Microsoft Excel was used to tabulate data and perform analysis of variance (ANOVA) for linear regression. The 95% confidence interval and the Pearson correlation coefficient (r) were calculated to evaluate the result of the linear regression. The use of standard deviation for the semi-continuous experiments is not reasonable due to temporary feeding 5 days a week.3. Results and discussion
3.1. Impact of thermal hydrolysis on WAS – preliminary experiments
To investigate the impact of thermal hydrolysis, one WAS sample each from WWTP_A (WAS_A) and WWTP_B (WAS_B) was investigated. Fig. 1 shows the impact of thermal hydrolysis on the reduction of viable and non-viable cells as well as on SCOD,g and SMY. As expected, at treatment temperatures of 120 °C, the FI of viable cells decreased by 95.2% and 93.3% for WAS_A and WAS_B, respectively. Therefore, thermal hydrolysis destroyed nearly all viable cells at 120 °C. Furthermore, the FI of non-viable cells decreased by 89.2% and 83.0% for WAS_A and WAS_B, indicating further disintegration of already damaged cells (e.g. endogenous residues) due to thermal hydrolysis at 120 °C. Higher temperatures (140 °C, 160 °C) led only to a slight further reduction of FI for viable and non-viable cells. At the same time, particulate organic components continued to break down as SCOD,g increased by 23.8% at 120 °C, 28.8% at 140 °C, and 36.9% at 160 °C for WAS_A. This was accompanied by an increase in BMP of 21.5%, 34.5%, and 37.4%, respectively. For WAS_B, SCOD,g increased from 17.0% at 120 °C to 31.3% at 160 °C. However, in contrast to WAS_A, the relative increase in BMP was in a similar range, with 11.0% and 10.1% for both temperatures. Although SCOD,g at 160 °C was in a similar range of 36.9% and 31.3% for both sludges, WAS_A showed a higher increase in BMP due to thermal hydrolysis. Accordingly, the level of SCOD,g has only limited informative value with respect to the increase in BMP induced by thermal hydrolysis for different WAS samples, as also reported by Carlsson et al.20 In addition, thermal hydrolysis accelerated the methane production rate for both WAS samples. The same amount of methane could be produced in a shorter time compared to the untreated WAS.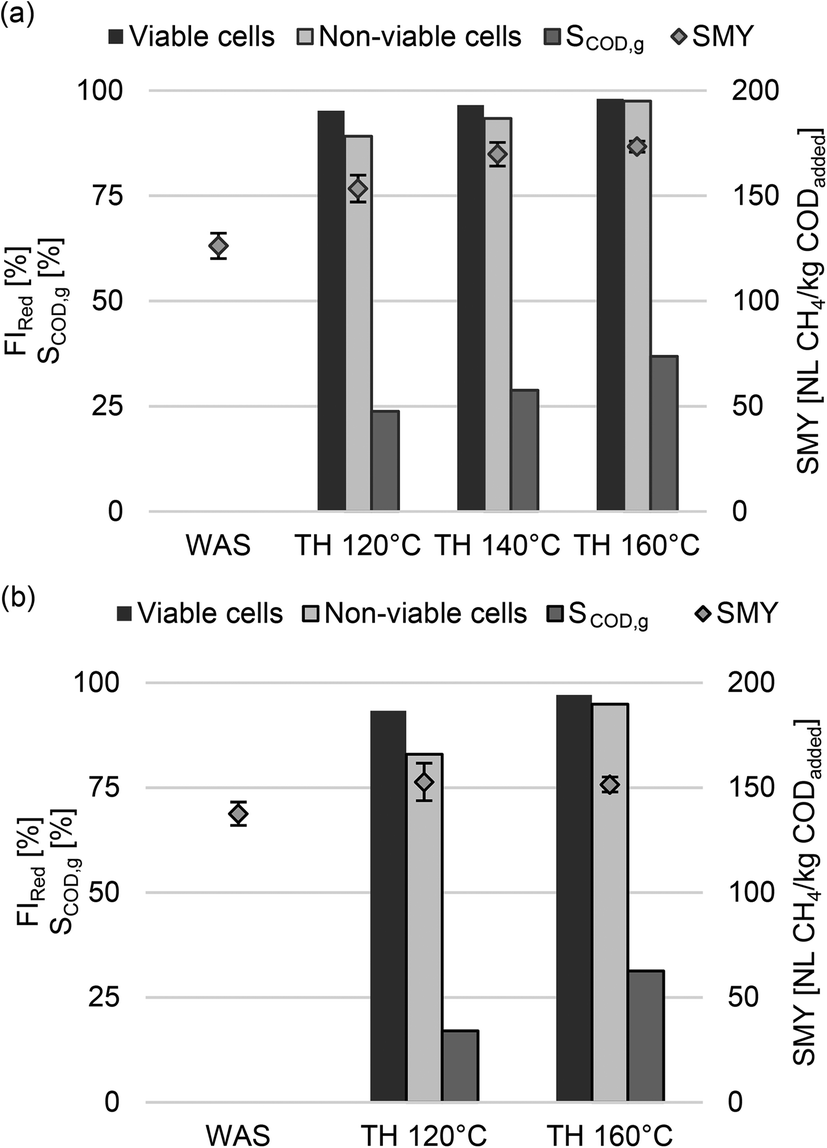 | ||
| Fig. 1 Impact of thermal hydrolysis (TH) on reduction of viable/non-viable cells, SCOD,g, and SMY at different temperatures for WAS_A (a) and WAS_B (b). | ||
Increase in BMP of WAS by thermal hydrolysis depends on the composition of the WAS. In brief, WAS consists of active biomass (mainly active heterotrophic biomass XH and a few nitrifying autotrophic biomass XA), inactive organic fractions like endogenous residues (XU,E), inert components from the influent wastewater (XU,inf), and inactive mineral fractions.32 According to several studies, the fraction XH is mainly anaerobic biodegradable while XU,E and XU,inf remain largely unaffected1,4,33,34 or have slow degradation rates (<0.012 d−1),35–37 which come into effect for aerobic and anaerobic systems operated at long SRTs. The results of this study show that almost all viable cells (i.e. the active biomass) and non-viable cells (e.g. endogenous residues) were disintegrated at a pretreatment temperature of 120 °C. For WAS_A, SCOD,g and BMP continued to increase at higher pretreatment temperatures. Accordingly, in addition to XH, hardly or non-biodegradable components of WAS_A were made more bioavailable for anaerobic degradation by thermal hydrolysis. This finding is consistent with the results of other authors. Phothilangka et al.38 investigated the effect of thermal hydrolysis on WAS from different WWTPs in continuous anaerobic experiments and used the anaerobic digestion model no.1 for a systematic analysis of the experimental monitoring data. They concluded that while XU,inf is hardly converted, XU,E is broken down by thermal hydrolysis and becomes biodegradable. By generating WAS from synthetic wastewater (no XU,inf), Jo et al.39 showed that endogenous residues become more bioavailable due to thermal hydrolysis for anaerobic digestion. Furthermore, they discussed that thermal hydrolysis increased the decay rate of endogenous products. With increasing SRTASP, more XH is degraded due to endogenous respiration, while XU,E is produced and accumulates in the ASP together with XU,inf. Accordingly, increasing the SRTASP results in an increasingly stabilized WAS which is expected to lead to a higher increase in biodegradability induced by thermal hydrolysis.
However, detailed information on the ASP such as SRTASP is often missing, and thus comparing the results of the conducted batch tests with other studies is difficult. Fig. 2 summarizes the results of different studies11,13,20,40,41 on increasing biodegradability of WAS by thermal treatment at 160–170 °C. As a reference parameter, the initial biodegradability is used as an indicator of the stabilization of the WAS. As can be seen, the initial biodegradability of WAS_A and WAS_B was in a similar range to the results of Lensch40 and Toutian et al.13 However, the increase in biodegradability for WAS_A was higher compared to these studies. In particular, the results of Carrère et al.,11 Carlsson et al.,20 and Mottet et al.41 indicate that the relative increase in biodegradability depends on initial biodegradability. Assuming that high initial biodegradability corresponds to low stabilization of WAS in the ASP (low SRTASP) and vice versa, this indicates that the efficacy of thermal hydrolysis depends on the SRTASP. However, considering all results summarized in Fig. 2, no clear trend can be identified for various single sludge samples. The SRTASP was available in only one study20 and was 1–3 d. Here, thermal hydrolysis did not increase the biodegradability of the WAS (−2% and −6%). The SRTASP of WWTP_A was 22 d and that of WWTP_B was 15 d. Higher increase in biodegradability corresponds to higher SRTASP. However, no clear conclusion can be drawn. Therefore, the following results of the long-term study provide a more detailed view of this relationship.
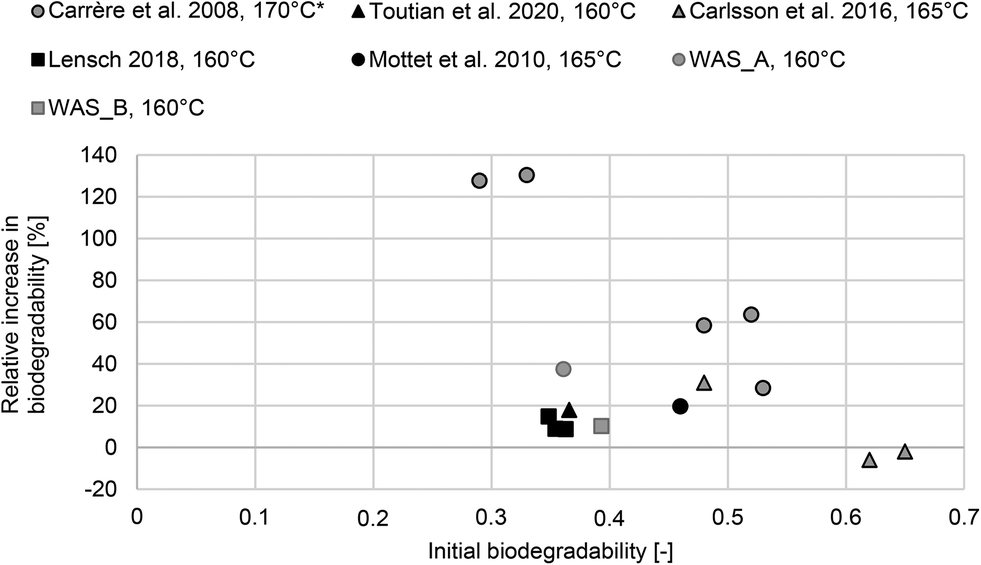 | ||
| Fig. 2 Summary of the relative increase in biodegradability due to thermal hydrolysis (150–170 °C) depending on initial biodegradability of WAS.11,13,20,40,41 Only results based on batch tests were considered. If not stated in the original study, initial biodegradability was calculated by dividing the presented results for BMP (NL CH4 per kg CODadded) by the theoretical methane production of 350 NL CH4 per kg CODadded. *Biodegradability of thermal hydrolyzed WAS (sludge A–E) read from Fig. 2 in Carrère et al.11 | ||
3.2. Influence of the ASP on the SMY of WAS and WASTH – long-term study
Fig. 3 shows the course of SRTASP and TASP for WWTP_A over one year. It can be seen that WWTP_A rarely worked in the steady state as SRTASP and TASP fluctuated within one year. In particular, TASP showed considerable seasonal fluctuations between 12 °C in winter and 22 °C in summer. Furthermore, SRTASP was controlled independently of the prevailing temperature conditions and ranged from 19 d to 35 d. Variations in SRTASP and TASP directly influenced downstream processes like anaerobic digestion. In the semi-continuous anaerobic digestion experiments on a laboratory scale, SMY varied between 93 NL CH4 per kg CODadded and 127 NL CH4 per kg CODadded (Fig. 3). | ||
| Fig. 3 Moving average values of SRTASP, TASP, and SRTASP,T over 25 d based on operating data from WWTP_A and SMY of WAS for the conducted semi-continuous anaerobic experiments on laboratory scale. | ||
As mentioned before, the specific biogas and methane yield of WAS depends on SRTASP. As SRTASP increases, XH decreases due to endogenous respiration, and therefore specific biogas and methane yield decreases.1 A similar effect can be observed for TASP.4 However, no significant correlation was found between SRTASP and SMY. Accordingly, it is necessary to consider both parameters, SRTASP and TASP, to characterize the impact of the full-scale ASP adequately. As can be seen in Fig. 3, SRTASP,T accounts for seasonal variations in temperature and ranged from 19 d in winter up to 60 d in summer. Relating the SMY to SRTASP,T leads to a significant correlation (p < 0.01) with a moderate coefficient of determination (R2 = 0.6), cf.Fig. 4. The 95% confidence interval and the Pearson correlation coefficient (r = −0.8) also support a clear negative correlation. The results confirm that the parameter SRTASP,T is suitable to adequately describe the impact of the ASP on the SMY of WAS: with increasing SRTASP,T from 26 d to 60 d, the SMY of WAS decreased by 20.1% as a result of endogenous respiration. In contrast to other studies investigating specific biogas/methane production depending on SRTASP,1,3 linear regression for the investigated range of SRTASP,T appears to be sufficient. However, the shown correlation underestimates the SMY for lower and higher SRTASP,T.
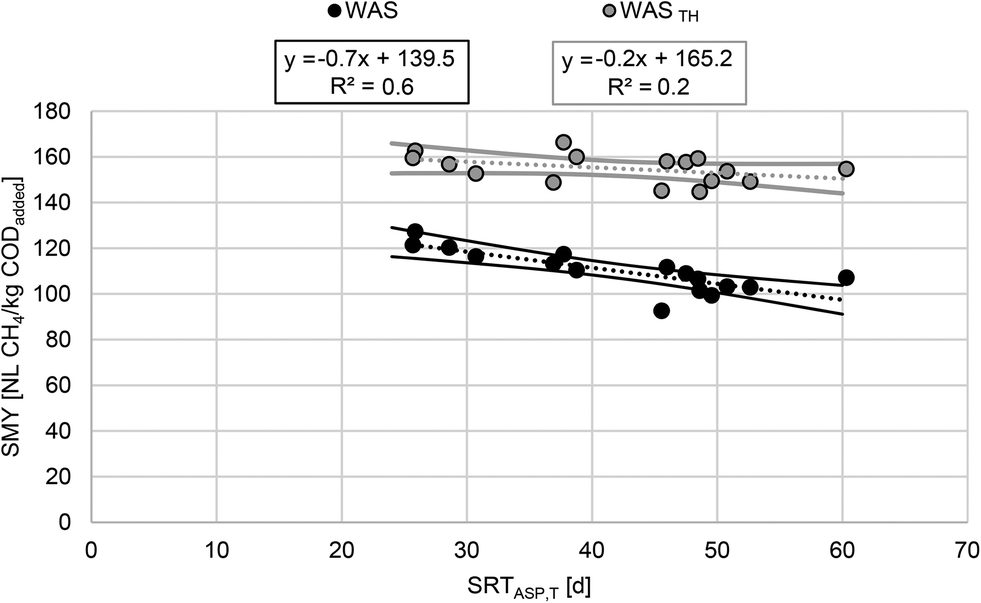 | ||
| Fig. 4 SMY of WAS (n = 16) and WASTH (n = 16) for the conducted semi-continuous anaerobic experiments depending on SRTASP,T from WWTP_A. Solid lines represent a 95% confidence interval. | ||
Thermal hydrolysis broke down but did not remove organic matter, resulting in solubilization of COD and increased SMY. SCOD,g was 39.4 ± 1.6% and showed no dependence on SRTASP,T. Compared to WAS, results of SMY for WASTH show no significance (p = 0.12) and only a weak linear correlation (R2 = 0.2, r = −0.4) to SRTASP,T (Fig. 4). According to the 95% confidence interval, neither a clear negative nor a clear positive trend was found. In contrast, Batstone et al.42 found a significant relation for anaerobic biodegradability of WASTH (165 °C) at high SRTASP >20 d: with increasing SRTASP the biodegradability of WASTH decreased. The performance of the digesters in terms of SMY and COD balance gap (ΔCOD) are summarized in Table 2.
As can be seen in Fig. 4, thermal hydrolysis significantly increases the SMY of WAS. Furthermore, the relative increase in SMY correlates significantly (p < 0.01, R2 = 0.6, r = 0.8) with SRTASP,T (cf.Fig. 5). As discussed before, higher SRTASP,T leads to higher shares of hardly degradable and inert components. These components were partially made bioavailable for anaerobic digestion by thermal hydrolysis, which is evidenced by the shown correlation. Using the presented correlation, the SMY of WAS due to thermal hydrolysis increased by 31% for an SRTASP,T of 26 d and by 53% for an SRTASP,T of 60 d. This implicates that the SMY of WAS, which originates from an ASP with low SRTASP,T and thus consists of a low share of XU,E and XU,inf, is only slightly increased by thermal hydrolysis. This is supported by the results of Carlsson et al.20 For WAS that originated from an ASP with an SRTASP of 1–3 d, the BMP of WAS was not increased by thermal hydrolysis. The values presented in Fig. 5 are valid for the conducted experiments but potentially underestimate the relative increase in SMY of raw WAS due to the storing conditions (freeze and thaw). The results of the conducted long-term study confirm that the efficacy of thermal hydrolysis in terms of SMY depends on the operating conditions of the ASP and that SRTASP,T is suited to describe this dependency.
 | ||
| Fig. 5 Relative increase in SMY due to thermal hydrolysis of WAS depending on SRTASP,T for the conducted semi-continuous experiments in lab scale. Dashed lines represent a 95% confidence interval. | ||
Examining the impact of alkaline thermal pretreatment on a blend of PS and WAS, Toutian et al.43 observed that the relative increase in specific biogas production due to pretreatment increased with increasing TASP. They concluded that the efficacy of alkaline thermal pretreatment in terms of biogas production increases the higher the shares of non-biodegradable components in WAS. This indicates a comparable relation as presented in this study.
3.3. Sludge liquor quality and process stability
Compared to digester A (fed with WAS), the mean concentration over the entire experimental trial of CODs, NH4-N, and PO4-P in digester B (fed with WASTH) increased by 351%, 42%, and 23%, respectively (Table 3). The relative increase in NH4-N corresponds to the relative increase in SMY for the respective evaluation period. Furthermore, by referring the mean concentrations of NH4-N and PO4-P to the degraded CODt (eqn (6)), it can be seen that the average specific release (SR) of NH4-N and PO4-P for digesters A and B are comparable. Accordingly, the increase in NH4-N and PO4-P of digester B was mainly attributable to the increased degradation of organic matter. In contrast, SR of CODs increased by 218%, indicating that partially recalcitrant components were formed during thermal hydrolysis, which can be attributed to the Maillard reaction.15 Higher concentrations in return liquor must be considered as an additional load for the main- or side-stream treatment. In particular, recalcitrant CODs can lead to an increase of CODs in the effluent of WWTPs.13 Furthermore, high concentrations of ammonia lead to possible inhibition, resulting in lower methane production and often in accumulation of VFAs.44 In this study, a stable process was reached for each digester. Mean concentrations of VFAs in digester A and B were 165 ± 68 mgHAc L−1 and 668 ± 200 mgHAc L−1, respectively, while pH ranged between 7.1 and 7.7 in both digesters. Inhibitory effects were not investigated.| Parameter | Digested sludge | CODs | NH4-N | PO4-P |
|---|---|---|---|---|
| a Arithmetic mean ± standard deviation over the entire experimental trial except for charge 3 and 12 due to missing analytic. | ||||
| Concentration [mg L−1]a | WAS | 736 ± 166 | 1230 ± 191 | 238 ± 53 |
| WASTH | 3322 ± 544 | 1750 ± 214 | 291 ± 65 | |
| SR [mg per g CODdeg] | WAS | 40.8 | 68.1 | 13.2 |
| WASTH | 129.6 | 68.3 | 11.4 | |
4. Conclusions
The parameter SRTASP,T adequately describes the impact of the ASP on the anaerobic biodegradability of WAS in terms of SMY. Although no such correlation was found for WASTH, the relative increase in SMY due to thermal hydrolysis correlates significantly with SRTASP,T. Accordingly, the results of the conducted long-term study confirm that the efficacy of thermal hydrolysis in terms of relative increase in SMY depends on the operating conditions of the ASP and that SRTASP,T is suited to describe this dependency: as SRTASP,T increased from 26 d to 60 d, the increase in SMY induced by thermal hydrolysis was boosted from 31% to 53%. In addition to the active organic fraction (XH), hardly or non-biodegradable components of WAS, such as endogenous residues, were made partially bioavailable for anaerobic biodegradation by thermal hydrolysis. As these fractions depend on SRTASP,T, the use of SRTASP,T as a reference parameter can contribute to improve the comparability of future studies focusing on treating WAS by thermal hydrolysis. To increase the data basis, the authors recommend providing more information on the ASP and to consider especially the parameter SRTASP,T in future studies.According to this study, the operation of thermal hydrolysis for increasing the SMY of WAS is especially suitable for high SRTASP,T. Normalized SRTASP,T can be used beneficially to assess the potential relative increase in SMY induced by thermal hydrolysis. However, in a full-scale application the influence of additional anaerobic digestion of PS needs to be evaluated in detail. This consideration is the subject of a current study.
Abbreviations
| ΔCOD | Balance gap in chemical oxygen demand |
| AD | Anaerobic digestion |
| ASP | Activated sludge process |
| BMP | Biomethane potential |
| COD | Chemical oxygen demand |
| CODt | Total chemical oxygen demand |
| CODs | Soluble chemical oxygen demand |
| DS | Digested sludge |
| FI | Fluorescence intensity of viable and non-viable cells |
| FIRed | Reduction in fluorescence intensity |
| NH4-N | Ammonium as nitrogen |
| PO4-P | Orthophosphate as phosphorus |
| PS | Primary sludge |
| r | Pearson correlation coefficient |
| S COD | COD solubilization |
| SMY | Specific methane yield |
| SR | Specific release of soluble components |
| SRTASP | Solids retention time in the activated sludge process |
| SRTASP,T | Temperature-normalized solids retention time in the ASP |
| SRTDig | Solids retention time in anaerobic digester |
| T ASP | Temperature in the activated sludge process |
| TS | Total solids |
| VFA | Volatile fatty acids |
| VS | Volatile solids |
| WAS | Waste activated sludge |
| WASTH | Thermal hydrolyzed waste activated sludge |
| WWTP | Wastewater treatment plant |
| XA | Autotrophic biomass |
| XH | Heterotrophic biomass |
| XU,E | Endogenous particulate residues |
| XU,inf | Non-biodegradable particulate organic matter from the influent |
Author contributions
Conceptualization, J. R. and M. E.; data curation, J.R.; formal analysis, J. R.; funding acquisition, M. E.; investigation, J. R.; methodology, J. R.; project administration, M. E.; resources, M. E. and S. A.; supervision, M. E.; visualization, J. R.; writing – original draft, J. R.; writing – review & editing, M. E. and S. A.Conflicts of interest
There are no conflicts to declare.Acknowledgements
This work was funded by the German Federal Ministry of Education and Research (BMBF) within the framework of the project “ESiTI”, grant number 02WER1322.References
- J. M. Gossett and R. L. Belser, Anaerobic digestion of waste activated sludge, J. Environ. Eng. Div., 1982, 108, 1101–1120 CrossRef CAS.
- L. de Souza Araújo, P. F. C. Catunda and A. van Haandel, Biological sludge stabilisation Part 2: Influence of the composition of waste activated sludge on anaerobic stabilisation, Water SA, 1998, 24, 231–236 Search PubMed.
- D. Bolzonella, P. Pavan, P. Battistoni and F. Cecchi, Mesophilic anaerobic digestion of waste activated sludge: influence of the solid retention time in the wastewater treatment process, Process Biochem., 2005, 40, 1453–1460 CrossRef CAS.
- N. M. Hai, S. Sakamoto, V. C. Le, H. S. Kim, R. Goel, M. Terashima and H. Yasui, A modified anaerobic digestion process with chemical sludge pre-treatment and its modelling, Water Sci. Technol., 2014, 69, 2350–2356 CrossRef CAS PubMed.
- H. Carrère, G. Antonopoulou, R. Affes, F. Passos, A. Battimelli, G. Lyberatos and I. Ferrer, Review of feedstock pretreatment strategies for improved anaerobic digestion: From lab-scale research to full-scale application, Bioresour. Technol., 2016, 199, 386–397 CrossRef PubMed.
- M. Carlsson, A. Lagerkvist and F. Morgan-Sagastume, The effects of substrate pre-treatment on anaerobic digestion systems: A review, Waste Manage., 2012, 32, 1634–1650 CrossRef CAS PubMed.
- G. Zhen, X. Lu, H. Kato, Y. Zhao and Y.-Y. Li, Overview of pretreatment strategies for enhancing sewage sludge disintegration and subsequent anaerobic digestion: Current advances, full-scale application and future perspectives, Renewable Sustainable Energy Rev., 2017, 69, 559–577 CrossRef CAS.
- C. Bougrier, J. P. Delgenès and H. Carrère, Effects of thermal treatments on five different waste activated sludge samples solubilisation, physical properties and anaerobic digestion, Chem. Eng. J., 2008, 139, 236–244 CrossRef CAS.
- A. Donoso-Bravo, S. Pérez-Elvira, E. Aymerich and F. Fdz-Polanco, Assessment of the influence of thermal pre-treatment time on the macromolecular composition and anaerobic biodegradability of sewage sludge, Bioresour. Technol., 2011, 102, 660–666 CrossRef CAS PubMed.
- W. P. F. Barber, Thermal hydrolysis for sewage treatment: A critical review, Water Res., 2016, 104, 53–71 CrossRef CAS.
- H. Carrère, C. Bougrier, D. Castets and J. P. Delgenes, Impact of initial biodegradability on sludge anaerobic digestion enhancement by thermal pretreatment, J. Environ. Sci. Health, Part A: Toxic/Hazard. Subst. Environ. Eng., 2008, 43, 1551–1555 CrossRef PubMed.
- I. Sapkaite, E. Barrado, F. Fdz-Polanco and S. I. Pérez-Elvira, Optimization of a thermal hydrolysis process for sludge pre-treatment, J. Environ. Manage., 2017, 192, 25–30 CrossRef CAS.
- V. Toutian, M. Barjenbruch, T. Unger, C. Loderer and C. Remy, Effect of temperature on biogas yield increase and formation of refractory COD during thermal hydrolysis of waste activated sludge, Water Res., 2020, 171, 115383 CrossRef CAS PubMed.
- J. Pinnekamp, Effects of thermal pretreatment of sewage sludge on anaerobic digestion, Water Sci. Technol., 1989, 21, 97–108 CrossRef CAS.
- J. Dwyer, D. Starrenburg, S. Tait, K. Barr, D. J. Batstone and P. Lant, Decreasing activated sludge thermal hydrolysis temperature reduces product colour, without decreasing degradability, Water Res., 2008, 42, 4699–4709 CrossRef CAS.
- D. C. Stuckey and P. L. McCarty, The effect of thermal pretreatment on the anaerobic biodegradability and toxicity of waste activated sludge, Water Res., 1984, 18, 1343–1353 CrossRef CAS.
- R. T. Haug, D. C. Stuckey, J. M. Gossett and P. L. McCarty, Effect of thermal pretreatment on digestibility and dewaterability of organic sludges, J. - Water Pollut. Control Fed., 1978, 50, 73–85 CAS.
- S. I. Pérez-Elvira, F. Fernández-Polanco, M. Fernández-Polanco, P. Rodríguez and P. Rouge, Hydrothermal multivariable approach. Full-scale feasibility study, Electron. J. Biotechnol., 2008, 11, 14 Search PubMed.
- A. Donoso-Bravo, S. I. Pérez-Elvira and F. Fdz-Polanco, Application of simplified models for anaerobic biodegradability tests. Evaluation of pre-treatment processes, Chem. Eng. J., 2010, 160, 607–614 CrossRef CAS.
- M. Carlsson, A. Lagerkvist and F. Morgan-Sagastume, Energy balance performance of municipal wastewater treatment systems considering sludge anaerobic biodegradability and biogas utilisation routes, J. Environ. Chem. Eng., 2016, 4, 4680–4689 CrossRef CAS.
- Metcalf & Eddy Inc., G. Tchobanoglous, D. Stensel, R. Tsuchihashi, F. Burton, M. Abu-Orf and G. Bowden, Wastewater Engineering: Treatment and Resource Recovery, McGraw-Hill Education, New York, 5th edn, 2014 Search PubMed.
- D. A. Vaccari, A. Cooper and C. Christodoulatos, Feedback control of activated sludge waste rate, J. - Water Pollut. Control Fed., 1988, 60, 1979–1985 CAS.
- I. Takács, Experiments in Activated Sludge Modelling, PhD Thesis, Ghent University, Belgium, 2008 Search PubMed.
- M. Clara, N. Kreuzinger, B. Strenn, O. Gans and H. Kroiss, The solids retention time-a suitable design parameter to evaluate the capacity of wastewater treatment plants to remove micropollutants, Water Res., 2005, 39, 97–106 CrossRef CAS PubMed.
- DWA, Standard DWA-A-131E – Dimensioning of Single-stage Activated Sludge Plants – June 2016, German Association for Water, Wastewater and Waste (DWA), Hennef, 2022 Search PubMed.
- H. Kapp, Schlammfaulung mit hohem Feststoffgehalt, Stuttgarter Berichte zur Siedlungswasserwirtschaft 86, Forschungs- und Entwicklungsinstitut für Industrie- und Siedlungswasserwirtschaft sowie Abfallwirtschaft e. V. Stuttgart, Kommissionsverlag R. Oldenbourg, München, 1984 Search PubMed.
- VDI 4630:2016-11, Vergärung organischer Stoffe – Substratcharakterisierung, Probenahme, Stoffdatenerhebung, Gärversuche (Fermentation of organic materials – Characterisation of the substrate, sampling, collection of material data, fermentation tests), Verein Deutscher Ingenieure e.V. (VDI), Düsseldorf, Beuth Verlag GmbH, Berlin, 2016 Search PubMed.
- DIN EN 12880:2001-02, Characterization of sludges - Determination of dry residue and water content; German version EN 12880:2000 Search PubMed.
- DIN EN 15935:2012-11, Sludge, treated biowaste, soil and waste - Determination of loss on ignition; German version EN 15935:2012 Search PubMed.
- DIN 38414-9:1986-09, German standard methods for the examination of water, waste water and sludge; sludge and sediments (group S); determination of the chemical oxygen demand (COD) (S 9) Search PubMed.
- C. Holliger, M. Alves, D. Andrade, I. Angelidaki, S. Astals, U. Baier, C. Bougrier, P. Buffiere, M. Carballa, V. de Wilde, F. Ebertseder, B. Fernandez, E. Ficara, I. Fotidis, J. C. Frigon, H. F. de Laclos, D. S. Ghasimi, G. Hack, M. Hartel, J. Heerenklage, I. S. Horvath, P. Jenicek, K. Koch, J. Krautwald, J. Lizasoain, J. Liu, L. Mosberger, M. Nistor, H. Oechsner, J. V. Oliveira, M. Paterson, A. Pauss, S. Pommier, I. Porqueddu, F. Raposo, T. Ribeiro, F. Rusch Pfund, S. Stromberg, M. Torrijos, M. van Eekert, J. van Lier, H. Wedwitschka and I. Wierinck, Towards a standardization of biomethane potential tests, Water Sci. Technol., 2016, 74, 2515–2522 CrossRef CAS PubMed.
- M. Spérandio, E. Paul, Y. Bessière and Y. Liu, Sludge production: Quantification and prediction for urban treatment plants and assessment of strategies for sludge reduction, in Biological sludge minimization and biomaterials/bioenergy recovery technologies, ed. E. Paul and Y. Liu, John Wiley Sons, Inc., Hoboken, N.J., 2012, pp. 81–116 Search PubMed.
- G. A. Ekama, S. W. Sotemann and M. C. Wentzel, Biodegradability of activated sludge organics under anaerobic conditions, Water Res., 2007, 41, 244–252 CrossRef CAS PubMed.
- D. S. Ikumi, T. H. Harding and G. A. Ekama, Biodegradability of wastewater and activated sludge organics in anaerobic digestion, Water Res., 2014, 56, 267–279 CrossRef CAS.
- R. Jones, W. Parker, H. Zhu, D. Houweling and S. Murthy, Predicting the degradability of waste activated sludge, Water Environ. Res., 2009, 81, 765–771 CrossRef CAS PubMed.
- A. Ramdani, P. Dold, S. Déléris, D. Lamarre, A. Gadbois and Y. Comeau, Biodegradation of the endogenous residue of activated sludge, Water Res., 2010, 44, 2179–2188 CrossRef CAS PubMed.
- J. Habermacher, A. D. Benetti, N. Derlon and E. Morgenroth, Degradation of the unbiodegradable particulate fraction (XU) from different activated sludges during batch digestion tests at ambient temperature, Water Res., 2016, 98, 206–214 CrossRef CAS PubMed.
- P. Phothilangka, M. A. Schoen, M. Huber, P. Luchetta, T. Winkler and B. Wett, Prediction of thermal hydrolysis pretreatment on anaerobic digestion of waste activated sludge, Water Sci. Technol., 2008, 58, 1467–1473 CrossRef CAS PubMed.
- H. B. Jo, W. Parker and P. Kianmehr, Comparison of the impacts of thermal pretreatment on waste activated sludge using aerobic and anaerobic digestion, Water Sci. Technol., 2018, 78, 1772–1781 CrossRef CAS PubMed.
- S. D. Lensch, Möglichkeiten der Intensivierung der Klärschlammfaulung durch Prozessoptimierung und Vorbehandlung, Dissertation, Schriftenreihe IWAR 241, Verein zur Förderung des Institutes IWAR der TU Darmstadt e.V., Darmstadt, 2018 Search PubMed.
- A. Mottet, E. François, E. Latrille, J. P. Steyer, S. Déléris, F. Vedrenne and H. Carrère, Estimating anaerobic biodegradability indicators for waste activated sludge, Chem. Eng. J., 2010, 160, 488–496 CrossRef CAS.
- D. J. Batstone, S. Tait and D. Starrenburg, Estimation of hydrolysis parameters in full-scale anerobic digesters, Biotechnol. Bioeng., 2009, 102, 1513–1520 CrossRef CAS PubMed.
- V. Toutian, M. Barjenbruch, C. Loderer and C. Remy, Pilot study of thermal alkaline pretreatment of waste activated sludge: Seasonal effects on anaerobic digestion and impact on dewaterability and refractory COD, Water Res., 2020, 182, 115910 CrossRef CAS PubMed.
- Y. Chen, J. J. Cheng and K. S. Creamer, Inhibition of anaerobic digestion process: a review, Bioresour. Technol., 2008, 99, 4044–4064 CrossRef CAS PubMed.
| This journal is © The Royal Society of Chemistry 2022 |