
 Open Access Article
 This Open Access Article is licensed under a
 Creative Commons Attribution 3.0 Unported Licence
Application of plasma for the removal of pharmaceuticals in synthetic urine†
Enrique E.
Rodriguez
 a,
William A.
Tarpeh
b,
Krista R.
Wigginton
a and
Nancy G.
Love
*a
a,
William A.
Tarpeh
b,
Krista R.
Wigginton
a and
Nancy G.
Love
*a
aCivil and Environmental Engineering, University of Michigan, Ann Arbor, MI, USA. E-mail: nglove@umich.edu; Tel: +1 734 763 9664
bChemical Engineering, Stanford University, Stanford, CA, USA
First published on 14th January 2022
Abstract
Removal of pharmaceuticals in source-separated urine is an important step toward gaining acceptance of urine-derived fertilizers among important stakeholders such as consumers, farmers, and regulatory agencies. Advanced oxidation processes (AOPs) have been studied for the removal of pharmaceuticals in various complex matrices, including treated wastewaters. A complexity associated with AOP methods that rely primarily on hydroxyl radicals as the oxidizing agents is that they readily lose effectiveness in the presence of scavengers. Here, we investigated the potential for capturing the synergistic effects of producing multiple oxidative chemical species simultaneously in a plasma reactor to oxidize six pharmaceuticals (acetaminophen, atenolol, 17α-ethynyl estradiol, ibuprofen, naproxen, and sulfamethoxazole) in source-separated urine being processed into a fertilizer. The results show that the plasma reactor produced hydroxyl radicals as the primary oxidizing agent and the effects of other oxidizing species were minimal. Plasma experienced scavenging in both fresh and hydrolyzed urine; furthermore, it oxidized pharmaceuticals at similar rates across both matrices. Additionally, the negative impacts of electrical discharge formation stemming from increased solution conductivity appeared to plateau. The energy required per order of magnitude of pharmaceutical transformed was up to 2 orders of magnitude higher for plasma than for a traditional UV/H2O2 reactor and depended upon the matrix. Despite scavenging and energy concerns, plasma can oxidize pharmaceuticals in fresh and hydrolyzed urine and is worthy of further development for on-site or building-scale applications where the value of convenience, simplicity, and performance offsets energy efficiency concerns.
Water impactSeparating urine at the source has many potential benefits, including the production of sustainable fertilizers, reducing wastewater treatment costs, and mitigating eutrophication. Furthermore, the removal of pharmaceuticals from urine presents an opportunity to mitigate their release to the environment. Our study explores the application of plasma to degrade pharmaceuticals in urine prior to its use as a fertilizer. |
Introduction
Water resource recovery facilities (WRRFs, also known as wastewater treatment plants) invest heavily in advanced nutrient removal methods to mitigate the risks of eutrophication in surface waters, recycle nutrients,1,2 and combat the threat of dwindling global phosphorus reserves.3 Urine contains most of the nitrogen and phosphorus in domestic wastewater while composing less than 1% of the total volume.4 It can be processed centrally or at the point of collection using building-scale systems.5 Separating urine at the point of generation and forming urine-derived fertilizers can offset the energy and capital costs of nutrient removal at WRRFs6 and provide a concentrated, renewable stream of nutrients. Source-separated urine also produces a concentrated waste stream of pharmaceuticals that conventional wastewater treatment systems fail to fully address.7Studies on urine separation have typically examined decentralized, small- to medium-scale technologies for urine processing that represent a paradigm shift away from using solely large-scale, centralized wastewater treatment.8–11 Hybrid approaches that merge centralized and decentralized or building-scale systems that include urine separation and processing have been proposed as a viable option for future, sustainable urban living.12 Indeed, the use of urine separation and fertilizer production via community-scale systems to create a circular nutrient economy in high income countries has been demonstrated in Brattleboro, Vermont U.S.A. since 2012.13 Larsen et al. provide an in-depth analysis of source-separation and decentralization, touching on advantages, challenges, and required technologies.14,15 In that vein, our analysis of plasma as a technology is presented within the framework of a decentralized treatment scheme. It takes multiple treatment steps to create urine-derived fertilizers, with distinct steps addressing concerns such as concentration of nutrients, aesthetics management, and mitigating biological and chemical contaminants. For example, urine collected via a building-scale system at the University of Michigan is acidified to prevent scaling of pipes and odor complaints, concentrated through freeze/thaw to maximize nutrient recovery, pasteurized to remove biological contaminants, and passed through activated carbon to eliminate chemical contaminants.
Pharmaceuticals are important contaminants of concern because of their presence in human waste and their persistence in the environment.16 Among the options for removing persistent pharmaceuticals from treated wastewater, sorption-based processes and advanced oxidation processes (AOPs) are extremely common.17–19 Several studies have been published on the treatment of pharmaceuticals in a variety of matrices by conventional AOPs like UV/H2O2 and UV/ozone.20–23 These AOP methods rely upon the high oxidative potential of hydroxyl radicals to degrade micropollutants, however concerns of transformation products remain.24 Hydroxyl radicals often have second-order rate constants with organic compounds that are near the limit of diffusion, meaning they will degrade these compounds nearly as rapidly as they collide.25 However, the broad range of chemicals that hydroxyl radicals are able to rapidly degrade limits the selectivity of hydroxyl-radical-based AOPs.26 Reactive chemicals outside of the contaminants targeted for degradation (i.e., scavengers) limit the ability of conventional AOP treatments to degrade target pharmaceuticals and diminishes treatment efficiency. Furthermore, conventional AOP technologies are complex and require the storage of hazardous chemicals, which make it difficult to scale these methods for point-of-use applications. Urine treatment of pharmaceuticals requires managing issues with scavengers and finding options that can be scaled for on-site or building-scale application. Sorption has been used to remove pharmaceuticals from urine;19 however, it requires sorbent recharging and is vulnerable to matrix effects that compete for active sorption sites. We evaluated plasma as an alternative method to conventional AOPs because it generates oxidative radicals and other oxidative species without use or storage of hazardous chemicals.
Previous studies have shown that UV, H2O2, O3, H2, O2−, and several other reactive chemical species are formed by plasma.27–31 The generation of these species depends heavily on a wide set of factors that include (among others): reactor geometry, carrier gas, gas flow rate, type of power supply, frequency, voltage rise time, and liquid conductivity.32–34 In addition to the reasons given previously, the potential for leveraging the synergistic effects of multiple reactive chemical species makes plasma an appealing technology compared to conventional AOPs, which may not be suitable in complex matrices such as urine. Similar to other AOPs, plasma can also provide multiple treatment benefits by serving as a disinfectant35 and stabilizing ammonium by oxidizing it to nitrate.36 This would be beneficial for processing source-separated urine at the building-scale where micropollutant elimination, pathogen disinfection, and nutrient stabilization are major priorities for fertilizer production. However, several questions need to be answered to understand the full potential of plasma for treating urine. Studies that probe plasma as a water purification method commonly rely on dyes as a proxy for micropollutants to investigate the performance of plasmas.37–40 Consequently, the efficiency for degrading micropollutants in different matrices is largely unknown. Furthermore, it is unclear if radicals and oxidative species other than hydroxyl radical play significant roles in degrading compounds during plasma treatment.
Although there are multiple unit treatment processes for converting urine into useful products, management of pharmaceuticals in urine is understudied compared to nutrient recovery for urine treatment. This study aims to assess the performance of plasma AOP for oxidizing pharmaceuticals in fresh and hydrolyzed urine. To evaluate plasma, we applied a dielectric barrier discharge (DBD) plasma reactor in liquid using laboratory studies with a suite of pharmaceutical compounds rather than dyes. The likely oxidative mechanism responsible for degradation in the plasma reactor was identified by determining and comparing the kinetic rate of pharmaceutical loss of both a conventional UV/H2O2 reactor and the DBD plasma jet. Finally, the energy efficiency of both AOP methods employed during this study was assessed.
Materials and methods
Pharmaceutical compounds
Acetaminophen (Acros Organics; CAS #103-92-2; purity: 98%), atenolol (Acros Organics; CAS #29122-68-7; purity: 98%), 17α-ethynyl estradiol (Acros Organics; CAS #57-63-6; purity: 98%), ibuprofen (Acros Organics; CAS #15687-27-1; purity: 99%), naproxen (MP Biomedicals; CAS #22204-53-1; purity: 99%), and sulfamethoxazole (MP Biomedicals; CAS #723-46-6; purity: 99%) were used to prepare a 400 mg L−1 pharmaceutical cocktail in 25 mL of methanol (Certified ACS; Fisher Scientific; CAS #67-56-1; purity: 99.9%). Pharmaceutical physicochemical parameters are found in Table S1.† The pharmaceutical cocktail was stored in a −20 °C freezer in between experiments. Acetaminophen-d3, atenolol-d7, estradiol-2,4,6,16,16-d4, (S)-(+)-ibuprofen-d3, (S)-naproxen-d3, and sulfamethoxazole-d4 were all purchased from Toronto Research Chemicals. These deuterated standards were used to create a separate 10 mg L−1 super stock in 25 mL of methanol. The deuterated standard super stock was also stored in a −20 °C freezer in between experiments.Synthetic urine preparation
The synthetic urine recipes for both fresh and hydrolyzed urine are provided in Table S2† and are based on previous studies.41,42 Fresh urine is urine collected shortly after an excretion event, or preserved through acid addition. If no acid is added, fresh urine will eventually become hydrolyzed urine due to the urea hydrolysis process which converts urea to ammonia. Prior to each experiment, a 1 L batch of each synthetic urine was prepared. Conductivity and pH were measured using respective probes at the time of preparation and are outlined in Table S3† for each matrix. The UV transmittance and alkalinity of each matrix was determined and is also outlined in Table S3.†Comparative UV/H2O2 experiments
The UV/H2O2 experiments were carried out with six pharmaceuticals in nanopure water, synthetic fresh urine, and synthetic hydrolyzed urine. Experimental pharmaceutical solutions made in nanopure water or the synthetic urines were prepared by spiking the pharmaceutical cocktail stocks to achieve concentrations of 1 mg L−1 that are typical of concentrations in undiluted urine. Additionally, H2O2 (Fisher Chemical; CAS #7722-81-1) stocks were spiked to achieve a concentration of 20 mg L−1 in the experimental solution (nanopure water or synthetic urine). We used this concentration of H2O2 since it is the saturation concentration for maximized production of hydroxyl radicals.43 Prior to treatment, initial samples with pharmaceuticals (1.41 mL) were placed in 2 mL screw top vials. The experimental solutions were exposed to a low-pressure ultraviolet lamp in a collimated beam at a fluence rate of 0.54 mW cm−2 (Phillips Inc. #TUV PL-S 13W/2P) in a standard fluorescent light fixture with constant stirring. UV254 irradiance in nanopure water was determined by potassium iodide actinometry44 and the absorption of each synthetic urine was used to correct the UV254 fluence dose for both matrices. Every 2.5 minutes, aliquots were collected from the reactors and placed in 2 mL screw top vials. All samples were spiked with 0.09 mL of the 10 mg L−1 deuterated internal standard stock. Samples were collected up to a total reaction time of 20 minutes for nanopure water solutions and up to 60 minutes for synthetic urine solutions. These periods of time provided sufficient data points to establish robust linear regressions of the observed pharmaceutical degradation rate constants. Based on the UV254 irradiance and length of treatment time, this results in a fluence dose of 650 mJ cm−2, 371 mJ cm−2, and 351 mJ cm−2 for the nanopure water, synthetic hydrolyzed, and synthetic fresh urine solutions, respectively. Experiments in each of the matrices were performed in triplicate.Plasma experiments
The plasma reactor consisted of a 22-gauge, stainless-steel, high voltage electrode (McMaster-Carr) fed into cylindrical quartz tubing (Quartz Scientific) which acted as the dielectric barrier (Fig. S1†). The ground electrode was a corrosion-resistant tungsten wire (McMaster-Carr) wrapped around the quartz tubing. Argon gas was fed into the tubing at a rate of about 2.126 L min−1 controlled by a 150 mm correlated flowmeter (Cole-Palmer). Power was supplied by a neon transformer (Franceformer; Fairview, Tennessee) with an output voltage of 15![[thin space (1/6-em)]](https://www.rsc.org/images/entities/char_2009.gif) 000 volts, current of 30 milliamps, and a frequency of 60 Hz.
000 volts, current of 30 milliamps, and a frequency of 60 Hz.
Similar to the UV/H2O2 experiments, experimental solutions consisted of nanopure water, synthetic fresh urine, or synthetic hydrolyzed urine spiked with the six pharmaceuticals to achieve 1 mg L−1. The experimental solution (72 mL) was transferred to a 100 mL graduated cylinder. At time = 0, an initial aliquot (1.41 mL) was collected from the reactor, placed in a 2 mL screw top vial, and spiked with 0.09 mL of the deuterated standard. During treatment with the plasma reactor, aliquots were collected from the experimental solutions every 2.5 minutes for up to 20 minutes and were spiked with the deuterated internal standard stocks. Experiments in each of the matrices were performed in triplicate.
Analytical methods
Pharmaceuticals in treated samples were quantified through online solid-phase extraction (SPE) followed by high performance liquid chromatography (HPLC) and high-resolution mass spectrometry (HRMS). Standard curves were prepared and consisted of six calibration points ranging from 100 mg L−1 to 1200 mg L−1 and each containing 600 mg L−1 of the deuterated internal standard. Each standard curve was considered successful if the R2 was greater than 0.99. Online SPE was conducted with the Thermo Scientific Equan setup and a Hypersil Gold aQ trapping column (20 × 2.1 mm, 12 μM particle size; Thermo Fisher Scientific). An Accucore aQ column (50 × 2.1 mm, 2.6 μm particle size; Thermo Fisher Scientific) was used for chromatographic separation with an injection volume of 1000 mL into the trapping column. To elute the selected pharmaceuticals from the column with minimal interference, two mobile phases were applied in gradient flow consisting of nanopure water and 0.1% formic acid for mobile phase A and methanol and 0.1% formic acid for mobile phase B. The flow rate was 0.175 mL min−1 for 12 minutes of the gradient flow and increased to 0.25 mL min−1 over the course of 0.2 minutes and held for 1.8 minutes. Finally, the flow rate was decreased from 0.25 to 0.175 mL min−1 over the course of 0.2 minutes. The mobile phase gradient flow was as follows: mobile phase A was held at 90% for 3 minutes, steadily increased to 90% mobile phase B over the course of 8 minutes, held at 90% mobile phase B for 1 minute, and finally returned to 90% mobile phase A over 0.2 minutes.All six pharmaceuticals were ionized in positive mode through electron spray ionization. Source parameters included: capillary temperature of 250 °C, auxiliary gas heater temperature of 275 °C, spray voltage of 3.5 kV, sheath gas flow rate of 30 arbitrary units, auxiliary gas flow rate of 20 arbitrary units, and sweep gas flow rate of 1 arbitrary unit. Resolution was set at 70000 with a target automatic gain control (AGC) of 1 × 10⁻⁶ and a scan range from 150 to 2000 m/z. Analytes and their respective deuterated forms were found through their retention times and exact mass (Table S4†). Concentrations for the treated samples were quantified by comparing the response ratio (the area of the target analyte divided by the area of the deuterated standard) of the samples to that of the standard curves generated.
Data analysis
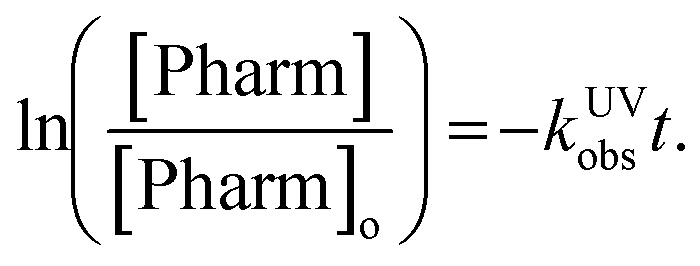
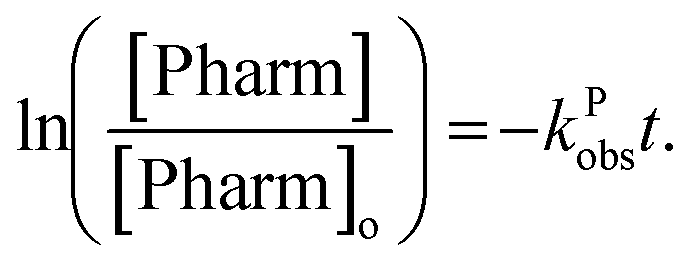
Observed rate constants for each pharmaceutical in both reactor systems were determined by assuming pseudo-first order conditions. Reported kobs values in all matrixes were determined based on the slopes found in Fig. S2–S4 and are reported in Table S5.† In the case of the UV/H2O2, the reaction mechanism includes both direct and indirect photolysis and is defined as follows:where kd,Pharm (s−1) is the direct photolysis rate constant, kOH,Pharm (M−1 s−1) is the second-order rate constant with hydroxyl radical, kUVobs (s−1) is the observed rate constant, [Pharm] (M) is the pharmaceutical concentration, and [×OH] (M) is the hydroxyl radical concentration. Integrating results in the following relationship:
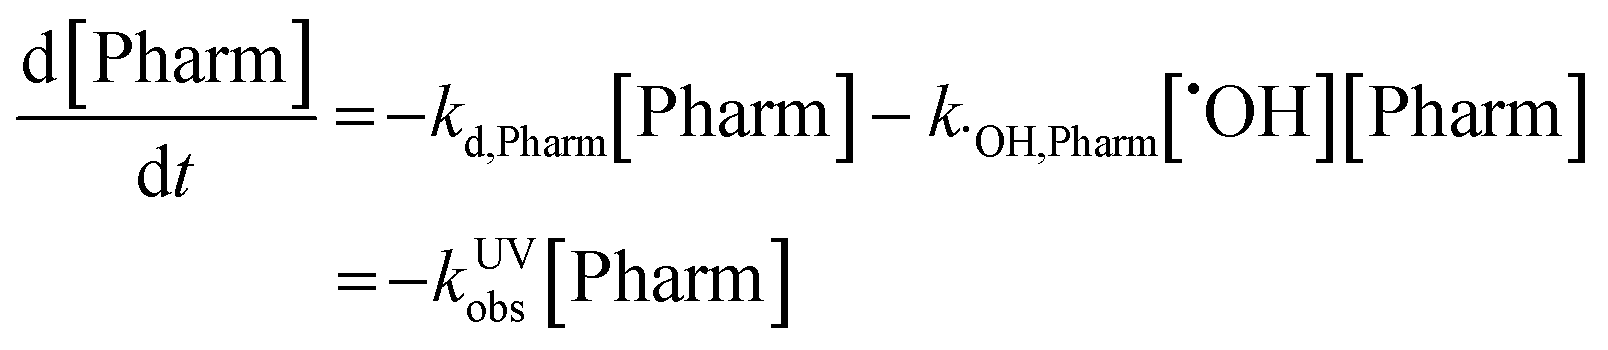
The observed rate constant can be determined by plotting the experimentally determined pharmaceutical concentration ratio over time. For the case of the plasma reactor, the observed rate constant is defined as:

Tukey's multiple comparisons test with a P value < 0.05 considered significant was used to compare observed rate constants to each other using GraphPad Prism version 8.4.3 for MacOS Catalina, GraphPad Software, San Diego, California USA, http://www.graphpad.com.
Energy efficiency calculations
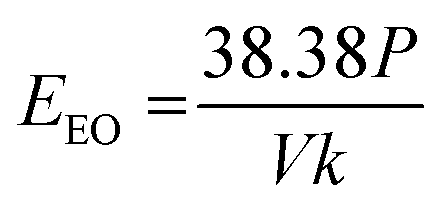
E EO is a metric defined by Bolton et al.45 that indicates the energy investment required to achieve 90% removal of a contaminant. EEO is calculated for an idealized batch reactor as follows:where P is the power (kW), V is the volume (L), and k is the observed rate constant (min−1). An individual EEO was calculated using each of the observed rate constants of the target pharmaceuticals treated in each of the reactors across all three experimental matrices. The rated power of the UV H2O2 reactor was 13 W, while that of the plasma reactor was 450 W.
Results and discussion
Hydroxyl radicals are the primary degradation mechanism in plasma treatment
Comparative experiments with nanopure water show that the UV/H2O2 reactor transformed our test pharmaceuticals through both direct and indirect photolysis. Observed rate constants in the UV/H2O2 reactor ranged from 1.05 × 10⁻⁴ to 6.75 × 10⁻³ s−1. Sulfamethoxazole, which has a higher quantum yield and molar extinction coefficient than the other pharmaceuticals and is thus susceptible to both direct and indirect photolysis, had a rate constant between 20 and 65 times higher than all the other pharmaceuticals tested (Fig. 1) and this difference was significant (Tukey's multiple comparison test, p < 0.05). This pattern is similar to what was found by Wols et al. 2013 in which sulfamethoxazole degraded more rapidly than acetaminophen and atenolol at a comparable UV dose and H2O2 concentration.46 This result shows that our comparative UV/H2O2 setup produced results consistent with other published studies.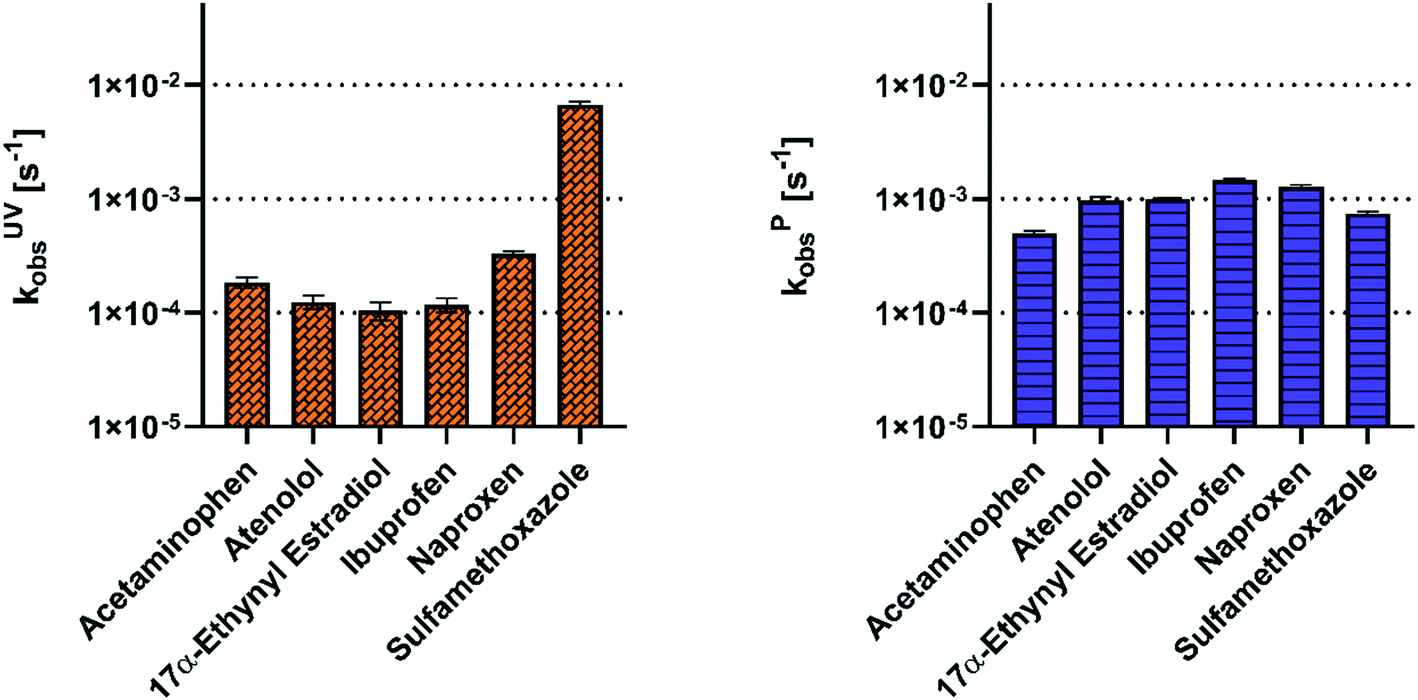 | ||
| Fig. 1 Observed first order rate constants for pharmaceutical loss in nanopure water treated by the comparative UV/H2O2 system (left) and the experimental plasma system (right). | ||
We treated the same set of pharmaceuticals with our experimental plasma reactor and measured observed rate constants ranging from 4.95 × 10⁻⁴ to 1.46 × 10⁻³ s−1 (Fig. 1). Importantly, the observed rate constant for sulfamethoxazole was within the same order of magnitude as the other pharmaceuticals tested. This suggests that degradation by direct photolysis was not a significant pathway for pharmaceutical loss in our plasma reactor. UV production by plasma has been reported;47 however, consistent with our results, its contribution to the degradation of organic contaminants was negligible. Our results are also consistent with those of Singh et al. who evaluated degradation pathways for diclofenac, carbamazepine, and ciprofloxacin in a pulsed corona discharge plasma reactor and found the most prominent mechanism for mineralization was by electrophilic addition of hydroxyl radicals.48
Comparison of second order rate constants from the literature to our experimentally derived rate constants affirmed that hydroxyl radical is the primary oxidant. The literature-based second-order rate constants with hydroxyl radical correspond with a higher observed rate constant for most of the pharmaceuticals (Fig. 2). Specifically, the correlation (R2: 0.54; significantly non-zero slope P = 0.0005) between the observed rate constants and the hydroxyl radical second-order rate constants suggests that hydroxyl radical is the predominant oxidative agent. A lack of correlation would suggest other radical species were driving the degradation of the pharmaceuticals. By comparison, the rate constants of the ozone and UV254 radiation do not correlate (R2: 0.0001 and R2: 0.2 respectively; non-significant non-zero slope P = 0.96 and P = 0.07) with the observed rate constants (Fig. S5 and S6†). The larger second-order rate constants of the pharmaceuticals with hydroxyl radical demonstrate that the plasma reactor would need to generate ozone concentrations three to nine orders of magnitude greater than the hydroxyl radical concentrations to play a role in pharmaceutical degradation. The exception to this observation is with 17α-ethynyl estradiol, which has a second-order rate constant with ozone (7.4 × 10⁹ M−1 s−1) similar to the second-order rate constant with hydroxyl radical (9.8 × 10⁹ M−1 s−1). The general trend shown in Fig. S5† suggests that ozone is produced at insufficient quantities to increase the observed rate constant.
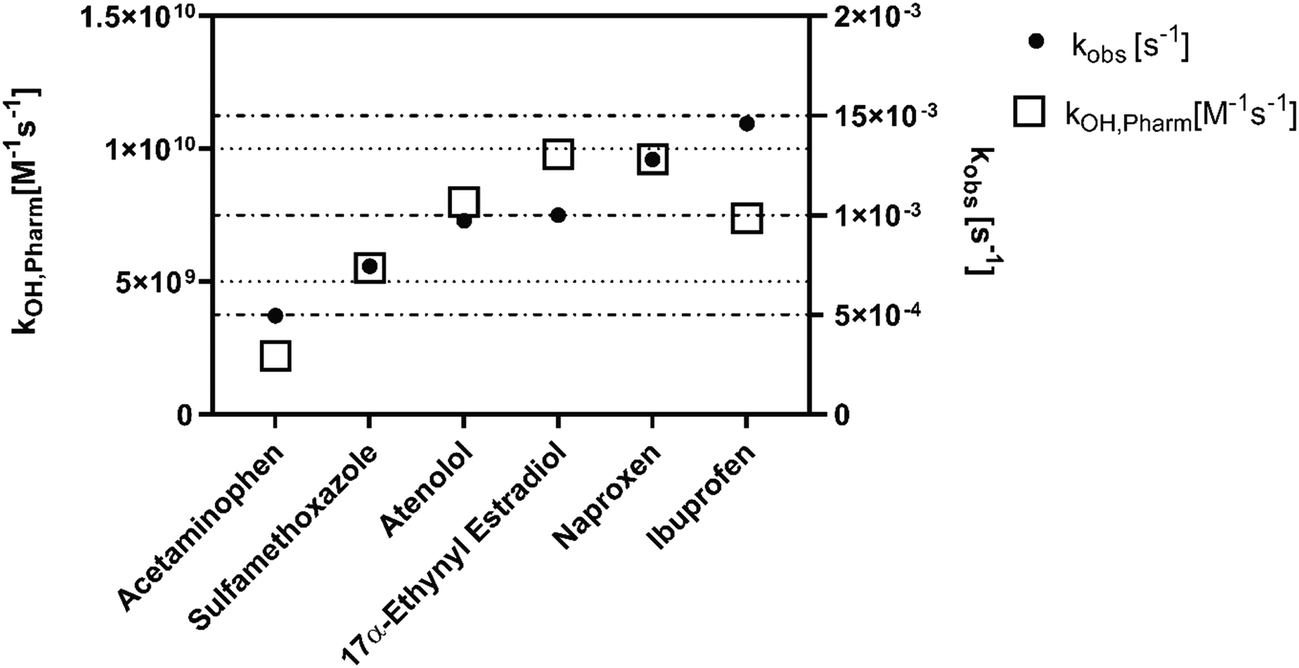 | ||
| Fig. 2 Second-order rate constants reported in the literature for each pharmaceutical with hydroxyl radical are presented on the left y-axis.50–53 Observed first-order rate constants for each pharmaceutical in nanopure water treated by plasma are presented on the right y-axis. Both axes are presented on a linear scale to show the relationship between first- and second-order rate constants. | ||
Our results suggest the main mechanism responsible for pharmaceutical losses observed during our plasma experiments conducted with nanopure water is hydroxyl radical oxidation. However, our results do not exclude the possibility that UV and reactive species beyond hydroxyl radicals were produced; rather, they show that they were not formed at intensities sufficient to compete with hydroxyl radicals for degradation of the pharmaceutical compounds we evaluated. The types and amounts of radicals produced by plasma are impacted by operating and design conditions such as carrier gas, gas flow rates, reactor geometry, input power, type of power supply, and electrode types.49 By making changes to these conditions, it is feasible that the primary reaction mechanism could shift to other oxidants beyond hydroxyl radical, such as UV, ozone, or peroxide. However, the demonstrated performance of our reactor allows us to focus on hydroxyl radical production as an oxidative mechanism, which is known to be a major oxidative radical for degradation of pharmaceutical compounds.
Plasma oxidation treatment is consistent across different synthetic urine matrices
Experiments were conducted to determine if the matrix of synthetic urine would impact the performance of plasma-mediated AOP treatment. We use a matrix performance ratio (kobs,nanopure water/kobs,synthetic urine) to characterize matrix effects for both fresh and hydrolyzed synthetic urine; a ratio greater than one indicates that the pharmaceutical degraded faster in the nanopure water and a ratio less than one indicates degradation occurred faster in the synthetic urine (Fig. 3). Using this metric, we show that both the UV/H2O2 and plasma reactors were negatively impacted by the switch to a hydrolyzed synthetic urine matrix.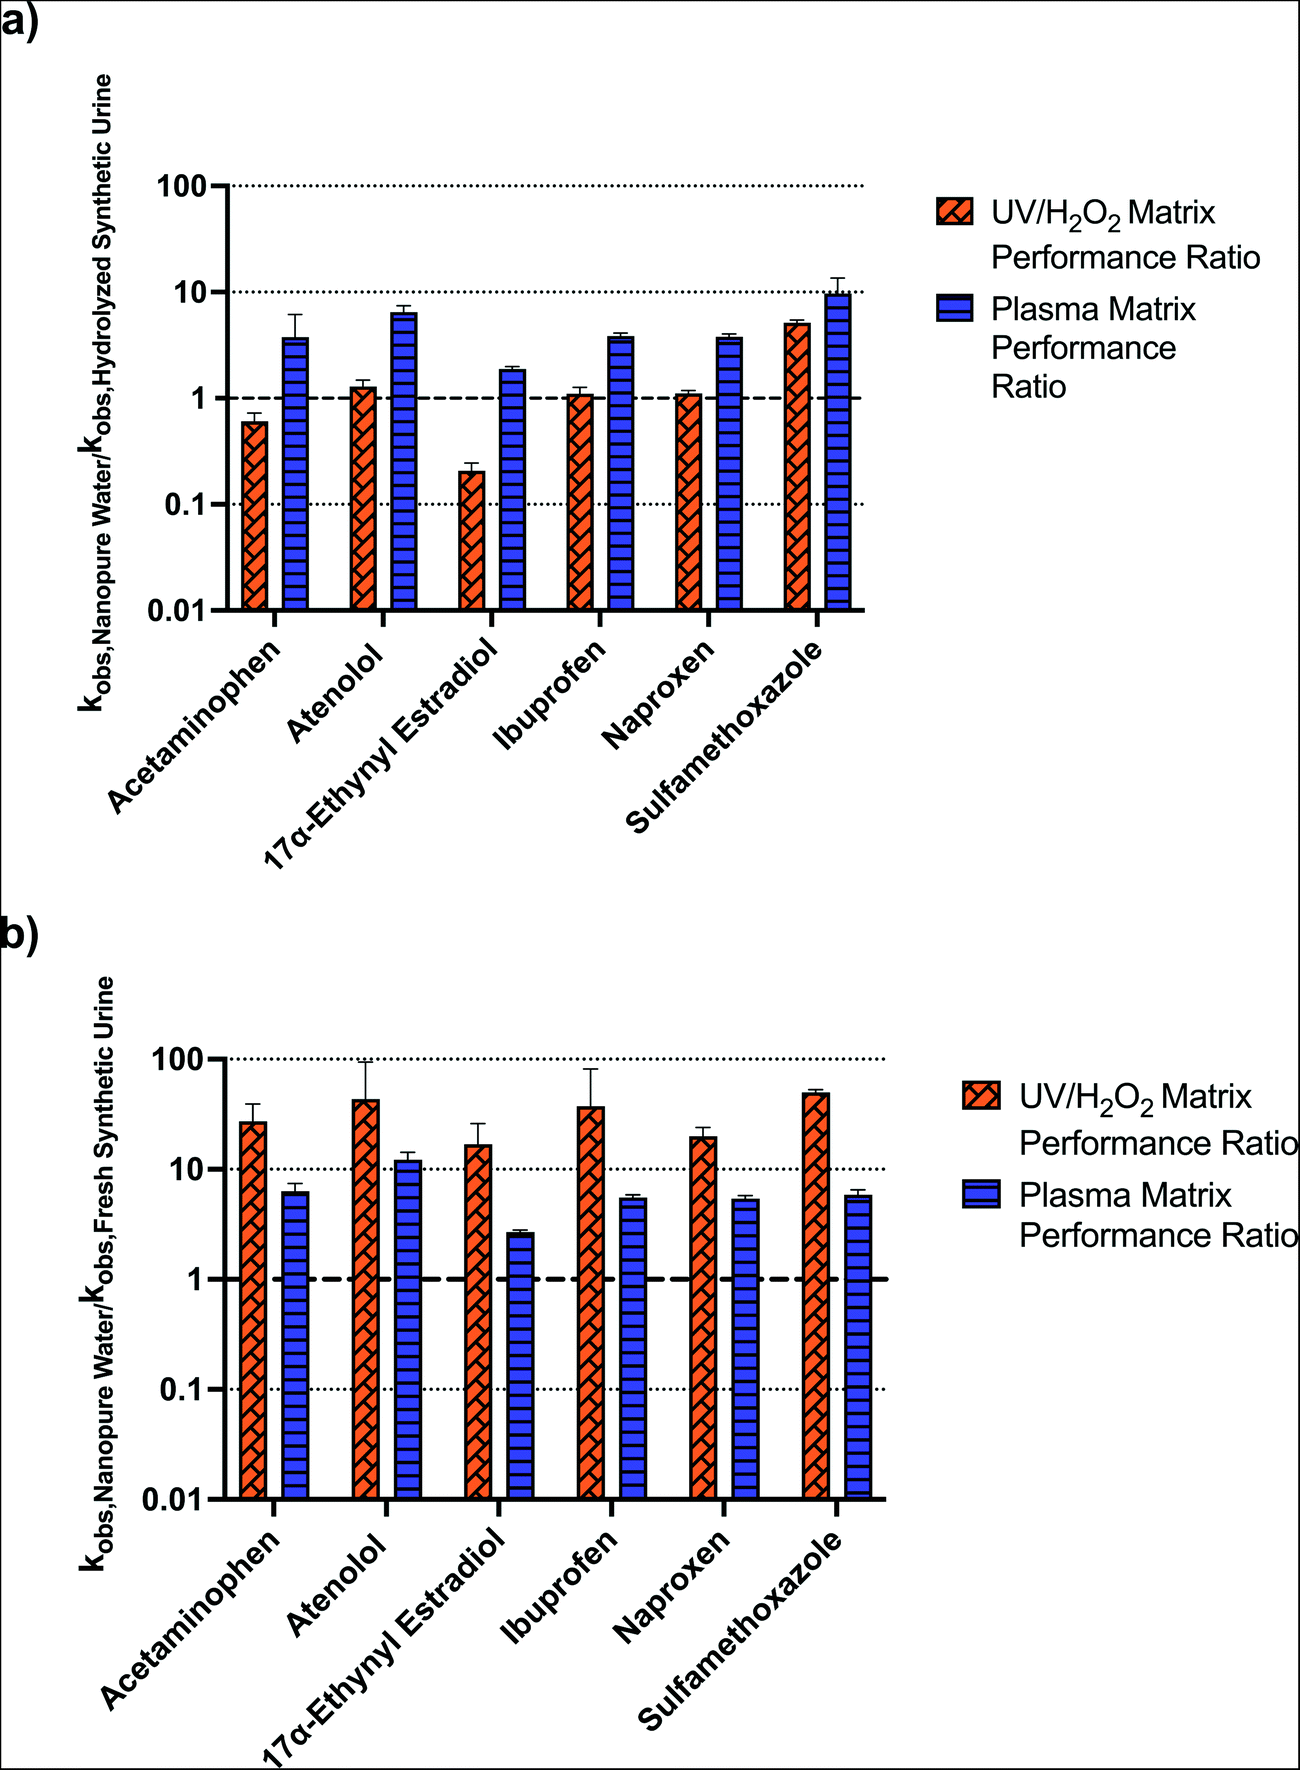 | ||
| Fig. 3 (a) Comparison of hydrolyzed synthetic urine matrix effects on the degradation rate of pharmaceuticals in each of the two reactors. (b) Comparison of fresh synthetic urine matrix effects on the degradation rate of pharmaceuticals in each of the two reactors. | ||
The hydrolyzed urine matrix introduces hydroxyl radical scavenging effects for both our experimental plasma treatment and comparative UV/H2O2 treatment, yet to a different degree. The matrix performance ratio for UV/H2O2 when compared in hydrolyzed synthetic urine ranged from 0.21 ± 0.030 to 5.2 ± 0.010 across all pharmaceuticals (Fig. 3a). Atenolol, ibuprofen, naproxen, and sulfamethoxazole had a ratio above one, indicating that the presence of hydroxyl radical scavengers in the urine matrix diminished the rate at which the pharmaceuticals were degraded, a result consistent with the work of Zhang et al.42 Acetaminophen and 17α-ethynyl estradiol had matrix performance ratios below one, indicating a matrix enhancement effect. While bicarbonate (a component of hydrolyzed urine) acts as a hydroxyl radical scavenger, it also leads to the formation of carbonate radicals in UV-AOP systems, which in turn increases the degradation rates of acetaminophen and estrogenic compounds and could explain this matrix enhancement effect.54,55 Similarly, all of the pharmaceuticals degraded faster in nanopure water compared to hydrolyzed synthetic urine when treated with plasma (Fig. 3a). The matrix performance ratios ranged from 1.9 ± 0.010 to 9.7 ± 3.9, demonstrating a slightly larger scavenging impact with plasma treatment compared to UV/H2O2 treatment. For both forms of AOP, the hydroxyl scavengers in the hydrolyzed synthetic urine, including ammonium and bicarbonate, decrease the number of hydroxyl radicals available for the target compounds.42 An additional effect of the plasma reactor is that the strong electric field is diminished as the conductivity of the solution increased.56 Alternative plasma reactor configurations may lessen the negative conductivity effects. For example, an over-the-liquid plasma, which generates electrical discharges just above the water, demonstrated increased radical production at higher conductivities.57 Use of a power supply with less time between low to high voltage (rise time)57 could also minimize conductivity effects, as shown by Wang et al.58
When tested in nanopore water versus fresh synthetic urine, the comparative UV/H2O2 reactor exhibited matrix performance ratios that ranged from 20 ± 4.0 to 50 ± 3.1 (Fig. 3b). In contrast, the plasma reactor was less impacted by the switch to fresh synthetic urine as reflected by pharmaceutical matrix performance ratios ranging from 2.7 ± 0.1 to 12 ± 2.0 (Fig. 3b). These matrix performance ratios are similar to those observed for the plasma reactor in hydrolyzed urine compared to nanopure water. The presence of creatinine at 9.7 mM (a waste product released by muscles) in the fresh synthetic urine likely caused performance of the UV/H2O2 reactor to diminish. Creatinine has a higher experimental molar extinction coefficient (e = 246 m2 mol−1) than H2O2 (e = 1.86 m2 mol−1), consistent with the hypothesis that creatinine interfered with H2O2 reactions with UV254.59 Less H2O2 interacting with UV254 results in reduced production of hydroxyl radicals. Since creatinine undergoes hydrolysis as a result of the urease enzyme converting urea from urine into ammonium, creatinine is not added to the hydrolyzed synthetic urine recipe.60 Nevertheless, our results show that plasma treatment efficiency was similar between hydrolyzed and fresh synthetic urines, suggesting that plasma could have broad appeal for use across a range of multi-step urine processing systems designed for use with either form of urine.
Conductivity differences between the two urine matrices did not seem to play a significant role in plasma performance. The conductivity of the fresh synthetic urine (16 mS cm−1) was less than half that of the hydrolyzed synthetic urine (36 mS cm−1), and both match conductivities observed for real urine.61 Nevertheless, conductivity still played a role given that switching from nanopure water (<100 μS cm−1) to synthetic urine diminished performance. Shih et al. operated a point-to-plane in salty water plasma reactor and found that the production of hydroxyl radicals diminished as the conductivity increased due to a weakened electric field; however, this effect plateaued after reaching 0.30 mS cm−1.56 Given that the conductivities of both synthetic urines are well above this level, the negative effects of conductivity could have reached their limit.
When plasma reactors are used to degrade pharmaceuticals in complex matrices, experiments should be designed to avoid the two-fold problem of conductivity and scavenging. Guo et al. combined pulsed discharge plasma with reduced graphene oxide/TiO2 nanocomposites to enhance the degradation potential of flumequine (fluoroquinolone antibiotic) for water treatment.62 The reduced graphene/TiO2 nanocomposites facilitated the formation of ozone, which ultimately led to the formation of a higher quantity of hydroxyl radicals compared to the plasma alone or the TiO2 alone. By coupling plasma with other existing technologies, the scavengers that lower hydroxyl radical production could be counteracted and offer new degradation pathways to address pharmaceutical contamination.
Energy efficiency limits the scale of plasma treatment
The electric energy per order of magnitude (EEO) was calculated to evaluate the energy intensity of the plasma reactor across all experimental matrices.63 The EEO of the plasma reactor ranged from 12–237 kW h m−3 per order. Miklos et al. conducted an extensive review on several studies that evaluated the degradation of organic compounds with various AOP technologies and found that UV/H2O2 was an order of magnitude more efficient than plasma.64 Notably, these studies did not examine complex, conductive matrixes such as urine. Therefore, we calculated the energy efficiencies for UV/H2O2 in all matrices from our study to provide a point of comparison. The results show that UV/H2O2 was one to two orders of magnitude smaller than the plasma reactor (Fig. 4), signifying overall better energy efficiency in the UV/H2O2 reactor. However, in the fresh synthetic urine matrix, which reduced the removal of pharmaceuticals significantly for the UV/H2O2 reactor compared to nanopure water, the EEO was the same order of magnitude as the plasma reactor.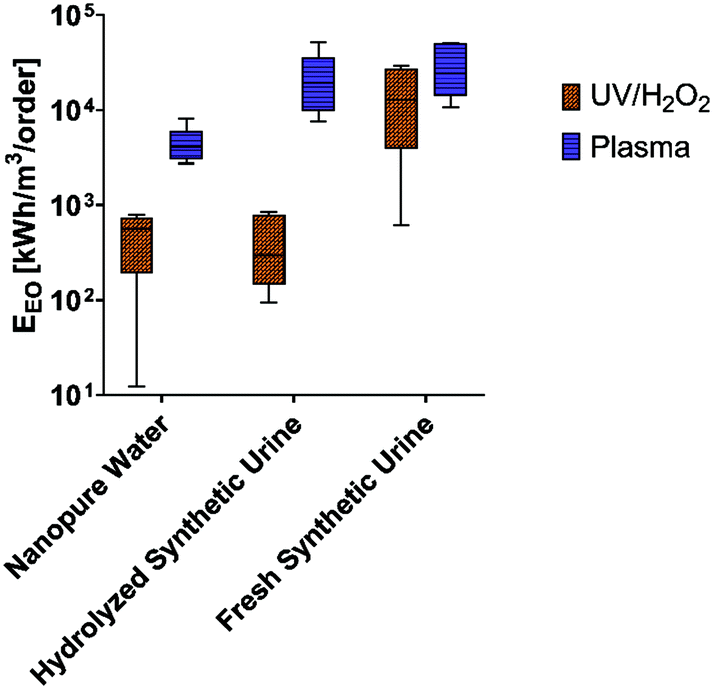 | ||
| Fig. 4 Calculated electric energy per order (EEO) (kW h m−3 per order) for both bench-scale reactors in the nanopure water and synthetic urine matrixes. The box and whisker plot displays 95% confidence intervals for EEO values (n = 6, all pharmaceutical compounds in each data point). | ||
From an energy perspective, plasma at a full scale is mainly hindered by mass transfer limitations for the dissolution of oxidative species in solution, which lower the overall process efficiency.65 However, plasma treatment has been implemented widely in small- and medium-scale applications for both water and wastewater treatment.66–71 Despite plasma's lower energy efficiency per unit of treatment in the nanopure and hydrolyzed urine matrices, plasma warrants further evaluation for possible application in resource recovery fluids such as a small-scale or on-site urine-derived fertilizer processing facilities. This is due to plasma's ability to perform consistently across both fresh and hydrolyzed urine matrixes, in addition to reducing the need for chemical additives.
Conclusions
Creating sustainable and publicly acceptable fertilizers from source-separated urine requires mitigating the release of micropollutants.72 In this study, we determined that hydroxyl radicals were the primary pharmaceutical degradation mechanisms in our plasma reactor and were consistent in terms of the extent of its ability to degrade pharmaceuticals in different urine matrices. Our results show that a dielectric barrier discharge plasma reactor can oxidize pharmaceuticals in both fresh and hydrolyzed synthetic urine. Collection and production of urine-derived fertilizers can occur at various scales, including the building-scale that has single- or multiple-dwelling units or multi-floor office buildings. The wide range of plasma reactor geometries could allow for treatment-specific configurations to mitigate pharmaceuticals at the point of collection. Despite the lack of evidence for the role of reactive chemical species beyond the hydroxyl radical in the reactor configuration evaluated for this study, changes to the reactor geometry, carrier gas, power supply used, and various other operating parameters could be implemented to improve the efficiency of pharmaceutical treatment in urine-derived fertilizers. Alternatively, the reactor can be optimized to produce and transfer more hydroxyl radicals than seen in our study, which would enhance their diffusion into the liquid phase. Some intermediate liquids formed during urine processing that capture the pharmaceuticals, such as the residual water produced during phosphorus-capturing struvite precipitation,73 may be more amenable to plasma treatment than unprocessed urine. Ultimately, plasma reactors will need to be optimized in order to reduce the cost and energy consumption associated with them so they can be implemented in various decentralized settings. Finally, pharmaceutical degradation mechanisms and pathways due to plasma treatment can be further elucidated by studying the transformation products of treated pharmaceuticals.Conflicts of interest
There are no conflicts of interest to declare.Acknowledgements
This material is based upon work supported by the National Science Foundation under Grant No. INFEWS 1639244. The authors would like to thank Drs. Selman Mujovic, John Foster, Tian Xia, and Herek Clack for their guidance in construction and operation of the plasma reactor. We would also like to thank Juliana Marks for assistance in characterizing the synthetic urine matrices.References
- USEPA, Biological Nutrient Removal Processes and Costs, Washington DC, EPA-823-R-07-002 Search PubMed.
- M. Maurer, P. Schwegler and T. A. Larsen, Nutrients in urine: energetic aspects of removal and recovery, Water Sci. Technol., 2003, 48(1), 37–46, DOI:10.2166/wst.2003.0011.
- D. Cordell and S. White, Peak phosphorus: Clarifying the key issues of a vigorous debate about long-term phosphorus security, Sustainability, 2011, 3(10), 2027–2049, DOI:10.3390/su3102027.
- K. M. Udert, T. A. Larsen and W. Gujer, Fate of major compounds in source-separated urine, Water Sci. Technol., 2006, 54(11–12), 413–420, DOI:10.2166/wst.2006.921.
- T. A. Larsen, A. C. Alder, R. I. L. Eggen, M. Maurer and J. Lienert, Source separation: Will we see a paradigm shift in wastewater handling?, Environ. Sci. Technol., 2009, 43(16), 6121–6125, DOI:10.1021/es803001r.
- S. P. Hilton, G. A. Keoleian, G. T. Daigger, B. Zhou and N. G. Love, Life cycle assessment of urine diversion and conversion to fertilizer products at the city scale, Environ. Sci. Technol., 2021, 55(1), 593–603, DOI:10.1021/acs.est.0c04195.
- J. Lienert, T. Bürki and B. I. Escher, Reducing micropollutants with source control: Substance flow analysis of 212 pharmaceuticals in faeces and urine, Water Sci. Technol., 2007, 56(5), 87–96, DOI:10.2166/wst.2007.560.
- O. Kavvada, W. A. Tarpeh, A. Horvath and K. L. Nelson, Life-cycle cost and environmental assessment of decentralized nitrogen recovery using ion exchange from source-separated urine through spatial modeling, Environ. Sci. Technol., 2017, 51(21), 12061–12071, DOI:10.1021/acs.est.7b02244.
- J. Neha and T. H. Boyer, Integrated decentralized treatment for improved N and K recovery from urine, J. Sustain. Water Built Environ., 2020, 6(2), 4019015, DOI:10.1061/JSWBAY.0000899.
- T. L. Chipako and D. G. Randall, Investigating the feasibility and logistics of a decentralized urine treatment and resource recovery system, J. Water Process. Eng., 2020, 37, 101383, DOI:10.1016/j.jwpe.2020.101383.
- T. H. Boyer and D. Saetta, Opportunities for building-scale urine diversion and challenges for implementation, Acc. Chem. Res., 2019, 52(4), 886–895, DOI:10.1021/acs.accounts.8b00614.
- T. A. Larsen, S. Hoffmann, C. Lüthi, B. Truffer and M. Maurer, Emerging solutions to the water challenges of an urbanizing world, Science, 2016, 352(6288), 928–933, DOI:10.1126/science.aad8641.
- J. Atlee, A. Noe-Hays, K. Nace, T. Schreiber, A. Davis, C. Lally and S. Dotson, Guide to starting a community-scale urine diversion program, 2019, Available from: http://richearthinstitute.org/wp-content/uploads/2019/05/RichEarth_Urine_Diversion_Guide_01_1.pdf Search PubMed.
- T. A. Larsen, K. M. Udert and J. Lienert, Source separation and decentralization for wastewater management, IWA Publishing, London, 2013, DOI:10.2166/9781780401072.
- T. A. Larsen, M. E. Riechmann and K. M. Udert, State of the art of urine treatment technologies: A critical review, Water Res.: X, 2021, 13, 100114, DOI:10.1016/j.wroa.2021.100114.
- R. P. Deo, Pharmaceuticals in the surface water of the USA: A review, Curr. Environ. Health Rep., 2014, 1(2), 113–122, DOI:10.1007/s40572-014-0015-y.
- R. Zhang, Y. Yang, C. H. Huang, L. Zhao and P. Sun, Kinetics and modeling of sulfonamide antibiotic degradation in wastewater and human urine by UV/H2O2 and UV/PDS, Water Res., 2016, 103, 283–292, DOI:10.1016/j.watres.2016.07.037.
- R. Zhang, Y. Yang, C. H. Huang, N. Li, H. Liu, L. Zhao and P. Sun, UV/H2O2 and UV/PDS treatment of trimethoprim and sulfamethoxazole in synthetic human urine: Transformation products and toxicity, Environ. Sci. Technol., 2016, 50(5), 2573–2583, DOI:10.1021/acs.est.5b05604.
- I. Köpping, C. S. McArdell, E. Borowska, M. A. Böhler and K. M. Udert, Removal of pharmaceuticals from nitrified urine by adsorption on granular activated carbon, Water Res.: X, 2020, 9, 100057, DOI:10.1016/j.wroa.2020.100057.
- K. Ikehata, N. Jodeiri Naghashkar and M. Gamal El-Din, Degradation of aqueous pharmaceuticals by ozonation and advanced oxidation processes: A review, Ozone: Sci. Eng., 2006, 28(6), 353–414, DOI:10.1080/01919510600985937.
- L. Feng, E. D. van Hullebusch, M. A. Rodrigo, G. Esposito and M. A. Oturan, Removal of residual anti-inflammatory and analgesic pharmaceuticals from aqueous systems by electrochemical advanced oxidation processes. A review, Chem. Eng. J., 2013, 228, 944–964, DOI:10.1016/j.cej.2013.05.061.
- Y. Lester, D. Avisar, I. Gozlan and H. Mamane, Removal of pharmaceuticals using combination of UV/H2O2/O3 advanced oxidation process, Water Sci. Technol., 2011, 64(11), 2230–2238, DOI:10.2166/wst.2011.079.
- M. Klavarioti, D. Mantzavinos and D. Kassinos, Removal of residual pharmaceuticals from aqueous systems by advanced oxidation processes, Environ. Int., 2009, 35(2), 402–417, DOI:10.1016/j.envint.2008.07.009.
- I. Sirés, E. Brillas, M. A. Oturan, M. A. Rodrigo and M. Panizza, Electrochemical advanced oxidation processes: Today and tomorrow. A review, Environ. Sci. Pollut. Res., 2014, 21(14), 8336–8367, DOI:10.1007/s11356-014-2783-1.
- B. G. Kwon, S. Ryu and J. Yoon, Determination of hydroxyl radical rate constants in a continuous flow system using competition kinetics, J. Ind. Eng. Chem., 2009, 15(6), 809–812, DOI:10.1016/j.jiec.2009.09.004.
- W. R. Haag and C. C. David Yao, Rate constants for reaction of hydroxyl radicals with several drinking water contaminants, Environ. Sci. Technol., 1992, 26(5), 1005–1013, DOI:10.1021/es00029a021.
- A. M. Anpilov, E. M. Barkhudarov, Y. B. Bark, Y. V. Zadiraka, M. Christofi, Y. N. Kozlov, I. A. Kossyi, V. A. Kop'ev, V. P. Silakov, M. I. Taktakishvili and S. M. Temchin, Electric discharge in water as a source of UV radiation, ozone and hydrogen peroxide, J. Phys. D: Appl. Phys., 2001, 34, 993–999, DOI:10.1088/0022-3727/34/6/322.
- P. Bruggeman and D. C. Schram, On OH production in water containing atmospheric pressure plasmas, Plasma Sources Sci. Technol., 2010, 19(4), 045025, DOI:10.1088/0963-0252/19/4/045025.
- P. Lukes, A. T. Appleton and B. R. Locke, Hydrogen peroxide and ozone formation in hybrid gas–liquid electrical discharge reactors, IEEE Trans. Ind. Appl., 2004, 40(1), 60–67, DOI:10.1109/TIA.2003.821799.
- P. Sunka, V. Babický, M. Clupek, P. Lukes, M. Simek, J. Schmidt and M. Cernák, Generation of chemically active species by electrical discharges in water, Plasma Sources Sci. Technol., 1999, 8(2), 258–265, DOI:10.1088/0963-0252/8/2/006.
- J. Velikonja, M. A. Bergougnou, G. S. P. Castle, W. L. Caims and I. I. Inculet, Co-generation of ozone and hydrogen peroxide by dielectric barrier AC discharge in humid oxygen, Ozone: Sci. Eng., 2001, 23(6), 467–478, DOI:10.1080/01919510108962031.
- R. P. Joshi and S. M. Thagard, Streamer-like electrical discharges in water: Part I. fundamental mechanisms, Plasma Chem. Plasma Process., 2013, 33(1), 1–15, DOI:10.1007/s11090-012-9425-5.
- R. P. Joshi and S. M. Thagard, Streamer-like electrical discharges in water: Part II. environmental applications, Plasma Chem. Plasma Process., 2013, 33(1), 17–49, DOI:10.1007/s11090-013-9436-x.
- B. R. Locke, M. Sato, P. Sunka, M. R. Hoffmann and J. S. Chang, Electrohydraulic discharge and nonthermal plasma for water treatment, Ind. Eng. Chem. Res., 2006, 45(3), 882–905, DOI:10.1021/ie050981u.
- F. Liu, P. Sun, N. Bai, Y. Tian, H. Zhou, S. Wei, Y. Zhou, J. Zhang, W. Zhu, K. Becker and J. Fang, Inactivation of bacteria in an aqueous environment by a direct-current, cold-atmospheric-pressure air plasma microjet, Plasma Processes Polym., 2010, 7(3–4), 231–236, DOI:10.1002/ppap.200900070.
- I. Kornev, G. Osokin, A. Galanov, N. Yavorovskiy and S. Preis, Formation of nitrite- and nitrate-ions in aqueous solutions treated with pulsed electric discharges, Ozone: Sci. Eng., 2013, 35(1), 22–30, DOI:10.1080/01919512.2013.720898.
- J. E. Foster, G. Adamovsky, S. N. Gucker and I. M. Blankson, A comparative study of the time-resolved decomposition of methylene blue dye under the action of a nanosecond repetitively pulsed dbd plasma jet using liquid chromatography and spectrophotometry, IEEE Trans. Plasma Sci., 2013, 41(3), 503–512, DOI:10.1109/TPS.2013.2245426.
- M. A. Malik, Ubaid-Ur-Rehman, A. Ghaffar and K. Ahmed, Synergistic effect of pulsed corona discharges and ozonation on decolourization of methylene blue in water, Plasma Sources Sci. Technol., 2002, 11(3), 236–240, DOI:10.1088/0963-0252/11/3/302.
- J. Gao, X. Wang, Z. Hu, H. Deng, J. Hou, X. Lu and J. Kang, Plasma degradation of dyes in water with contact glow discharge electrolysis, Water Res., 2003, 37(2), 267–272, DOI:10.1016/s0043-1354(02)00273-7.
- A. T. Sugiarto, S. Ito, T. Ohshima, M. Sato and J. D. Skalny, Oxidative decoloration of dyes by pulsed discharge plasma in water, J. Electrost., 2003, 58(1–2), 135–145, DOI:10.1016/S0304-3886(02)00203-6.
- E. Tilley, J. Atwater and D. Mavinic, Effects of storage on phosphorus recovery from urine, Environ. Technol., 2008, 29(7), 807–816, DOI:10.1080/09593330801987145.
- R. Zhang, P. Sun, T. H. Boyer, L. Zhao and C. H. Huang, Degradation of pharmaceuticals and metabolite in synthetic human urine by UV, UV/H2O2, and UV/PDS, Environ. Sci. Technol., 2015, 49(5), 3056–3066, DOI:10.1021/es504799n.
- J. E. Donham, E. J. Rosenfeldt and K. R. Wigginton, Photometric hydroxyl radical scavenging analysis of standard natural organic matter isolates, Environ. Sci.: Processes Impacts, 2014, 16(4), 764–769, 10.1039/c3em00663h.
- R. O. Rahn, Potassium iodide as a chemical actinometer for 254 nm radiation: Use of iodate as an electron scavenger, Photochem. Photobiol., 1997, 66(4), 450–455, DOI:10.1111/j.1751-1097.1997.tb03172.x.
- J. R. Bolton and M. I. Stefan, Fundamental photochemical approach to the concepts of fluence (UV dose) and electrical energy efficiency in photochemical degradation reactions, Res. Chem. Intermed., 2002, 28(7–9), 857–870, DOI:10.1163/15685670260469474.
- B. A. Wols, C. H. M. Hofman-Caris, D. J. H. Harmsen and E. F. Beerendonk, Degradation of 40 selected pharmaceuticals by UV/H2O2, Water Res., 2013, 47(15), 5876–5888, DOI:10.1016/j.watres.2013.07.008.
- H. B. Huang, D. Q. Ye, M. L. Fu and F. D. Feng, Contribution of UV light to the decomposition of toluene in dielectric barrier discharge plasma/photocatalysis system, Plasma Chem. Plasma Process., 2007, 27(5), 577–588, DOI:10.1007/s11090-007-9085-z.
- R. K. Singh, L. Philip and S. Ramanujam, Rapid degradation, mineralization and detoxification of pharmaceutically active compounds in aqueous solution during pulsed corona discharge treatment, Water Res., 2017, 121, 20–36, DOI:10.1016/j.watres.2017.05.006.
- B. R. Locke and S. M. Thagard, Analysis and review of chemical reactions and transport processes in pulsed electrical discharge plasma formed directly in liquid water, Plasma Chem. Plasma Process., 2012, 32(5), 875–917, DOI:10.1007/s11090-012-9403-y.
- R. Andreozzi, V. Caprio, R. Marotta and A. Radovnikovic, Ozonation and H2O2/UV treatment of clofibric acid in water: A kinetic investigation, J. Hazard. Mater., 2003, 103(3), 233–246, DOI:10.1016/j.jhazmat.2003.07.001.
- J. Benner, E. Salhi, T. Ternes and U. von Gunten, Ozonation of reverse osmosis concentrate: Kinetics and efficiency of beta blocker oxidation, Water Res., 2008, 42(12), 3003–3012, DOI:10.1016/j.watres.2008.04.002.
- M. M. Huber, S. Canonica, G. Y. Park and U. von Gunten, Oxidation of pharmaceuticals during ozonation and advanced oxidation processes, Environ. Sci. Technol., 2003, 37(5), 1016–1024, DOI:10.1021/es025896h.
- J. L. Packer, J. J. Werner, D. E. Latch, K. McNeill and W. A. Arnold, Photochemical fate of pharmaceuticals in the environment: Naproxen, diclofenac, clofibric acid, and ibuprofen, Aquat. Sci., 2003, 65(4), 342–351, DOI:10.1007/s00027-003-0671-8.
- Y. Bai, Z. Cui, R. Su and K. Qu, Influence of DOM components, salinity, pH, nitrate, and bicarbonate on the indirect photodegradation of acetaminophen in simulated coastal waters, Chemosphere, 2018, 205, 108–117, DOI:10.1016/j.chemosphere.2018.04.087.
- L. Lian, C. Miao, Z. Hao, Q. Liu, Y. Liu and W. Song, et al., Reevaluation of the contributions of reactive intermediates to the photochemical transformation of 17β-estradiol in sewage effluent, Water Res., 2021, 189, 116633, DOI:10.1016/j.watres.2020.116633.
- K. Y. Shih and B. R. Locke, Optical and electrical diagnostics of the effects of conductivity on liquid phase electrical discharge, IEEE Trans. Plasma Sci., 2011, 39(3), 883–892, DOI:10.1109/TPS.2010.2098052.
- S. M. Thagard, K. Takashima and A. Mizuno, Chemistry of the positive and negative electrical discharges formed in liquid water and above a gas-liquid surface, Plasma Chem. Plasma Process., 2009, 29(6), 455–473, DOI:10.1007/s11090-009-9195-x.
- X. Xie, Z. Wang, Y. Li, L. Zhan and Z. Nie, Investigation and applications of in-source oxidation in liquid sampling-atmospheric pressure afterglow microplasma ionization (LS-APAG) source, J. Am. Soc. Mass Spectrom., 2017, 28(6), 1036–1047, DOI:10.1007/s13361-016-1550-6.
- D. BŁedzka, D. Gryglik, M. Olak, J. L. Gebicki and J. S. Miller, Degradation of n-butylparaben and 4-tert-octylphenol in H2O2/UV system, Radiat. Phys. Chem., 2010, 79(4), 409–416, DOI:10.1016/j.radphyschem.2009.11.012.
- T. J. Miller, The kinetics and mechanism of the hydrolysis of creatinine in urine, Anal. Lett., 1991, 24(10), 1779–1784, DOI:10.1080/00032719108053011.
- E. Friedler, D. Butler and Y. Alfiya, Wastewater Composition, in Source Separation and Decentralization for Wastewater Management, ed. T. A. Larsen, K. M. Udert and J. Lienert, IWA Publishing, London, 2013, pp. 241–257 Search PubMed.
- H. Guo, N. Jiang, H. Wang, K. Shang, N. Lu, J. Li and Y. Wu, Degradation of flumequine in water by pulsed discharge plasma coupled with reduced graphene oxide/TiO2 nanocomposites, Sep. Purif. Technol., 2019, 218, 206–216, DOI:10.1016/j.seppur.2019.03.001.
- J. R. Bolton, K. G. Bircher, W. Tumas and C. A. Tolman, Figures-of-merit for the technical development and application of advanced oxidation technologies for both electric- and solar-driven systems, Pure Appl. Chem., 2001, 73(4), 627–637, DOI:10.1351/pac200173040627.
- D. B. Miklos, C. Remy, M. Jekel, K. G. Linden, J. E. Drewes and U. Hübner, Evaluation of advanced oxidation processes for water and wastewater treatment – A critical review, Water Res., 2018, 139, 118–131, DOI:10.1016/j.watres.2018.03.042.
- N. Wardenier, Z. Liu, A. Nikiforov, S. W. H. Van Hulle and C. Leys, Micropollutant elimination by O3, UV and plasma-based AOPs: An evaluation of treatment and energy costs, Chemosphere, 2019, 234, 715–724, DOI:10.1016/j.chemosphere.2019.06.033.
- J. E. Foster, B. Weatherford, E. Gillman and B. Yee, Underwater operation of a DBD plasma jet, Plasma Sources Sci. Technol., 2010, 19(2), 1–9, DOI:10.1088/0963-0252/19/2/025001.
- D. Gerrity, B. D. Stanford, R. A. Trenholm and S. A. Snyder, An evaluation of a pilot-scale nonthermal plasma advanced oxidation process for trace organic compound degradation, Water Res., 2010, 44(2), 493–504, DOI:10.1016/j.watres.2009.09.029.
- K. S. Kim, C. S. Yang and Y. S. Mok, Degradation of veterinary antibiotics by dielectric barrier discharge plasma, Chem. Eng. J., 2013, 219, 19–27, DOI:10.1016/j.cej.2012.12.079.
- M. Magureanu, D. Piroi, N. B. Mandache, V. David, A. Medvedovici, C. Bradu and V. I. Parvulescu, Degradation of antibiotics in water by non-thermal plasma treatment, Water Res., 2011, 45(11), 3407–3416, DOI:10.1016/j.watres.2011.03.057.
- Y. S. Mok, J. O. Jo, H. J. Lee, H. T. Ahn and J. T. Kim, Application of dielectric barrier discharge reactor immersed in wastewater to the oxidative degradation of organic contaminant, Plasma Chem. Plasma Process., 2007, 27(1), 51–64, DOI:10.1007/s11090-006-9043-1.
- Z. Stará, F. Krčma, M. Nejezchleb and J. Dušan Skalný, Organic dye decomposition by DC diaphragm discharge in water: Effect of solution properties on dye removal, Desalination, 2009, 239(1–3), 283–294, DOI:10.1016/j.desal.2008.03.025.
- A. Segrè Cohen, N. G. Love, K. K. Nace and J. Árvai, Consumers' acceptance of agricultural fertilizers derived from diverted and recycled human urine, Environ. Sci. Technol., 2020, 54(8), 5297–5305, DOI:10.1021/acs.est.0c00576.
- M. Ronteltap, M. Maurer and W. Gujer, The behaviour of pharmaceuticals and heavy metals during struvite precipitation in urine, Water Res., 2007, 41(9), 1859–1868, DOI:10.1016/j.watres.2007.01.026.
Footnote |
| † Electronic supplementary information (ESI) available. See DOI: 10.1039/d1ew00863c |
| This journal is © The Royal Society of Chemistry 2022 |