
 Open Access Article
 This Open Access Article is licensed under a
 Creative Commons Attribution 3.0 Unported Licence
Raman tweezers for tire and road wear micro- and nanoparticles analysis†
Raymond
Gillibert‡
a,
Alessandro
Magazzù
a,
Agnese
Callegari
 b,
David
Bronte-Ciriza
a,
Antonino
Foti
a,
Maria Grazia
Donato
a,
Onofrio M.
Maragò
a,
Giovanni
Volpe
b,
Marc
Lamy de La Chapelle
c,
Fabienne
Lagarde
c and
Pietro G.
Gucciardi
*a
b,
David
Bronte-Ciriza
a,
Antonino
Foti
a,
Maria Grazia
Donato
a,
Onofrio M.
Maragò
a,
Giovanni
Volpe
b,
Marc
Lamy de La Chapelle
c,
Fabienne
Lagarde
c and
Pietro G.
Gucciardi
*a
aCNR – IPCF, Istituto per i Processi Chimico-Fisici, Viale F. Stagno D'Alcontres 27, I-98158 Messina, Italy. E-mail: gucciardi@ipcf.cnr.it
bDepartment of Physics, University of Gothenburg, 41296 Gothenburg, Sweden
cInstitut des Molécules et Matériaux du Mans, UMR 6283 CNRS, Le Mans Université, Le Mans, France
First published on 9th November 2021
Abstract
Tire and road wear particles (TRWP) are non-exhaust particulate matter generated by road transport means during the mechanical abrasion of tires, brakes and roads. TRWP accumulate on the roadsides and are transported into the aquatic ecosystem during stormwater runoffs. Due to their size (sub-millimetric) and rubber content (elastomers), TRWP are considered microplastics (MPs). While the amount of the MPs polluting the water ecosystem with sizes from ∼5 μm to more than 100 μm is known, the fraction of smaller particles is unknown due to the technological gap in the detection and analysis of <5 μm MPs. Here we show that Raman tweezers, a combination of optical tweezers and Raman spectroscopy, can be used to trap and chemically analyze individual TRWPs in a liquid environment, down to the sub-micrometric scale. Using tire particles mechanically grinded from aged car tires in water solutions, we show that it is possible to optically trap individual sub-micron particles, in a so-called 2D trapping configuration, and acquire their Raman spectrum in few tens of seconds. The analysis is then extended to samples collected from a brake test platform, where we highlight the presence of sub-micrometric agglomerates of rubber and brake debris, thanks to the presence of additional spectral features other than carbon. Our results show the potential of Raman tweezers in environmental pollution analysis and highlight the formation of nanosized TRWP during wear.
Environmental significanceWe introduce Raman tweezers (RTs), a combination of optical tweezers and Raman spectroscopy, for the analysis of tires and road wear micro and nano particles dispersed in water. By using non-conventional strategies, namely 2D trapping, we can immobilize and analyze strongly light-absorbing particles from few microns to the 500 nm range (at the diffraction limit of the imaging system), in times of 1–2 minutes. Example applications are given on stone-grinded car tires fragments and on particulate sampled from a brake test platform. In both cases, small microparticles and nanoparticles are found. Thanks to the richness of information of the Raman spectra, we can identify road particulate matter, tire particles, hetero-aggregates of road minerals and rubber, and brake wear particles. |
Introduction
The emission of traffic-related particulate matter (PM) is growing in an uncontrolled manner, causing strong health and environmental concerns on the global scale.1,2 While the transition to electric-motor transportation is expected to cut the PM exhaust emission in the next ten years, this is not the case for non-exhaust PM, namely tire-, brake-, and road-wear particles,3,4 generally called tire and road wear particles (TRWPs). Tires particle (TP) emission in Europe (2014) and US (2010) is estimated in ∼106 tons per year.4,5 PM10 brake wear particles (BWPs), i.e. smaller or equal to 10 μm, are estimated to reach 80 mg per km per vehicle.3 Furthermore, the demand increase for car tires,6 associated with a market trend of heavier vehicles and of electric cars with higher instantaneous torques, is expected to yield larger quantities of TRWPs in the near future.TWRPs are often transported to the fresh aquatic system via road runoff, and from there to estuaries and oceans.7,8 About 20% of the TPs is known to be released to surface waters.8 Due to their size distribution and chemical composition, TRWPs may cause adverse effects on ecosystems and human health. For example, evidence of toxicity has been found in Daphnia magna;9,10 air-born tire dust is a probable cause of increased allergy in the general population;11 and heavy metals released by TRWPs are known to be harmful to the environment.12–14
Knowledge of the TRWP transfer pathways in the environment from roads to the aquatic system is currently incomplete, especially for the smallest particles. To address this knowledge gap and meet the challenges posed by the growing TRWPs pollution, the European TRWP platform is trying to develop an integrated knowledge of the fate of TRWPs “from road to ocean” and to highlight technological gaps for the study of micro- and nanoscale TRWPs.15
TRWPs are generated by the rolling shear of the tires on the road surface and by the friction of the brake pads on the disks.3,4 The heating and rubbing of tires during the interaction with the road pavement leads to release of rubber particles incorporating road surface material, generating elongated particles16 containing a mix of rubber, dust, asphalt, and brake dust.17–20 Brake wear leads to irregularly shaped and pointy particles that originate from the abrasion of pads, disks and calipers.20 From the chemical point of view, tires are mostly made of natural and synthetic rubbers (∼50% of the mass), typically styrene–butadiene. This elastomer is armed with organic fibers and steel cables, and is charged with carbon, silica and chalk powders. Softeners, such as oils and resins, are used to improve the grip. Zinc oxide and sulfur are used as catalyzer for the vulcanization.20 Other additives (5–10% of the mass), such as cadmium or polyaromatic hydrocarbons (PAH),9,21 are also commonly used in the tires as softeners and fillers.12,18 The chemical composition of brake wear particles reflect the components of the brake linings: phenol–formaldehyde resins (from the binders); metals such as copper and steel, ceramics and Kevlar (from the reinforcing fibres); inorganic compounds, silicates, stone and metal powders (from the fillers); graphite, carbon black, rubber, antimony trisulfide (from the lubricants); metal oxides quartz and zircon (from the abrasives).3 Due to their polymeric content, TPs are typically classified as microplastics (MPs). Given the size range of TPs, these are expected to be important contributors to micro- and nanoplastics pollution in the near future.4,8 Studies indicate TPs as 20 to 60% of the total MPs delivered to the environment,22,23 and no studies have addressed the issue of nanoplastics pollution from TPs, yet.
Wagner et al. classified tire particles based on their size as coarse (PM10, size <10 μm), fine (PM2.5, size <2.5 μm) and ultrafine (PM0.1, size <0.1 μm).4 Ultrafine TPs (1 nm to hundreds of nm) have been observed in road simulators and seem to originate from organic constituents. Coarse and fine particles (20 μm to 400 nm) are found on-road. Particles with a broader size distribution (1 to 200 μm) accumulate in road run-off. Notably, fine particles (PM2.5) also contribute to the dust air pollution. For what concerns BWPs, ca. 50% of them are constituted by particulate smaller than 25 μm, and almost 40% is emitted as airborne PM10.3
Technological gaps are present in the sampling, handling, storage, extraction and analysis of nanoplastics and no standardization exists.24 Analytical procedures to establish TRWPs in environmental samples targets at the determination of rubber and additives (metals such as Zn, or S and other organic compounds)25 as a distinctive marker for TPs, and of carbonaceous materials and metals (Fe, Cu, Zn and Pb, with Fe content reaching 60%)3 in BWPs. To date, SEM imaging with elemental analysis (energy dispersive X-ray spectroscopy, EDXS) and pyrolysis combined with gas chromatography and mass spectroscopy (Py-GC-MS) are the two election analytical techniques for such purposes. SEM is capable of imaging particles of all length scales from PM0.1 to hundreds of microns. The EDXS information is exploited to identify specific TPs markers, such as S and Zn, in TRWP dust.18 The EDXS signature is not 100% selective of TPs, however. Zn, for example, may be present also in BWPs and road paint, as well as in natural solid dirt. Py-GC-MS, can be used to identify styrene, butadiene or vinylcyclohexene as markers of rubber in TPs.26 The combination of SEM/EDXS with time-of-flight secondary ion mass spectrometry provides elemental information on the rubber component in particles of some tens of microns.27 The determination of TPs by Py-GC-MS via the presence of PAHs and aliphatic compounds is more difficult, due to their presence also in asphalt and combustion products. Finally, Py-GC-MS is destructive and is applied to the entire particulate sample, in batches of 10 to 100 μg, thus preventing analysis at the single particle level.
Raman spectroscopy28,29 is a vibrational spectroscopy allowing one to chemical identify materials based on the unique energy spectrum of the atomic nuclei vibrations in molecular compounds (the so called vibrational fingerprint). It is a non-invasive and non-destructive optical technique enabling analysis and imaging of the materials composition, structural, electronic and chemical properties of micro and nanoparticles on spatial scales generally limited by diffraction to ∼250 nm in the visible range, but that can be pushed to the nanometer and even the sub-nanometer scale using near-field optical microscopy techniques.30–33 Raman can provide information on the presence of carbonaceous species (carbon black, graphitic particles), minerals and metal oxides. The Raman fingerprint of carbon, considered by itself, may not be specific to the origin the particle (e.g. car tire, exhaust, lubricant, ash, …). Additional spectral information of the particle's constituents can, however, help in assessing its species.
The field of nano-pollution, i.e. the environmental pollution caused by nanoparticles and nanoplastics is still in its infancy and will need relevant advancements of knowledge, mainly due to the lack of analytical techniques validated by the scientific community, capable to work at such length scales.19,34–37 Optical tweezers (OT)38 exploit tightly focused laser beams to trap and manipulate micro- and nanoparticles in liquid.39 The integration of OT with Raman spectroscopy leads to Raman tweezers (RT), a powerful tool with unique capabilities for the analysis of micro and nanostructures dispersed in liquid, at the single particle level.40,41 Individual carbon nanotubes bundles and graphene flakes can be trapped and their nature probed.39,42–45 RTs have been shown to be a promising technology in the field of micro- and nanoplastics pollution in aquatic environments,46–48 thanks to their capability of single particle analysis in liquid media on timescales going from seconds to few minutes.
In this article, we show that RTs can be applied to TRWPs analysis to obtain chemical identification of micro- and sub-micron particles of artificially fragmented car tires and of environmental samples extracted from a brake testing platform. We first study the experimental configurations that allows one to stably trap and analyze TRWPs, in spite of the large optical pushing effect due to the light absorption, typical of these particles. To show the analytical capabilities of RT, we display Raman spectra of TPs of abandoned tires mechanically grinded and dispersed in water (both distilled and seawater). Micro- and nano-particles in the range of 500–850 nm are found in the solution, which can be trapped and analyzed in times of few tens of seconds. Finally, we investigate environmental samples extracted from a brake testing platform. Thanks to the presence of spectral features attributable to dust or magnetite, in addition to the Raman bands of carbon, we show the possibility to distinguish TPs from BWPs on particles featuring micron and sub-micrometric dimensions.
Materials and methods
Car tire particles
Micron- and sub-micron particles are prepared starting from pieces of old discarded car tires. They are produced by scrubbing the rubber fragments against a wet grinding stone (Norton, whetstone for quick sharpening of tools, made of Al2O3). For RT analysis, after each scrubbing cycle, the stone is rinsed repeatedly with 5 mL of distilled water in order to collect and disperse the TPs. A second sample has been made by dispersing the grinded TPs in seawater taken from the beach of Torre Faro (Messina, Italy). For conventional micro-Raman measurements, tire fragments are grinded over a microscope glass slide previously washed with soap and rinsed with optical paper, and analyzed with a standard micro-Raman spectrometer. Dimensional analysis of the particles is carried out by optical microscopy on a dried sample drop. The scrubbing procedure is observed to release some sparse micrometric particles from the grinding stone. ESI† Fig. S1 (red line) displays the typical Raman spectrum of one of such microparticles (picture in shown the inset of ESI† Fig. S1), which matches the signal acquired on the original grinding stone (ESI† Fig. S1, black line). The spectrum is dominated by the intense photoluminescence doublet of the α-Al2O3 polymorphic crystalline phase (sapphire) at 693 and 694.5 nm (appearing at wavenumber shift of 1244 and 1274 cm−1 when exciting with the 638 nm laser line of the micro-Raman setup and expected at 1372 and 1403 cm−1 on the RT setup employing a laser at 632.8 nm). Such a peculiar Raman fingerprint can be used to assess possible samples' contamination related to the preparation phase.TRWPs from a brake testing platform
TRWPs were extracted from a brake test platform after locally washing its surface with distilled water. To do so (ESI† Fig. S2), we cast 10 mL of distilled water on the platform surface and gently mix. After few minutes, a pipette is used to collect the liquid and decant it into a glass vial and immediately sealed in order to avoid contamination from airborne particles.Raman tweezers apparatus
The RT setup, shown in Fig. 1,46 is homemade and uses a single laser beam (He–Ne, wavelength λ = 633 nm) to both optically trap the particles and excite them for Raman analysis. The laser beam is expanded to overfill the entrance pupil of the microscope objective (100×, oil immersion, numerical aperture NA = 1.3), so to get a diffraction limited spot. The resulting spot will be an ellipsoid with transversal semiaxis Δr⊥ = 0.61λ/NA ∼ 300 nm and longitudinal semiaxis Δr‖ ∼ 2λ/NA2 ∼ 750 nm. The maximum laser power at the output of the objective is 8.3 mW, corresponding to a power density ∼30 mW μm−2, having assumed a diffraction-limited spot area A = π(Δr⊥)2 ≈ 0.28 μm2.49 After being reflected by an edge filter, the beam is focused by the objective into the glass microcell containing the particle dispersion. The microcell is prepared by depositing a drop (10 μL) of solution on a microscope glass slide, on which a 25 μm thick, 1 cm internal radius bi-adhesive ring was pre-attached. A 20 × 20 mm2 cover slip covers the cell, that is finally sealed on the sides with nail polish. Sealed microcells allow us to prevent water evaporation and carry out analysis on liquid dispersions for several days. The same objective is used to collect the radiation scattered by the optically trapped particles. The elastic component of the scattering is cut out by the edge or notch filter, which transmits only the Raman component to the spectrometer.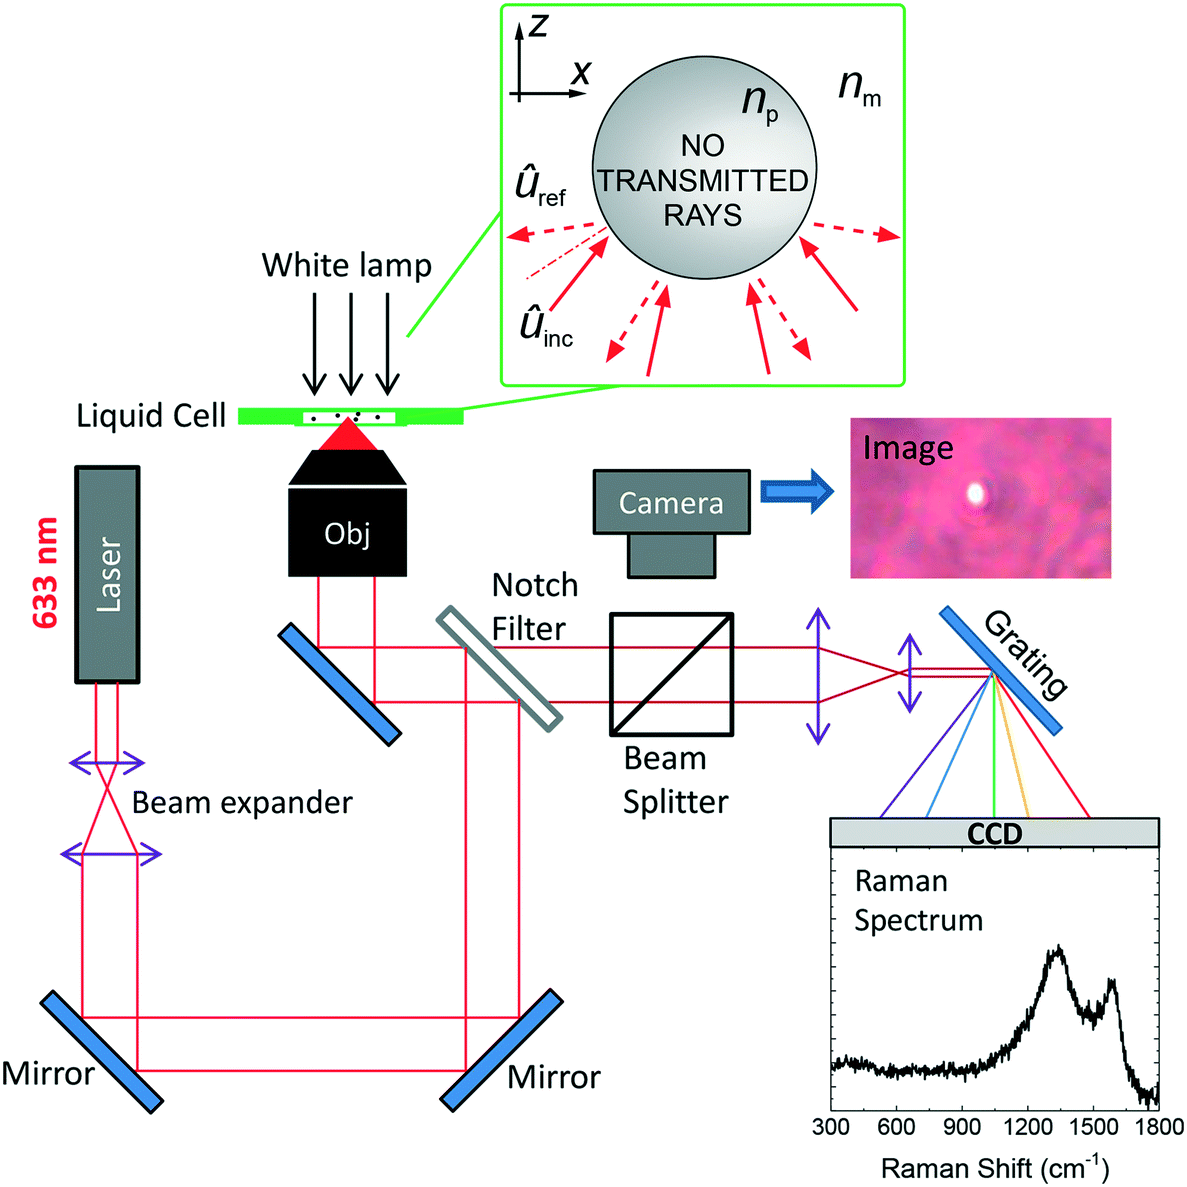 | ||
| Fig. 1 Schematic of the Raman tweezers setup. The green inset shows the sketch of the ray optics model used to calculate optical forces. ûinc and ûref are the directions of the incident and reflected beams, respectively, while np and nm are the refractive index of the particle and of the immersion medium, respectively. See text for a description of the apparatus. | ||
The latter is a Triax 190 (Horiba) equipped with a 1200 lines per mm grating giving a spectral resolution of 8 cm−1, and coupled to a silicon Peltier-cooled CCD camera. On the way to the spectrometer, a beam splitter redirects part of the light from the white light lamp to a second CMOS camera used for particle visualization and seizing. For each particle, a Raman spectrum is acquired and a reference spectrum (without any trapped particle) is subtracted in order to remove the signal from the glass slide and the medium (water, immersion oil). In order to retrieve the particle's size, an image is acquired after ensuring optimal focusing conditions. Alternatively, when we record a movie of the trapping process, we retrieve the size information from the frames in which the particle is best focused. The optical images are calibrated with a 10 μm step ruler. Particles with diameter d larger than the diffraction limit (d ≳ 500 nm for visible light using a NA = 1.3 objective) can be measured. Particles smaller than ∼500 nm provide the same diffraction-limited image, making impossible to retrieve the real particle size and/or to determine if one or more particles are actually trapped.50 In order to ensure single particle analysis, i.e. that no further particles enter the trap during the Raman acquisition, the particle is first identified and trapped on the optical microscope. After that, the spectroscopic acquisition is started. Multiple signal acquisitions on the same particle, besides improving the signal-to-noise ratio, allows us to assess the presence of anomalous intensity increases or decreases due to unintended trapping of other particles (e.g. objects floating in the laser region during Raman signal acquisition), or to an escape of the particle from the focal region due to trapping instabilities. When dealing with sub-diffraction particles, some information on the particles effective volume can be still retrieved, based on the fact that the Raman intensity is expected to scale as the particle volume. In this case a calibration curve of the Raman signal vs. particle radius on model particles would be needed.46
Raman micro-spectroscopy
A Raman micro-spectrometer (Horiba, XploRA Nano) is used to acquire spectra of the reference materials and of grinded tires microparticles on glass coverslips. Measurements are carried out at 638 nm, very close to the RT excitation wavelength (632.8 nm). We work in backscattering and use objectives 10× (NA = 0.25), 50× long working distance (NA = 0.5) and 100× in air (NA = 0.9) in order to probe different areas. The laser power is set to few mW or below, in order to avoid thermal damages to the samples. The same spectrometer is used to acquire optical images of the microparticles, with a diffraction limited image resolution of ∼850 nm in diameter with the 100× objective (resolution is worse than in the RT because of the smaller NA of the objective).Optical forces
When a particle is illuminated by a tightly focused laser beam, the exchange of linear momentum between the ray and the particle generates an optical force![[F with combining right harpoon above (vector)]](https://www.rsc.org/images/entities/i_char_0046_20d1.gif) = Δ
= Δ![[P with combining right harpoon above (vector)]](https://www.rsc.org/images/entities/i_char_0050_20d1.gif) /Δt, where Δ = inc − ref is the exchanged momentum, calculated as the difference between the incident and reflected momentum (inc and ref, respectively). Such a force can either push the particle or pull it into the focal spot.51 Stable 3D optical trapping at position
/Δt, where Δ = inc − ref is the exchanged momentum, calculated as the difference between the incident and reflected momentum (inc and ref, respectively). Such a force can either push the particle or pull it into the focal spot.51 Stable 3D optical trapping at position ![[r with combining right harpoon above (vector)]](https://www.rsc.org/images/entities/i_char_0072_20d1.gif) eq very near to the laser focus, is obtained if the total optical force tot() points towards the focal spot position (eq) for any small displacement Δ = − eq from eq. In this case eq, represents a point of stable equilibrium and, for small displacements, the restoring force is well approximated by Hooke's law
eq very near to the laser focus, is obtained if the total optical force tot() points towards the focal spot position (eq) for any small displacement Δ = − eq from eq. In this case eq, represents a point of stable equilibrium and, for small displacements, the restoring force is well approximated by Hooke's law  . Here
  is a three-dimensional tensor describing the direction-dependent stiffness of the trap. In the reference system in which the z axis coincides with the beam propagation direction and xy is the plane perpendicular to z,
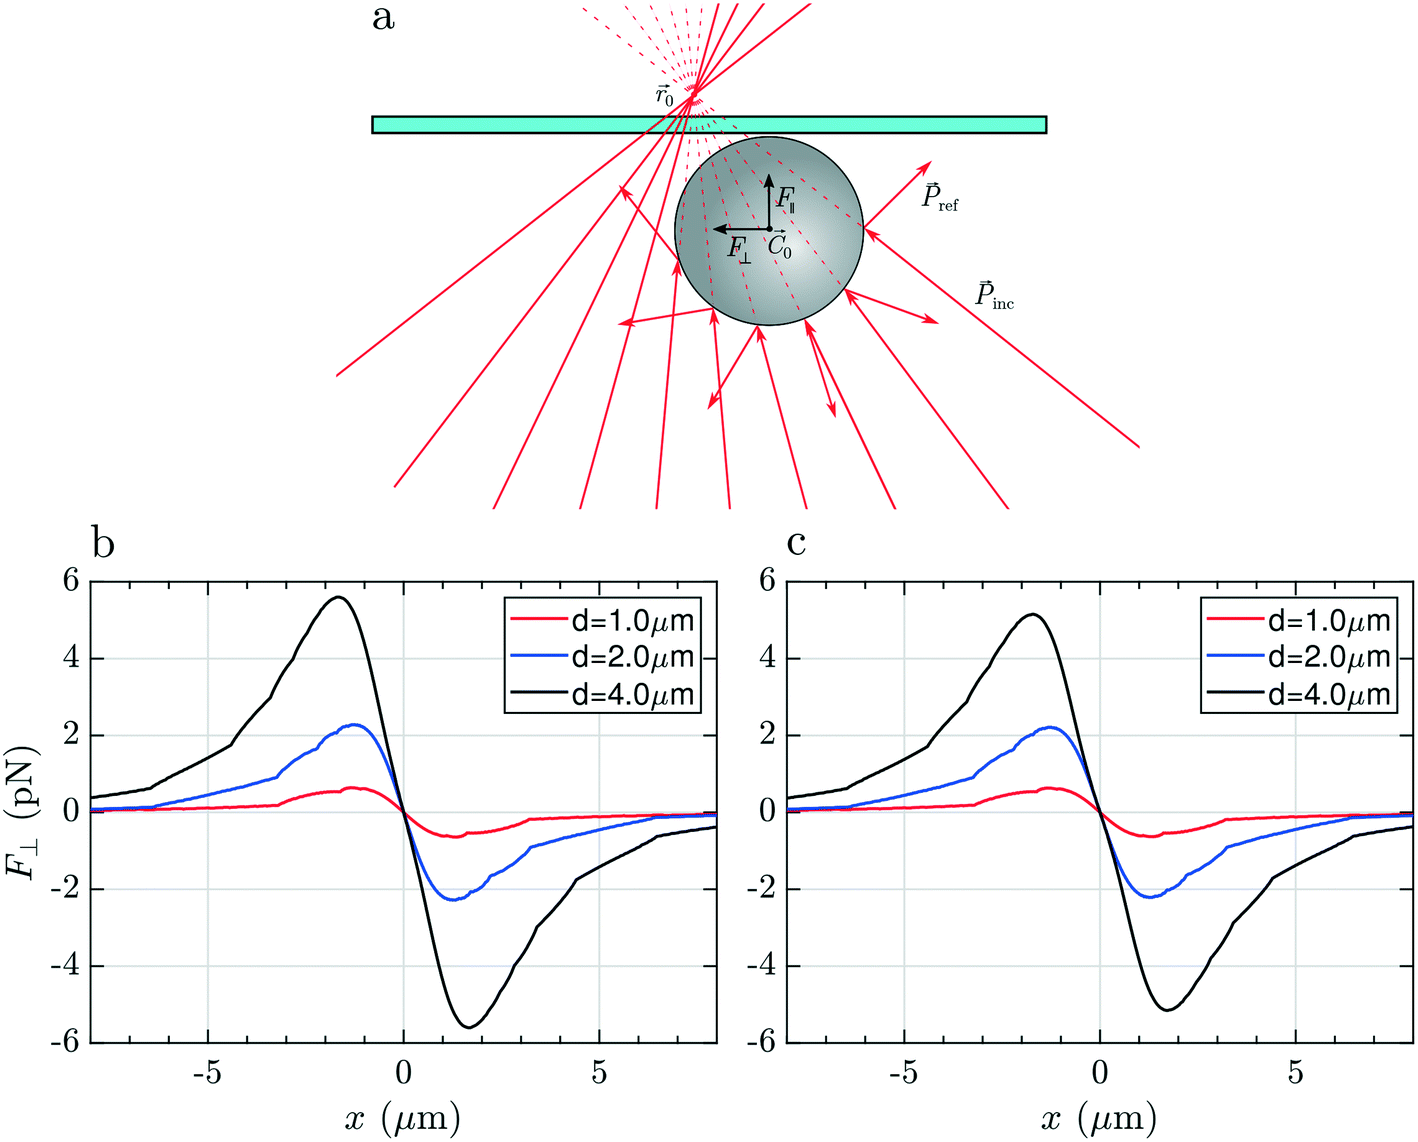
  is represented by a diagonal matrix with eigenvalues kx, ky, kz, and kx = ky. A rigorous calculation of optical forces within the electromagnetic theory, requires a full description of the light–matter interaction, which can result in a quite complex, time-consuming and unwieldy procedure. For this reason, some approximations have been developed to calculate optical forces in different regimes, depending on the particle size. In the geometrical optics approximation, valid for particles size larger than the wavelength of the trapping beam, the incoming optical field can be considered as a collection of light rays, each of them carrying a portion of the total optical power and linear momentum.52 When a ray impinges on a particle, it is partly transmitted and partly reflected by the particle surface. The change of momentum of each light ray induces a force on the particle (Newton's third law). The total optical force that a beam exerts on a particle is the sum of the forces generated by each constituting ray. Non-absorbing dielectric particles, featuring a real refractive index np, can be stably trapped in 3D whenever their refractive index is larger than that of the immersion medium nm, i.e. np > nm. This happens for the vast majority of plastics as, for example, polystyrene (np = 1.59), polypropylene (np = 1.49), polyethylene (np = 1.51) when immersed in water (nm = 1.33).46 Absorbing particles are characterized by a complex refractive index np = nr + ink, with non-zero imaginary part nk. In this case the transmitted ray is totally absorbed by the particle, resulting in a large radiation pressure that generally pushes the particle out of the optical trap. Here optical forces are calculated on micrometric particles by using an open source toolbox written in MATLAB – optical tweezers in geometrical optics (OTGO), well tested on dielectric particles.53 The routines have been modified for optical forces calculation on spherical and ellipsoidal particles, in which the Fresnel coefficients are evaluated in the case of materials with complex refractive index np (see ESI† Note 1 for further details). The laser beam is assumed to propagate along the positive z direction, be composed by an appropriate grid of rays having 40 azimuthal and 100 radial divisions and focused to the origin of the reference axes through an objective with high numerical aperture (NA = 1.3). Spherical particles are considered, immersed in water (refractive index nm = 1.33). Particles are assumed to have different diameters (d = 1, 2 and 4 μm) and made of either amorphous carbon (refractive index np = 2.4 + 0.6i) or graphite (np = 2.6 + 1.0i),54 similarly to the analyzed TRWPs in this work. With such parameters we calculate the optical force tot on a particle placed at position . Due to the cylindrical symmetry of the system around the light propagation axis, z, the x and y directions are equivalent, allowing us to consider only the displacements along the x- and z-axis for a full characterization of the optical force as a function of the position (x, z). When the particle is displaced along the propagation axis only, i.e., = (0, z), the force has a purely longitudinal component, ‖(z), directed along the axis of the beam, that is tot(0, z) = ‖(z). When we displace the particle also along x, i.e., = (x, z), the force includes also a transversal component ⊥(x, z), i.e., a component directed perpendicularly to the axis of the beam, and therefore tot(x, 0, z) = ‖(x, z) + ⊥(x, z). For symmetry reasons, ⊥(x, z) is directed along the x-axis and the component of the force along the y-axis is zero. Here we study the force ‖(z) for purely longitudinal displacements = (0, z), and ⊥(x) for purely transversal displacements = (x, 0), then we fix a value for z = z0 and we study ⊥(x, z = z0). From the behavior of ‖(z) and ⊥(x, z = z0) it is possible to predict if the particle is optically trapped or not in 3D. In order to have transversal trapping, the force ⊥(x, z = z0) should become zero for some value x = xeq, i.e., ⊥(xeq, z = z0) = 0 when the center of the particle is in xeq. If we displace the particle from xeq a little bit, the force ⊥(x, z = z0) should be directed opposite to the displacement and point towards xeq, to restore the particle to its equilibrium position. So, when x > xeq, ⊥(x, z = z0) < 0 and when x < xeq, the force should be positive: ⊥(x, z = z0) > 0.
Optical trapping of car tires micro- and nano-particles
Dimensional analysis of mechanically grinded TPs has been carried out with an optical microscope. Fig. 2a and b shows representative pictures acquired at different magnifications (a: 50× objective, b: 10× objective). The TP dust is opaque, yielding a large contrast in the images. Dimensional analysis carried out on more than 2000 particles using routines written in Mathematica. It highlights a broad distribution of sizes (Fig. 2c), ranging from microns to tens of microns. The particles' concentration rapidly decreases with increasing particle size (note the loglog scale). A large number of sub-micrometric and micrometric particles (up to 5 μm diameter) is observed, compared to a much smaller number of TPs with diameter >20 μm. Even if the distribution is likely dictated by the production method, it shows the capacity of weathered car tires to be fragmented into micrometric and even sub-micrometric particles by friction on stones of proper roughness. A variety of shapes is also observed, with circular and very elongated structures, as reported in Fig. 2d where we display a histogram of the eccentricity, , of the particles shown in Fig. 2a. Here a and b are the semiaxes of the best fitted ellipse.
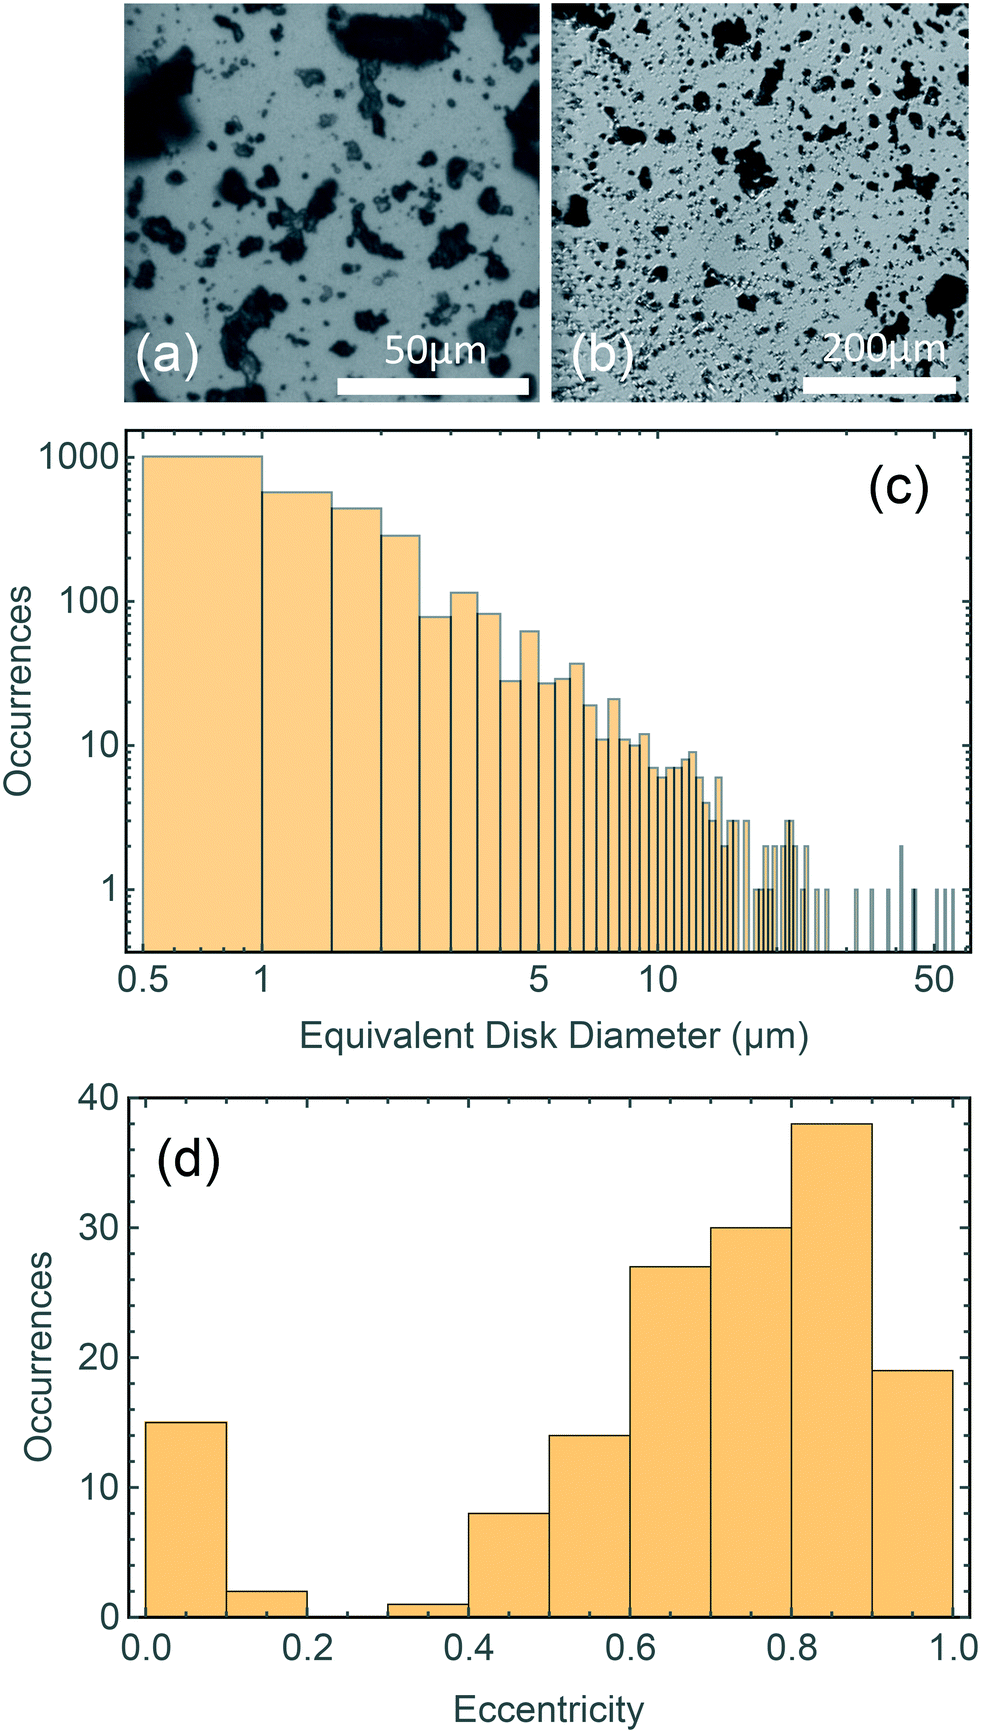 | ||
| Fig. 2 Optical images and statistical analysis of mechanically grinded TPs. (a and b) Microscopy images are acquired at different magnifications (a: 50× objective; b: 10× objective). (c) Particles' diameter distribution shown in loglog scale. (d) Plot of the distribution of the eccentricity of the particles displayed in (a). | ||
Optical trapping experiments have been carried out on TPs dispersions in distilled-water, sealed in a 25 μm-thick glass cell. Different focusing conditions have been explored, from inside the liquid (Fig. 3a), that is the most conventional configuration for optical trapping, to a configuration in which the beam focus is positioned beyond the top surface of the glass fluidic cell (Fig. 3b). When the beam is focused inside the liquid, we observe that it is not possible to stably trap TPs in 3D. As shown in ESI† Movie S1, the optical force is such that any particle intercepting the laser beam is pushed away along the light propagation direction, thus escaping from the focal region. In addition, if one tries to drive a particle into the focal region, e.g. by moving the sample with the piezo-stage, the particle is ejected out. The strong radiation pressure can, however, be turned to our advantage by pushing the particles against the top glass cell surface (ESI† Movie S2), thus obtaining some stable trapping. When this is done, the particle can be translated with respect to other floating or precipitated particles. Under such conditions, the particle remains confined in the “defocused” laser beam region (see below for more details), while the reaction of the glass surface prevents it to escape in the vertical direction. This trapping scheme is generally called 2D optical trapping, since particles are optically trapped in the bidimensional plane orthogonal to the laser beam and mechanically in the axial direction. Asymmetric particles start rotating when trapped (ESI† Movie S2).53,54
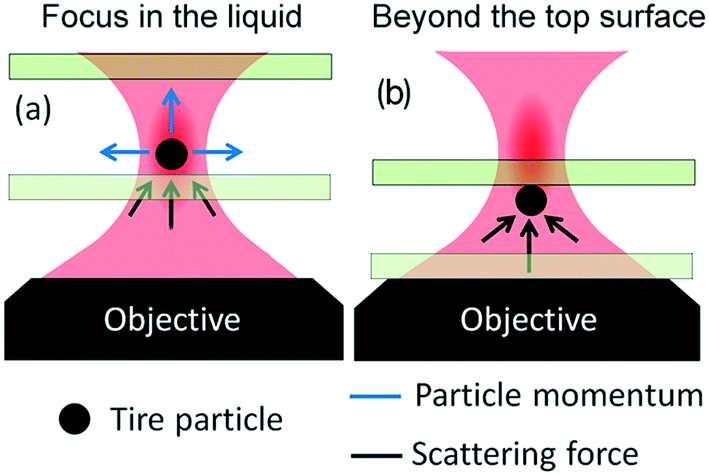 | ||
| Fig. 3 Optical trapping in different focusing conditions. (a) Focus into the liquid: particles are pushed out of the trap. (b) Focus above the top glass cell surface: stable 2D trapping is obtained by pushing the particle against the cell wall. | ||
To justify these phenomena and relate them with the optical and geometrical properties of the particles, we numerically calculate the optical forces. Here we consider model spherical carbon particles and make calculations in the ray optics approximation. Fig. 4a sketches the light rays and the associated momenta impinging on an absorbing particle when the latter is immersed in liquid, and located far from the glass cell surface, with its center (![[C with combining right harpoon above (vector)]](https://www.rsc.org/images/entities/i_char_0043_20d1.gif) 0) slightly displaced from the laser beam focus position (0). Fig. 4(b and c) and Fig. 4(d and e) show, respectively, the transversal, ⊥(x), and longitudinal component, ‖(z), of the total optical force acting on the particle as a function of the particle displacement in the transverse, x, and longitudinal, z, directions. Calculations are reported for particles with different diameters (d = 1, 2 and 4 μm), made of amorphous carbon [Fig. 4(b and d)], and graphite [Fig. 4(c and e)]. Fig. 4(b and c) provides information for what concerns the in-plane trapping. We note that the transversal force vanishes in the focus, i.e. F⊥(x) = 0 for x = 0, and acts in the same direction of the displacement, i.e. it is positive when the particle displacement is positive, and vice versa. This implies that the laser focus is an instable equilibrium position, and that the particle will be ejected once it is slightly displaced off center. The same effect is predicted for all sizes and materials, and correctly describes the experimental observations according to which the particle is ejected from the beam center when we try to pull it into it (Movie S1,† time from 00:05 to 00:007 and, in slow motion, 00:21 to 00:26). Due to the higher absorption of graphitic particles, Im(np) = 1.5, with respect to the amorphous carbon ones, Im(np) = 0.6, the optical force acting on the former is expected to be larger. Regarding the trapping in the axial direction, we note that F‖(z) is positive for any position z [Fig. 4(d and e)], i.e. the longitudinal force is always directed along the beam propagation direction, with a maximum when the particle passes through the focus of the beam (z = 0).
0) slightly displaced from the laser beam focus position (0). Fig. 4(b and c) and Fig. 4(d and e) show, respectively, the transversal, ⊥(x), and longitudinal component, ‖(z), of the total optical force acting on the particle as a function of the particle displacement in the transverse, x, and longitudinal, z, directions. Calculations are reported for particles with different diameters (d = 1, 2 and 4 μm), made of amorphous carbon [Fig. 4(b and d)], and graphite [Fig. 4(c and e)]. Fig. 4(b and c) provides information for what concerns the in-plane trapping. We note that the transversal force vanishes in the focus, i.e. F⊥(x) = 0 for x = 0, and acts in the same direction of the displacement, i.e. it is positive when the particle displacement is positive, and vice versa. This implies that the laser focus is an instable equilibrium position, and that the particle will be ejected once it is slightly displaced off center. The same effect is predicted for all sizes and materials, and correctly describes the experimental observations according to which the particle is ejected from the beam center when we try to pull it into it (Movie S1,† time from 00:05 to 00:007 and, in slow motion, 00:21 to 00:26). Due to the higher absorption of graphitic particles, Im(np) = 1.5, with respect to the amorphous carbon ones, Im(np) = 0.6, the optical force acting on the former is expected to be larger. Regarding the trapping in the axial direction, we note that F‖(z) is positive for any position z [Fig. 4(d and e)], i.e. the longitudinal force is always directed along the beam propagation direction, with a maximum when the particle passes through the focus of the beam (z = 0).
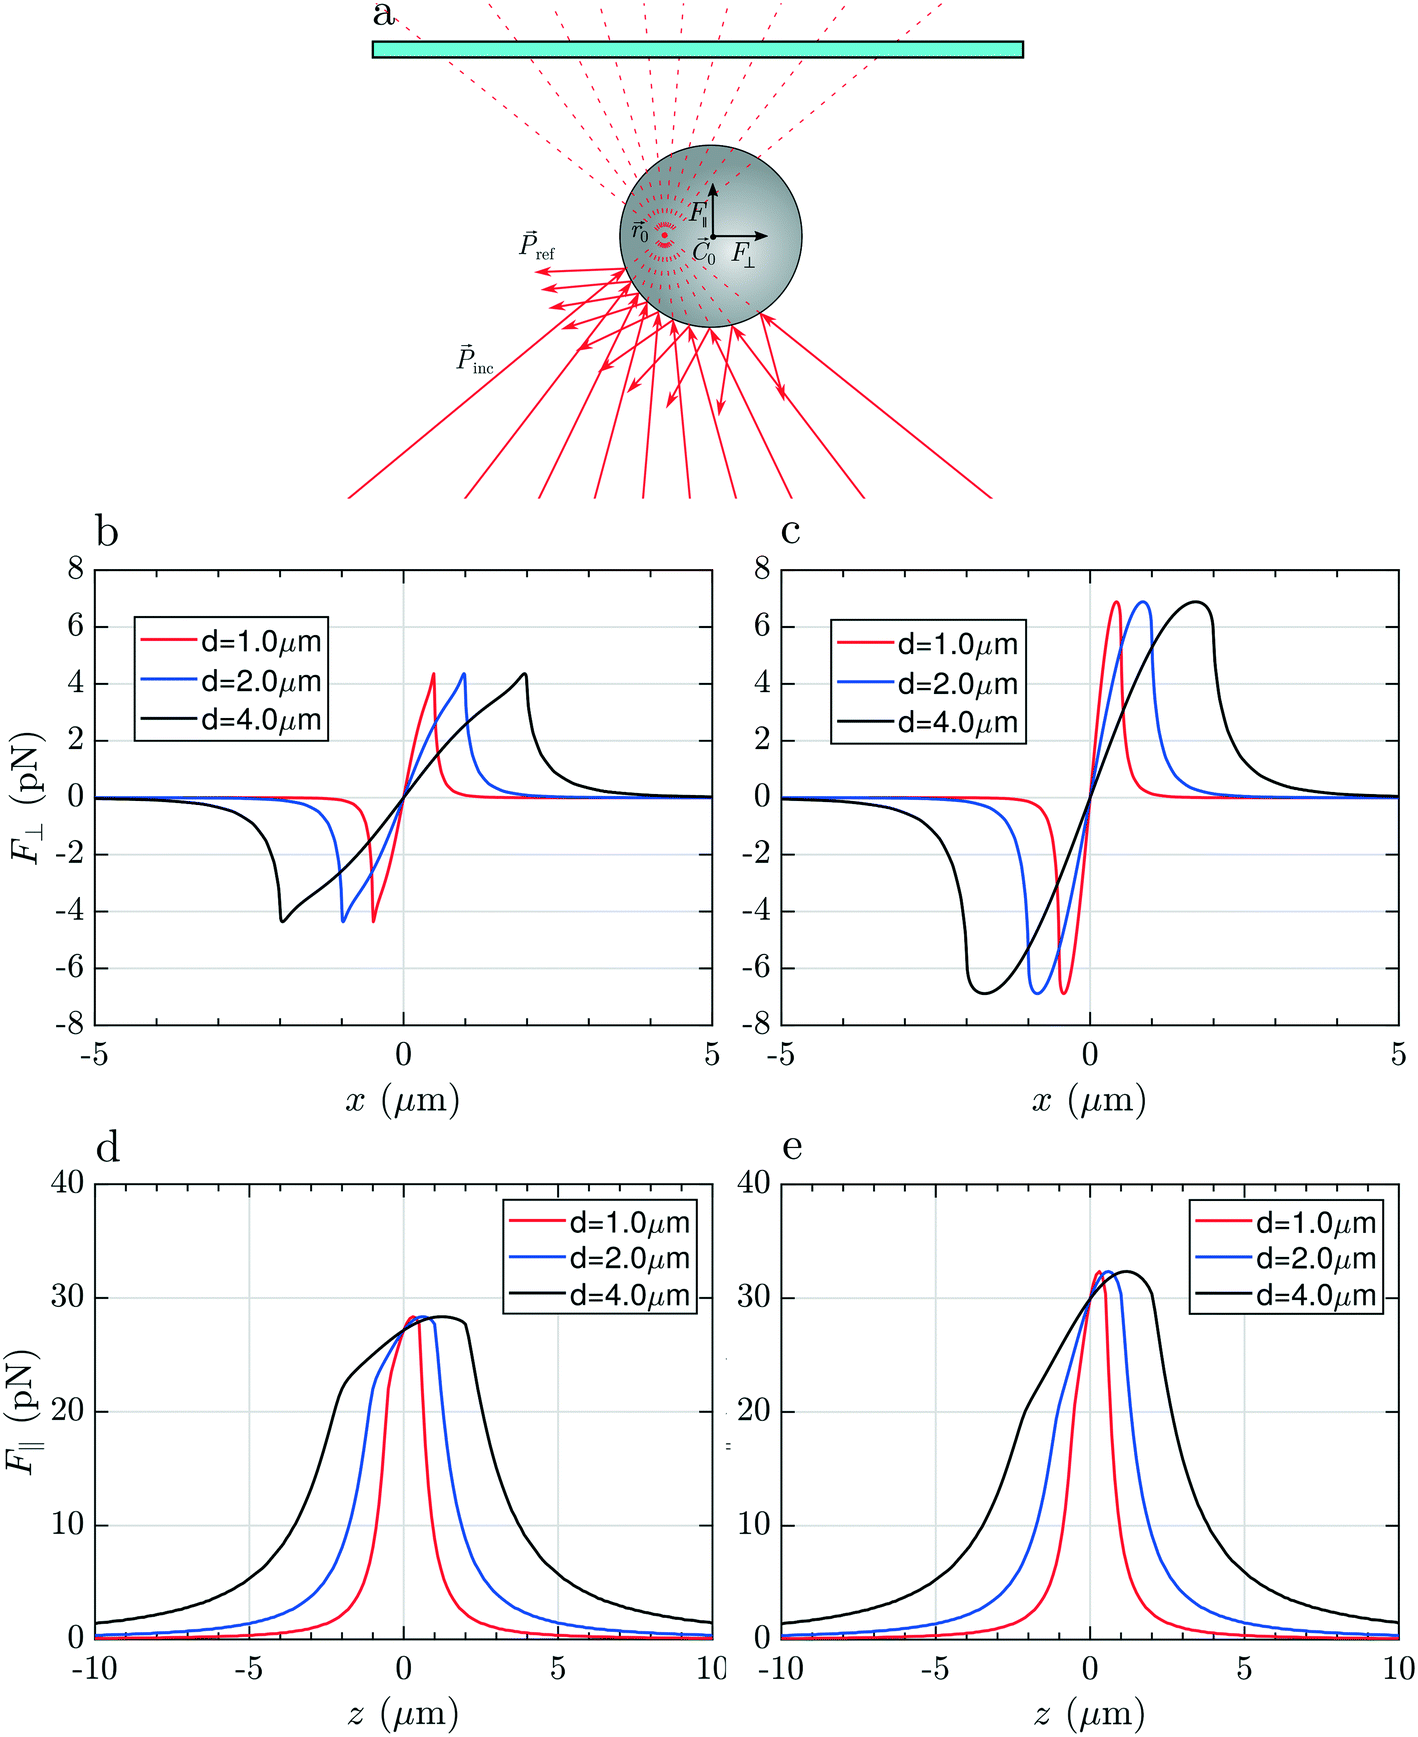 | ||
| Fig. 4 Optical forces acting on carbon microparticles in liquid. (a) Schematic representation of the rays scattered by an absorbing particle when the laser focus position 0 is in the liquid and far from the glass slide surface (cyan rectangle). The particle's center position is indicated with 0. inc and ref, represented by red arrows, are the incident and reflected linear momenta associated to each light ray. The red dashed lines represent the continuation of the impinging rays, and are a guide to eye to the position of the beam focus. The directions of ‖ and ⊥ are represented by black arrows originating from the particle center 0. Transversal (b and c) and longitudinal (d and e) components of the optical force calculated on amorphous carbon (b and d) and graphitic particles (c and e). We consider particles with diameter d = 1 μm (red), 2 μm (blue), and 4 μm (black). | ||
The particle is expected to be pushed along the beam direction, as observed experimentally (Movie S1,† 0:00 to 0:03 and, in slow motion, 00:15 to 00:20). In conclusion, no stable 3D trapping is possible for carbon particles in liquid using 633 nm light, due to absorption and the consequent large radiation pressure. Pushing and ejection from the laser focus region is predicted and experimentally observed for any position of the beam focus, 0, inside the liquid.
In Fig. 5(a) we show the case of a laser beam focused in liquid, close to the top surface of the glass microcell (the distance of 0 from the surface is smaller than the radius of the particle). Looking at the trend of the transversal force, F⊥(x), in Fig. 5(b and c), ejection from the central position, x = 0, is expected, again, for all particles' sizes and materials. It is noteworthy that, compared to the previous case, now there are several equilibrium positions along the transverse direction, i.e. xn for which F⊥(xn) = 0. The point x0 = 0 is unstable, because a displacement determines a force of the same sign. However, the off-center equilibrium positions, x±1, highlighted by red arrows in Fig. 5(b and c), are potentially stable because the force corresponding to a displacement is opposite in sign, and so it is in the right direction for restoring the particle to the equilibrium. Because of the cylindrical symmetry, this corresponds to a circumference of equilibrium points. The particle is potentially trapped in the transversal direction and free to move along the circumference of radius x±1. The effective stability of the off-center equilibrium points depends on how stiff the trap is in that point: if it is too weak, the particle can escape easily because of Brownian fluctuations. For what concerns the longitudinal trapping, also in this case the values of F‖(z) are always positive due to the prevailing radiation pressure. In this configuration the particle is pushed against the cell surface and, due to the reaction force exerted by the surface, the net force acting on it along the z direction will be zero. In conclusion, focusing the light very close to the glass surface, leads to pushing of the particle against the top glass surface, but the particle will likely be trapped off-center or escape from the sides.
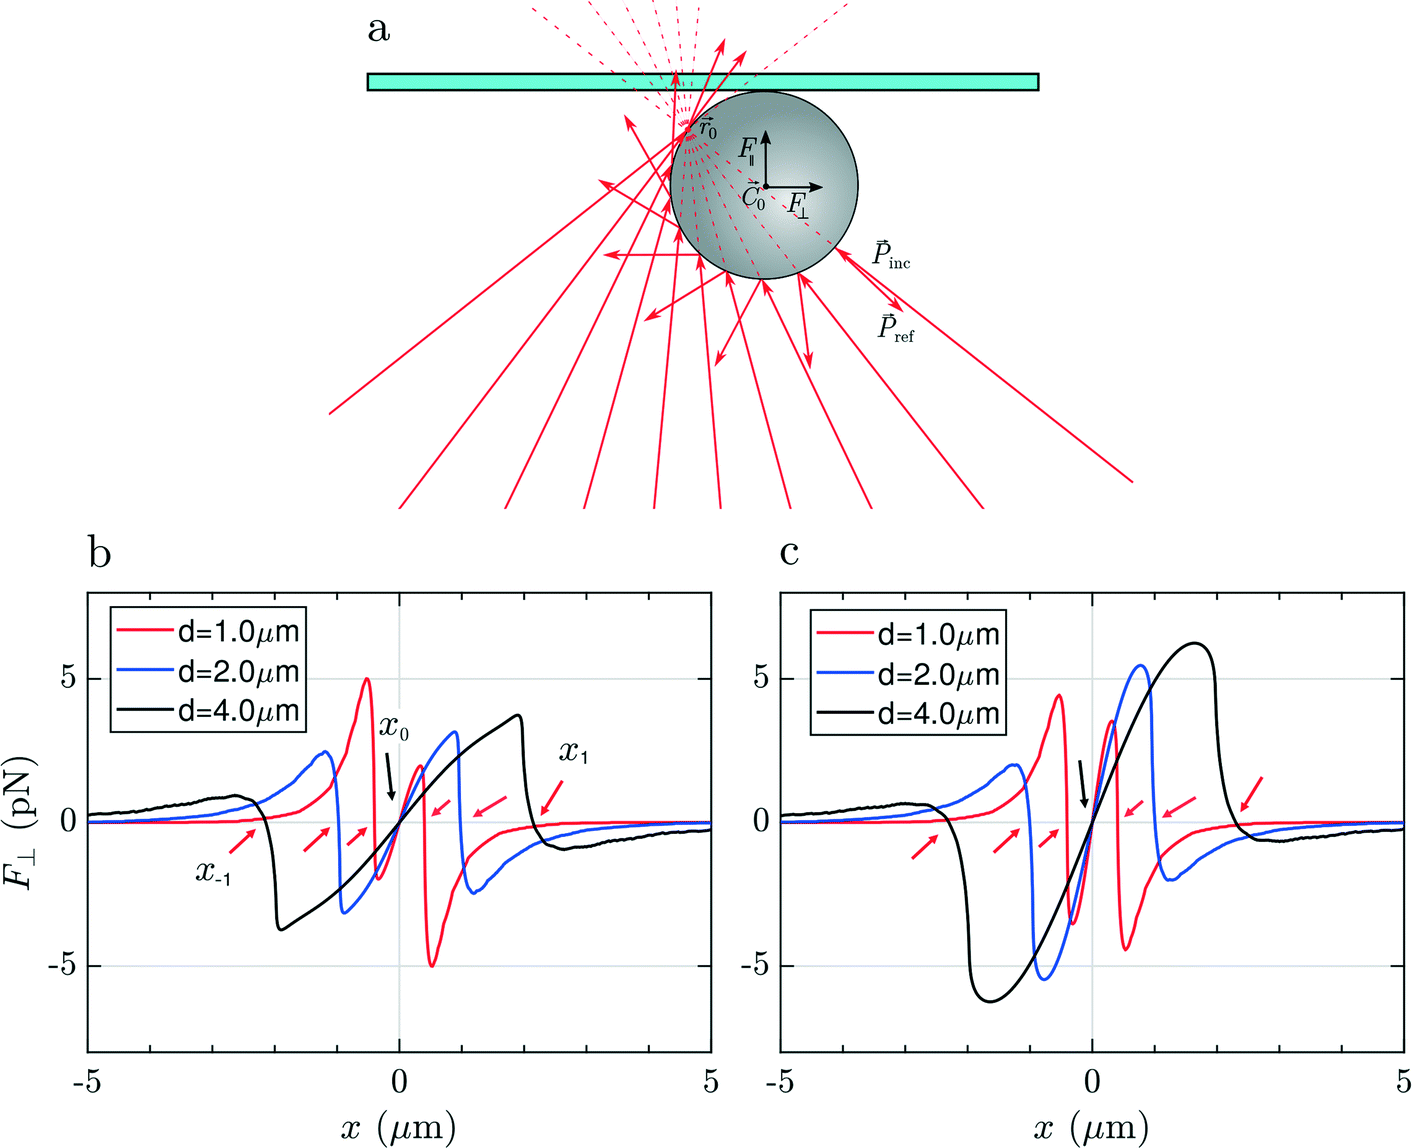 | ||
| Fig. 5 Optical forces acting on carbon microparticles close to the microcell surface. (a) Schematic of the scattered rays impinging on an absorbing particle when the laser focus position, 0, is very close to the top glass surface (cyan rectangle), beyond the particle center 0. inc and ref, represented by red arrows, are the incident and reflected linear momenta associated to each light ray. The red dashed lines represent the continuation of the impinging rays, and are a guide to eye to the position of the beam focus. The directions of F‖ and F⊥ are represented by black arrows. Transversal component of the optical force F⊥(x) calculated on amorphous carbon (b) and graphite (c) particles for different diameters d = 1 μm (red), 2 μm (blue), and 4 μm (black). The arrows highlight stable (red) and unstable (black) equilibrium positions where the force vanishes. | ||
Finally, if we focus the laser beyond the surface of the glass slide (Fig. 6a), the rays will impinge on the particle surface with different angles compared to the previous two cases, producing a linear momentum exchange which results in a Hooke-like restoring transversal force, F⊥(x) = −kxx, for small displacements of particle along the x direction, as illustrated in Fig. 6(b and c). This force recalls the particle towards the equilibrium position, x = 0, i.e. towards the optical axis, whenever it is slightly displaced in the transversal direction, providing stable 2D optical trapping. Differently from the two other cases, we note that the maximum expected force strongly depends on the particle size. This is likely due to the fact that the laser beam at the particle's center position is highly defocused. As a consequence, a bigger particle will intercept a larger number of rays, being subject to a more intense momentum exchange and, finally, to a larger force.
 | ||
| Fig. 6 Optical forces acting on carbon microparticles when focusing beyond the glass cell surface. (a) Schematic representation of the scattered rays by an absorbing particle constrained vertically by the top of the cover glass (cyan rectangle). The laser focus 0 is positioned beyond the first surface of the cover glass. inc and ref are the incident and reflected linear momenta, respectively, and are represented by red arrows. Red dashed lines represent the continuation of the impinging rays in order to show the position of 0, represented by a red dot. The direction of F‖ and F⊥ is represented by black arrows. Transversal component of the optical force F⊥ calculated on of amorphous carbon (b) and graphite particles (c) having dimeter d = 1 (red), 2 (blue), and 3 (black) μm. | ||
As in the previous configurations, the longitudinal force (curves not shown) is always positive and will push the particle against the glass surface but, once the particle is in contact with this latter, the mechanical constraint reaction of the surface will provide stable trapping also in the axial dimension. Focusing the laser above the top surface, it is therefore possible to trap, analyze and even manipulate absorbing particles by pushing them on the glass surface, as shown in ESI† Movie S2.
Two other effects are observed when trying to trap carbon particles. Firstly, when full laser power is focused onto aggregates of TPs in liquid (ca. 8.3 mW on an area of 0.36 μm2), the generated optical forces are sufficient to disintegrate the aggregate into its smaller constituents (ESI† Movie S3) and scatter them all around. Secondly, when the laser is tightly focused on individual TP particles, light absorption and local heating yields to micro-cavitation and bubbles generation (ESI† Movie S4, time 00:00 to 00:09). The thermal gradients generated by the local laser-induced heating generate convective fluxes in the liquid that, in turn, activate thermophoretic effects resulting in the drag of particles towards the laser spot where they stick (ESI† Movie S4, time 00:10 to 00:22). A similar effect, called thermophoretic trapping, is generated when irradiating plasmonic metal nanoparticles in liquid.55,56 Notably, local sample heating is specific to strongly absorbing objects, like carbonaceous particles. No bubbling or thermal damage was observed on conventional polymers or mineral sediments using even higher laser powers.46
We can conclude this section saying that, in order to trap individual TRWPs and perform spectroscopic analysis of individual particles, a viable way is to push the particle with full laser power towards the top surface of the liquid cell, being careful not to directly focus the laser on the particle. This ensures that, whenever the particle reaches the top cell surface it remains confined in the focal region and, because of the smaller local density of power, it does not heat up significantly, nor generate bubbles or trigger thermophoretic dragging of other particles. We observed that most of the time the particle would stick to the glass substrate and stay there even with the laser turned off, due to surface adhesion forces.
Raman spectroscopy of optical trapped TRWP micro- and nano-particles
First experiments have been carried out on mechanically grinded TRWPs in distilled water, after being stably trapped in 2D. Fig. 7(a–e) shows the optical images of particles ranging from 600 nm to 4.6 μm in diameter, together with their Raman spectra in Fig. 7(f). Spectra of the particles Fig. 7(a–d) were acquired with a defocused laser beam, in order to achieve 2D trapping. The spectrum of the particle in Fig. 7(e) was measured with total power focused just above the glass surface. On all TPs, we observe a Raman spectrum typical of carbon black (amorphous carbon), with bands at 1320 cm−1 (D band) and 1580 cm−1 (G band). The G band is related to the bond stretching of all pairs of sp2 bonded atoms in rings and chains, and corresponds to a degenerate in-plane E2g optical mode at the center of the Brillouin zone. The D band is observed when there is a symmetry breaking of the sp2 hexagonal lattices, involving a defect-induced electron–hole “inter-valley” double resonance process that activates a transverse optical phonon close to the Brillouin zone boundary K point.57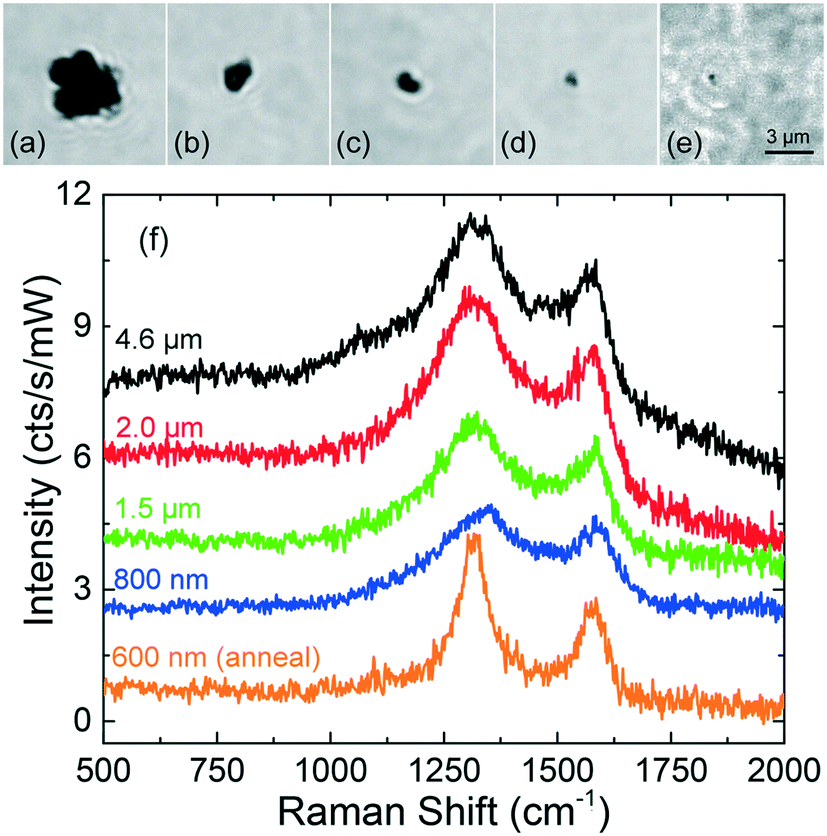 | ||
| Fig. 7 Optical images (a–e) and Raman spectra (f) of 2D-trapped TPs in distilled water. Particles sizes are: (a) of 4.6 μm, (b) 2.0 μm, (c) 1.5 μm and (d) 800 nm, (e) 600 nm. Acquisition time 60 s for two acquisitions. Laser power out of the objective: 8.3 mW. Raman spectra are acquired with defocused laser for particles (a–d) and with total power focused just above the glass surface (e). All spectra are offset for clarity. | ||
The intensity of the bands is not very sensitive to the size of the particle. This is due to two reasons: first, because the carbon particles are very absorptive and only a thin layer of carbon is effectively irradiated; second, because in 2D trapping conditions the beam is defocused. Since for larger particles a stronger defocusing is needed to achieve stable trapping, a greater loss of Raman signal is expected, justifying why the signal from larger particles is similar to that from smaller ones. The smallest particle we trapped (Fig. 7e) was elongated with a size of 600 × 800 nm, comparable to the laser spot size. The particle upon pushing stably stuck onto the glass cell. Focusing maximum power on it generated a steam bubble for one second and the spectrum acquired just after this annealing presents much sharper bands than those of the other tire particles. The narrowing of the band widths is generally associated to an increase of the crystallites sizes.58,59 We can attribute this to the crystallization of the amorphous carbon content in the tire particle induced by the laser heating;60 this indicates that with such laser power one should be aware that the full power density can alter the TPs structure. Further experiments have been done diluting the tire particles in sea water. Again, we can trap in 2D and identify carbon-rich particles down to dimensions as small as 500 nm (ESI† Fig. S3), unambiguously differentiating them from sediments (spectra reported in ref. 56). Regarding the smallest observed particles, since we are at the diffraction limit, we cannot exclude that its actual diameter is less than 500 nm. These results prove that, on the one side, abrasion of TPs on finely textured stones leads to the formation of nanoscale particles and, on the other hand, that at 633 nm RTs can be used for analysis of such nanoplastics, in time scales of one to two minutes.
Some other interesting features have been observed. Micrometric scale TPs with clear zones decorated by black spots (Fig. 8a) have been found, associated with a Raman spectrum (Fig. 8d, blue line) characterized by the simultaneous fingerprints of carbon black and TiO2 in the rutile phase (doublet at 443 and 605 cm−1).29 This suggests the occurrence of hetero-aggregates containing the mineral mixed with rubber. Similarly, we find that TPs aggregates characterized by whitish zones at the optical microscope [Fig. 8(b and c)] are actually composed of a mixture of carbon black and gypsum.
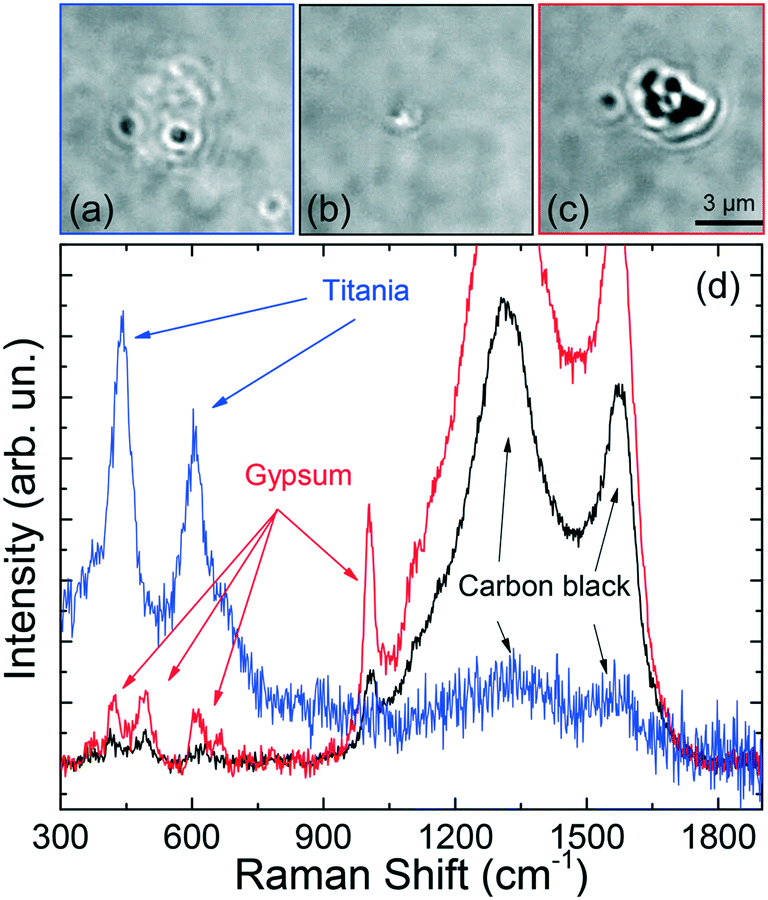 | ||
| Fig. 8 Optical images (a–c) of TPs containing a rubber and a mineral part, together with their Raman spectra (d). The blue line refers to image (a), black line to (b), red line to (c). Integration time 60 s, 2 acquisitions. | ||
The Raman spectra (Fig. 8d, black and red lines) display, in fact, the two intense carbon black bands, together with the peaks of CaSO4 – 2H2O (calcium sulfate dihydrate) at 415, 490, 615, 665, and 1004 cm−1.61 For this latter case a commercial software (Wiley, KnowItAll 2020) has been used for first materials assignment. The particle in Fig. 8(b) has diameter around 1 μm, with a black TP component ca. 600 nm large, i.e. in the nanoscale range. The presence of gypsum in traffic-related PM and TRWP s is well known.20 What is interesting here is the capability of RT to detect TPs-mineral aggregates of dimensions down to 1 μm, composed by sub-components of nanometric scale. The richness of the spectral features, beyond the simple Raman bands of carbon, allows us to drive conclusions on the actual origin of the detected particle. The fact that the analysis can be accomplished in liquid environment, on a single particle level and in minutes, is a further unique advantage of RT with respect to conventional Raman analysis which is limited to ensemble measurements when applied to very dense particles dispersions. The absence of the alumina spectral fingerprint in the analyzed particles excludes any contamination of the set of particles analyzed. The spectral assignment and the conclusions on the particle's origin, have been confirmed by conventional micro-Raman analysis on the constituent materials, namely gypsum (from a piece of chalk), rutile (from a piece of road paint), carbon (from a cut made in a car tire). ESI† Fig. S4 displays the micro-Raman reference spectra (a) superposed to those of the trapped particles (b). Carbon black has bands centered at 1344 and 1585 cm−1. Gypsum has peaks at 409, 489, 614, 666, 1004 and 1134 cm−1. Rutile has peaks at 442 and 607 cm−1. All these modes match the Raman emission observed in the trapped particles. The presence of both homogeneous and heterogeneous particles has also been confirmed by standard micro-Raman spectroscopy of grinded powders of car tires. ESI† Fig. S5 shows the presence of micrometric particles of tires (a) and graphite (b), together with heterogeneous carbon-calcite particles [images in (c), spectra in (d)]. In this latter case we observe three closely spaced particles (A, B, C in the optical image) whose composition varies from purely carbonic for particle C (d, black line) to an increasing mixture of calcite and carbon for particles B and A (d, red and green lines). The reference spectrum of calcite is added to support the material assignment (d, blue line). Finally, in ESI† Fig. S5 we show the picture (e) and Raman spectra (f) taken at different positions of a larger micrometric heterogeneous particle. Here we see the presence of rutile in zone B (f, black line, peaks at 440 and 605 cm−1) mixed to a fluorescent composite (giving a band beyond 1000 cm−1) whose chemical nature we are not able to assign. This latter is present in the remaining part of the particle (zone A). Alumina micrometric particles have also been found (ESI† Fig. S1), arising from the fragmentation of the grinding stone (see discussion in the Methods section).
Finally, we present the results on the trapping and Raman analysis of TRWPs extracted from a brake test platform. To show the potentialities of the RT technique, we have analyzed 12 particles with dimensions from 4.5 μm down to 600 nm. Fig. 9 shows the optical images and Raman spectra of representative particles made of TiO2 rutile [Fig. 9(a and e) – black and green lines] and carbon black [Fig. 9(b and e) – red line]. The presence of rutile can be attributed to small residues of road paint.62 Carbon black is the fingerprint of tire particles, although at this stage we cannot exclude an origin related to exhaust combustion particles. In our ensemble we found 3 rutile particles with dimensions of 1.6 × 0.5 μm (image in Fig. 9a, spectrum in Fig. 9e – green line), 850 nm (spectrum in Fig. 9e – black line) and 2.2 μm (spectra not shown), and 4 carbon black particles with dimensions from 2.4 μm (image in Fig. 9b, spectrum in Fig. 9e – red line) to 1.1 μm (spectra not shown). Particles of smaller dimensions in Fig. 9c (size 700 × 500 nm) and Fig. 9d (size 600 nm), namely in the nanoscale regime, show even more interesting Raman spectra. Together with the amorphous carbon peaks, we find a single additional band around 665 cm−1 (Fig. 9e, cyan line) for the particle in (c), and several further peaks (Fig. 9e, blue line) for the particle in (d), suggesting that we are dealing heterogeneous composites. The band at 665 cm−1 is typical of magnetite (Fe3O4),63,64 used as abrasive material in brake pads.3,65 Consequently, the particle in (c) is likely a brake nanoparticle with a carbon content coming from intrinsic constituents, e.g. burnt lubricant. The complex spectrum of the 600 nm nanoparticle in (d) has been also observed on a 3.6 μm diameter structure, with higher signal-to-noise ratio (inset of Fig. 9e, black line). The strong band at 660 cm−1 suggests the presence of some iron oxide species but, this time, it shows up side by side with a peak at 610 cm−1 and other peaks at 300, 414 and 500 cm−1.
 | ||
| Fig. 9 Optical images (a–d) and Raman spectra (e) of trapped particles sampled from a brake test platform. Particles sizes are: (a) 1.6 × 0.5 μm, (b) 2.4 μm, (c) 700 × 500 nm and (d) 600 nm. Raman spectra: green line refers to particle (a), red line to particle (b), cyan line to particle (c), blue line to particle (d). The black line refers to a smaller, 850 nm, rutile particle (image not shown). The inset shows a zoom of the spectrum acquired on a 3.6 μm composite particle (black line) with a reconstruction (red line) carried out from commercial Raman libraries. Acquisition time: 30 s, two acquisitions. All spectra are offset for clarity. | ||
The peaks at 300, 410 cm−1 together with the doublet 610–660 cm−1 are software-assigned (Bio-Rad, KnowItAll) to the Raman emission of red ochre and burnt sienna,66 the peak at 500 cm−1 is assigned to lead oxide, the two major bands at 1325 and 1587 cm−1 to carbon black. The red line in the inset of Fig. 9e is the software-reconstructed overall spectrum, which fits well with the experiment. Lead oxide is a component of brake friction materials.67 Red ochre and burnt sienna are red-colored powders obtained from the intense heating, i.e. calcination, of limonite and raw sienna earths, minerals present in iron-oxide rich earths found in Sicily. The simultaneous occurrence of lead oxide, calcinated minerals and carbon black is compatible with the spectrum expected from a heterogeneous structure composed of a fragment of braking pads and road dust particle that has undergone intense heating, e.g. during braking, covered by some lubricant layer (carbon rich). In order to support this conclusion, in ESI† Fig. S6 we show conventional micro-Raman spectra acquired on a burnt sienna paste commercially available (a and b, green lines), and on the surface of a used brake pad gathered from a mechanical workshop (a and b, blue lines). The samples' pictures are shown in the insets. Burnt sienna shows the most intense peaks at 295, 412, 614 cm−1, with smaller emission at 501 and 660 cm−1, and a single peak at 1316 cm−1 in the higher frequency region. The brake pad signal shows intense features at 278 cm−1 and in the amorphous carbon region at 1324 and 1585 cm−1. Characteristic is also the peak at 388 cm−1 and the emission around 655 cm−1, in the zone of magnetite. The close correspondence of the reference materials spectra with the spectrum of the trapped particle (c and d) is highlighted by the asterisks.
Based on the experiments shown we can draw some considerations on the information provided by Raman tweezers in the field of TRWP. RT allows one to analyze individual carbon-rich micro and nanoparticles in water, by isolating them one by one. Indeed, the carbon fingerprint observed on TPs has little specificity, if any, and the actual origin of the particle (tires particle, exhaust particle, lubricant, …) is almost impossible to be determined, d'emblée, unless some pre-knowledge of the sample is present. On the other hand, based on additional spectral features that can be found in the Raman spectra, some more specific information on the actual composition and origin of the investigated particle can be acquired. It is well known that tires capture particles from the road, releasing micrometric particles of complex chemical nature into the environment upon friction and abrasion. Heterogeneous particles consisting of agglomerates of rubber, road material and dust are commonly observed,26,27 a fraction of which will end its life into the watery systems. The water quality of the aquatic systems will be influenced at different scales. In the literature focus have been given to study the leach of tires components at the molecular scale, among which iron and manganese, as well as of zinc. The release of PAH, used as additive, is also reported (see ref. 4 for a review). Toxicological studies have been focused on the interaction of the leachates of artificially fabricated tires particles with the bioma, showing toxic and sub-lethal effects, although only at concentrations much higher than what is normally found in the environment. Very little is known on the potential impact of nano-TRWP in the environment. Nano-TRWP can be of primary origin, that is produced during tire abrasion and brake pad friction, or of secondary origin, that is due to degradation and fragmentation of larger microparticles, caused by oxidation, mechanical stress or microbial colonization (especially in water). Our observations show that heterogenous particles are produced even at the sub-micrometric scale. The small scale of such particles adds a peculiar difference to larger micrometric particles: they will keep dispersed in the liquid medium with negligible sedimentation. This, together with the more complex chemical composition of the hetero-aggregates, potentially creates additional sources of risk, because of the cumulative effect of the different materials interacting with the organisms, and because of the possible presence of pollutants released also by the non-elastomeric fraction of the particle. In order to assess the risk of nano-TRWP in the aquatic systems, the size, concentration and heterogeneous composition of the particles will have to be taken into account.
Strengths, limitations and future developments
Advantages of using RT
RT allows one to perform chemical particles' analysis in a liquid medium, without the need of drying the sample. Size overestimations, due to aggregation of the particles during the water evaporation, are thus avoided. This represents a major advantage with respect to SEM/EDX or micro-FT-IR, that are not capable to work in water. RT provides a unique advantage also with respect to conventional Raman/microRaman spectroscopy. This latter technique, although suitable for investigating particles dispersions in liquids, provides results limited to ensemble averages of particles fluctuating inside the irradiation volume. Optical trapping, instead, grants the possibility to immobilize individual particles under the laser spot for the time needed to acquire a Raman spectrum (seconds to minutes). RT is therefore the only tool available for single particle analysis of micro and nanoplastics in liquid environment.Particles' size issues
As a rule of thumb RT find application in the analysis of particles with diameter up to 5 μm. In this size range, in fact, particles fluctuate in the liquid, subject to Brownian motion. Tires materials, featuring a density (∼0.950 g cm−3)4,68 close to plastics,46 behave similarly. Particles larger than 5 μm, instead, do precipitate and lay on the surface of the glass microcell (top or bottom surface, depending on whether the material density is smaller or larger compared to the liquid medium). Precipitated particles can be investigated too, using the RT setup as a conventional micro-Raman spectrometer, by simply focusing the laser spot on their surface.From the sensitivity point of view, the potential of RT is enormous. Individual polystyrene particles as small as 40 nm have been trapped and their Raman signal detected, although powerful lasers are needed and interferential methods have to be implemented to assess the trapping.39,69 Difficulties in this case emerge from the fact that the visibility of particles smaller than 100 nm in water is low and only aggregates can be easily spotted and trapped in the solution.46 Tagging particles with fluorescent dyes could be of help in this case,70,71 since the contrast would be very much increased.
Here we have shown that individual TRWP particles with size down to the diffraction limit (500 nm or smaller, for the motivations explained below) can be trapped in 2D and Raman-analyzed with a laser power <10 mW at 632.8 nm. We can expect more difficulties for trapping smaller TRWP nanoparticles. More intense lasers are, in fact, required (hundreds of mW) and the particles' heating could trigger fluidic instabilities destabilizing the optical trap. Annealing effects could, as observed, alter the measured Raman fingerprint. The use of lasers at longer wavelengths, where absorption is expected to be smaller, could improve the situation. A trade off will have to be found, however, since the scaling of the Raman signal as λ−4 will yield smaller and smaller signals as we shift towards the near-infrared region. Two-beams RT setups, in which one powerful near-infrared laser is used for trapping and a less intense on emitting in the visible serves to excite Raman, could be a viable solution. Experiments on TRWP particles of controlled dimensions will shed more light on the ultimate sensitivity limit of RT in this field.
For what concerns the particles' size determination, objects of diameter d ≥ 500–600 nm can be reliably measured from their optical image. Due to diffraction,50 smaller particles will produce an image corresponding to a particle of diameter d ∼ 500 nm, independently from their actual size. When such images are observed, it must be kept in mind that the actual size of the object could be smaller than the one actually measured. The ideal application size range of RT, in which we can both measure the particle size and acquire their Raman fingerprint in reasonable times, is therefore comprised between 500 nm and 5 μm. Below 500 nm, and down to ∼50 nm, we can still detect the presence of nanoplastics, but it is no more straightforward to retrieve information on their actual size.
Particles' concentration
Using PS particles' dispersions of known concentration, our experience suggests that for a RT apparatus exploiting a 100× oil- or water-immersion objectives, in which the sample is contained in sealed glass cells of volume ranging from 20 to 80 μL, the concentration of particles needed to readily carry out a Raman analysis is ∼5 × 10⁵ particles per mL. At smaller concentrations, it becomes difficult to spot the particles in the limited field of view of the microscope (some hundreds of microns). At concentrations higher than 108 particles per mL particles dilution is needed. The environment gets, in fact, too crowded and the probability that more than one particle enters the trap during the spectrum acquisition becomes incompatible with single particle analysis. The simultaneous use of objectives of smaller magnification to locate the particle on a wider field of view and bring it into the field of view of the 100× objective used for trapping and analysis could potentially decrease by a factor 10–100 the minimum concentration. The implementation of microfluidic circuits,47 allowing one to operate in a stream of liquid, can be a more sophisticated solution towards the analysis of volumes much larger than the 80 μL of standard glass cells. Future work in this field will regard the implementation of automatized devices capable to drive and stop the flow when a particle is in the field of view of the RT and automatically drive the particle under the laser spot. The integration of artificial intelligence for particles' shape recognition72 and Raman spectra recognition could be a way to speed up the entire process, towards real world applications.Selectivity of the method
The selectivity of RT, that is the capacity to discern different materials, is inherited from Raman spectroscopy. Conventional plastics can be unambiguously discriminated and discerned from carbonaceous species, minerals and biological matter.46 The composition of heterogenous particles can be also assessed. Indeed, the presence of fluorescent substances, hinders the applicability of this technique, because of the much higher fluorescence yield with respect to Raman scattering. The use of near-infrared lasers (785 nm, 830 nm) can help solving the problem, but the effective benefit has to be evaluated on a case-by-case basis, since even a small absorption tail can yield to a residual fluorescence that covers the even weaker Raman fingerprint (scattering scales as λ−4). For what concerns carbonaceous materials, as discussed above, the Raman signal is mainly given by a strong emission around 1320 and 1600 cm−1. Based on the peculiar shape of the two bands, it is indeed easy to discern crystalline carbon (e.g. graphite micro- and nano-particles, or even graphene),73 from amorphous carbon present in TRWP.57 The discrimination among species containing amorphous carbon, e.g. asphalt, tires, brake pad and exhaust particles retrieved from environmental samples, is more difficult and requires the presence of some additional spectral marker (such as in brake pad particles), of some degree of pre-knowledge on the samples, or of additional observations. Future studies of the fluctuation/precipitation properties of micrometric particles could, for example, provide hints on the density of the particle and discriminate between asphalt and rubber.Quantification
RT, in the present configuration in which particles are contained in a sealed glass microcell, does not permit for a precise count of the number of particles floating in the liquid, mainly because of the risk of recounting the same particle. A rough solution to avoid re-counting is the analysis of particles located much far apart, that is at distances larger than the diffusion length expected for a micrometric particle in the time required for Raman analysis. Future developments should foresee the implementation of microfluidic circuits74 in which particles can be trapped, driven to an empty zone for analysis and subsequently trashed into an ad hoc channel. This could represent a solution for reliable quantitative analysis by RT.Conclusions
In conclusion, we have used Raman tweezers to trap and analyze tire and road wear particles with dimensions from few microns down to the 500 nm range (at the diffraction limit of our imaging system). We show both theoretically and experimentally, that the strong radiation pressure observed on such absorbing particles prevents stable trapping in 3D, but that 2D trapping can be accomplished by pushing the particles against the top surface of the glass cell in which they are contained. Light irradiation can lead to the fragmentation of TPs aggregates into their smaller constituents. Strong light focusing on a single car tire particle generates bubbling and can even induce changes in its crystalline structure. Overheated carbon particles generate thermal gradients inside the water medium, triggering thermophoretic flows of matter, dragging and concentrating particles in the focal region of the laser, and finally leading to a thermophoretic trapping effect. We have observed that particles produced by mechanical grinding of aged tires can reach sizes down to the nanometric range (500 nm or below). These particles have been optically trapped in distilled and seawater and analyzed by Raman spectroscopy in times of the order of 1 minute. Thanks to the richness of information provided by the Raman spectra, we have been able to identify the presence of hetero-aggregates composed of a mixture of road minerals and rubber. Finally, experiments carried out on particles extracted from a brake test platform have shown the capability of RTs to discriminate among road particulate matter, tire particles, and brake wear particles with dimensions down to ca. 600 nm. Based on these results, we believe that RTs could have a potential application for studying the presence of tire and road wear nanoparticles in water systems, avoiding artifacts related to particles re-aggregation during the drying phase required by other conventional analytical techniques (SEM, microFT-IR, conventional microRaman). Technological efforts are still needed in order to automatize the analysis process and for image and spectral recognition. In this regard, the implementation of artificial intelligence and deep learning routines is foreseen as a necessary step in future research.Author contributions
R. Gillibert: investigation, methodology, data curation, visualization, writing – original draft; A. Magazzù, A. Callegari: conceptualization, investigation, methodology, software, writing – review & editing; A. Foti, D. Bronte-Ciriza, M. G. Donato: writing – review & editing; M. Lamy de La Chapelle, G. Volpe: supervision, writing – review & editing; O. M. Maragò: supervision, funding, writing – review & editing; F. Lagarde: funding acquisition, project administration, writing – review & editing; P. G. Gucciardi: funding acquisition, conceptualization, supervision, project administration, writing – original draft, writing – review & editing.Conflicts of interest
The authors declare no conflict of interest.Acknowledgements
This work has been funded by IFREMER through the project MERLIN-MICROPLASTIQUE (agreement No. 17/1212947B). Partial financial contribution from the agreement ASI-INAF n.2018-16-HH.0, project “SPACE Tweezers” and from the MSCA ITN (ETN) project “Active Matter” is also acknowledged.References
- C. M. S. Ahmed, H. Jiang, J. Y. Chen and Y.-H. Lin, Traffic-Related Particulate Matter and Cardiometabolic Syndrome: A Review, Atmosphere, 2018, 9, 336 CrossRef.
- A. Mukherjee and M. Agrawal, World air particulate matter: sources, distribution and health effects, Environ. Chem. Lett., 2017, 15, 283–309 CrossRef CAS.
- T. Grigoratos and G. Martini, Brake wear particle emissions: a review, Environ. Sci. Pollut. Res., 2015, 22, 2491–2504 CrossRef CAS.
- S. Wagner, T. Hüffer, P. Klöckner, M. Wehrhahn, T. Hofmann and T. Reemtsma, Tire wear particles in the aquatic environment - A review on generation, analysis, occurrence, fate and effects, Water Res., 2018, 139, 83–100 CrossRef CAS.
- S. Wagner and T. Reemtsma, Things we know and don't know about nanoplastic in the environment, Nat. Nanotechnol., 2019, 14, 300 CrossRef CAS PubMed.
- I. Wagner, Global tire demand - cars and light CVs 2018, https://www.statista.com/statistics/792209/global-tire-demand/, (accessed 13 July, 2020) Search PubMed.
- C. Vogelsang, A. L. Lusher, M. E. Dadkhah, I. Sundvor, M. Umar, S. B. Ranneklev, D. Eidsvoll and S. Meland, Microplastics in road dust – characteristics, pathways and measures, Norsk institutt for vannforskning, 2019 Search PubMed.
- K. M. Unice, M. P. Weeber, M. M. Abramson, R. C. D. Reid, J. A. G. van Gils, A. A. Markus, A. D. Vethaak and J. M. Panko, Characterizing export of land-based microplastics to the estuary - Part I: Application of integrated geospatial microplastic transport models to assess tire and road wear particles in the Seine watershed, Sci. Total Environ., 2019, 646, 1639–1649 CrossRef CAS PubMed.
- A. Wik and G. Dave, Environmental labeling of car tires—toxicity to Daphnia magna can be used as a screening method, Chemosphere, 2005, 58, 645–651 CrossRef CAS.
- A. Wik and G. Dave, Acute toxicity of leachates of tire wear material to Daphnia magna—Variability and toxic components, Chemosphere, 2006, 64, 1777–1784 CrossRef CAS PubMed.
- A. G. Miguel, G. R. Cass, J. Weiss and M. M. Glovsky, Latex allergens in tire dust and airborne particles, Environ. Health Perspect., 1996, 104, 1180–1186 CrossRef CAS PubMed.
- J. M. Horner, Environmental health implications of heavy metal pollution from car tires, Rev. Environ. Health, 1996, 11(4), 175–178 CAS.
- A. A. Elnazer, S. A. Salman, E. M. Seleem and E. M. Abu El Ella, Assessment of Some Heavy Metals Pollution and Bioavailability in Roadside Soil of Alexandria-Marsa Matruh Highway, Egypt, Int. J. Ecol., 2015, 2015, 1–7 CrossRef.
- M. Huber, A. Welker and B. Helmreich, Critical review of heavy metal pollution of traffic area runoff: Occurrence, influencing factors, and partitioning, Sci. Total Environ., 2016, 541, 895–919 CrossRef CAS PubMed.
- M. Jenkel, Scientific Report on Tyre and Road Wear Particles, TRWP, in the aquatic environment, prepared for European TRMA, Brussels, July 17, 2019, https://www.etrma.org/wp-content/uploads/2019/10/final-scientific-report-on-tyre-and-road-wear-particles.pdf Search PubMed.
- J. Padovan, N. Prasad, D. Gerrard, S. W. Park and N. Lindsley, Topology of Wear Particles, Rubber Chem. Technol., 1999, 72, 343–356 CrossRef CAS.
- M. L. Kreider, J. M. Panko, B. L. McAtee, L. I. Sweet and B. L. Finley, Physical and chemical characterization of tire-related particles: Comparison of particles generated using different methodologies, Sci. Total Environ., 2010, 408, 652–659 CrossRef CAS.
- K. Adachi and Y. Tainosho, Characterization of heavy metal particles embedded in tire dust, Environ. Int., 2004, 30, 1009–1017 CrossRef CAS.
- M. Camatini, G. F. Crosta, T. Dolukhanyan, C. Sung, G. Giuliani, G. M. Corbetta, S. Cencetti and C. Regazzoni, Microcharacterization and identification of tire debris in heterogeneous laboratory and environmental specimens, Mater. Charact., 2001, 46, 271–283 CrossRef CAS.
- F. Sommer, V. Dietze, A. Baum, J. Sauer, S. Gilge, C. Maschowski and R. Gieré, Tire Abrasion as a Major Source of Microplastics in the Environment, Aerosol Air Qual. Res., 2018, 18, 2014–2028 CrossRef CAS.
- Aatmeeyata and M. Sharma, Polycyclic aromatic hydrocarbons, elemental and organic carbon emissions from tire-wear, Sci. Total Environ., 2010, 408, 4563–4568 CrossRef CAS PubMed.
- C. Lassen, S. F. Hansen, K. Magnusson, N. B. Hartmann, P. R. Jensen, T. G. Nielsen and A. Brinch, Microplastics: Occurrence, effects and sources of releases to the environment in Denmark, Danish Environmental Protection Agency, 2015 Search PubMed.
- M. Siegfried, A. A. Koelmans, E. Besseling and C. Kroeze, Export of microplastics from land to sea. A modelling approach, Water Res., 2017, 127, 249–257 CrossRef CAS.
- C. Schwaferts, R. Niessner, M. Elsner and N. P. Ivleva, Methods for the analysis of submicrometer- and nanoplastic particles in the environment, TrAC, Trends Anal. Chem., 2019, 112, 52–65 CrossRef CAS.
- W. F. Rogge, L. M. Hildemann, M. A. Mazurek, G. R. Cass and B. R. T. Simoneit, Sources of fine organic aerosol. 3. Road dust, tire debris, and organometallic brake lining dust: roads as sources and sinks, Environ. Sci. Technol., 1993, 27, 1892–1904 CrossRef CAS.
- K. M. Unice, M. L. Kreider and J. M. Panko, Use of a Deuterated Internal Standard with Pyrolysis-GC/MS Dimeric Marker Analysis to Quantify Tire Tread Particles in the Environment, Int. J. Environ. Res. Public Health, 2012, 9, 4033–4055 CrossRef CAS PubMed.
- M. Kovochich, M. Liong, J. A. Parker, S. C. Oh, J. P. Lee, L. Xi, M. L. Kreider and K. M. Unice, Chemical mapping of tire and road wear particles for single particle analysis, Sci. Total Environ., 2021, 757, 144085 CrossRef CAS.
- D. A. Long, The Raman effect: a unified treatment of the theory of Raman scattering by molecules, Wiley, Chichester ; New York, 2002 Search PubMed.
- Handbook of Raman spectroscopy: from the research laboratory to the process line, ed. I. R. Lewis and H. G. M. Edwards, Marcel Dekker, New York, 2001 Search PubMed.
- P. G. Gucciardi, S. Trusso, C. Vasi, S. Patanè and M. Allegrini, in Applied Scanning Probe Methods V: Scanning Probe Microscopy Techniques, ed. B. Bhushan, S. Kawata and H. Fuchs, Springer Berlin Heidelberg, Berlin, Heidelberg, 2007, pp. 287–329 Search PubMed.
- A. Foti, F. Barreca, E. Fazio, C. D'Andrea, P. Matteini, O. M. Maragò and P. G. Gucciardi, Low cost tips for tip-enhanced Raman spectroscopy fabricated by two-step electrochemical etching of 125 μm diameter gold wires, Beilstein J. Nanotechnol., 2018, 9, 2718–2729 CrossRef CAS PubMed.
- N. Mauser and A. Hartschuh, Tip-enhanced near-field optical microscopy, Chem. Soc. Rev., 2014, 43, 1248–1262 RSC.
- J. Lee, K. T. Crampton, N. Tallarida and V. A. Apkarian, Visualizing vibrational normal modes of a single molecule with atomically confined light, Nature, 2019, 568, 78–82 CrossRef CAS.
- D. Elkhatib and V. Oyanedel-Craver, A Critical Review of Extraction and Identification Methods of Microplastics in Wastewater and Drinking Water, Environ. Sci. Technol., 2020, 54, 7037–7049 CrossRef CAS PubMed.
- F. Stock, C. Kochleus, B. Bänsch-Baltruschat, N. Brennholt and G. Reifferscheid, Sampling techniques and preparation methods for microplastic analyses in the aquatic environment – A review, TrAC, Trends Anal. Chem., 2019, 113, 84–92 CrossRef CAS.
- P. Li, Q. Li, Z. Hao, S. Yu and J. Liu, Analytical methods and environmental processes of nanoplastics, J. Environ. Sci., 2020, 94, 88–99 CrossRef PubMed.
- M. F. Costa, J. Pinto da Costa and A. C. Duarte, Sampling of micro(nano)plastics in environmental compartments: How to define standard procedures?, Curr. Opin. Environ. Sci. Health, 2018, 1, 36–40 CrossRef.
- A. Ashkin, J. M. Dziedzic, J. E. Bjorkholm and S. Chu, Observation of a single-beam gradient force optical trap for dielectric particles, Opt. Lett., 1986, 11, 288–290 CrossRef CAS PubMed.
- O. M. Maragò, P. H. Jones, P. G. Gucciardi, G. Volpe and A. C. Ferrari, Optical trapping and manipulation of nanostructures, Nat. Nanotechnol., 2013, 8, 807–819 CrossRef.
- D. V. Petrov, Raman spectroscopy of optically trapped particles, J. Opt. A: Pure Appl. Opt., 2007, 9, S139 CrossRef CAS.
- R. Thurn and W. Kiefer, Raman-Microsampling Technique Applying Optical Levitation by Radiation Pressure, Appl. Spectrosc., 1984, 38, 78–83 CrossRef CAS.
- O. M. Maragó, F. Bonaccorso, R. Saija, G. Privitera, P. G. Gucciardi, M. A. Iatì, G. Calogero, P. H. Jones, F. Borghese, P. Denti, V. Nicolosi and A. C. Ferrari, Brownian Motion of Graphene, ACS Nano, 2010, 4, 7515–7523 CrossRef PubMed.
- T. Rodgers, S. Shoji, Z. Sekkat and S. Kawata, Selective Aggregation of Single-Walled Carbon Nanotubes Using the Large Optical Field Gradient of a Focused Laser Beam, Phys. Rev. Lett., 2008, 101, 127402 CrossRef.
- E. Messina, L. D'Urso, E. Fazio, C. Satriano, M. G. Donato, C. D'Andrea, O. M. Maragò, P. G. Gucciardi, G. Compagnini and F. Neri, Tuning the structural and optical properties of gold/silver nano-alloys prepared by laser ablation in liquids for optical limiting, ultra-sensitive spectroscopy, and optical trapping, J. Quant. Spectrosc. Radiat. Transfer, 2012, 113, 2490–2498 CrossRef CAS.
- M. Wu, D. Ling, L. Ling, W. Li and Y. Li, Stable optical trapping and sensitive characterization of nanostructures using standing-wave Raman tweezers, Sci. Rep., 2017, 7, 42930 CrossRef CAS PubMed.
- R. Gillibert, G. Balakrishnan, Q. Deshoules, M. Tardivel, A. Magazzù, M. G. Donato, O. M. Maragò, M. Lamy de La Chapelle, F. Colas, F. Lagarde and P. G. Gucciardi, Raman Tweezers for Small Microplastics and Nanoplastics Identification in Seawater, Environ. Sci. Technol., 2019, 53, 9003–9013 CrossRef CAS.
- C. Schwaferts, V. Sogne, R. Welz, F. Meier, T. Klein, R. Niessner, M. Elsner and N. P. Ivleva, Nanoplastic Analysis by Online Coupling of Raman Microscopy and Field-Flow Fractionation Enabled by Optical Tweezers, Anal. Chem., 2020, 92(8), 5813–5820 CrossRef CAS PubMed.
- S. Zhang, Y. Sun, B. Liu and R. Li, Full size microplastics in crab and fish collected from the mangrove wetland of Beibu Gulf: Evidences from Raman Tweezers (1–20 μm) and spectroscopy (20–5000 μm), Sci. Total Environ., 2020, 143504 Search PubMed.
- M. Labardi, P. G. Gucciardi and M. Allegrini, Near-field optical microscopy, Riv. Nuovo Cimento Soc. Ital. Fis., 2000, 23, 1–35 Search PubMed.
- L. Novotny and B. Hecht, Principles of Nano-Optics, Cambridge University Press, 2012 Search PubMed.
- P. H. Jones, O. M. Maragò and G. Volpe, Optical tweezers: Principles and applications, Cambridge University Press, 2015 Search PubMed.
- A. Ashkin, Forces of a single-beam gradient laser trap on a dielectric sphere in the ray optics regime, Biophys. J., 1992, 61, 569–582 CrossRef CAS.
- A. Callegari, M. Mijalkov, A. B. Gököz and G. Volpe, Computational toolbox for optical tweezers in geometrical optics, J. Opt. Soc. Am. B, 2015, 32, B11–B19 CrossRef CAS.
- W. W. Duley, Refractive indices for amorphous carbon, Astrophys. J., 1984, 287, 694 CrossRef CAS.
- G. Baffou, Thermoplasmonics: Heating Metal Nanoparticles Using Light, Cambridge University Press, Cambridge, United Kingdom ; New York, NY, 1st edn, 2017 Search PubMed.
- R. Gillibert, F. Colas, M. L. de La Chapelle and P. G. Gucciardi, Heat Dissipation of Metal Nanoparticles in the Dipole Approximation, Plasmonics, 2020, 15, 1001–1005 CrossRef.
- A. C. Ferrari and J. Robertson, Interpretation of Raman spectra of disordered and amorphous carbon, Phys. Rev. B: Condens. Matter Mater. Phys., 2000, 61, 14095–14107 CrossRef CAS.
- L. G. Cançado, M. G. da Silva, E. H. M. Ferreira, F. Hof, K. Kampioti, K. Huang, A. Pénicaud, C. A. Achete, R. B. Capaz and A. Jorio, Disentangling contributions of point and line defects in the Raman spectra of graphene-related materials, 2D Mater., 2017, 4, 025039 CrossRef.
- P. Puech, M. Kandara, G. Paredes, L. Moulin, E. Weiss-Hortala, A. Kundu, N. Ratel-Ramond, J.-M. Plewa, R. Pellenq and M. Monthioux, Analyzing the Raman Spectra of Graphenic Carbon Materials from Kerogens to Nanotubes: What Type of Information Can Be Extracted from Defect Bands?, C, 2019, 5, 69 CAS.
- J. Ribeiro-Soares, M. E. Oliveros, C. Garin, M. V. David, L. G. P. Martins, C. A. Almeida, E. H. Martins-Ferreira, K. Takai, T. Enoki, R. Magalhães-Paniago, A. Malachias, A. Jorio, B. S. Archanjo, C. A. Achete and L. G. Cançado, Structural analysis of polycrystalline graphene systems by Raman spectroscopy, Carbon, 2015, 95, 646–652 CrossRef CAS.
- A. Rodríguez, K. Eremin, N. Khandekar, J. Stenger, R. Newman, F. Bazeta and M. T. Escohotado, Characterization of calcium sulfate grounds and fillings of applied tin-relief brocades by Raman spectroscopy, Fourier transform infrared spectroscopy, and scanning electron microscopy, J. Raman Spectrosc., 2010, 41, 1517–1524 CrossRef.
- A. L. Gallego-Hernández, D. Meza-Figueroa, J. Tanori, M. Acosta-Elías, B. González-Grijalva, J. F. Maldonado-Escalante, S. Rochín-Wong, D. Soto-Puebla, S. Navarro-Espinoza, R. Ochoa-Contreras and M. Pedroza-Montero, Identification of inhalable rutile and polycyclic aromatic hydrocarbons (PAHs) nanoparticles in the atmospheric dust, Environ. Pollut., 2020, 260, 114006 CrossRef.
- D. Bersani, P. P. Lottici and A. Montenero, Micro-Raman investigation of iron oxide films and powders produced by sol–gel syntheses, J. Raman Spectrosc., 1999, 30, 355–360 CrossRef CAS.
- P. Panta and C. Bergmann, Raman Spectroscopy of Iron Oxide of Nanoparticles (Fe3O4), J. Mater. Sci. Eng., 2015, 5, 3 Search PubMed.
- R. Hinrichs, M. A. Z. Vasconcellos, W. Österle and C. Prietzel, A TEM snapshot of magnetite formation in brakes: The role of the disc's cast iron graphite lamellae in third body formation, Wear, 2011, 270, 365–370 CrossRef CAS.
- D. Bikiaris, S. Daniilia, S. Sotiropoulou, O. Katsimbiri, E. Pavlidou, A. P. Moutsatsou and Y. Chryssoulakis, Ochre-differentiation through micro-Raman and micro-FTIR spectroscopies: application on wall paintings at Meteora and Mount Athos, Greece, Spectrochim. Acta, Part A, 2000, 56, 3–18 CrossRef.
- E. Adamiec, Chemical fractionation and mobility of traffic-related elements in road environments, Environ. Geochem. Health, 2017, 39, 1457–1468 CrossRef CAS.
- C. Roy, A. Chaala and H. Darmstadt, The vacuum pyrolysis of used tires: End-uses for oil and carbon black products, J. Anal. Appl. Pyrolysis, 1999, 51, 201–221 CrossRef CAS.
- K. Ajito and K. Torimitsu, Single Nanoparticle Trapping Using a Raman Tweezers Microscope, Appl. Spectrosc., 2002, 56, 541–544 CrossRef CAS.
- T. Maes, R. Jessop, N. Wellner, K. Haupt and A. G. Mayes, A rapid-screening approach to detect and quantify microplastics based on fluorescent tagging with Nile Red, Sci. Rep., 2017, 7, 44501 CrossRef CAS PubMed.
- G. Erni-Cassola, M. I. Gibson, R. C. Thompson and J. A. Christie-Oleza, Lost, but Found with Nile Red: A Novel Method for Detecting and Quantifying Small Microplastics (1 mm to 20 μm) in Environmental Samples, Environ. Sci. Technol., 2017, 51, 13641–13648 CrossRef CAS PubMed.
- V. Bianco, P. Memmolo, P. Carcagnì, F. Merola, M. Paturzo, C. Distante and P. Ferraro, Microplastic Identification via Holographic Imaging and Machine Learning, Adv. Intell. Syst., 2020, 2, 1900153 CrossRef.
- E. Messina, N. Leone, A. Foti, G. Di Marco, C. Riccucci, G. Di Carlo, F. Di Maggio, A. Cassata, L. Gargano, C. D'Andrea, B. Fazio, O. M. Maragò, B. Robba, C. Vasi, G. M. Ingo and P. G. Gucciardi, Double-Wall Nanotubes and Graphene Nanoplatelets for Hybrid Conductive Adhesives with Enhanced Thermal and Electrical Conductivity, ACS Appl. Mater. Interfaces, 2016, 8, 23244–23259 CrossRef CAS PubMed.
- K. S. Lee, M. Palatinszky, F. C. Pereira, J. Nguyen, V. I. Fernandez, A. J. Mueller, F. Menolascina, H. Daims, D. Berry, M. Wagner and R. Stocker, An automated Raman-based platform for the sorting of live cells by functional properties, Nat. Microbiol., 2019, 4, 1035–1048 CrossRef CAS PubMed.
Footnotes |
| † Electronic supplementary information (ESI) available. See DOI: 10.1039/d1en00553g |
| ‡ Present address: Dipartimento di Fisica, Università di Roma La Sapienza, Piazzale A. Moro 2, I-00185 Rome, Italy |
| This journal is © The Royal Society of Chemistry 2022 |