
 Open Access Article
 This Open Access Article is licensed under a
 Creative Commons Attribution 3.0 Unported Licence
Performance evaluation of a 3D-printed sharp-cut cyclone
E.
Albanes
a,
S.
Bezantakos
 a,
M.
Costi
a and
G.
Biskos
*ab
a,
M.
Costi
a and
G.
Biskos
*ab
aClimate & Atmosphere Research Centre, The Cyprus Institute, Cyprus. E-mail: g.biskos@cyi.ac.cy; g.biskos@tudelft.nl
bFaculty of Civil Engineering and Geosciences, Delft University of Technology, Delft, The Netherlands
First published on 14th June 2022
Abstract
A sharp-cut cyclone with an aerodynamic cut-off diameter of 1 μm, when operated at a flow rate of 1 L min−1, was built by 3D-printing and tested against a metallic (aluminum) counterpart having the same design and dimensions. The penetration efficiency of both cyclones was experimentally determined using quasi-monodisperse aerosol particles having aerodynamic diameters from ca. 100 nm to 2 μm. The aerodynamic cut-off diameter for both cyclones was very similar and in accordance with the expected design value. The penetration efficiency curve of the 3D-printed cyclone was less steep compared to that of its metallic counterpart. This difference is most likely attributed to the higher surface roughness of the inner parts of the 3D-printed cyclone – as also indicated by the greater pressure drop it exhibits compared to the aluminum cyclone when operated at the same flow rate – and not by higher deviations from its design dimensions resulting from the tolerances of the 3D printer. Despite that, the substantially low cost, speed, and ease of manufacturing, make the 3D-printed cyclone a highly promising solution for applications in aerosol metrology.
Environmental significanceCyclones are commonly employed as particle segregators in ambient air particulate matter (PM) measurements. Although they are in general inexpensive compared to other components used in aerosol measurements, their price can become significant for applications such as regulatory air quality monitoring where the cut-off diameter is required to be accurate, adding to the overall cost of the measuring system. In this study, we designed and manufactured a cost-effective sharp-cut cyclone (SCC) by 3D-printing, which offers extremely low manufacturing cost and short production time. Considering also that the performance of the 3D-printed cyclone does not deviate much from that of its metallic counterpart as shown by our results, it provides a very good alternative for use in air quality monitoring. This, in turn, will enable building spatially dense networks for air quality observations, that will allow us to better assess the impacts of PM on human health and climate. |
1. Introduction
Cyclones are frequently employed as particle separators in aerosol metrology,1 and in a number of industrial applications.2 A great advantage of cyclones is that (i) they introduce only a small pressure drop in the aerosol transportation lines they are employed, and (ii) they are very easy to operate and maintain, making them highly favorable for use in a wide number of systems.3,4 Oftentimes cyclones are employed in regulatory measurements of atmospheric particulate matter (PM) for removing the fraction of the larger/heavier particles (i.e., in PM10, PM2.5, or PM1.0 monitoring for removing respectively particles larger than 10, 2.5 or 1.0 μm) before their mass concentration is determined.5,6 In addition, cyclones are used to collect aerosol particles, including bioaerosols, having diameters larger than a specific size for further analysis, avoiding the use of filters and any artefacts from contamination and/or chemical reactions that can affect the follow-up analysis.7,8 To suit the task, cyclones need to have a well-defined cut-off diameter and steep penetration curve.9,10Cyclones consist of two main parts: a cylindrical piece (namely the barrel) that serves as a pre-separator, and a conical part attached to the barrel where the separation of the large/heavier particles takes place. For some applications were very large/heavy particles need to be collected (e.g., in bioaerosol samplers) cyclones include a cup below the conical separator in order to collect the fraction of particles that can slide down the cone.11 Depending on the way that the gas stream enters and exits the conical part, cyclones can be classified as tangential (also referred to as flow-reverse), where the direction of the flow changes by 180°, or axial where the flow enters and exits axially.12 The flow-reverse operational mode of cyclones is as follows. The incoming aerosol enters tangentially through the inlet of the cyclone and the particles experience a centrifugal force that pushes them towards its walls; the larger/heavier particles deposit on the walls, while the smaller/lighter particles exit the cyclone through an outlet on its upper part.13
The ability of a cyclone to separate particles based on their size/weight depends on its design and the operating flow rate. Kenny & Gussman showed that it is possible to dimensionally scale cyclones of a specific design based on empirical models in order to have a specific aerodynamic cut-off diameter at a certain flow rate.14 As a results, it is possible to design a “family” of cyclones (i.e., a group of cyclones whose dimensions derive by following specific proportions of their body diameter),15 having a specific cut-off diameter when operated at the desired flow rate.16
For regulatory monitoring of atmospheric PM2.5, the US Environmental Protection Agency (EPA) recommends that the employed aerosol separators (i.e., cyclones or impactors) should have a steep drop in their penetration efficiency for particles having an aerodynamic diameter of 2.5 μm and above, when operated at a standard flow rate for ambient aerosol sampling (16.67 L min−1).17 Based on the design proposed originally by Smith et al., Kenny et al. developed a novel Sharp-Cut Cyclone (SCC), having a penetration curve that is closer to that of the Well Impactor Ninety Six (WINS),17,18 which is employed as a standard in regulatory monitoring of the ambient aerosol in the US.9 Due to its unique characteristics, the SCC family of cyclones is currently employed in many applications, (e.g., regulatory sampling of particles emitted by diesel engines), as it fulfills the requirements of many regulatory authorities.19
Cyclones are in general inexpensive compared to other components used in aerosol measurements. However, for applications where the cut-off diameter is required to be accurate, their price can become significant, ranging from hundreds to a couple of thousands USD due to the required manufacturing precision, adding to the overall cost of the measuring system. Reducing the cost of cyclones to the order of a few tens of USD, will allow us to increase the number of sampling points and thus expand the capabilities of air quality monitoring networks. For this reason, it is important to develop cost-effective SCCs without compromising their precision significantly.
An elegant way of fabricating cost-effective system components, including parts employed in particle processing and analysis systems, is by using 3D printing. For example, Yi et al. has recently designed and tested a 3D-printed mini-hydrocyclone separator (i.e., a cyclones for separating solids or different phase fluids from the bulk fluid).20 In this spirit, Loizidis et al., has employed 3D printing to build a flow laminarizer for use in high-precision instruments for aerosol size classification.21 In both these cases, the performance of the 3D printed components was comparable to that of counterparts produced by classical methods, while their cost of manufacturing was substantially lower.
In this study, we designed and manufactured a cost-effective SCC by 3D-printing, which offers low manufacturing cost and short production time. We designed a cyclone based on the semi-empirical model proposed by Gussman et al. having a cut-off diameter of 1 μm when operated at a flow rate of 1 L min−1.22 The performance of the 3D-printed cyclone was determined using particles having aerodynamic diameters from ca. 100 nm to 2 μm, and compared against a metallic (aluminum) counterpart – built at a machine shop – having the same design and dimensions.
2. Methods
2.1 Cyclone design
The SCC 3D-printed cyclone was built out of conductive Acrylonitrile Butadiene Styrene (ABS) filaments using the Fused Deposition Modelling technique.23 The metallic cyclone was built out of aluminum using a lathe and a drill with a custom-made drilling tool having the same shape of the required conical part. The body diameter of the cyclone, Dc, was determined as:22 | (1) |
Fig. 1 shows an illustration of the cyclone, whereas Table 1 provides the dimensions of its parts expressed in proportion to the cyclone body diameter, including the designed and the measured (using a Vernier caliper) dimensions of both cyclones. The cyclone consists of three main parts; drawings ready for 3D printing all these parts are provided in the supplement. All dimensions of the 3D-printed cyclone have a tolerance of ±0.2 mm, while the respective tolerance for the metallic cyclone is ±0.1 mm. The tolerance for the 3D-printed cyclones was corroborated by printing and measuring 10 copies of all cyclone components. The outside surface of the 3D-printed cyclone was covered with dissolved ABS in order to close any voids and thus prevent potential leaks through the material.24
 | ||
| Fig. 1 Schematic illustration of the cyclones (3D printed and metallic) developed and tested in this work, including their characteristic dimensions (see Table 1 for the specific values). | ||
| Description | Symbol | Proportions with respect to Dc | Design dimensions SCC [mm] | Measured dimensions of the 3D-printed SCC [mm ± 0.01 mm] | Measured dimensions of the metallic SCC [mm ± 0.01 mm] |
|---|---|---|---|---|---|
| Diameter cyclone | D c | 1 | 4.85 | 4.65 | 4.75 |
| Inlet diameter | D in | 0.24 | 1.16 | 1.20 | 1.20 |
| Outlet diameter | D e | 0.27 | 1.31 | 1.30 | 1.30 |
| Vortex finder height | S | 0.35 | 1.70 | 1.80 | 1.70 |
| Cylinder height | h | 0.43 | 2.08 | 2.20 | 2.10 |
| Cone height | Z | 1.56 | 7.56 | 7.40 | 7.50 |
| Spigot diameter | B | 0.25 | 1.21 | 1.20 | 1.20 |
| Cup height | H cup | 0.87 | 4.22 | 4.50 | 4.40 |
| Cup length | D cup | 0.63 | 3.08 | 3.40 | 3.20 |
2.2 Experimental setup
Fig. 2 shows the experimental setup used to test the performance of the two cyclones. In brief, an atomizer (Model AGK 2000; Palas GmbH, Karlsruhe, Germany) was employed for producing polydisperse ammonium sulfate (AS) particles. The resulting aerosol was subsequently dried using a silica diffusion dryer (Model 3062; TSI Inc., Shoreview, MN, USA), and then charge-neutralized by passing it through a 85Kr source aerosol neutralizer (Model 3077 A; TSI Inc., Shoreview, MN, USA). To obtain a monodisperse aerosol with particles in the mobility diameter range of ca. 60 to 750 nm, the dried charge-neutralized aerosol was passed through a Differential Mobility Analyzer (DMA; Model 3081; TSI Inc., Shoreview, MN, USA) operated at a constant sheath flow of 3.2 L min−1. The sample flow passing through the DMA was regulated at 0.32 L min−1 by adding a simple diluter (comprised of a valve and a HEPA filter) downstream the DMA in order to achieve an aerosol-to-sheath-flow ratio of 10![[thin space (1/6-em)]](https://www.rsc.org/images/entities/char_2009.gif) :1.
:1.
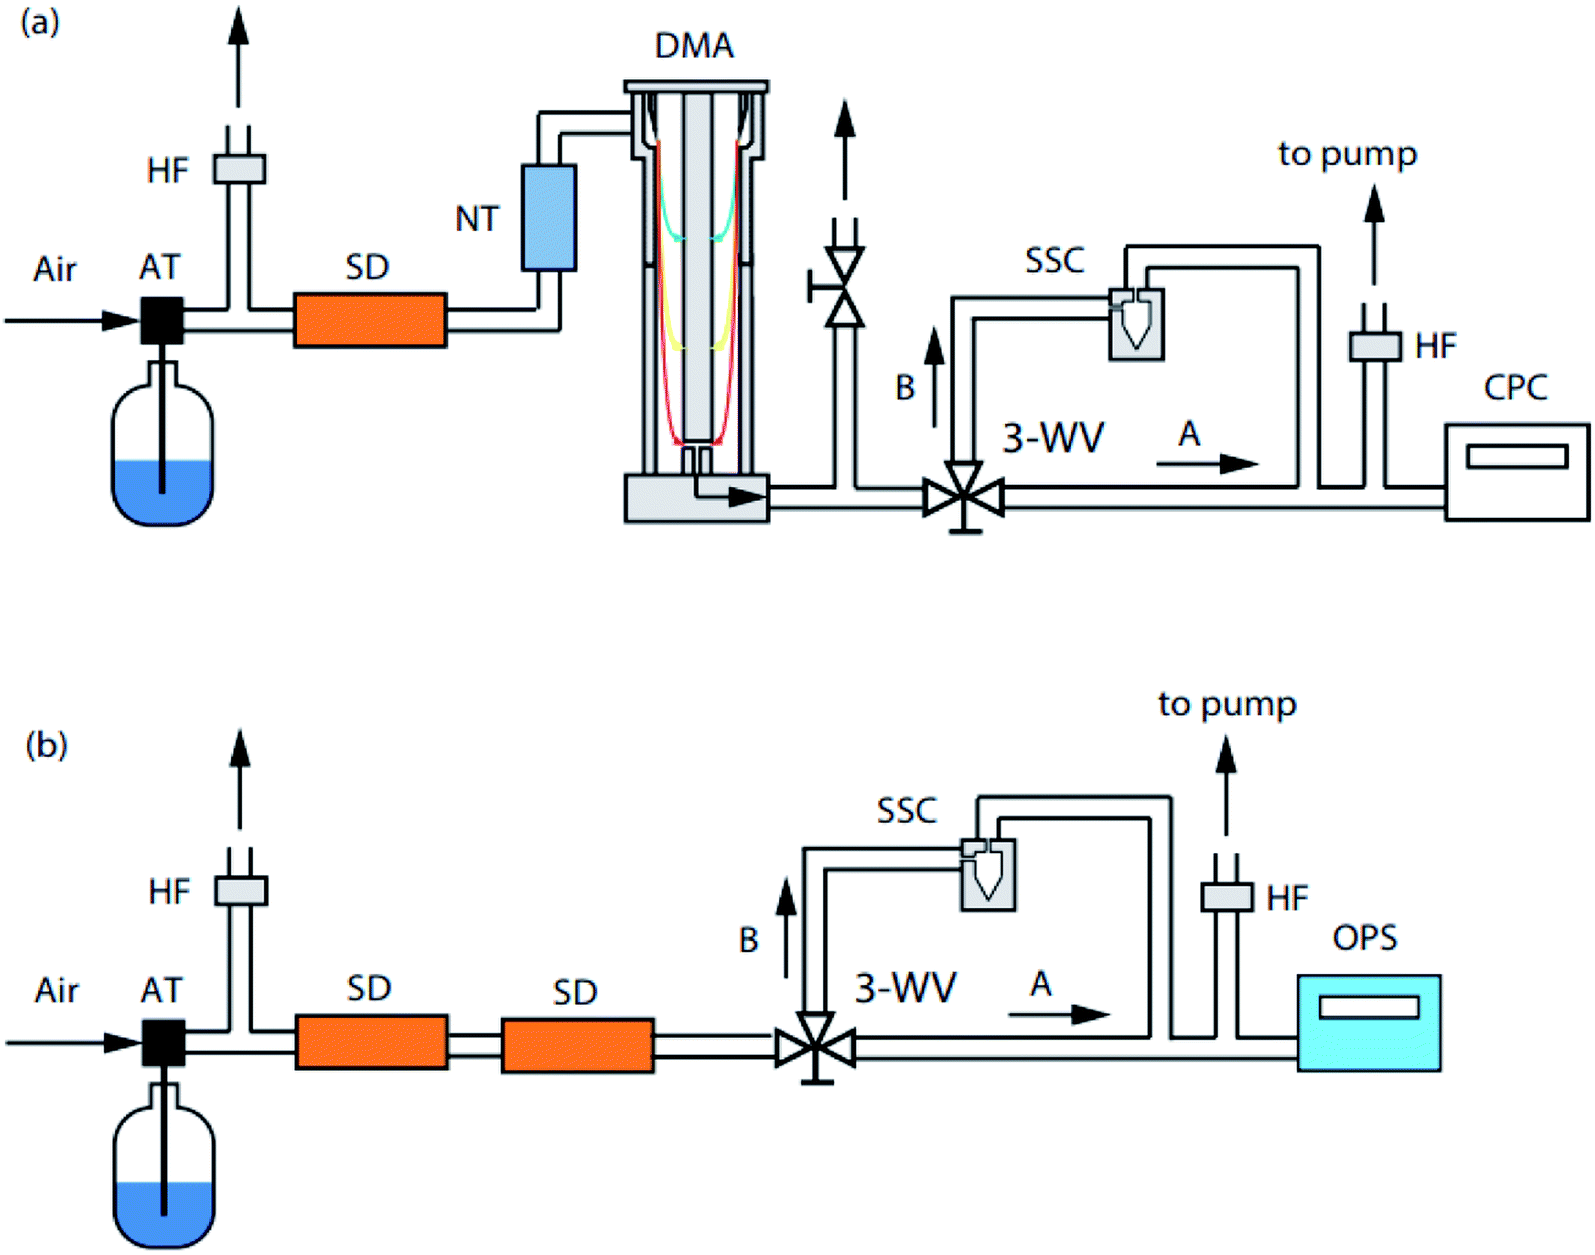 | ||
| Fig. 2 Schematic layout of the experimental setup employed to determine the penetration of the cyclones. Both the 3D-printed and the metallic cyclones were tested with quasi monodisperse (a) AS particles, and (b) PSL spheres. Key: AT: atomizer; HF: HEPA filter; SD: silicon drier; NT: neutralizer; DMA: differential mobility analyzer; 3-WV: three-way-valve; SCC: sharp-cut cyclone; CPC: condensation particle counter; OPS: optical particle sizer. | ||
A Condensation Particle Counter (CPC; Model 3786; TSI Inc., Shoreview, MN, USA) was used to measure the particle number concentration of the monodisperse aerosol particles upstream and downstream the tested cyclones in order to determine their penetration curve. Because the tested cyclones required a flow rate of 1 L min−1 for achieving the desired cut-off diameter, while the CPC was operated at a total flow rate of 0.6 L min−1, an additional vacuum pump was added downstream the cyclone, pulling a constant flow rate of 0.4 L min−1. The flow through the cyclones was tested at the beginning and at the end of each experiment using a primary standard volumetric flow meter (Model Gilibrator 2; Sensidyne, St. Petersburg, FL, US).
In order to produce particles having diameters up to a few microns we used atomized solutions of Polystyrene Latex (PSL) spheres (Magsphere Inc; cf.Table 2 for details). In those measurements, instead of measuring the particle number concentrations with the CPC, we used an Optical Particle Sizer (OPS; Model 3300; TSI Inc., Shoreview, MN, USA) that measures the size distribution of aerosol particles having optical diameters in the range of 0.3 to 10 μm (cf.Fig. 2b). We should note here that the OPS is calibrated with PSL spheres, thus no correction was needed between to convert the measured optical equivalent aerosol diameters to nominal sizes. In those measurements (i.e., when the OPS was employed to measure the concentration of the PSL spheres upstream and downstream the cyclones), the additional pump downstream the tested cyclone was not operational, since the OPS provided the required flow rate of 1 L min−1.
| Ammonium sulfate particles | ||||||||||
|---|---|---|---|---|---|---|---|---|---|---|
| Electrical mobility (nm) ± 1 nm | 63 | 133 | 206 | 282 | 358 | 453 | 508 | 584 | 659 | 734 |
| Aerodynamic (nm) | 100 | 200 | 300 | 400 | 500 | 600 | 700 | 800 | 900 | 1000 |
| Polystyrene latex spheres | ||||||
|---|---|---|---|---|---|---|
| Nominal (nm) | 195 | 410 | 570 | 700 | 1000 | 1900 |
| Aerodynamic (nm) ± 1 nm | 202 | 420 | 586 | 719 | 1029 | 1947 |
2.3 Cyclone penetration efficiency and pressure drop
Three sets of independent measurements were carried out in order to determine the penetration efficiency of the cyclones, which was determined by: | (2) |
The following logistic equation was used to fit the penetration efficiency measurements:25
 | (3) |
 | (4) |
Because cyclones are inertial separators, their penetration efficiency depends on the aerodynamic diameter, and not on the mobility or physical diameter, of the sampled aerosol particles. For this reason, both the electrical mobility diameters of the AS particles (i.e., classified with the DMA) and the optical equivalent/physical diameters of PSL spheres, were converted to aerodynamic diameters as:18
 | (5) |
To determine the dependence between the cut-off diameter and the flow rate, Dae50 was determined experimentally at four different flow rates (namely at 0.6, 1.0, 1.5 and, 2.0 L min−1), following the experimental procedures described in Section 2.2. In these experiments, the flow through the additional vacuum pump, located downstream the tested cyclones (cf., Fig. 2), was adjusted in order to achieve the required flow rates through the cyclones. The experimentally determined Dae50 values were compared with those predicted by eqn (1).
In addition to the penetration, we determined the pressure drop in both cyclones using a differential pressure manometer (Model GDH 200-07; GHM Group-Greisinger, Regenstauf, Germany). For these measurements we connected the high and low pressure node of the manometer respectively upstream and downstream the cyclone. We should note here that the pressure drop of the cyclone can be affected by the roughness of its inner surface similarly to the way that the inner surface of pipes can affect the pressure drop of the flow passing through them,28 and consequently affect its overall performance.
3. Results and discussion
Fig. 3 provides the penetration efficiency curves of the 3D-printed and metallic cyclones, when sampling AS and PSL aerosol particles at a flow rate of 1 L min−1. The experimentally determined aerodynamic cut-off diameters of the 3D-printed and metallic cyclones are respectively 0.96 ± 0.05 μm and 1.06 ± 0.07 μm. Evidently, these values are similar, within experimental uncertainty, with the cut-off aerodynamic diameter of 1 μm set by the design model (i.e., determined by eqn (1)). Small deviations (up to 6%) from the designed cut-off diameter can be attributed to variations of the flow through the cyclone, uncertainties from the calibration of the particle counter, or the day-by-day variation of the conditions during the experiments.22 | ||
| Fig. 3 Measured and fitted (using eqn (3)) penetration as a function of particle aerodynamic diameter for (a) the metallic, and (b) the 3D-printed cyclones. | ||
The achieved and/or recommended tolerances in the cut-off diameters of cyclones are typically within less than 10%. Cauda et al., for instance, designed an SCC to have a Dae50 of 0.8 μm while the actual/measured value turned out to be 0.74 μm, corresponding to a difference of 7.5% from the design value.14 According to the Federal Reference Methods (FRM) of the US Environmental Protection Agency (EPA), cyclones employed in PM2.5 regulatory measurements should have a tolerance in their cut-off diameter of up to ±8% (i.e., Dae50 of 2.50 ± 0.25 μm) when operated at a flow rate of 16.67 L min−1.17 Evidently, the tolerance of 6% exhibited by the 3D-printed cyclone built and tested in this work is within the typical recommended values.
Fig. 4 shows the measured cut-off diameters for both the 3D-printed and the metallic cyclones when operated at 0.6, 1.0, 1.5, and 2.0 L min−1, together with predictions using eqn (1) for a cyclone having a body diameter of 4.85 mm. The agreement between measurements and predictions is within less than 6% for both cyclones, except for the case of the 3D-printed cyclone when operated at 2.0 L min−1 that deviated by 15% from the design value.
 | ||
| Fig. 4 Cyclone cut-off diameter as a function of operating flow rate. Values predicted by eqn (1)correspond to a cyclone having a body diameter of 0.485 cm. | ||
The penetration efficiency curve of the metallic cyclone has a sharpness of 1.35, as determined by eqn (4), which is similar to the one reported by Kenny et al. and by Gussman et al. for SCCs having cut-off diameters of 1.0 and 2.5 μm.17,22 In contrast, the 3D-printed cyclone has a curve that is less steep, having a sharpness of 1.64, resembling the ones of the University Research Glassware (URG) cyclone as reported by Kenny et al.17 As reported by Kenny et al., the discrepancy between the sharpness of the metallic and the 3D-printed cyclone could in principle be explained by differences in their dimensions caused by manufacturing tolerances.29 Liu et al. showed that the penetration curve and especially the cut-off point of a cyclone are affected by the cone contraction angles, with the effect being more dominant as the flow rate through the cyclone increases.30 This is because the swirl of the flow becomes stronger, thereby decreasing the cut-off aerodynamic diameter, as the cone contraction angle is increased. In fact, it has been argued that the sharpness in short or small-coned cyclones is dominated by specific inlet and outlet dimensions (i.e., parameters Din, De, and h shown in Fig. 1), whereas in long or wide-coned cyclones it is dominated by the cone and base dimensions (i.e., parameter B and Z in Fig. 1).15 This explanation, however, seems unlikely for our results as all respective dimensions of the two cyclones are almost identical (cf.Table 1), yielding cone contraction angles that are equal within less than 1.5%. In addition, the measured cut-off diameters are very similar, as discussed above, supporting that differences in the dimensions (which are within less than 0.1 mm) are unlikely to affect the overall performance of the cyclones.
The discrepancy in the sharpness of the two cyclones can also be attributed to differences in the flow field caused by the roughness of their inner walls. Simulation studies have shown that increasing the inner roughness of cyclones can change the flow field within the cyclone due to the increased flow resistance, and thus the deposition efficiency of the particles.31,32 To investigate whether this could be the main reason for the observed discrepancy in the sharpness of the two cyclones, we measured the pressure drop (which is a proxy of flow resistance through confined flows; cf. Dzarma et al., for the case of pipes28) caused by both systems as a function of operating flow rate (cf.Table 3). For the metallic cyclone the pressure drop ranged from 0.049 to 0.973 kPa, as the flow rate increased from 0.6 to 0.3 L min−1. For the same range of flow rates the pressure drop through the 3D-printed cyclone increased from 0.067 to 1.345 kPa, whereas the difference in the pressure drop between the two cyclones when operated at 1.0 L min−1 was 0.06 kPa. Such a difference is not surprising as 3D-printed materials produced by Fused Deposition Modelling have surfaces with higher roughness compared to metallic surfaces,33 and can in principle justify variabilities in the flow fields within each cyclone, supporting the hypothesis that those can be the reason for the difference in the sharpness of the penetration efficiency curves. Testing this hypothesis, however, requires elaborate simulations for determining the performance of the cyclones, and explaining why the roughness of their inner surfaces affects only the sharpness and not the cutoff diameter. Without such simulations, which are outside the scope of the current work, attributing the deviation in the sharpness between the 3D-printed and the metallic cyclones to differences in their roughness can only be speculative.
| Flow rate [L min−1] | Metal [kPa ± 0.01 kPa] | 3D-printed [kPa ± 0.01 kPa] |
|---|---|---|
| 0.6 | 0.049 | 0.067 |
| 1 | 0.111 | 0.171 |
| 1.5 | 0.247 | 0.335 |
| 2 | 0.424 | 0.601 |
| 2.5 | 0.645 | 0.805 |
| 3 | 0.973 | 1.345 |
We should note here that the sharpness of the penetration efficiency curves of cyclones (and other similar size separators) can be important for a number of applications including air quality monitoring where high accuracy and precision is required. For other applications (e.g., personal sampling), where sizing accuracy is not so important, the sharpness in the penetration efficiency curves can be traded for other features such as low cost and ease/speed of manufacturing, which become especially important when such systems have to be employed in large numbers. This is particularly true for the 3D-printed cyclone developed and built here, which exhibits a cut-off size similar to that of its metallic counterpart, but with a considerable lower cost and easiness in manufacturing. We should highlight here that the time required to construct the 3D-printed cyclone was a fraction (around ¼) of that required to build the metallic version, and most importantly it did not require the constant supervision of a person, thereby reducing substantially the cost of production. Furthermore, the cost of the materials and the investment for the tools (i.e., a 3D printer that costs a few hundred USD) required to build a 3D-printed cyclone, are at least one order of magnitude lower compared to those required for manufacturing a metallic cyclone, making it a much more attractive and feasible solution.
4. Conclusions
We have developed and tested a compact SCC built entirely by 3D printing, and compared its performance with a metallic counterpart having the same design and dimensions. Both cyclones were designed to have a cut-off diameter of 1 μm when operated at a flow rate of 1 L min−1. The penetration efficiency curves of both the 3D-printed and metallic cyclones were experimentally determined using quasi-monodisperse AS and PSL aerosol particles having aerodynamic diameters from ca. 100 nm to 2 μm. The aerodynamic cut-off diameter of both cyclones were very similar (0.96 ± 0.05 μm for the 3D-printed and 1.06 ± 0.07 μm for the metallic cyclone) and in accordance to the expected designed value of 1 μm. In contrast to the cut-off diameter, the sharpness of the penetration efficiency curve of the cyclones exhibited a substantial difference, having values of 1.64 for the 3D-printed and 1.35 for the metallic cyclone. This discrepancy cannot be attributed to differences in the dimensions of the cyclones due to manufacturing tolerances, but most likely to differences in the roughness of their inter parts (i.e., the 3D-printed cyclone has a higher roughness), that can cause variations in the flow field as indicated by the difference in the pressure drop that they exhibit. Despite that, the 3D-printed cyclone provides a good alternative for applications where low-cost and fast manufacturing are needed without sacrificing the accuracy on the required cut-off diameter, making it a promising candidate in aerosol metrology.Conflicts of interest
The authors declare no conflicts of interest.Acknowledgements
This work was supported by the Projects INNOVATE-COVID/0420/0009 and which are co-financed by the European Regional Development Fund and the Republic of Cyprus through the Research and Innovation Foundation.References
- T. Okuda, R. Isobe, Y. Nagai, S. Okahisa, K. Funato and K. Inoue, Development of a High-Volume PM2.5 Particles Sampler Using Impactor and Cyclone Techniques, Aerosol Air Qual. Res., 2015, 15(3), 759–767, DOI:10.4209/aaqr.2014.09.0194.
- M. Huard, C. Briens, F. Berruti and T. A. Gauthier, A Review of Rapid Gas-Solid Separation Techniques, Int. J. Chem. React. Eng., 2010, 8(1) DOI:10.2202/1542-6580.2069.
- L. G. M. Vieira, E. A. Barbosa, J. J. R. Damasceno and M. A. S. Barrozo, Performance Analysis and Design of Filtering Hydrocyclones, Braz. J. Chem. Eng., 2005, 22(1), 143–152, DOI:10.1590/S0104-66322005000100015.
- K. Elsayed and C. Lacor, Optimization of the Cyclone Separator Geometry for Minimum Pressure Drop Using Mathematical Models and CFD Simulations, Chem. Eng. Sci., 2010, 65(22), 6048–6058, DOI:10.1016/j.ces.2010.08.042.
- A. M. Rule, A. S. Geyh, J. P. Ramos-Bonilla, J. N. Mihalic, J. D. Margulies and L. M. Polyak, et al, Design and Characterization of a Sequential Cyclone System for the Collection of Bulk Particulate Matter, J. Environ. Monit., 2010, 12, 1807–1814 RSC.
- T. Tritscher, M. Beeston, A. F. Zerrath, S. Elzey, T. J. Krinke and E. Filimundi, et al, NanoScan SMPS-A Novel, Portable Nanoparticle Sizing and Counting Instrument, J. Phys.: Conf. Ser., 2013, 429, 012061, DOI:10.1088/1742-6596/429/1/012061.
- L. S. Van Winkle, K. Bein, D. Anderson, K. E. Pinkerton, F. Tablin and D. Wilson, et al, Biological Dose Response to PM2.5: Effect of Particle Extraction Method on Platelet and Lung Responses, Toxicol. Sci., 2014, 143(2), 349–359, DOI:10.1093/toxsci/kfu230.
- C. W. Haig, W. G. Mackay, J. T. Walker and C. Williams, Bioaerosol Sampling: Sampling Mechanisms, Bioefficiency and Field Studies, J. Hosp. Infect., 2016, 93(3), 242–255, DOI:10.1016/j.jhin.2016.03.017.
- USEPA (United States Environmental Protection Agency). Ambient Air Monitoring Reference and Equivalent Methods, Code of Federal Regulations, 1997, vol. 40 CFR, Parts 50, 53 and 58 Search PubMed.
- W. G. Lindsley, D. Schmechel and B. T. Chen, A Two-Stage Cyclone Using Microcentrifuge Tubes for Personal Bioaerosol Sampling, J. Environ. Monit., 2006, 8(11), 1136–1142 RSC.
- T. Okuda, D. Shishido, Y. Terui, K. Fujioka, R. Isobe and Y. Iwaki, et al, Development of a High-Volume Simultaneous Sampler for Fine and Coarse Particles Using Virtual Impactor and Cyclone Techniques, Asian J. Atmos. Environ., 2018, 12(1), 78–86, DOI:10.5572/ajae.2018.12.1.078.
- D. L. Iozia and D. Leith, Effect of Cyclone Dimensions on Gas Flow Pattern and Collection Efficiency, Aerosol Sci. Technol., 1989, 10(3), 491–500, DOI:10.1080/02786828908959289.
- M. R. Doshi and J. M. Dyer, Paper: Recycling and Recycled Materials, EMSAT, 2001, pp. 6711–6720, DOI:10.1016/B0-08-043152-6/01188-8.
- L. C. Kenny and R. A. Gussman, Characterisation and Modelling of a Family of Cyclone Aerosol Preseparators, J. Aerosol Sci., 1997, 28(4), 677–688, DOI:10.1016/S0021-8502(96)00455-7.
- L. C. Kenny and R. A. Gussman, A Direct Approach to the Design of Cyclones for Aerosol-Monitoring Applications, J. Aerosol Sci., 2000, 31(12), 1407–1420, DOI:10.1016/S0021-8502(00)00047-1.
- L. C. Kenny, T. Merrifield, D. Mark, R. Gussman and A. Thorpe, The Development and Designation Testing of a New USEPA-Approved Fine Particle Inlet: A Study of the USEPA Designation Process, Aerosol Sci. Technol., 2004, 38(2), 15–22, DOI:10.1080/027868290502290.
- L. C. Kenny, R. Gussman and M. Meyer, Development of a Sharp-Cut Cyclone for Ambient Aerosol Monitoring Applications, Aerosol Sci. Technol., 2000, 32(4), 338–358, DOI:10.1080/027868200303669.
- W. B. Smith, R. R. Wilson Jr and D. B. Harris, A Five-Stage Cyclone System for In-Situ Sampling, Environ. Sci. Technol., 1979, 13(11), 1387–1392, DOI:10.1021/es60159a016.
- E. Cauda, M. Sheehan, R. Gussman, L. Kenny and J. Volkwein, An Evaluation of Sharp Cut Cyclones for Sampling Diesel Particulate Matter Aerosol in the Presence of Respirable Dust, Ann. Occup. Hyg., 2014, 58(8), 995–1005, DOI:10.1093/annhyg/meu045.
- H. W. Yi, J. Y. Kwon, T. W. Lee and M. C. Kang, Optimization of the Outlet Flow Ratio of Mini-Hydrocyclone Separators Using the Full Factorial Design Method to Determine the Separation Efficiency, Separations, 2021, 8(11), 210, DOI:10.3390/separations81102108.
- C. Loizidis, M. Costi, N. Lekaki, S. Bezantakos and G. Biskos, Improves Performance of Differential Mobility Analyzers with 3D-Printed Flow Straighteners, J. Aerosol Sci., 2020, 145, 105545, DOI:10.1016/j.jaerosci.2020.105545.
- R. A. Gussman, L. C. Kenny, M. Labickas and P. Norton, Design, Calibration, and Field Test of a Cyclone for PM1 Ambient Air Sampling, Aerosol Sci. Technol., 2002, 36(3), 361–365, DOI:10.1080/027868202753504461.
- F. M. Mwema and E. T. Akinlabi, Basics of Fused Deposition Modelling (FDM), Fused Deposition Modeling, 2020, pp. 1–15, DOI:10.1007/978-3-030-48259-6_1.
- X. Wang, L. Zhao, J. Y. H. Fuh and H. P. Lee, Effect of Porosity on Mechanical Properties of 3D Printed Polymers: Experiments and Micromechanical Modeling Based on X-ray Computed Tomography Analysis, Polymers, 2019, 11(7), 1154, DOI:10.3390/polym11071154.
- D. L. Iozia and D. Leith, The Logistic Function and Cyclone Fractional Efficiency, Aerosol Sci. Technol., 1990, 12(3), 598–606, DOI:10.1080/02786829008959373.
- T. F. Coleman and Y. Li, An Interior Trust Region Approach for Nonlinear Minimization Subject to Bounds, SIAM J. Optim., 1996, 6(2), 418–445, DOI:10.1137/0806023.
- T. F. Coleman and Y. Li, On the Convergence of Interior-Reflective Newton Methods for Large-Scale Nonlinear Minimization Subject to Bounds, Math. Program., 1994, 67(1–3), 189–224, DOI:10.1007/BF01582221.
- G. Dzarma, A. Adeyemi and A. Taj-Liad, Effect of Inner Surface Roughness on Pressure Drop in a Small Diameter Pip, Int. J. Novel Res. Eng. Pharm.Sci., 2020, 7(1), 1–8 Search PubMed.
- L. C. Kenny, A. Thorpe and P. Stacey, A Collection of Experimental Data for Aerosol Monitoring Cyclones, Aerosol Sci. Technol., 2017, 51(10), 1190–1200, DOI:10.1080/02786826.2017.1341620.
- D. Liu, P. Wang, T. C. Hsiao and D. R. Chen, Small Cyclones with Conical Contraction Bodies, Aerosol Air Qual. Res., 2018, 18(10), 2519–2528, DOI:10.4209/aaqr.2018.05.0166.
- F. Kaya, I. Karagoz and A. Avci, Effects of Surface Roughness on the Performance of Tangential Inlet Cyclone Separators, Aerosol Sci. Technol., 2011, 45(8), 988–995, DOI:10.1080/02786826.2011.574174.
- C. Hui and S. Guogang, Effects of Wall Roughness on the Flow Field and Vortex Length of Cyclone, Procedia Eng., 2015, 102, 1316–1325 CrossRef.
- J. Hartcher-O'Brien, J. Evers and E. Tempelman, Surface Roughness of 3D Printed Materials: Comparing Physical Measurements and Human Perception, Mater. Today Commun., 2019, 19, 300–305, DOI:10.1016/j.mtcomm.2019.01.008.
| This journal is © The Royal Society of Chemistry 2022 |